Ultrasound Assessment of Hepatic Steatosis by Using the Double Nakagami Distribution: A Feasibility Study


 , ,
, , 
Abstract
1. Introduction
2. Materials and Methods
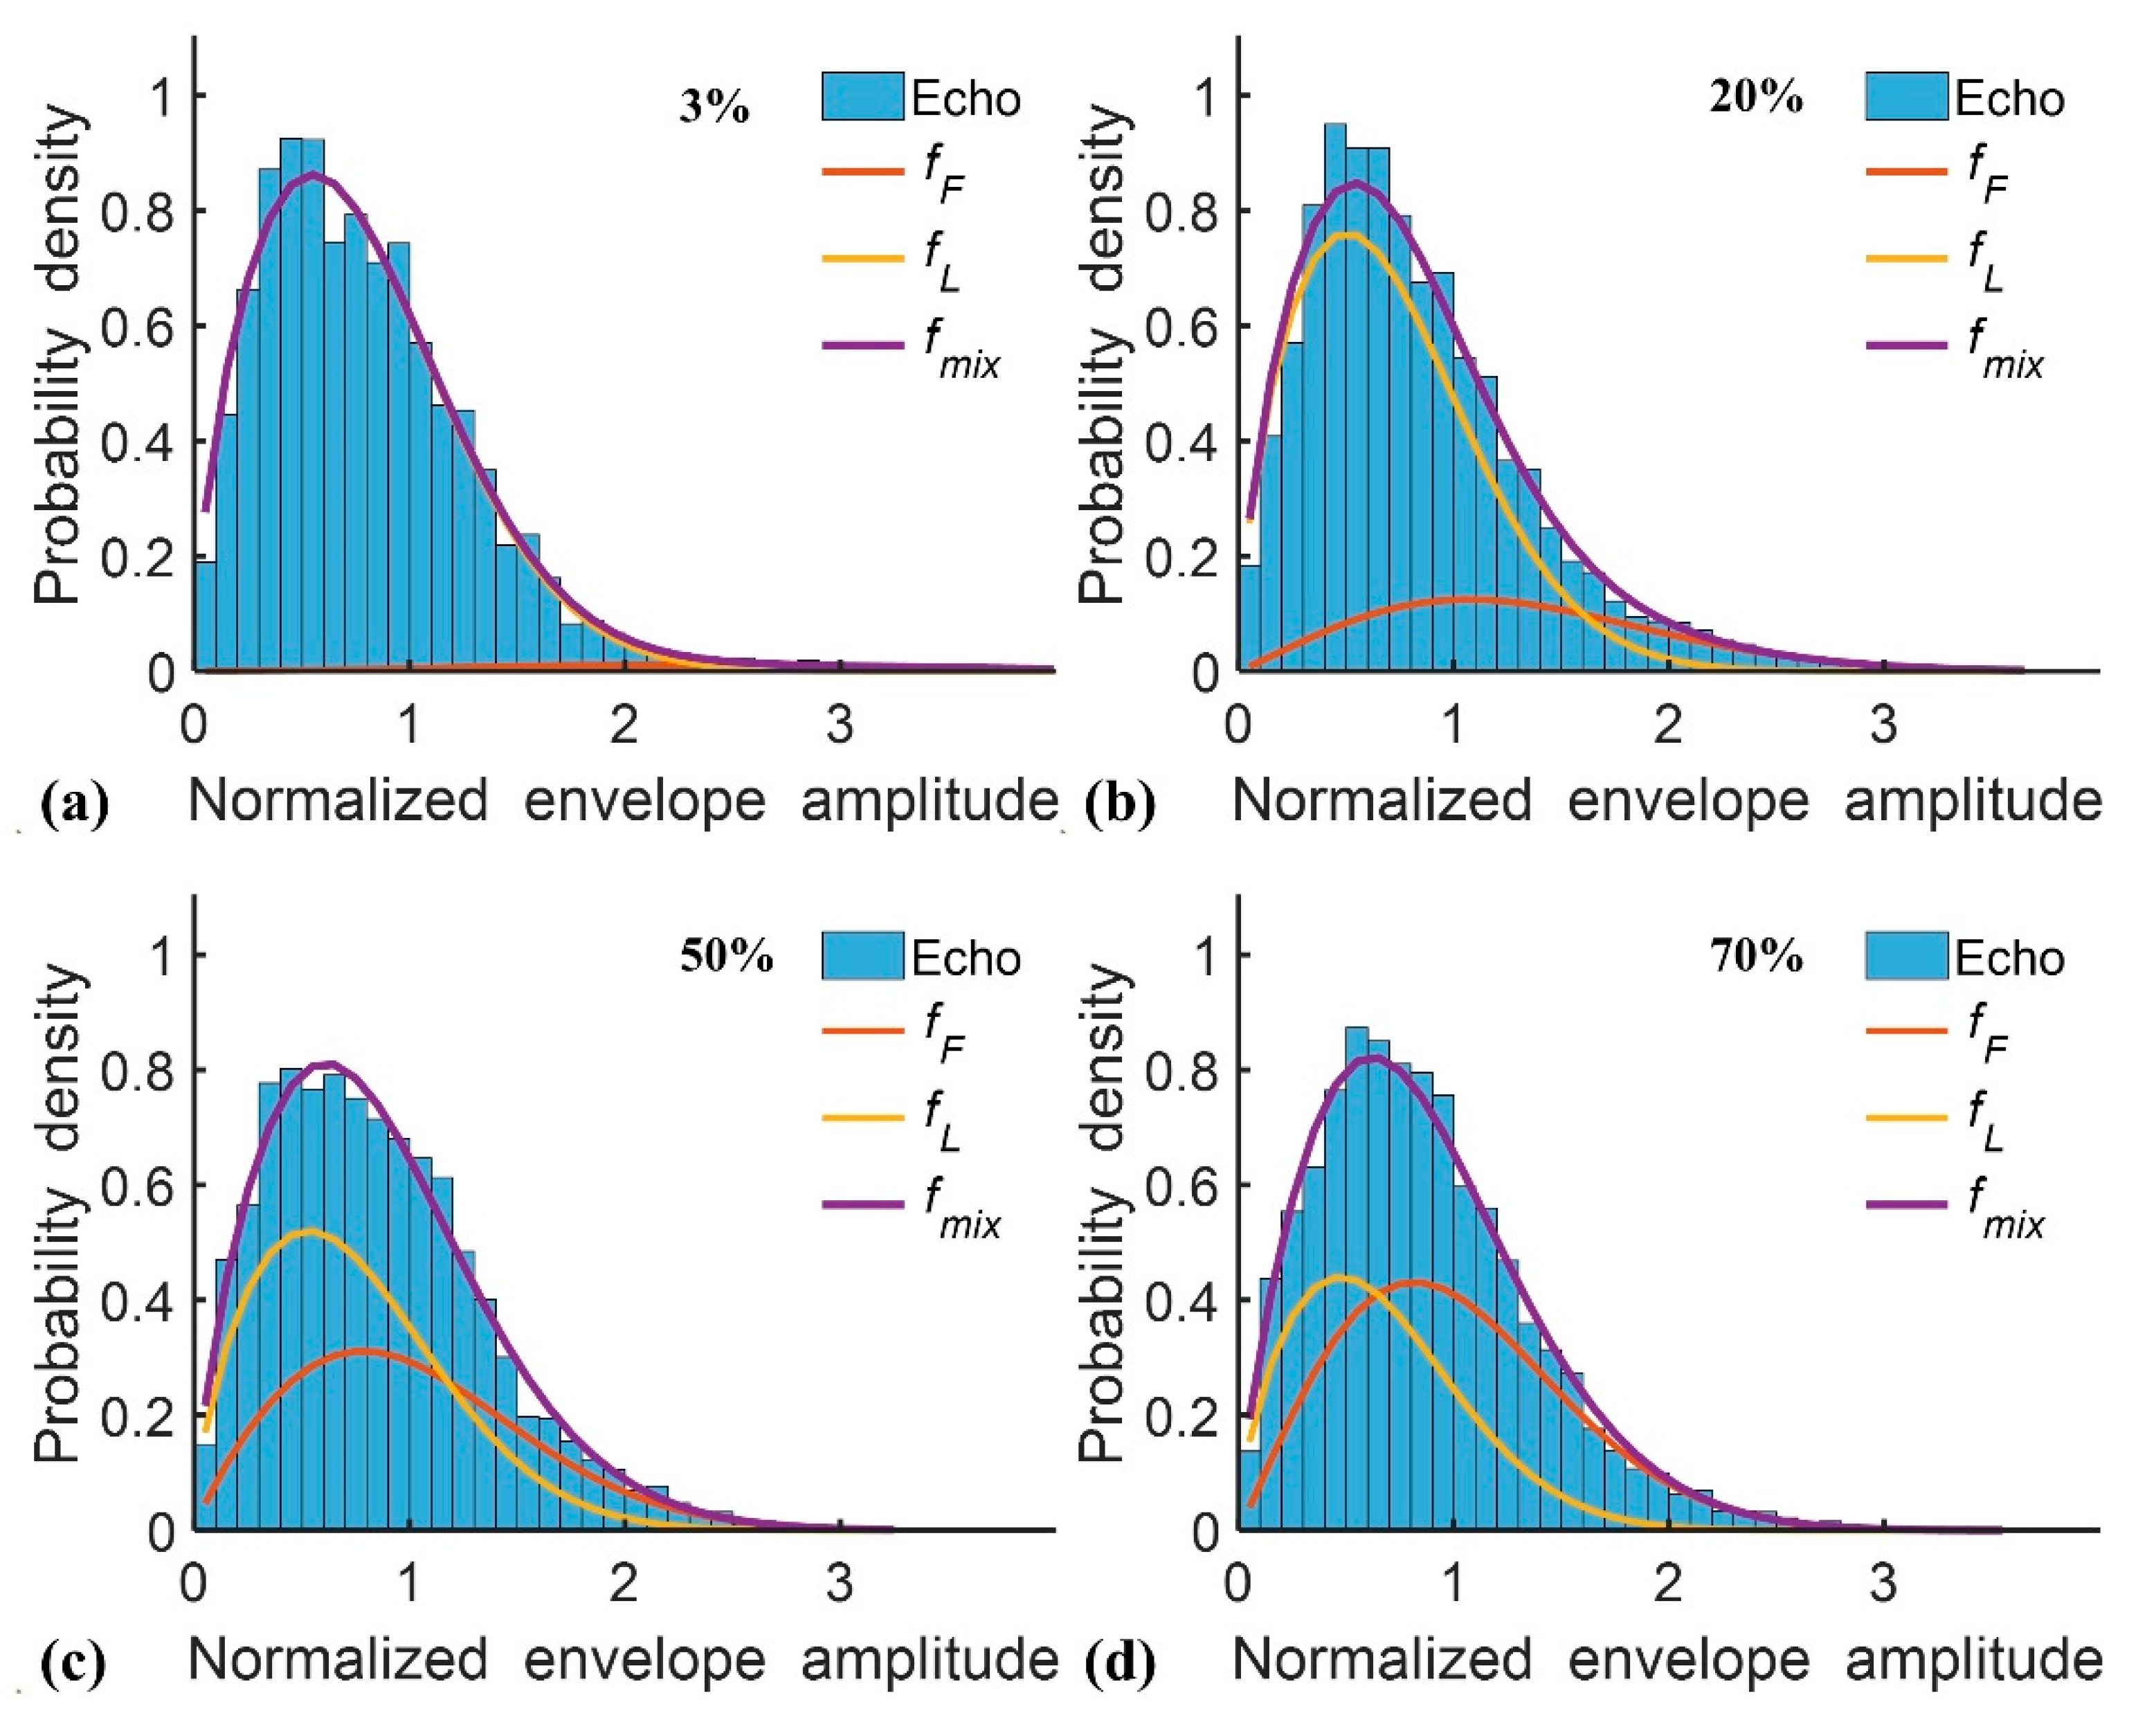
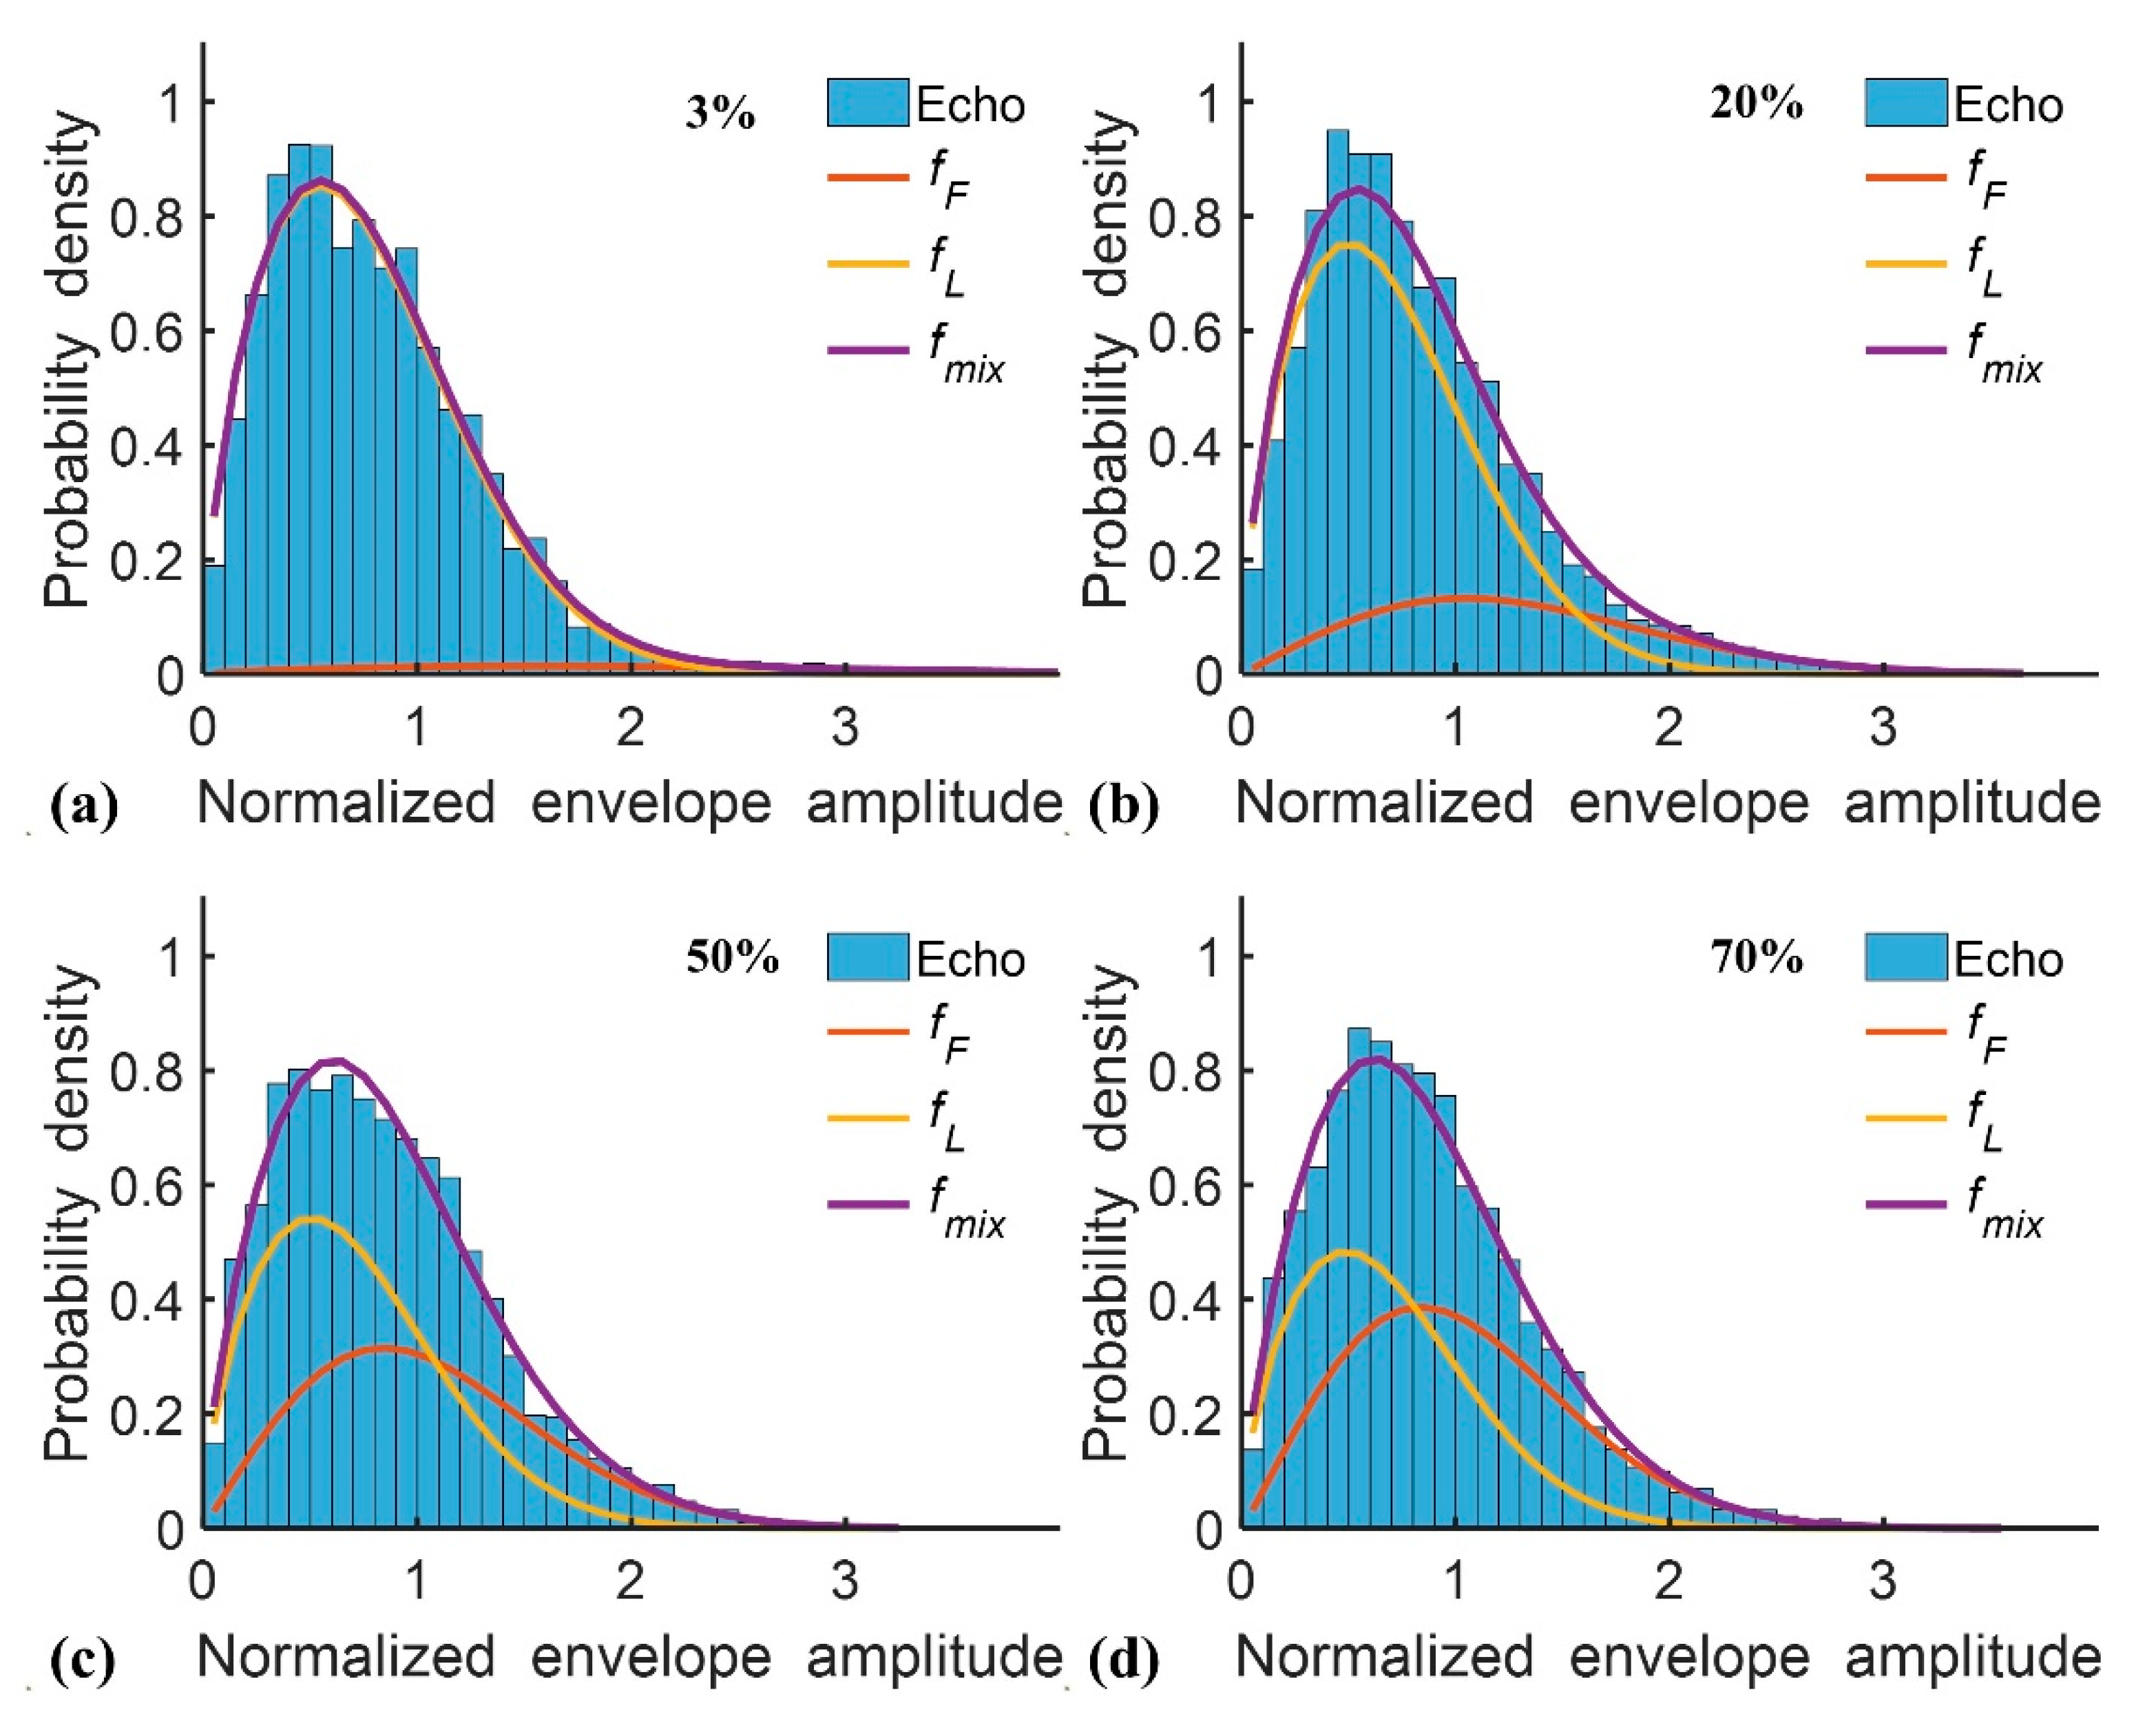
2.1. Double Nakagami Distribution
2.2. Clinical Subjects
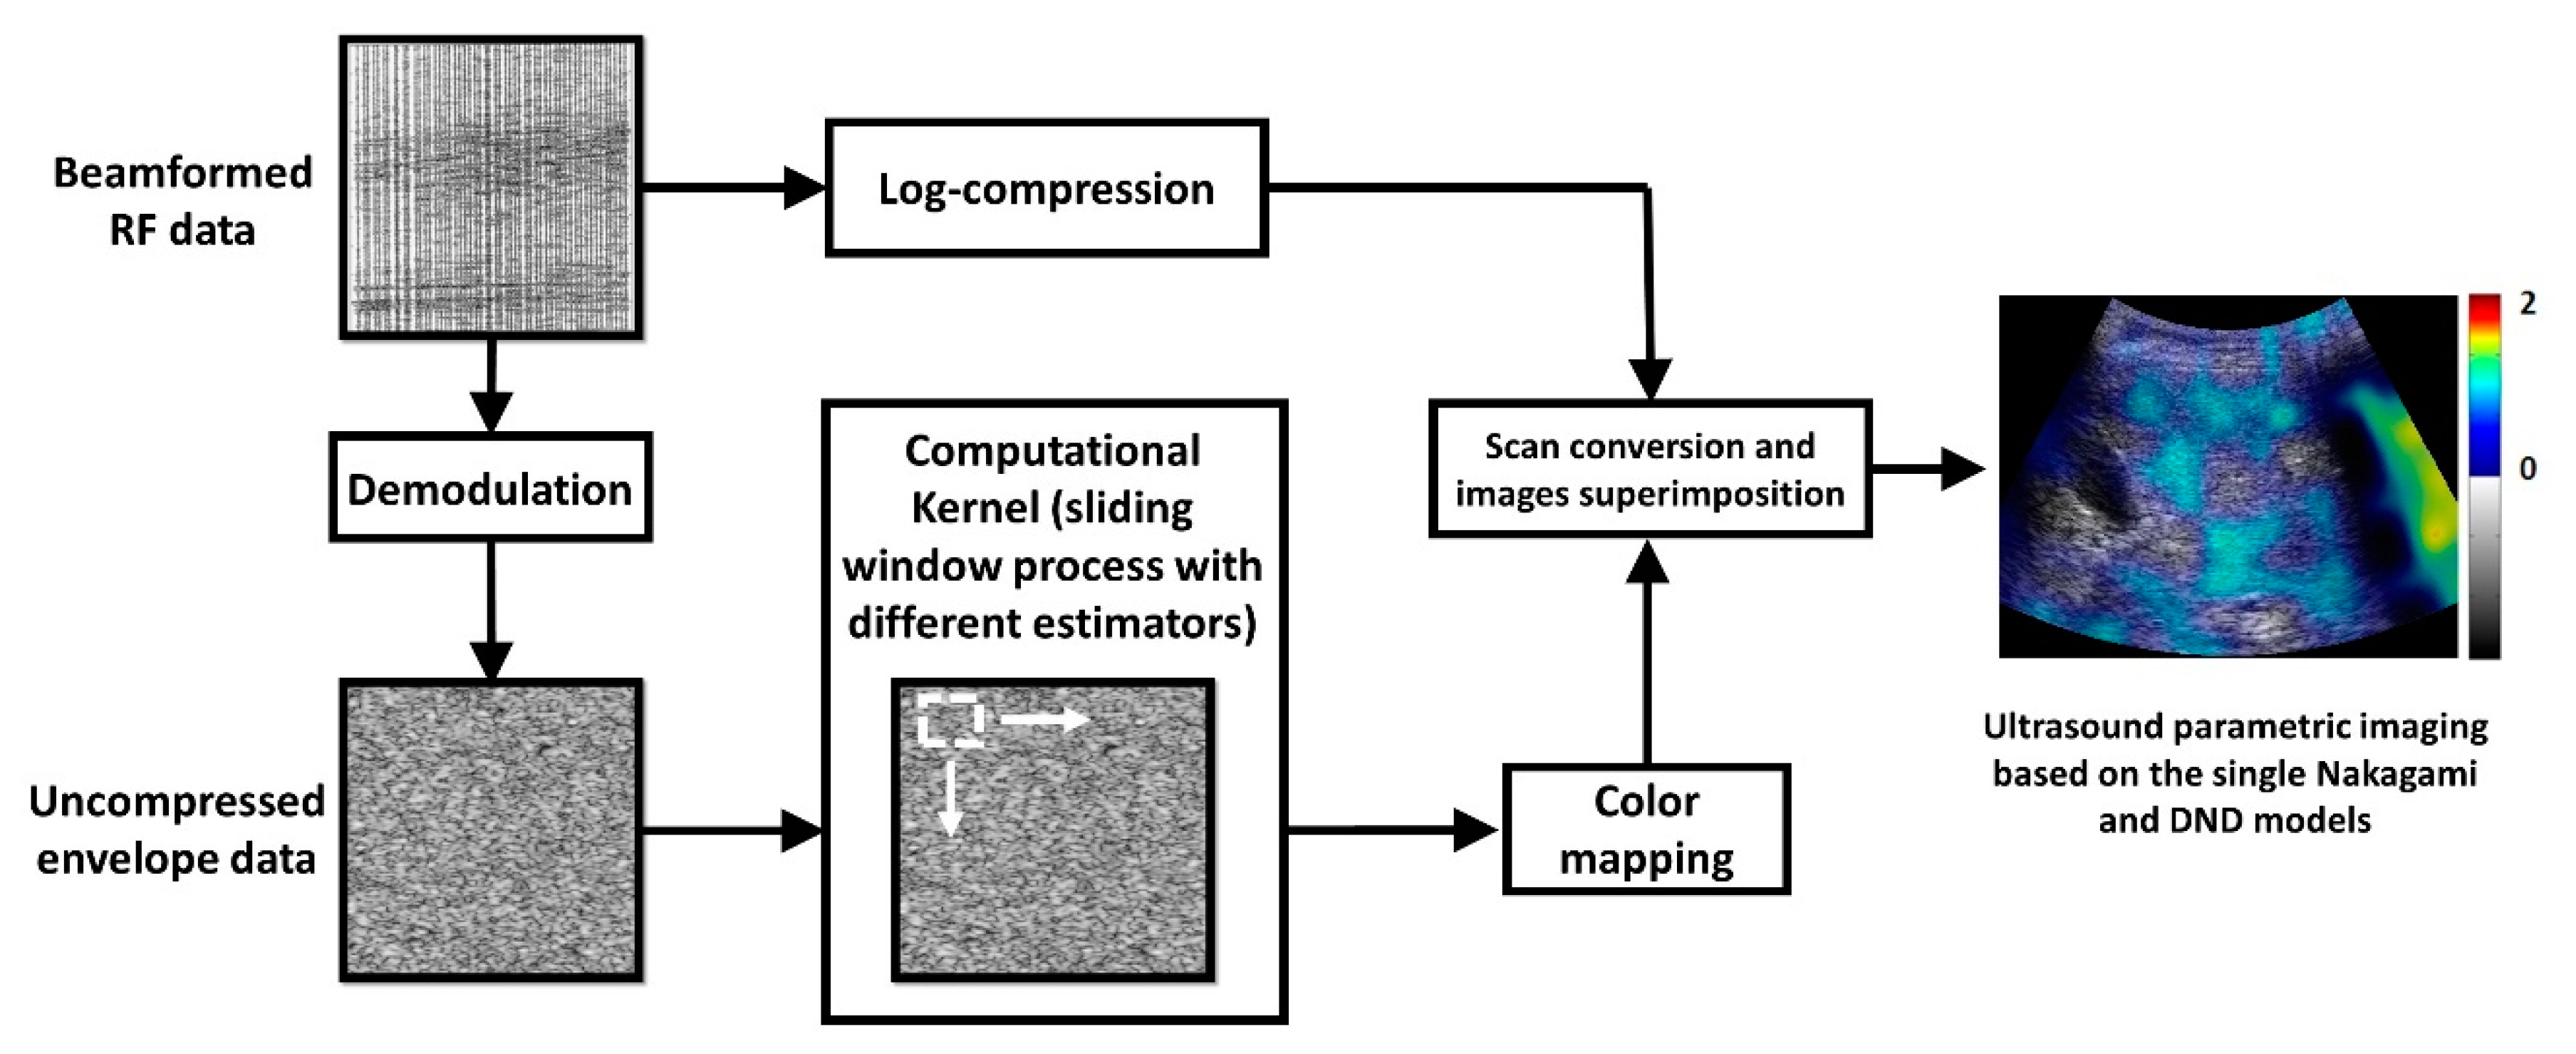
2.3. Ultrasound Data Processing
2.4. Statistical Analysis
3. Results
4. Discussion
4.1. Significance of this Study
4.2. The Dependency of the DND Parameter on Hepatic Steatosis
4.3. Comparisons between the Conventional Nakagami and DND Parameters
4.4. Limitations and Future Work
5. Conclusions
Author Contributions
Funding
Conflicts of Interest
References
- Kawano, Y.; Cohen, D.E. Mechanisms of hepatic triglyceride accumulation in non-alcoholic fatty liver disease. J. Gastroenterol. 2013, 48, 434–441. [Google Scholar] [CrossRef] [PubMed]
- Adams, L.; Angulo, P. Recent concepts in non-alcoholic fatty liver disease. Diabet. Med. 2005, 22, 1129–1133. [Google Scholar] [CrossRef] [PubMed]
- Targher, G.; Day, C.P.; Bonora, E. Risk of cardiovascular disease in patients with nonalcoholic fatty liver disease. N. Engl. J. Med. 2010, 363, 1341–1350. [Google Scholar] [CrossRef] [PubMed]
- Starley, B.Q.; Calcagno, C.J.; Harrison, S.A. Nonalcoholic fatty liver disease and hepatocellular carcinoma: A weighty connection. Hepatology 2010, 51, 1820–1832. [Google Scholar] [CrossRef]
- Vernon, G.; Baranova, A.; Younossi, Z. Systematic review: The epidemiology and natural history of non-alcoholic fatty liver disease and non-alcoholic steatohepatitis in adults. Aliment. Pharmacol. Ther. 2011, 34, 274–285. [Google Scholar] [CrossRef]
- Anstee, Q.M.; Targher, G.; Day, C.P. Progression of NAFLD to diabetes mellitus, cardiovascular disease or cirrhosis. Nat. Rev. Gastroenterol. Hepatol. 2013, 10, 330. [Google Scholar] [CrossRef]
- Kleiner, D.E.; Brunt, E.M.; Van Natta, M.; Behling, C.; Contos, M.J.; Cummings, O.W.; Ferrell, L.D.; Liu, Y.C.; Torbenson, M.S.; Unalp-Arida, A. Design and validation of a histological scoring system for nonalcoholic fatty liver disease. Hepatology 2005, 41, 1313–1321. [Google Scholar] [CrossRef]
- Bravo, A.A.; Sheth, S.G.; Chopra, S. Liver biopsy. N. Engl. J. Med. 2001, 344, 495–500. [Google Scholar] [CrossRef]
- Sumida, Y.; Nakajima, A.; Itoh, Y. Limitations of liver biopsy and non-invasive diagnostic tests for the diagnosis of nonalcoholic fatty liver disease/nonalcoholic steatohepatitis. Worldj. Gastroenterol. 2014, 20, 475. [Google Scholar] [CrossRef]
- Duman, D.G.; Celikel, C.; Tüney, D.; Imeryüz, N.; Avsar, E.; Tözün, N. Computed tomography in nonalcoholic fatty liver disease. Dig. Dis. Sci. 2006, 51, 346–351. [Google Scholar] [CrossRef]
- Mehta, S.R.; Louise Thomas, E.; Patel, N.; Crofton, M.E.; McCarthy, J.; Eliahoo, J.; Morin, S.X.; Fitzpatrick, J.; Durighel, G.; Goldstone, A.P. Proton magnetic resonance spectroscopy and ultrasound for hepatic fat quantification. Hepatol. Res. 2010, 40, 399–406. [Google Scholar] [CrossRef] [PubMed]
- Kramer, H.; Pickhardt, P.J.; Kliewer, M.A.; Hernando, D.; Chen, G.-H.; Zagzebski, J.A.; Reeder, S.B. Accuracy of liver fat quantification with advanced CT, MRI, and ultrasound techniques: Prospective comparison with MR spectroscopy. Am. J. Roentgenol. 2017, 208, 92–100. [Google Scholar] [CrossRef] [PubMed]
- Schwenzer, N.F.; Springer, F.; Schraml, C.; Stefan, N.; Machann, J.; Schick, F. Non-invasive assessment and quantification of liver steatosis by ultrasound, computed tomography and magnetic resonance. J. Hepatol. 2009, 51, 433–445. [Google Scholar] [CrossRef] [PubMed]
- Thijssen, J.M.; Starke, A.; Weijers, G.; Haudum, A.; Herzog, K.; Wohlsein, P.; Rehage, J.; De Korte, C.L. Computer-aided B-mode ultrasound diagnosis of hepatic steatosis: A feasibility study. Ieee Trans. Ultrason. Ferroelectr. Freq. Control. 2008, 55, 1343–1354. [Google Scholar] [CrossRef] [PubMed]
- Palmentieri, B.; De Sio, I.; La Mura, V.; Masarone, M.; Vecchione, R.; Bruno, S.; Torella, R.; Persico, M. The role of bright liver echo pattern on ultrasound B-mode examination in the diagnosis of liver steatosis. Dig. Liver Dis. 2006, 38, 485–489. [Google Scholar] [CrossRef] [PubMed]
- Roldan-Valadez, E.; Favila, R.; Martínez-López, M.; Uribe, M.; Méndez-Sánchez, N. Imaging techniques for assessing hepatic fat content in nonalcoholic fatty liver disease. Ann. Hepatol. 2008, 7, 212–220. [Google Scholar] [CrossRef]
- Mehta, S.R.; Thomas, E.L.; Bell, J.D.; Johnston, D.G.; Taylor-Robinson, S.D. Non-invasive means of measuring hepatic fat content. Worldj. Gastroenterol. 2008, 14, 3476. [Google Scholar] [CrossRef]
- Strauss, S.; Gavish, E.; Gottlieb, P.; Katsnelson, L. Interobserver and intraobserver variability in the sonographic assessment of fatty liver. Am. J. Roentgenol. 2007, 189, W320–W323. [Google Scholar] [CrossRef]
- Zhou, Z.; Wu, W.; Wu, S.; Jia, K.; Tsui, P.-H. A review of ultrasound tissue characterization with mean scatterer spacing. Ultrason. Imaging 2017, 39, 263–282. [Google Scholar] [CrossRef]
- Tsui, P.-H.; Zhou, Z.; Lin, Y.-H.; Hung, C.-M.; Chung, S.-J.; Wan, Y.-L. Effect of ultrasound frequency on the Nakagami statistics of human liver tissues. PLoS ONE 2017, 12, e0181789. [Google Scholar] [CrossRef]
- Oelze, M.L.; Mamou, J. Review of quantitative ultrasound: Envelope statistics and backscatter coefficient imaging and contributions to diagnostic ultrasound. Ieee Trans. Ultrason. Ferroelectr. Freq. Control. 2016, 63, 336–351. [Google Scholar] [CrossRef] [PubMed]
- Mamou, J.; Oelze, M.L. Quantitative Ultrasound in Soft Tissues; Springer: Dordrecht, The Netherlands, 2013. [Google Scholar]
- Ho, M.-C.; Lee, Y.-H.; Jeng, Y.-M.; Chen, C.-N.; Chang, K.-J.; Tsui, P.-H. Relationship between ultrasound backscattered statistics and the concentration of fatty droplets in livers: An animal study. PLoS ONE 2013, 8, e63543. [Google Scholar] [CrossRef] [PubMed]
- Wan, Y.-L.; Tai, D.-I.; Ma, H.-Y.; Chiang, B.-H.; Chen, C.-K.; Tsui, P.-H. Effects of fatty infiltration in human livers on the backscattered statistics of ultrasound imaging. Proc. Inst. Mech. Eng. Part. H J. Eng. Med. 2015, 229, 419–428. [Google Scholar] [CrossRef] [PubMed]
- Zhou, Z.; Tai, D.-I.; Wan, Y.-L.; Tseng, J.-H.; Lin, Y.-R.; Wu, S.; Yang, K.-C.; Liao, Y.-Y.; Yeh, C.-K.; Tsui, P.-H. Hepatic steatosis assessment with ultrasound small-window entropy imaging. Ultrasound Med. Biol. 2018, 44, 1327–1340. [Google Scholar] [CrossRef]
- Tamura, K.; Yoshida, K.; Maruyama, H.; Hachiya, H.; Yamaguchi, T. Proposal of compound amplitude envelope statistical analysis model considering low scatterer concentration. Jpn. J. Appl. Phys. 2018, 57, 07LD19. [Google Scholar] [CrossRef]
- Lin, Y.H.; Wan, Y.L.; Tai, D.I.; Tseng, J.H.; Wang, C.Y.; Tsai, Y.W.; Lin, Y.R.; Chang, T.Y.; Tsui, P.H. Considerations of ultrasound scanning approaches in nonalcoholic fatty liver disease assessment through acoustic structure quantification. Ultrasound Med. Biol. 2019, 45, 1955–1969. [Google Scholar] [CrossRef]
- Lin, J.-J.; Cheng, J.-Y.; Huang, L.-F.; Lin, Y.-H.; Wan, Y.-L.; Tsui, P.-H. Detecting changes in ultrasound backscattered statistics by using Nakagami parameters: Comparisons of moment-based and maximum likelihood estimators. Ultrasonics 2017, 77, 133–143. [Google Scholar] [CrossRef]
- Tsui, P.-H.; Chen, C.-K.; Kuo, W.-H.; Chang, K.-J.; Fang, J.; Ma, H.-Y.; Chou, D. Small-window parametric imaging based on information entropy for ultrasound tissue characterization. Sci. Rep. 2017, 7, 1–17. [Google Scholar]
- Tsui, P.-H.; Wan, Y.-L.; Tai, D.-I.; Shu, Y.-C. Effects of estimators on ultrasound Nakagami imaging in visualizing the change in the backscattered statistics from a Rayleigh distribution to a pre-Rayleigh distribution. Ultrasound Med. Biol. 2015, 41, 2240–2251. [Google Scholar] [CrossRef]
- Brunt, E.M.; Janney, C.G.; Di Bisceglie, A.M.; Neuschwander-Tetri, B.A.; Bacon, B.R. Nonalcoholic steatohepatitis: A proposal for grading and staging the histological lesions. Am. J. Gastroenterol. 1999, 94, 2467–2474. [Google Scholar] [CrossRef]
- Goodman, Z.D. Grading and staging systems for inflammation and fibrosis in chronic liver diseases. J. Hepatol 2007, 47, 598–607. [Google Scholar] [CrossRef] [PubMed]


| Characteristics | Value |
|---|---|
| Male/Female | 129/75 |
| Age, years | |
| Mean ± standard deviation (range) | 57.75 ± 11.08 (31–81) |
| Median | 58 |
| BMI, kg/m2 | |
| Mean ± standard deviation (range) | 25.38± 3.91 (16.82–37.83) |
| Median | 24.91 |
| AST, U/L | |
| Mean ± standard deviation (range) | 67.39 ± 68.04 (15–507) |
| Median | 46 |
| ALT, U/L | |
| Mean ± standard deviation (range) | 87.64 ± 99.33 (8–595) |
| Median | 53 |
| Histological grade, no. of patients | |
| Normal | 80 |
| Mild | 70 |
| Moderate | 36 |
| Severe | 18 |
| Metavir score, no. of patients | |
| F0 | 16 |
| F1 | 40 |
| F2 | 46 |
| F3 | 61 |
| F4 | 41 |
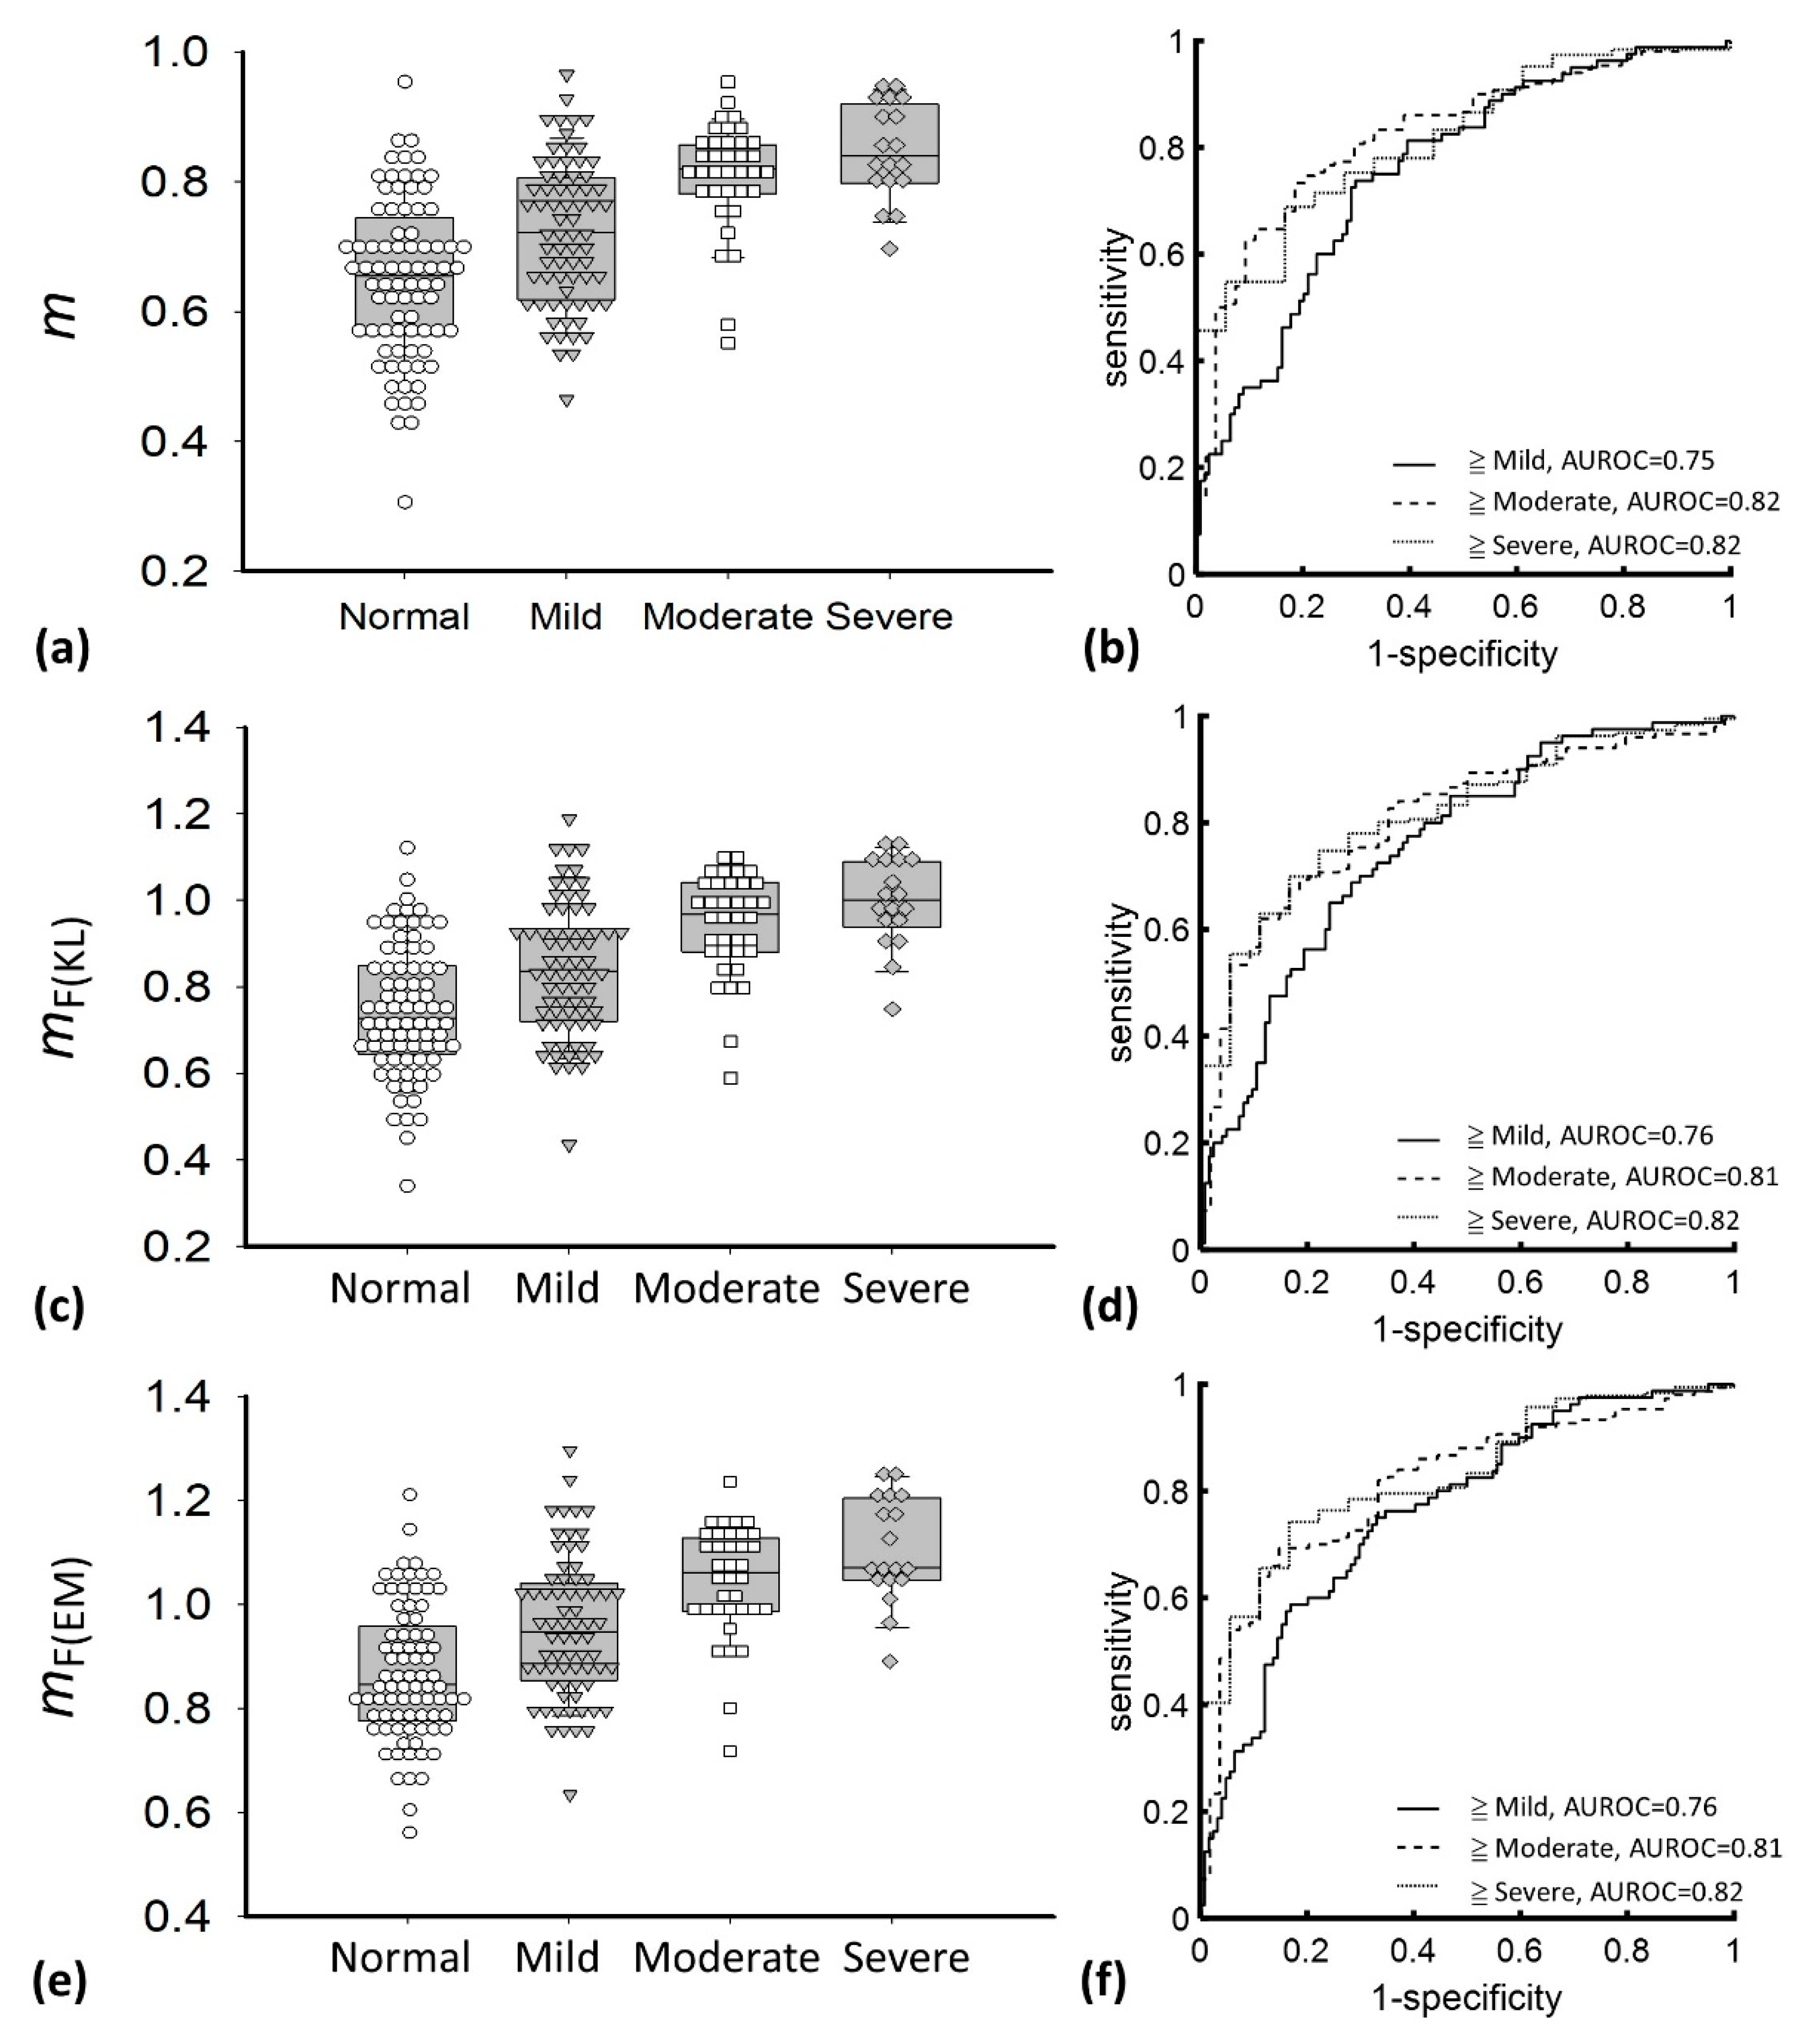
| Parameter | m | mF(KL) | mF(EM) | ||||||
|---|---|---|---|---|---|---|---|---|---|
| ≥ Mild | ≥ Moderate | ≥ Severe | ≥ Mild | ≥ Moderate | ≥ Severe | ≥ Mild | ≥ Moderate | ≥ Severe | |
| Cutoff value | 0.71 | 0.77 | 0.79 | 0.80 | 0.88 | 0.94 | 0.96 | 1.03 | 1.04 |
| Sensitivity, % | 73.75 | 73.33 | 68.82 | 68.75 | 69.33 | 74.73 | 68.75 | 71.33 | 68.28 |
| Specificity, % | 70.16 | 81.18 | 83.33 | 71.77 | 81.48 | 77.78 | 75 | 77.78 | 83.33 |
| LR+ | 2.47 | 3.96 | 4.13 | 2.44 | 3.74 | 3.36 | 2.75 | 3.21 | 4.10 |
| LR− | 0.37 | 0.33 | 0.37 | 0.44 | 0.38 | 0.32 | 0.42 | 0.37 | 0.38 |
| PPV, % | 61.46 | 91.67 | 97.71 | 61.11 | 91.23 | 97.20 | 63.95 | 89.92 | 97.69 |
| NPV, % | 80.56 | 52.38 | 20.55 | 78.07 | 48.89 | 22.95 | 78.81 | 49.41 | 20.27 |
| AUROC (95% CI) | 0.75 (0.69–0.83) | 0.82 (0.77–0.88) | 0.82 (0.74–0.90) | 0.76 (0.69–0.83) | 0.81 (0.75–0.87) | 0.82 (0.74–0.90) | 0.76 (0.69–0.83) | 0.81 (0.75–0.87) | 0.82 (0.74–0.90) |
© 2020 by the authors. Licensee MDPI, Basel, Switzerland. This article is an open access article distributed under the terms and conditions of the Creative Commons Attribution (CC BY) license (http://creativecommons.org/licenses/by/4.0/).
Share and Cite
Fang, F.; Fang, J.; Li, Q.; Tai, D.-I.; Wan, Y.-L.; Tamura, K.; Yamaguchi, T.; Tsui, P.-H. Ultrasound Assessment of Hepatic Steatosis by Using the Double Nakagami Distribution: A Feasibility Study. Diagnostics 2020, 10, 557. https://doi.org/10.3390/diagnostics10080557
Fang F, Fang J, Li Q, Tai D-I, Wan Y-L, Tamura K, Yamaguchi T, Tsui P-H. Ultrasound Assessment of Hepatic Steatosis by Using the Double Nakagami Distribution: A Feasibility Study. Diagnostics. 2020; 10(8):557. https://doi.org/10.3390/diagnostics10080557
Chicago/Turabian StyleFang, Feng, Jui Fang, Qiang Li, Dar-In Tai, Yung-Liang Wan, Kazuki Tamura, Tadashi Yamaguchi, and Po-Hsiang Tsui. 2020. "Ultrasound Assessment of Hepatic Steatosis by Using the Double Nakagami Distribution: A Feasibility Study" Diagnostics 10, no. 8: 557. https://doi.org/10.3390/diagnostics10080557
APA StyleFang, F., Fang, J., Li, Q., Tai, D.-I., Wan, Y.-L., Tamura, K., Yamaguchi, T., & Tsui, P.-H. (2020). Ultrasound Assessment of Hepatic Steatosis by Using the Double Nakagami Distribution: A Feasibility Study. Diagnostics, 10(8), 557. https://doi.org/10.3390/diagnostics10080557