Accuracy of a Semi-Quantitative Ultrasound Method to Determine Liver Fat Infiltration in Early Adulthood


 ,
,
Abstract
1. Introduction
2. Materials and Methods
2.1. Participants and Study Design
2.2. Measurements
2.2.1. Anthropometric Assessments
2.2.2. Cardiometabolic Assessment
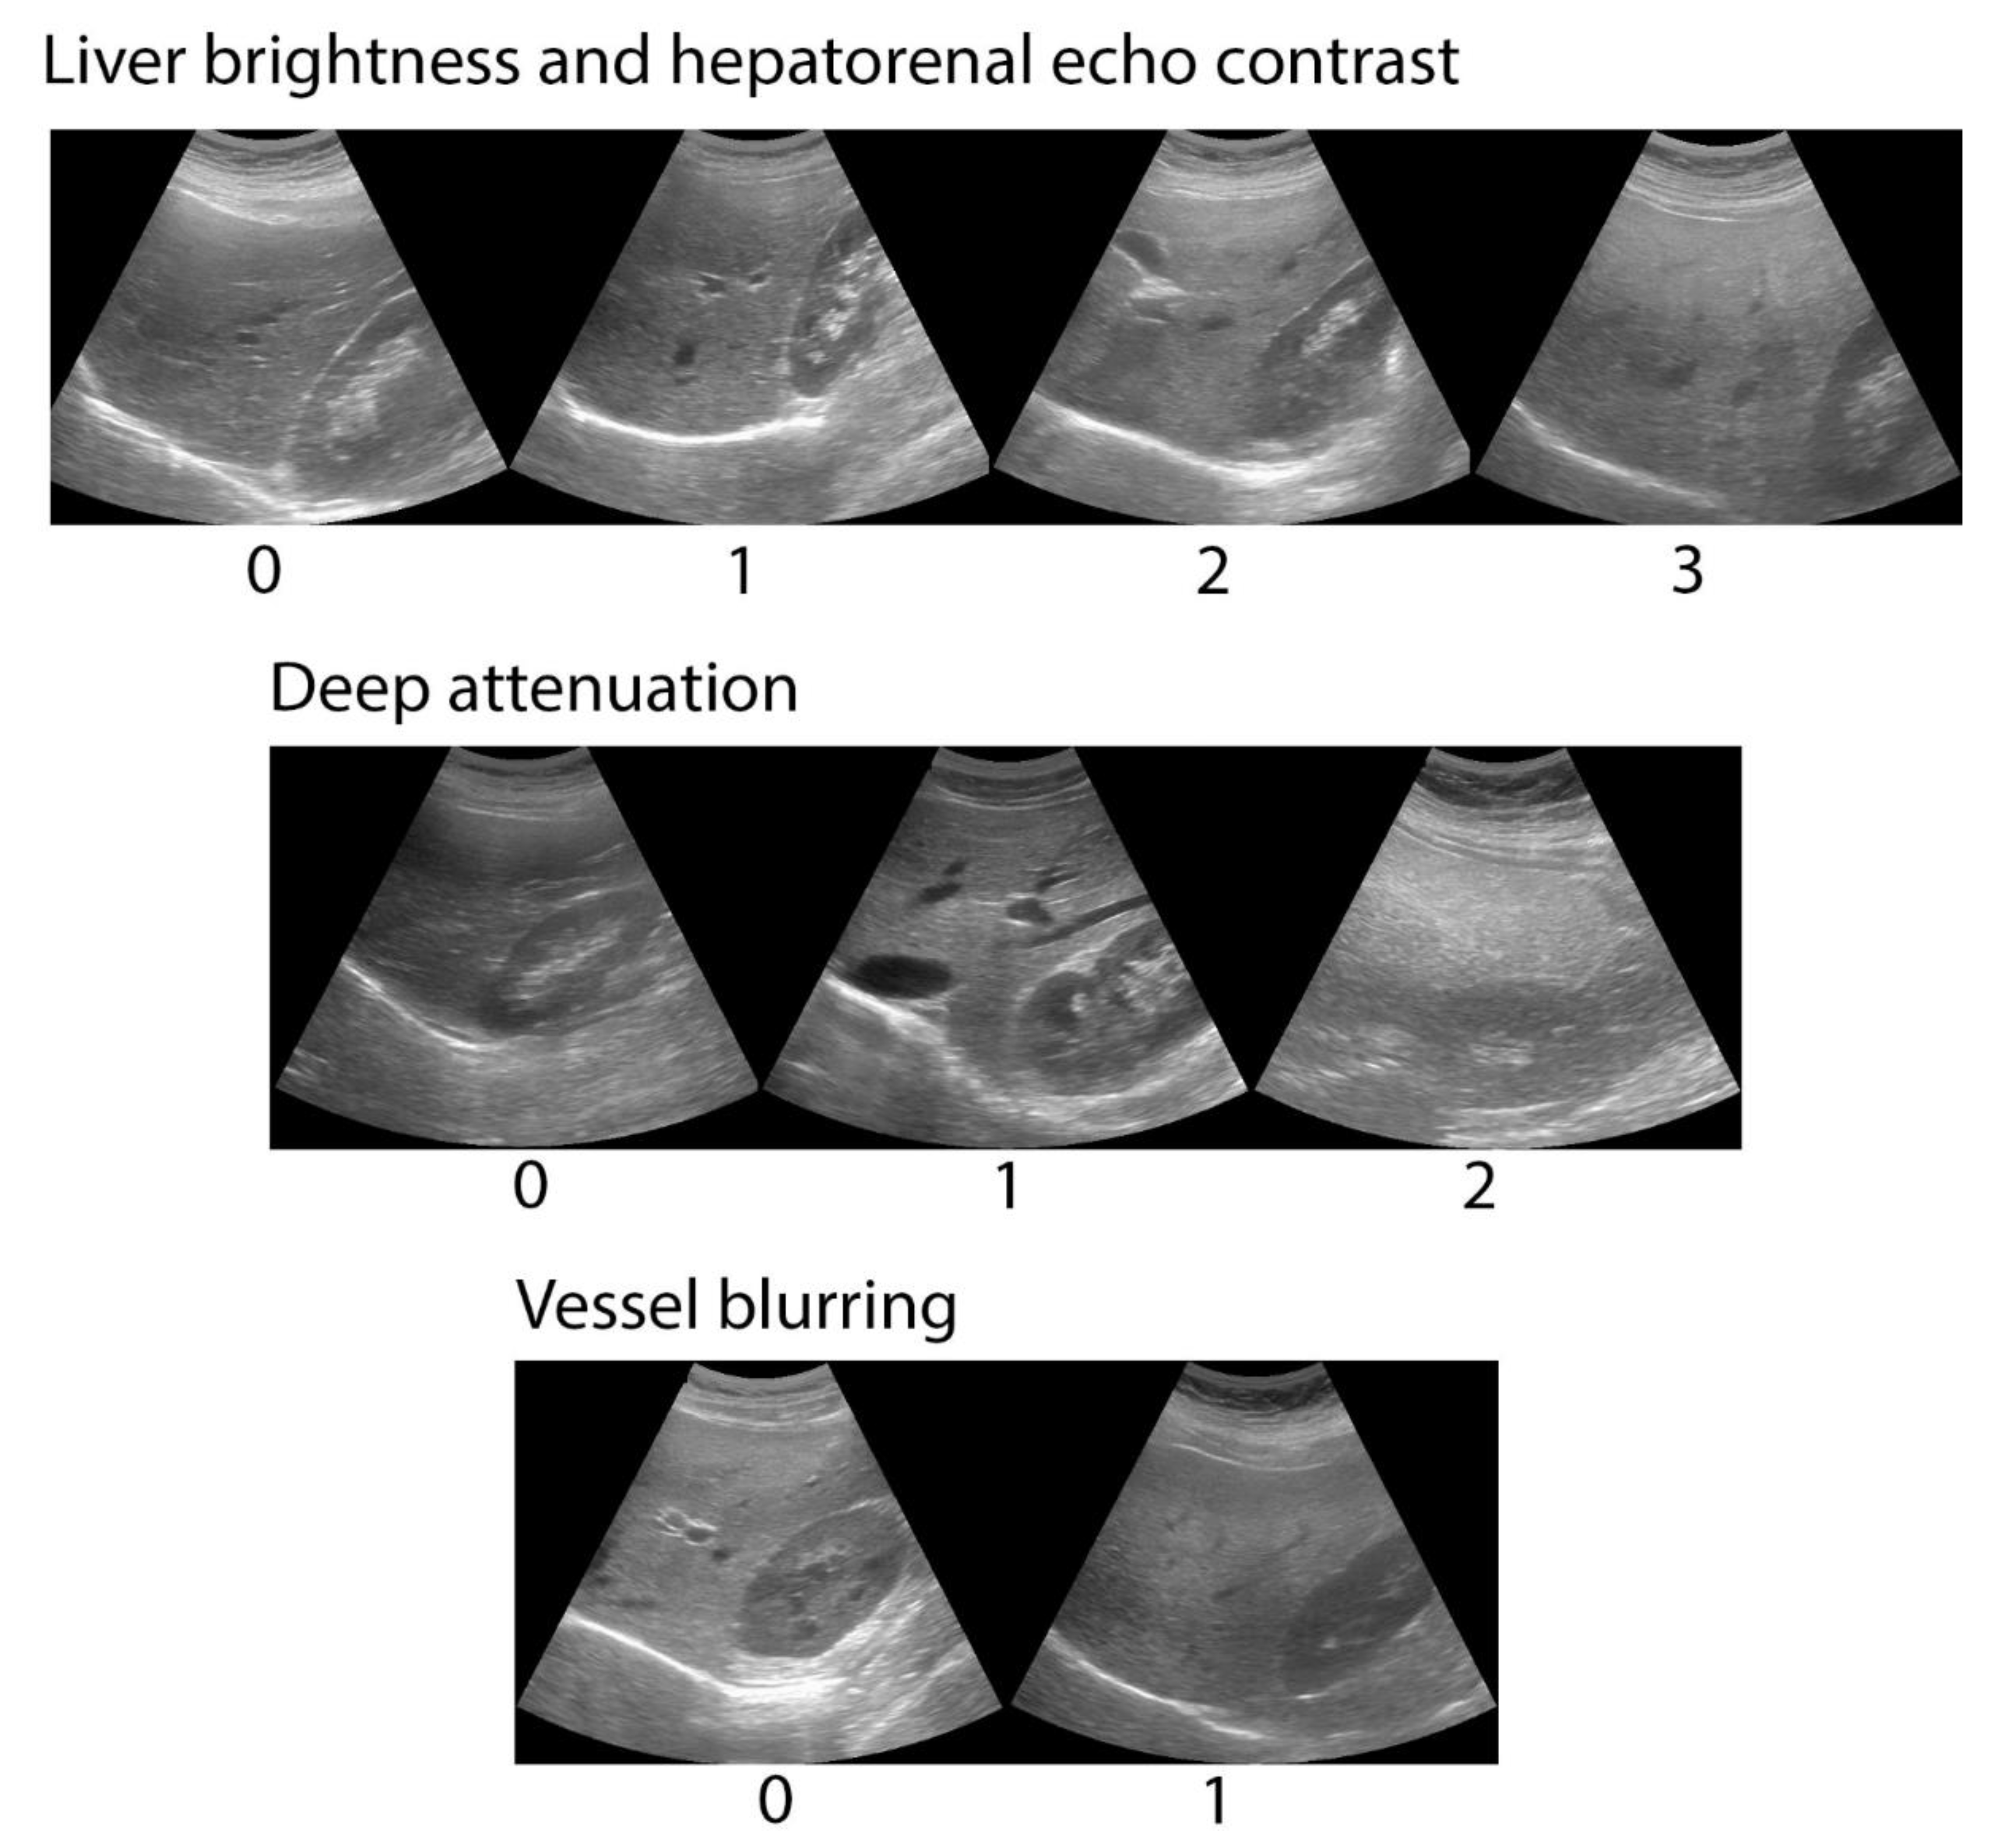
2.2.3. Abdominal Ultrasound
2.2.4. Magnetic Resonance Spectroscopy
2.3. Data Analysis
2.3.1. Clinical Validity
2.3.2. Analytical Validity
3. Results
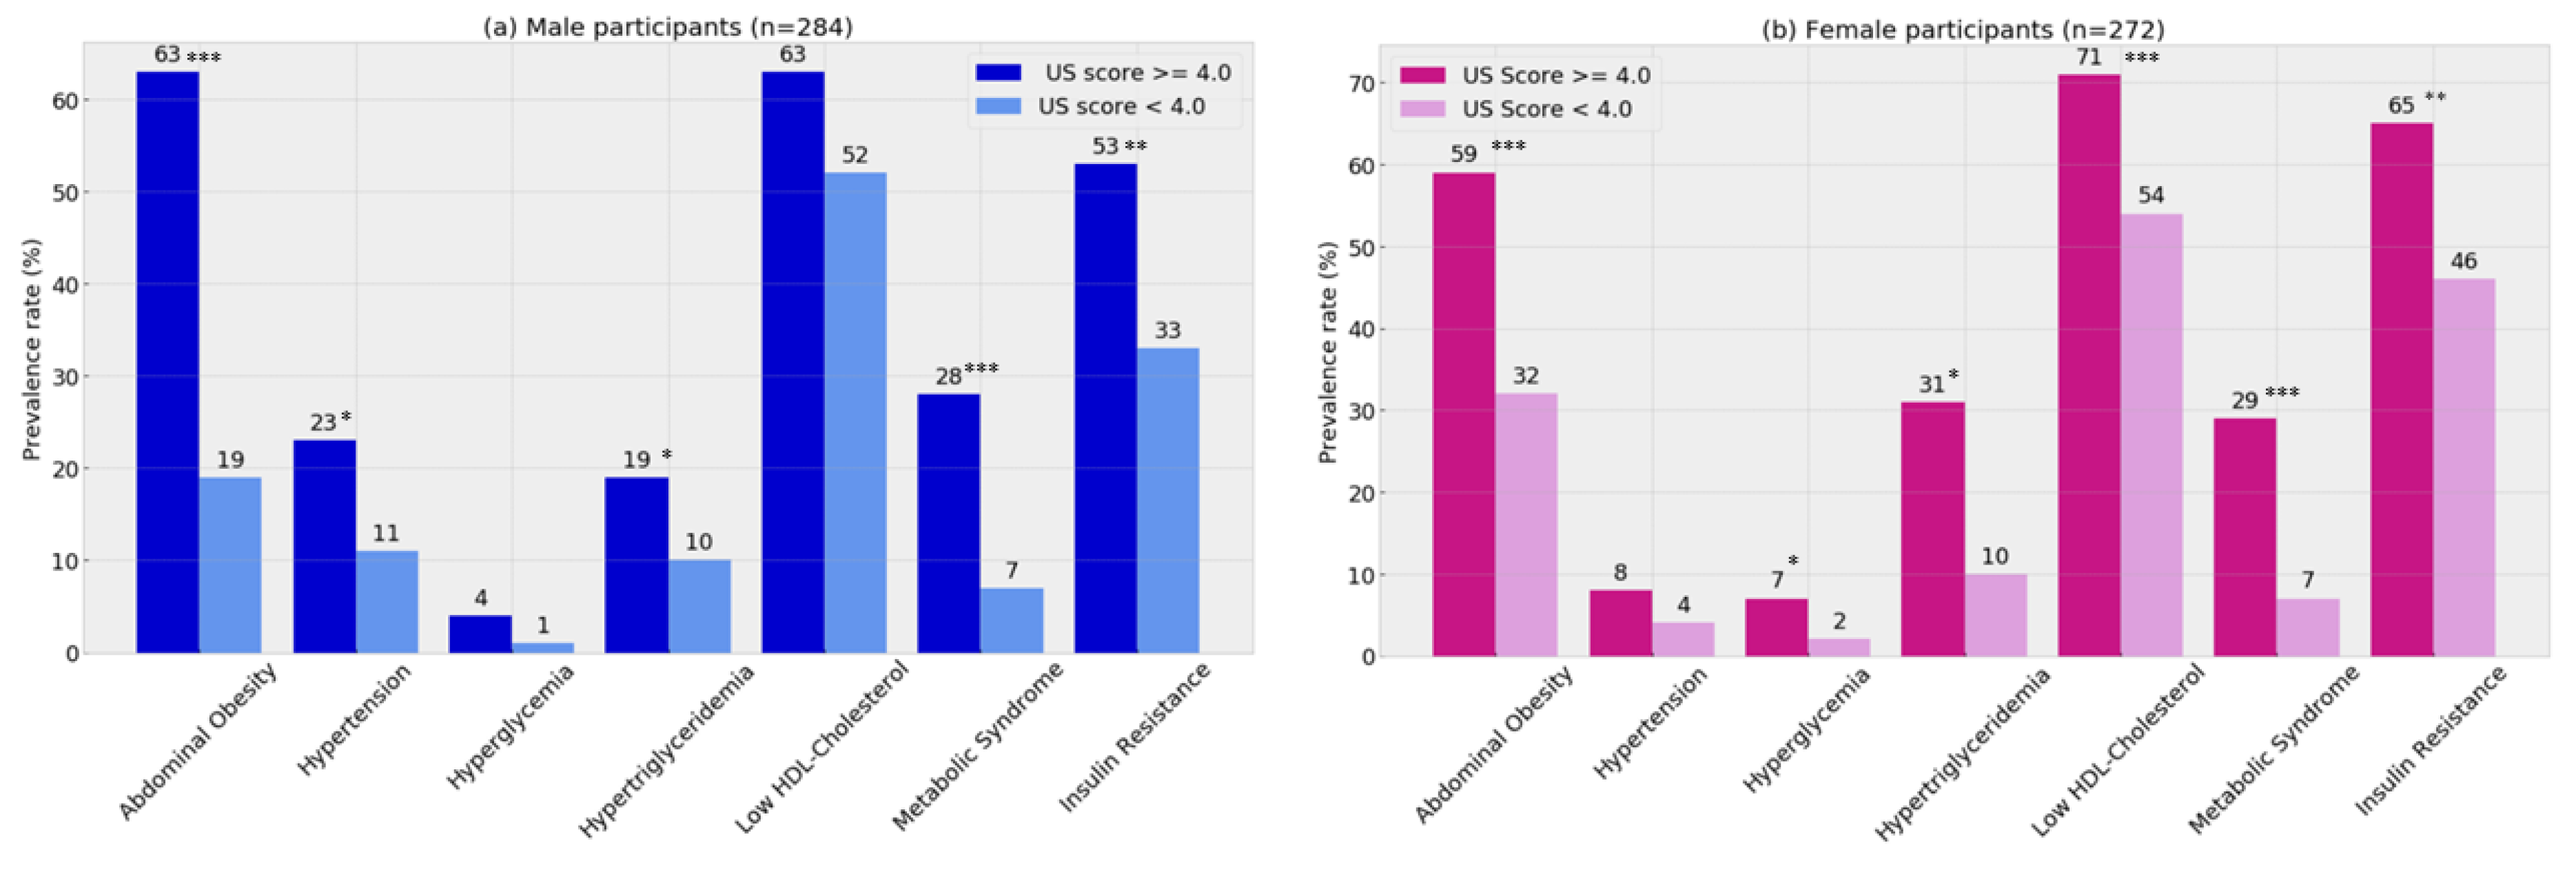
3.1. Clinical Validity
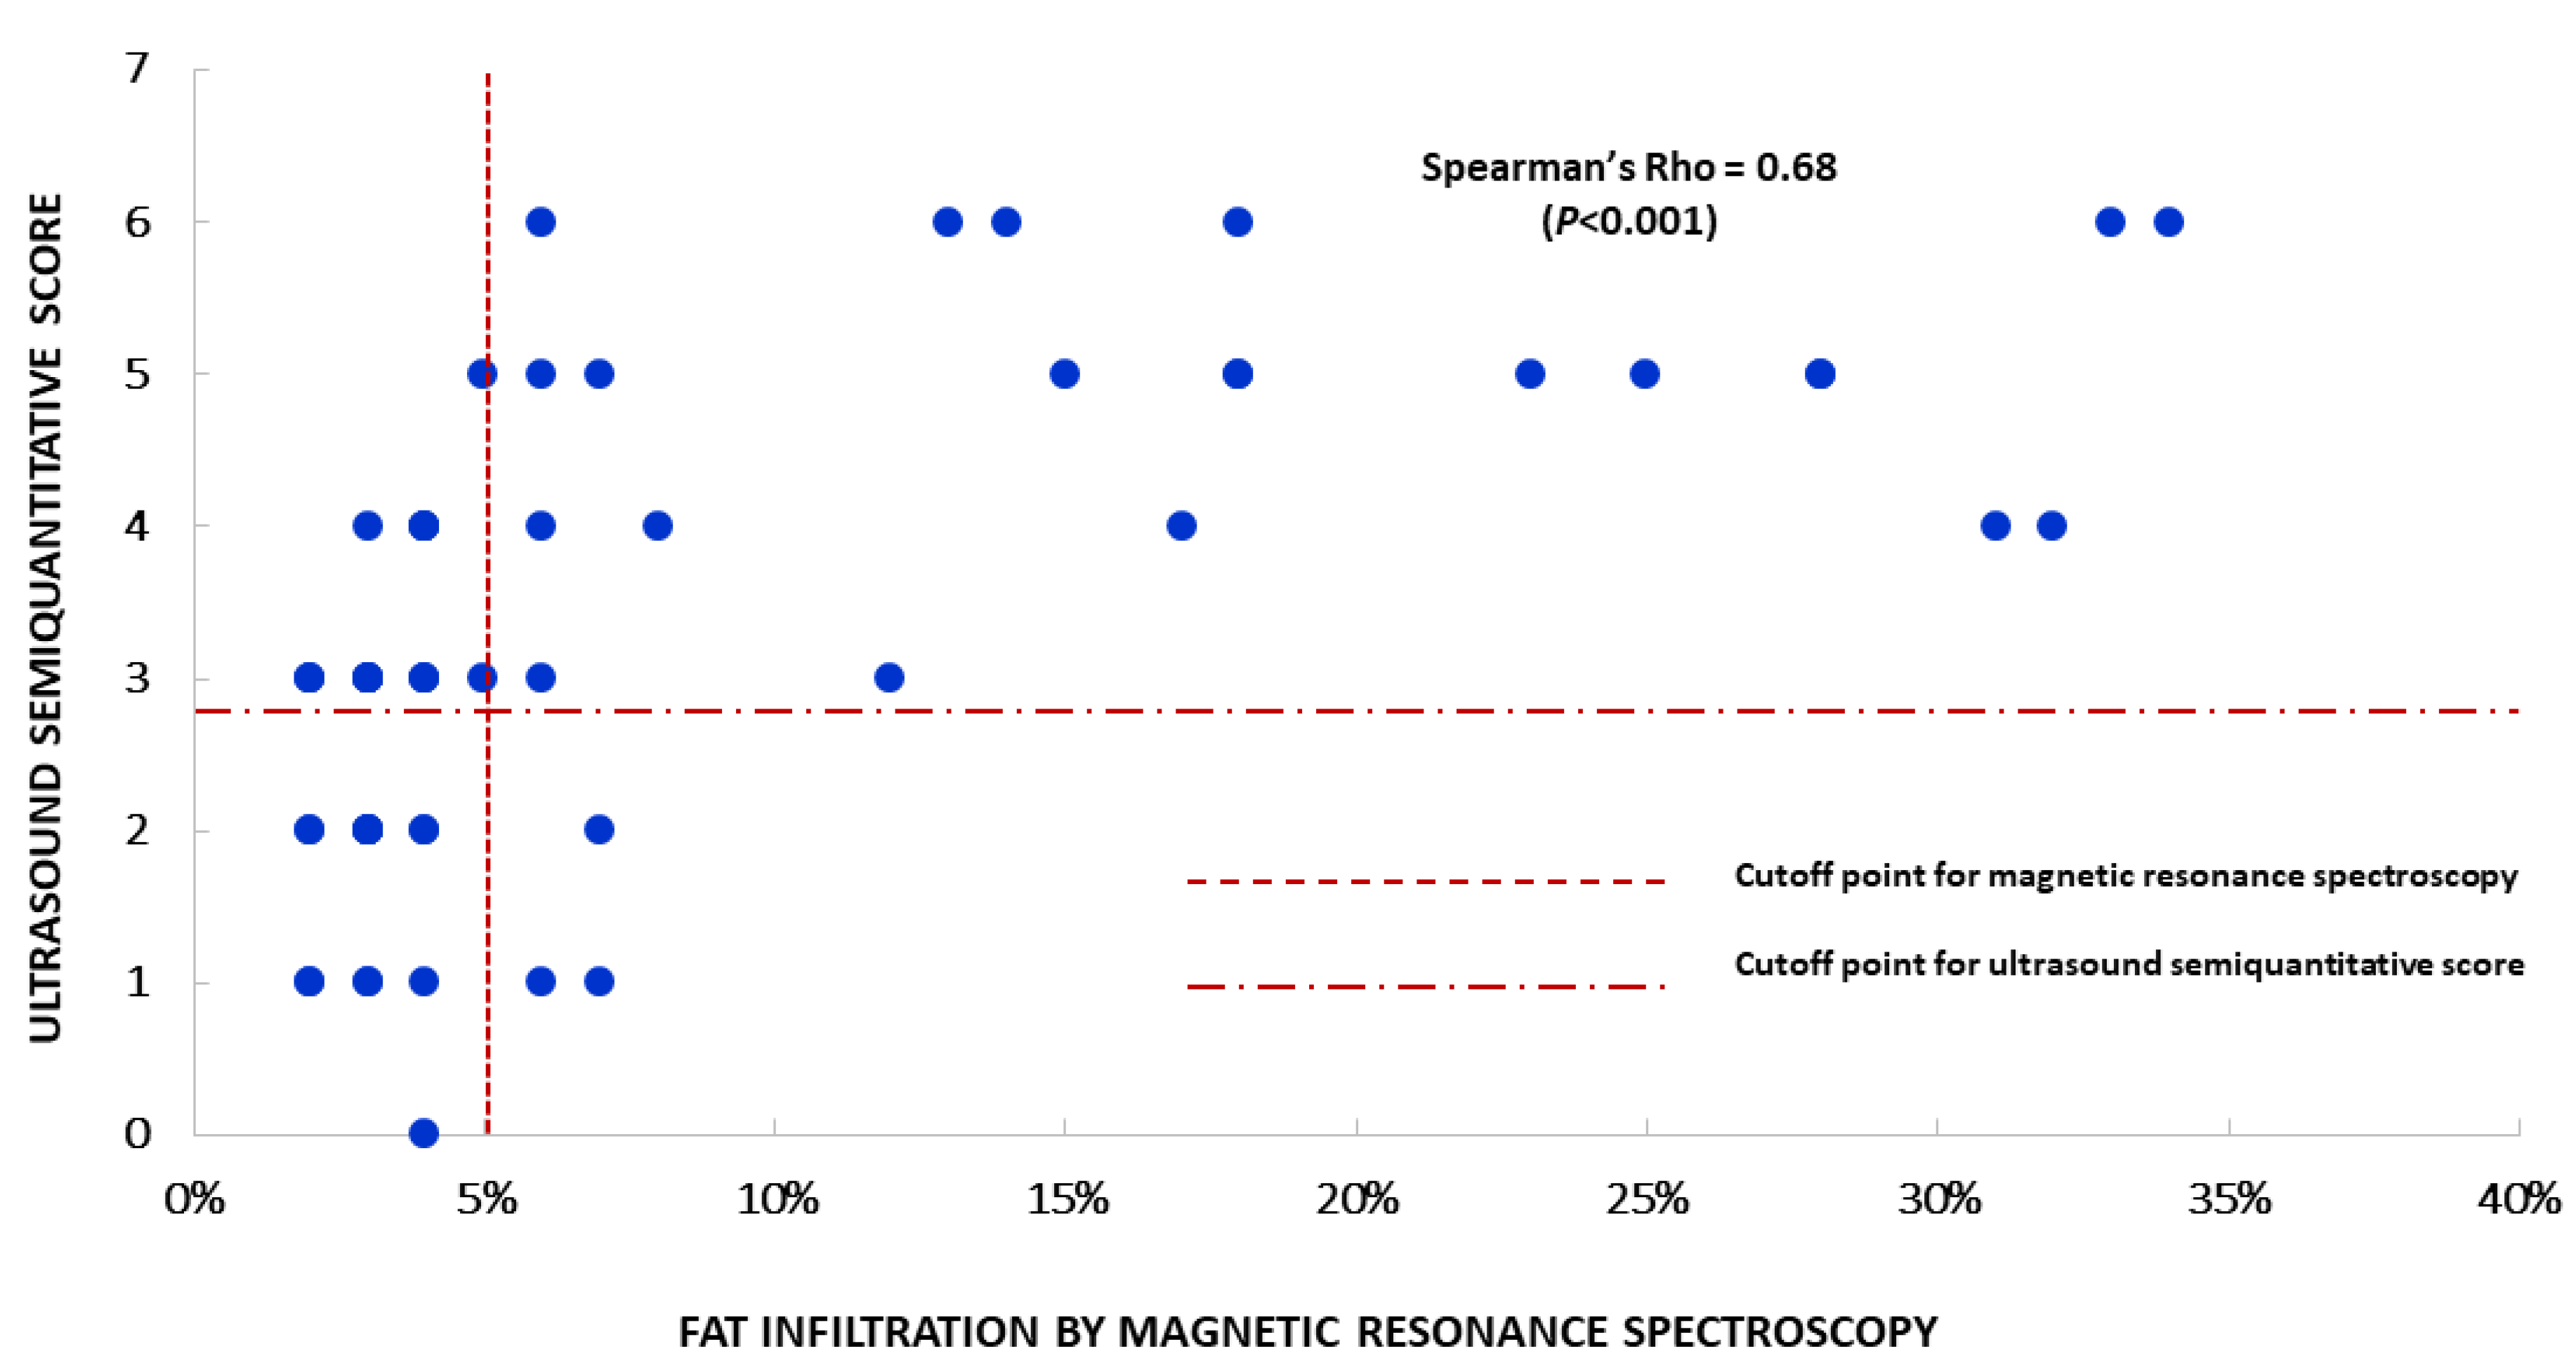
3.2. Analytical Validity
4. Discussion
4.1. Main Findings
4.2. Implications for Practice
4.3. Study Limitations
5. Conclusions
Author Contributions
Funding
Conflicts of Interest
References
- Bellentani, S.; Scaglioni, F.; Marino, M.; Bedogni, G. Epidemiology of Non-Alcoholic Fatty Liver Disease. Dig. Dis. 2010, 28, 155–161. [Google Scholar] [CrossRef] [PubMed]
- Younossi, Z.; Anstee, Q.M.; Marietti, M.; Hardy, T.; Henry, L.; Eslam, M.; George, J.; Bugianesi, E. Global burden of NAFLD and NASH: Trends, predictions, risk factors and prevention. Nat. Rev. Gastroenterol. Hepatol. 2017, 15, 11–20. [Google Scholar] [CrossRef]
- Riquelme, A.; Arrese, M.; Soza, A.; Morales, A.; Baudrand, R.; Pérez-Ayuso, R.M.; González, R.; Álvarez, M.; Hernández, V.; García-Zattera, M.J.; et al. Non-alcoholic fatty liver disease and its association with obesity, insulin resistance and increased serum levels of C-reactive protein in Hispanics. Liver Int. 2009, 29, 82–88. [Google Scholar] [CrossRef] [PubMed]
- Encuesta Nacional de Salud 2016–2017. Resultados Preliminares; Departamento de Epidemiología, Ministerio de Salud: Santiago, Chile, 2017; Available online: https://www.minsal.cl/wp-content/uploads/2017/11/ENS-2016-17_PRIMEROS-RESULTADOS.pdf (accessed on 6 May 2020).
- Mahady, S.; Adams, L.A. Burden of non-alcoholic fatty liver disease in Australia. J. Gastroenterol. Hepatol. 2018, 33, 1–11. [Google Scholar] [CrossRef] [PubMed]
- Doycheva, I.; Watt, K.D.; Alkhouri, N. Nonalcoholic fatty liver disease in adolescents and young adults: The next frontier in the epidemic. Hepatology 2017, 65, 2100–2109. [Google Scholar] [CrossRef] [PubMed]
- Styne, D.M.; Arslanian, S.A.; Connor, E.L.; Farooqi, I.S.; Murad, M.H.; Silverstein, J.H.; Yanovski, J.A. Pediatric Obesity-Assessment, Treatment, and Prevention: An Endocrine Society Clinical Practice Guideline. J. Clin. Endocrinol. Metab. 2017, 102, 709–757. [Google Scholar] [CrossRef] [PubMed]
- Valerio, G.; Maffeis, C.; Saggese, G.; Ambruzzi, M.A.; Balsamo, A.; Bellone, S.; Bergamini, M.; Bernasconi, S.; Bona, G.; Calcaterra, V.; et al. Diagnosis, treatment and prevention of pediatric obesity: Consensus position statement of the Italian Society for Pediatric Endocrinology and Diabetology and the Italian Society of Pediatrics. Ital. J. Pediatr. 2018, 44, 88. [Google Scholar] [CrossRef]
- Hernaez, R.; Lazo, M.; Bonekamp, S.; Kamel, I.; Brancati, F.L.; Guallar, E.; Clark, J.M. Diagnostic accuracy and reliability of ultrasonography for the detection of fatty liver: A meta-analysis. Hepatology 2011, 54, 1082–1090. [Google Scholar] [CrossRef]
- Zhang, Y.N.; Fowler, K.J.; Hamilton, G.; Cui, J.Y.; Sy, E.Z.; Balanay, M.; Hooker, J.; Szeverenyi, N.M.; Sirlin, C.B. Liver fat imaging—A clinical overview of ultrasound, CT, and MR imaging. Br. J. Radiol. 2018, 91, 20170959. [Google Scholar] [CrossRef]
- Hamaguchi, M.; Kojima, T.; Itoh, Y.; Harano, Y.; Fujii, K.; Nakajima, T.; Kato, T.; Takeda, N.; Okuda, J.; Ida, K.; et al. The Severity of Ultrasonographic Findings in Nonalcoholic Fatty Liver Disease Reflects the Metabolic Syndrome and Visceral Fat Accumulation. Am. J. Gastroenterol. 2007, 102, 2708–2715. [Google Scholar] [CrossRef]
- Dasarathy, S.; Dasarathy, J.; Khiyami, A.; Joseph, R.; Lopez, R.; McCullough, A.J.; Joseph, R. Validity of real time ultrasound in the diagnosis of hepatic steatosis: A prospective study. J. Hepatol. 2009, 51, 1061–1067. [Google Scholar] [CrossRef]
- Kramer, H.; Pickhardt, P.J.; Kliewer, M.A.; Hernando, D.; Chen, G.-H.; Zagzebski, J.A.; Reeder, S.B. Accuracy of Liver Fat Quantification With Advanced CT, MRI, and Ultrasound Techniques: Prospective Comparison With MR Spectroscopy. Am. J. Roentgenol. 2016, 208, 92–100. [Google Scholar] [CrossRef]
- Bohte, A.E.; Van Werven, J.R.; Bipat, S.; Stoker, J. The diagnostic accuracy of US, CT, MRI and 1H-MRS for the evaluation of hepatic steatosis compared with liver biopsy: A meta-analysis. Eur. Radiol. 2010, 21, 87–97. [Google Scholar] [CrossRef]
- Pacifico, L.; Celestre, M.; Anania, C.; Paolantonio, P.; Chiesa, C.; Laghi, A. MRI and ultrasound for hepatic fat quantification: Relationships to clinical and metabolic characteristics of pediatric nonalcoholic fatty liver disease. Acta Paediatr. 2007, 96, 542–547. [Google Scholar] [CrossRef]
- Lozoff, B.; De Andraca, I.; Castillo, M.; Smith, J.B.; Walter, T.; Pino, P. Behavioral and developmental effects of preventing iron-deficiency anemia in healthy full-term infants. Pediatrics 2003, 112, 846–854. [Google Scholar]
- Correa-Burrows, P.; Blanco, E.; Reyes, M.; Castillo, M.; Peirano, P.; Algarín, C.; Lozoff, B.; Gahagan, S.; Burrows, R. Leptin status in adolescence is associated with academic performance in high school: A cross-sectional study in a Chilean birth cohort. BMJ Open 2016, 6, e010972. [Google Scholar] [CrossRef]
- Cheng, E.; Burrows, R.; Correa, P.; Güichapani, C.G.; Blanco, E.; Gahagan, S. Light smoking is associated with metabolic syndrome risk factors in Chilean young adults. Acta Diabetol. 2019, 56, 473–479. [Google Scholar] [CrossRef] [PubMed]
- Burrows, R.; Correa-Burrows, P.; Reyes, M.; Blanco, E.; Albala, C.; Gahagan, S. Healthy Chilean Adolescents with HOMA-IR ≥ 2.6 Have Increased Cardiometabolic Risk: Association with Genetic, Biological, and Environmental Factors. J. Diabetes Res. 2015, 2015, 1–8. [Google Scholar] [CrossRef]
- Alberti, K.; Eckel, R.H.; Grundy, S.M.; Zimmet, P.Z.; Cleeman, J.I.; Donato, K.A.; Fruchart, J.-C.; James, W.P.T.; Loria, C.M.; Smith, S.C. Harmonizing the Metabolic Syndrome: A Joint Interim Statement of the International Diabetes Federation Task Force on Epidemiology and Prevention; National Heart, Lung, and Blood Institute; American Heart Association; World Heart Federation; International Atherosclerosis Society; and International Association for the Study of Obesity. Circulation 2009, 120, 1640–1645. [Google Scholar] [CrossRef] [PubMed]
- Borra, R.; Salo, S.; Dean, K.; Lautamäki, R.; Nuutila, P.; Komu, M.; Parkkola, R. Nonalcoholic Fatty Liver Disease: Rapid Evaluation of Liver Fat Content with In-Phase and Out-of-Phase MR Imaging. Radiology 2009, 250, 130–136. [Google Scholar] [CrossRef] [PubMed]
- Kleiner, D.; Brunt, E.M.; Van Natta, M.; Behling, C.; Contos, M.J.; Cummings, O.W.; Ferrell, L.D.; Liu, Y.-C.; Torbenson, M.S.; Unalp-Arida, A.; et al. Design and validation of a histological scoring system for nonalcoholic fatty liver disease. Hepatology 2005, 41, 1313–1321. [Google Scholar] [CrossRef] [PubMed]
- Koch, J.R.L.G. The Measurement of Observer Agreement for Categorical Data. Biometrics 1977, 33, 159. [Google Scholar] [CrossRef]
- Bradley, E.L.; Blackwood, L.G. Comparing Paired Data: A Simultaneous Test for Means and Variances. Am. Stat. 1989, 43, 234–235. [Google Scholar] [CrossRef]
- Jacob, C. A power primer. Psychol. Bull. 1992, 112, 155–159. [Google Scholar] [CrossRef]
- Cliff, N. Dominance statistics: Ordinal analyses to answer ordinal questions. Psychol. Bull. 1993, 114, 494–509. [Google Scholar] [CrossRef]
- Ma, X.; Holalkere, N.S.; Mino-Kenudson, M.; Hahn, P.F.; Sahani, D.V. Imaging-based Quantification of Hepatic Fat: Methods and Clinical Applications. Radiographics 2009, 29, 1253–1277. [Google Scholar] [CrossRef] [PubMed]
- Lee, D.H. Imaging evaluation of non-alcoholic fatty liver disease: Focused on quantification. Clin. Mol. Hepatol. 2017, 23, 290–301. [Google Scholar] [CrossRef] [PubMed]
- Di Martino, M.; Pacifico, L.; Bezzi, M.; Di Miscio, R.; Sacconi, B.; Chiesa, C.; Catalano, C. Comparison of magnetic resonance spectroscopy, proton density fat fraction and histological analysis in the quantification of liver steatosis in children and adolescents. World J. Gastroenterol. 2016, 22, 8812–8819. [Google Scholar] [CrossRef] [PubMed]
- Zheng, D.; Tian, W.; Zheng, Z.; Gu, J.; Guo, Z.; He, X. Accuracy of Computed Tomography for Detecting Hepatic Steatosis in Donors for Liver Transplantation: A Meta-analysis. Clin. Transplant. 2017, 31, e13013. [Google Scholar] [CrossRef]
- Qayyum, A.; Chen, D.M.; Breiman, R.S.; Westphalen, A.C.; Yeh, B.M.; Jones, K.D.; Lu, Y.; Coakley, F.V.; Callen, P.W. Evaluation of diffuse liver steatosis by ultrasound, computed tomography, and magnetic resonance imaging: Which modality is best? Clin. Imaging 2009, 33, 110–115. [Google Scholar] [CrossRef]
- Shores, N.J.; Link, K.; Fernández, A.; Geisinger, K.R.; Davis, M.; Nguyen, T.; Sawyer, J.; Rudel, L. Non-contrasted Computed Tomography for the Accurate Measurement of Liver Steatosis in Obese Patients. Dig. Dis. Sci. 2011, 56, 2145–2151. [Google Scholar] [CrossRef][Green Version]
- Block, B. The Practice of Ultrasound. A Step-By-Step Guide to Abdominal Scanning; Georg Thieme Verlag: Stuttgart, Germany, 2004. [Google Scholar]
- Rolfe, E.D.L.; Brage, S.; Sleigh, A.; Finucane, F.; Griffin, S.J.; Wareham, N.J.; Ong, K.K.; Forouhi, N.G. Validity of ultrasonography to assess hepatic steatosis compared to magnetic resonance spectroscopy as a criterion method in older adults. PLoS ONE 2018, 13, e0207923. [Google Scholar] [CrossRef]
- Gerdts, E.; Regitz-Zagrosek, V. Sex differences in cardiometabolic disorders. Nat. Med. 2019, 25, 1657–1666. [Google Scholar] [CrossRef]
- Kim, W.R.; Flamm, S.L.; Di Bisceglie, A.M.; Bodenheimer, H.C. Serum activity of alanine aminotransferase (ALT) as an indicator of health and disease. Hepatology 2008, 47, 1363–1370. [Google Scholar] [CrossRef] [PubMed]
- Martin-Rodriguez, J.L.; Gonzalez-Cantero, J.; Gonzalez-Cantero, A.; Arrebola, J.; Gonzalez-Calvin, J.L. Diagnostic accuracy of serum alanine aminotransferase as biomarker for nonalcoholic fatty liver disease and insulin resistance in healthy subjects, using 3T MR spectroscopy. Medicine 2017, 96, e6770. [Google Scholar] [CrossRef] [PubMed]
- Greber-Platzer, S.; on behalf of the APV-Study Group; Thajer, A.; Bohn, S.; Brunert, A.; Boerner, F.; Siegfried, W.; Artlich, A.; Moeckel, A.; Waldecker-Krebs, H.; et al. Increased liver echogenicity and liver enzymes are associated with extreme obesity, adolescent age and male gender: Analysis from the German/Austrian/Swiss obesity registry APV. BMC Pediatr. 2019, 19, 332. [Google Scholar] [CrossRef]
- Mofrad, P.; Contos, M.J.; Haque, M.; Sargeant, C.; Fisher, R.A.; Luketic, V.A.; Sterling, R.; Shiffman, M.L.; Stravitz, R.T.; Sanyal, A.J. Clinical and histologic spectrum of nonalcoholic fatty liver disease associated with normal ALT values. Hepatology 2003, 37, 1286–1292. [Google Scholar] [CrossRef]
- Amarapurkar, D.N.; Patel, N.D. Clinical spectrum and natural history of non-alcoholic steatohepatitis with normal alanine aminotransferase values. Trop. Gastroenterol. 2005, 25, 15682660. [Google Scholar]
- Pozzato, C.; Radaelli, G.; Dall’asta, C.; Verduci, E.; Villa, A.; Villa, C.; Scaglioni, S.; Riva, E.; Pontiroli, A.E.; Cornalba, G.; et al. MRI in Identifying Hepatic Steatosis in Obese Children and Relation to Ultrasonography and Metabolic Findings. J. Pediatr. Gastroenterol. Nutr. 2008, 47, 493–499. [Google Scholar] [CrossRef] [PubMed]


| Variable | Participants Enrolled in the Clinical Validation (n = 60) | Participants Enrolled in the Analytical Validation (n = 555) | p | ||
|---|---|---|---|---|---|
| Median/% | (IQR)/n | Median/% | (IQR)/n | ||
| Age (years) | 22.6 | (22.3–22.7) | 22.7 | (22.3–22.9) | NS |
| Sex (male) | 50% | 30 | 51% | 283 | NS |
| Body-Mass Index | 27.6 | (23.3–32.5) | 25.6 | (22.5–29.6) | 0.031 |
| Waist circumference (cm) | 82.9 | (74.2–94.2) | 80.7 | (73.2–89.3) | NS |
| Systolic Blood Pressure (mm Hg) | 116 | (105–124) | 110 | (103–119) | 0.038 |
| Diastolic Blood Pressure (mm Hg) | 70 | (64–79) | 70 | (64–74) | NS |
| Fasting glucose (mg/dL) | 90.7 | (86.4–94.0) | 88.0 | (83.6–93.3) | 0.032 |
| Fasting insulin (uUI/ dL) | 14.2 | (9.2–20) | 11.4 | (7.7–16.1) | 0.021 |
| HOMA-IR | 3.12 | (2.0–4.5) | 2.46 | (1.6–3.6) | 0.012 |
| High-density lipoprotein cholesterol (mg/dL) | 40.6 | (32.2–48.8) | 42.4 | (34–51.8) | NS |
| Triglycerides (mg/dL) | 86.1 | (56.8–131.8) | 84.4 | (61.8–117.1) | NS |
| High-sensitivity C-reactive protein (mg/L) | 1.57 | (1.6–2.8) | 1.34 | (1.0–3.0) | NS |
| Alanine transaminase (IU/L) | 37.2 | (27.7–45.6) | 33.7 | (26.2–41.1) | <0.001 |
| Aspartate transaminase (IU/L) | 32.7 | (26.1–46.3) | 27.9 | (21.0–37.2) | 0.022 |
| Hepatic fatty infiltration (%) | 4.0 | (2.0–12.5) | d.n.a | d.n.a | d.n.a |
| Hepatic fatty infiltration ≥5% | 45% | 27 | d.n.a | d.n.a | d.n.a |
| Obesity (BMI ≥30) | 36.6% | 22 | 25.1% | 139 | 0.027 |
| Metabolic Syndrome (%) | 28.3% | 17 | 12.6% | 70 | 0.022 |
| Insulin Resistance (%) | 61.2% | 38 | 45.1% | 250 | 0.014 |
| Overall | Males | Females | |
|---|---|---|---|
| Sensitivity (%) | 77.8 | 75.0 | 82.0 |
| Specificity (%) | 85.0 | 85.7 | 84.2 |
| Correctly Classified (%) | 81.7 | 80.0 | 83.3 |
| Positive Predicted Value | 81.0 | 85.7 | 75.0 |
| Negative Predicted Value | 82.4 | 75.0 | 90.0 |
| False Positive Fraction | 15.2 | 14.3 | 15.8 |
| False Negative Fraction | 22.0 | 25.0 | 18.2 |
| Positive likelihood ratio | 5.1 | 5.3 | 5.2 |
| Negative likelihood ratio | 0.3 | 0.3 | 0.2 |
| Pre-test probability (prevalence) | 45.0 | 53.3 | 36.7 |
| Post-test probability (test positive) | 80.8 | 85.7 | 75.0 |
| Post-test probability (test negative) | 17.6 | 25.0 | 11.1 |
| Area Under Curve (%) | 86.0 | 85.0 | 90.0 |
| Cohen’s Kappa | 0.63 | 0.61 | 0.65 |
| Number of observations | 60 | 30 | 30 |
| Variable | Overall sample (n = 60) | Females (n = 30) | Males (n = 30) | |||
|---|---|---|---|---|---|---|
| NAFLD (−) (n = 34) | NAFLD (+) (n = 26) | NAFLD (−) (n = 18) | NAFLD (+) (n = 12) | NAFLD (−) (n = 16) | NAFLD (+) (n = 14) | |
| Body-Mass Index (kg/m2) | 24.5 | 30.8 ** | 24.9 | 29.5 ‡ | 24 | 31.6 ** |
| (22.2–28.2) | (26.7–34.5) | (22.6–28.2) | (24.6–35.5) | (22–28) | (27.9–33.9) | |
| Waist circumference (cm) | 77.7 | 93.6 ** | 75.6 | 85.8 ‡ | 79.0 | 96.6 ** |
| (73.4–85.0) | (83.9–102.4) | (71.4–85.0) | (75.0–99.4) | (74.2–85.5) | (90.7–102.4) | |
| Systolic Blood Pressure (mm Hg) | 108.4 | 120.9 ** | 109.4 | 114.4 | 106.9 | 124.5 ** |
| (105–119) | (110–130) | (104.3–117) | (103–127) | (105–120.7) | (120–130) | |
| Diastolic Blood Pressure (mm Hg) | 68.4 | 78.5 ** | 65.4 | 66.7 | 69.3 | 80 ** |
| (63.3–70) | (68.3–80.7) | (64–70) | (61.2–82.2) | (60.8–76.3) | (78.3–80.7) | |
| Blood glucose (mg/dL) | 90.7 | 91 | 89.3 | 88.2 | 91.5 | 92.9 |
| (83.5–93.3) | (88–94.4) | (83.4–92.8) | (82.9–93) | (86.7–94.6) | (90–96.4) | |
| Fasting insulin (uUI/dL) | 12.1 | 19.8 ** | 13.4 | 17.5 | 11.3 | 21.8 ** |
| (8.8–16.3) | (11–38.6) | (10.1–18) | (10–45.5) | (8.6–14.2) | (13.1–38.6) | |
| HOMA-IR (arbitrary units) | 2.7 | 4.5 ** | 2.9 | 4 | 2.6 | 4.8 ** |
| (2–3.5) | (2.1–7.3) | (1.9–3.8) | (2.1–6.4) | (2–3.1) | (3.1–8.4) | |
| Total Cholesterol (mg/dL) | 158 | 165 | 164 | 166 | 149 | 166 |
| (130–184) | (138–196) | (130–187) | (138–202) | (127–176) | (138–191) | |
| High- density lipoprotein cholesterol (mg/dL) | 42.5 | 39.0 | 46.1 | 43.5 | 38.3 | 35.9 |
| (32.4–49.8) | (32.1–44.5) | (34.8–51) | (36–47.9) | (30.2–45.5) | (29.3–39.5) | |
| Triglycerides (mg/dL) | 78.5 | 105.5 ‡ | 86.7 | 85.6 | 64 | 135.3 ‡ |
| (60.2–105.2) | (56.3–182.6) | (65.9–105.2) | (51.3–129.7) | (56.5–109.6) | (66.4–196.8) | |
| High-sensitivity C-reactive protein (mg/L) (n = 57) | 1.57 | 1.70 | 1.87 | 2.02 | 1.29 | 1.61 |
| (1.1–2.7) | (1.2–3.3) | (1.2–2.4) | (1.2–3.3) | (1.1–2.8) | (1.2–6.0) | |
| Adiponectin (µg/mL) | 6.54 | 4.49 | 7.47 | 7.05 | 9.27 | 3.71 |
| (2.6–10.5) | (3.2–8.8) | (3.8 -8.8) | (2.6–8.69) | (2.6–9.27) | (1.7–5.5) | |
| Alanine transaminase (IU/L) | 29.5 | 38.0 ** | 31.3 | 32.7 | 28.4 | 58.3 ** |
| (25–36.5) | (31.5–66) | (26.1–36.5) | (24.9–38) | (23.9–38.3) | (32.9–88.8) | |
| Aspartate transaminase (IU/L) | 37.2 | 38.5 | 37.2 | 37.2 | 39.3 | 45.4 |
| (27.5–43.5) | (30.9–50.5) | (31.3–42.6) | (31.6–40.1) | (27–46.5) | (27.7–61.7) | |
| Variable | Males (n = 283) | Females (n = 272) | ||||
|---|---|---|---|---|---|---|
| NAFLD (+) | NAFLD (−) | Effect Size † | NAFLD (+) | NAFLD (−) | Effect Size † | |
| (n = 57) | (n = 226) | (n = 75) | (n = 197) | |||
| Waist circumference (cm) | 94.1 *** | 82.3 | 1.19 | 85.3 *** | 77.4 | 0.86 |
| (11.6) | (8.8) | (9.9) | (8.9) | |||
| Systolic Blood Pressure (mm Hg) | 120.3 *** | 113.5 | 0.70 | 110.8 * | 107.8 | 0.32 |
| (9.9) | (9.7) | (9.5) | (9.3) | |||
| Diastolic Blood Pressure (mm Hg) | 75.1 *** | 70.5 | 0.74 | 69.1 * | 65.8 | 0.55 |
| (6.3) | (6.1) | (6.0) | (5.7) | |||
| Fasting Glucose (mg/dL) | 90.7 * | 88.5 | 0.35 | 89.6 ** | 86.8 | 0.42 |
| (6.4) | (6.2) | (6.9) | (6.7) | |||
| Fasting Insulin (uUI/dL) | 14.8 *** | 9.7 | 0.35 ‡ | 15.2 *** | 11.7 | 0.33 ‡ |
| [12.9] | [6.5] | [12.8] | [7.8] | |||
| HOMA-IR (arbitrary units) | 3.4 *** | 2.1 | 0.34 ‡ | 3.6 *** | 2.5 | 0.31 ‡ |
| [3.2] | [1.5] | [3.4] | [1.7] | |||
| High-density lipoprotein cholesterol (mg/dL) | 38.7 | 41.3 | d.n.a | 44.5 | 47.8 | d.n.a |
| (11.9) | (12.3) | (12.9) | (12.1) | |||
| Triglycerides (mg/dL) | 92.1 * | 82.1 | 0.28 ‡ | 108.4 * | 86.1 | 0.26 ‡ |
| [59.8] | [53.3] | [74.4] | [51.6] | |||
| high-sensitivity C-reactive protein (mg/L) (n = 480) | 2.75 * | 1.99 | 0.35 | 2.85 | 2.33 | d.n.a |
| (1.7) | (1.4) | (2.4) | (1.8) | |||
| Adiponectin (µg/mL) | 4.93 * | 6.03 | 0.32 | 6.50 * | 8.10 | 0.66 |
| (2.1) | (2.5) | (2.7) | (2.3) | |||
© 2020 by the authors. Licensee MDPI, Basel, Switzerland. This article is an open access article distributed under the terms and conditions of the Creative Commons Attribution (CC BY) license (http://creativecommons.org/licenses/by/4.0/).
Share and Cite
Ibacahe, C.; Correa-Burrows, P.; Burrows, R.; Barrera, G.; Kim, E.; Hirsch, S.; Jofré, B.; Blanco, E.; Gahagan, S.; Bunout, D. Accuracy of a Semi-Quantitative Ultrasound Method to Determine Liver Fat Infiltration in Early Adulthood. Diagnostics 2020, 10, 431. https://doi.org/10.3390/diagnostics10060431
Ibacahe C, Correa-Burrows P, Burrows R, Barrera G, Kim E, Hirsch S, Jofré B, Blanco E, Gahagan S, Bunout D. Accuracy of a Semi-Quantitative Ultrasound Method to Determine Liver Fat Infiltration in Early Adulthood. Diagnostics. 2020; 10(6):431. https://doi.org/10.3390/diagnostics10060431
Chicago/Turabian StyleIbacahe, Camila, Paulina Correa-Burrows, Raquel Burrows, Gladys Barrera, Elissa Kim, Sandra Hirsch, Boris Jofré, Estela Blanco, Sheila Gahagan, and Daniel Bunout. 2020. "Accuracy of a Semi-Quantitative Ultrasound Method to Determine Liver Fat Infiltration in Early Adulthood" Diagnostics 10, no. 6: 431. https://doi.org/10.3390/diagnostics10060431
APA StyleIbacahe, C., Correa-Burrows, P., Burrows, R., Barrera, G., Kim, E., Hirsch, S., Jofré, B., Blanco, E., Gahagan, S., & Bunout, D. (2020). Accuracy of a Semi-Quantitative Ultrasound Method to Determine Liver Fat Infiltration in Early Adulthood. Diagnostics, 10(6), 431. https://doi.org/10.3390/diagnostics10060431