Article

Effect of Scanning Resolution on the Prediction of Trabecular Bone Microarchitectures Using Dental Cone Beam Computed Tomography

1
Department of Biomedical Engineering, Hungkuang University, Taichung 433, Taiwan
2
School of Dentistry, China Medical University, Taichung 404, Taiwan
3
Department of Bioinformatics and Medical Engineering, Asia University, Taichung 413, Taiwan
4
Department of Dentistry, China Medical University Hospital, Taichung 404, Taiwan
*
Author to whom correspondence should be addressed.
Diagnostics 2020, 10(6), 368; https://doi.org/10.3390/diagnostics10060368
Submission received: 20 May 2020 / Revised: 1 June 2020 / Accepted: 2 June 2020 / Published: 3 June 2020
(This article belongs to the Section Medical Imaging and Theranostics)

Abstract

:
Assessing bone quality and quantity at the location of dental implants before dental implantation is crucial. In recent years, dental cone-beam computed tomography (dental CBCT) has often been used to assess bone quality and quantity prior to dental implant. However, the effect of scanning resolution on the prediction of trabecular bone microarchitectural parameters (TBMPs) remains unclear. The objective of this study was to examine how dental CBCT with various scanning resolution differs with regard to predicting TBMPs. This study used micro-computed tomography (micro-CT) with 18 μm resolution and dental CBCT with 100 μm and 150 μm resolutions on 28 fresh bovine vertebrae cancellous bone specimens. Subsequently, all images were input into the ImageJ software to measure four TBMPs: bone volume total volume fraction (BV/TV), trabecular thickness (Tb.Th), trabecular number (Tb.N), and trabecular separation (Tb.Sp). One-way analysis of variance and Tukey’s test were subsequently used to assess the differences between three scanning modes for the four TBMPs. In addition, correlations between measurement results obtained from micro-CT and dental CBCT with two resolutions were measured. The experimental results indicated that significant differences in four TBMPs were observed between micro-CT and dental CBCT (p < 0.05). The correlation coefficients between BV/TV, Tb.N, and Tb.Sp obtained from micro-CT and from dental CBCT with 100 μm resolution (0.840, 0.739, and 0.820, respectively) were greater than the correlation coefficients between BV/TV, Tb.N, and Tb.Sp obtained from micro-CT and from dental CBCT with 150 μm resolution (0.758, 0.367, and 0.724, respectively). The experimental results revealed that the TBMPs measured with dental CBCT with two resolutions differed from ideal values, but a higher resolution could provide more accurate prediction results, particularly for BV/TV, Tb.N, and Tb.Sp.

1. Introduction

Dental implants are a common method of treatment for missing teeth [1,2]. Whether dental implants succeed is substantially influenced by bone quality and quantity at dental implant sites. Therefore, accurately predicting bone quality and quantity at dental implant sites prior to dental implant surgery is crucial [3,4,5,6]. The jawbone can be divided into the outer cortical bone and inner cancellous bone. The inner cancellous bone is composed of trabecular bones. The gold standard for assessing trabecular bone microarchitectural parameters (TBMPs) is based on images obtained from micro-computed tomography (micro-CT) [7,8]. However, micro-CT can only be used for in vitro examinations because micro-CT can only be used to image small animals [9,10] and cannot be used for clinical dental diagnosis.
Numerous researchers have used CT to measure bone density at dental implant sites [11,12,13,14,15,16]. They used CT to measure the Hounsfield unit (HU) of bone tissue as bone density (i.e., bone radiographic density or bone density in HU). This method can be used to generally understand the bone quality and quantity at a dental implant site. However, this method does not provide information on the trabecular bone microarchitecture of the cancellous bone. The main reason for this is that the resolutions of most CT images are greater than 600 μm. In addition, the CT radiation dosage is high and typically cannot be acquired by a dental clinic. Therefore, CT is unsuitable for routine assessments prior to dental implantation. During the past 15 years, dental cone-beam computed tomography (dental CBCT) has become increasingly prevalent in clinical dentistry [8,17] mainly because, compared with CT, a dental CBCT machine is less expensive, uses a lower radiation dosage, and allows higher resolution [18,19,20]. Therefore, an increasing number of dentists have used dental CBCT to assess the bone quality and quantity of jawbone prior to dental implant surgery. Nevertheless, the resolution of dental CBCT is higher than 70 μm and mostly between 100 μm and 200 μm. This value cannot be used to accurately measure the trabecular bone microarchitecture of humans.
Numerous researchers from various countries have used dental CBCT to measure the trabecular bone microarchitecture of jawbone. However, few studies have examined the abilities of various scanning resolutions of dental CBCT to predict TBMPs. Therefore, this study aimed to understand the differences between various scanning resolutions of dental CBCT in terms of their ability to predict TBMPs.

2. Materials and Methods

2.1. Specimen Preparation

Twenty-eight bovine vertebrae cancellous bone specimens (the size of each sample was 20 × 20 × 20 mm3) were used in this study. Each sample was wrapped with wet gauze and medical tape, placed in a bag, and frozen at −20 °C. To align the regions of interest (ROIs) in micro-CT and dental CBCT images, a dental composite resin ball was placed on the top surface of each bone specimen to serve as an anchor point.

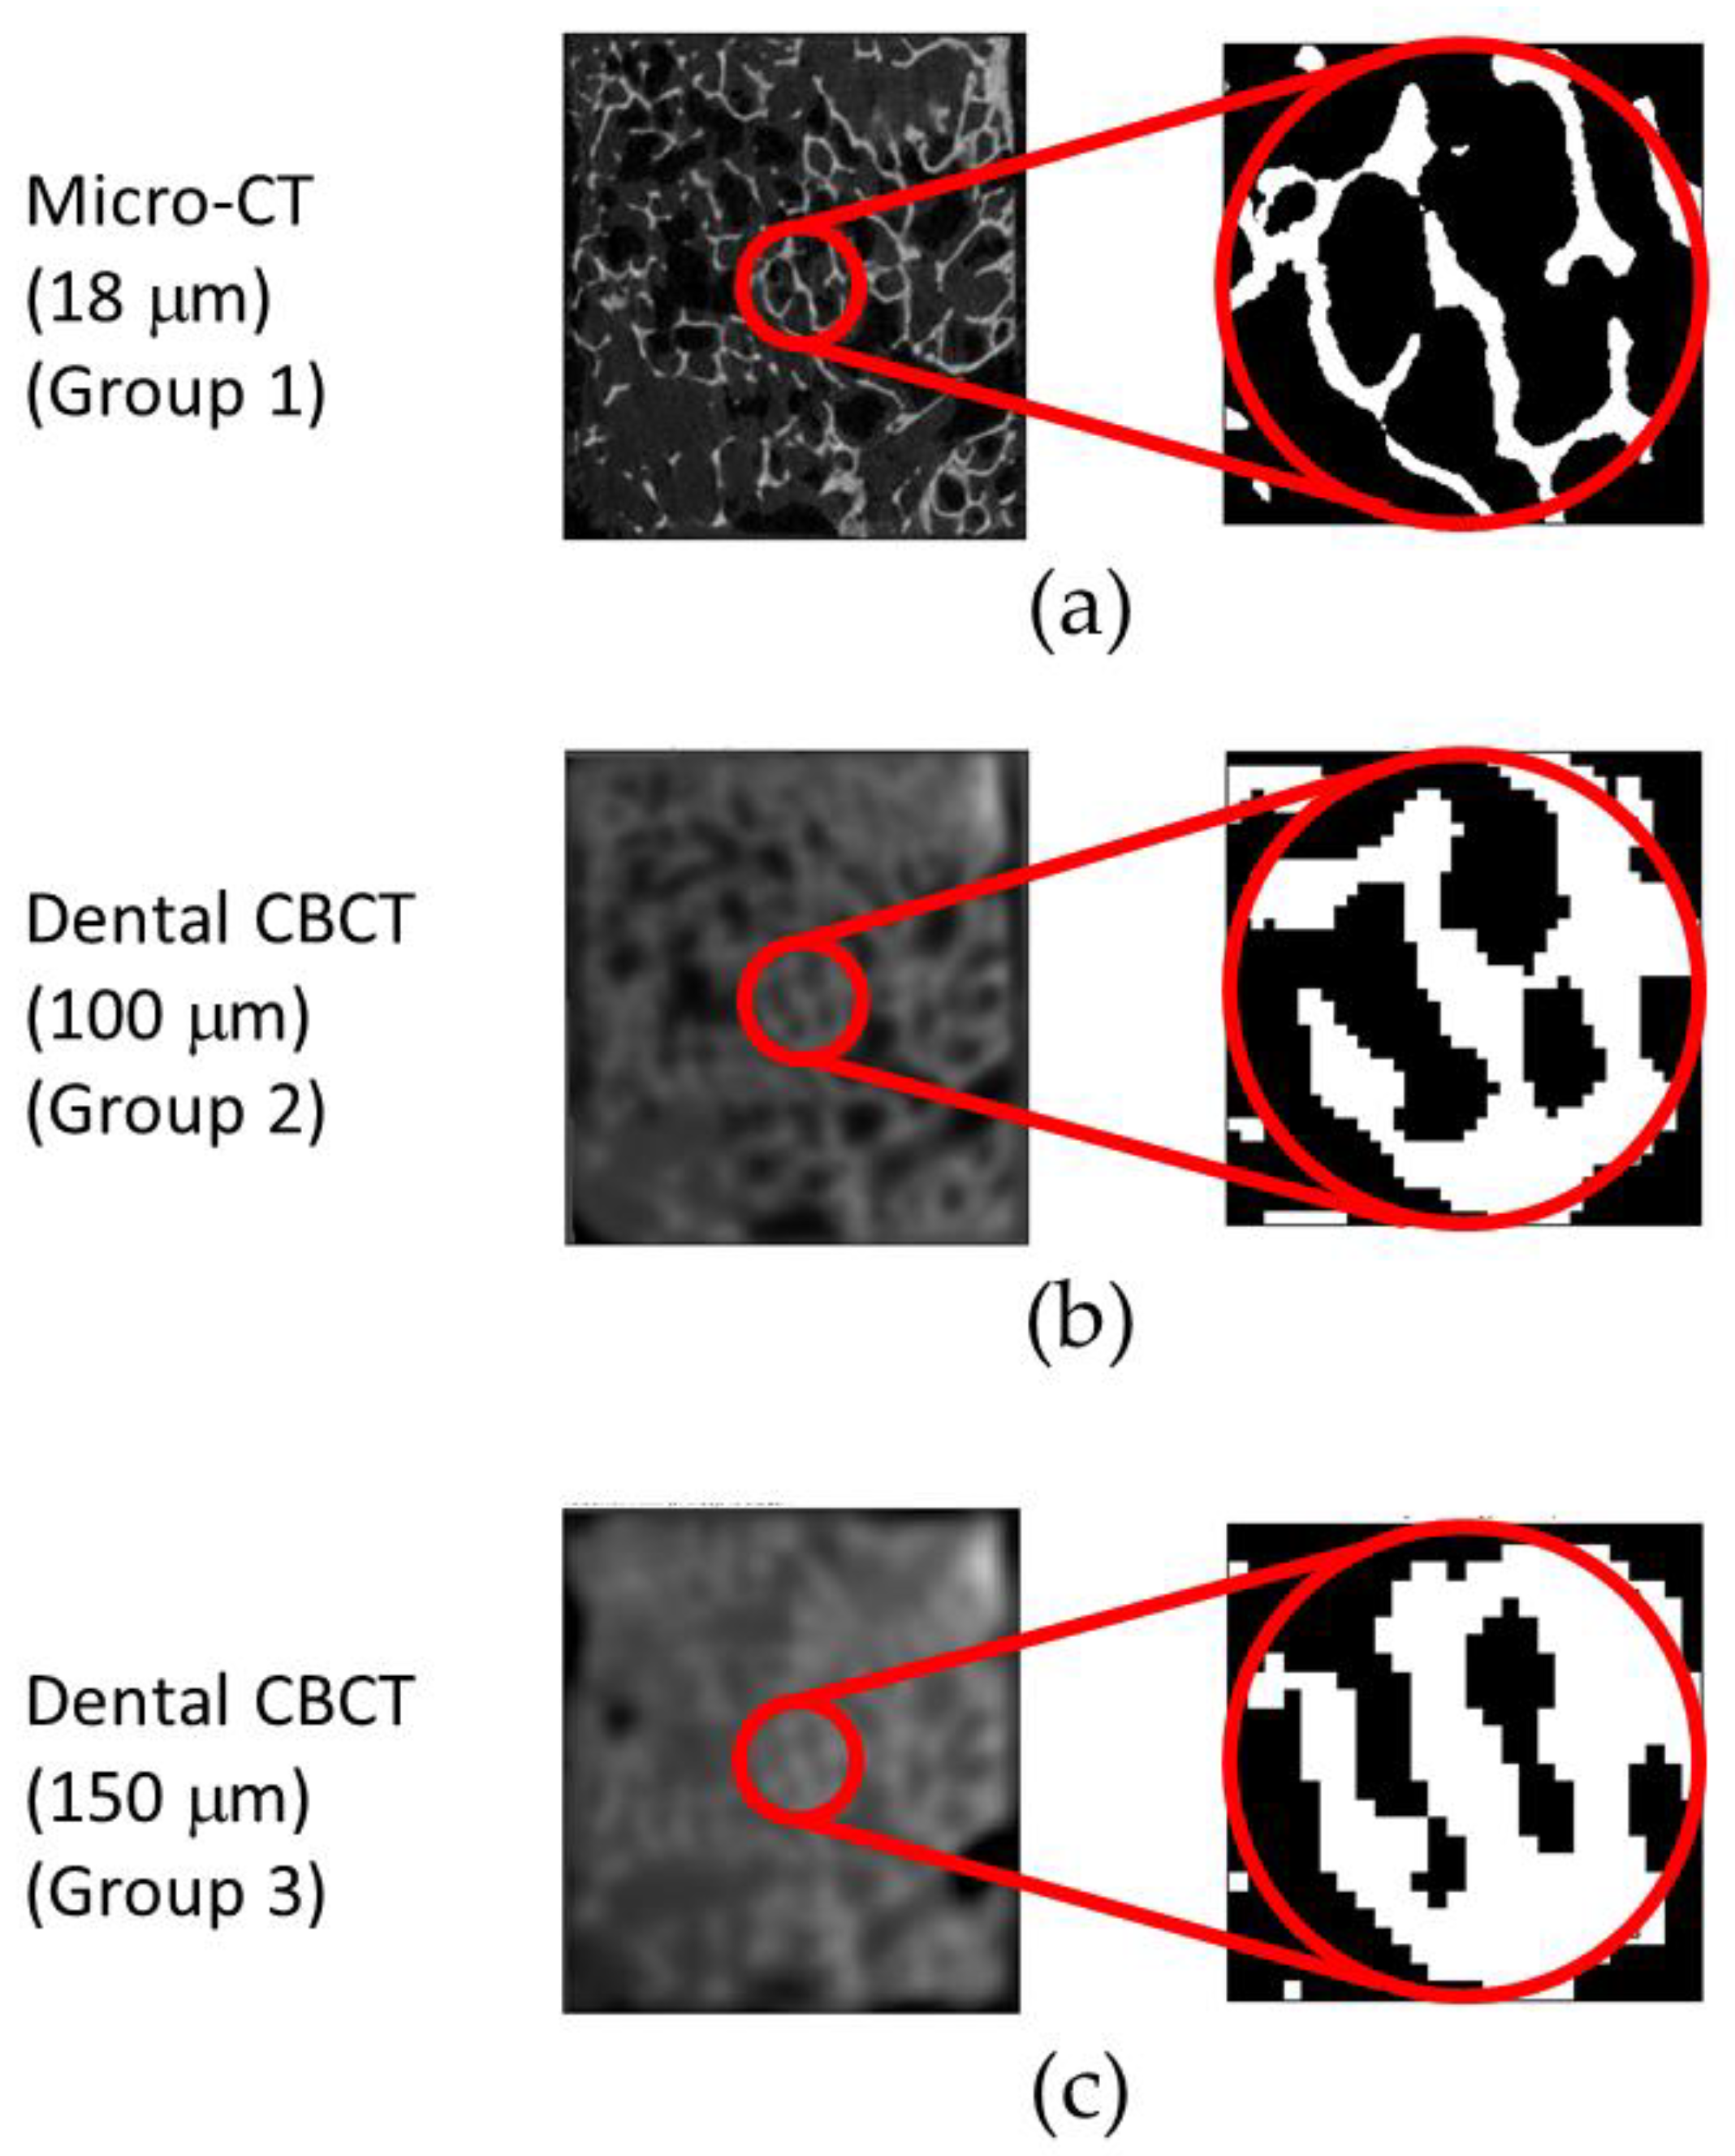
2.2. Micro-CT and Dental CBCT Scanning and Trabecular Bone Microarchitectural Measurement

One micro-CT scan and two dental CBCT scans were used in this study. Group 1: Micro-CT images were obtained using Skyscan 1076 micro-CT (Aartselaar, Belgium). The voxel resolution of micro-CT scanning was 18 μm. Dental CBCT images were scanned using Asahi AZ 3000 (Kyoto, Japan). The scanning resolutions were set to 100 μm (Group 2) and 150 μm (Group 3). More scanning parameters are listed in Table 1.
Prior to calculating the TBMPs, a sharpening filter and a despicable filter were used for the raw images of the two scanning resolutions for dental CBCT images. The images were then converted into binary images with a local threshold, and the suppositional air voxels were removed. All imaging was performed in ImageJ 1.46 r (Rasband, W.S., ImageJ, U.S. National Institutes of Health, Bethesda, MD, USA). The details of the imaging process approaches are the same as in our previous study [21]. The position of the composite resin ball was used for alignment (Figure 1). A cylinder of 4 mm diameter and 10 mm length was segmented from the central point inward to the bone specimen to serve as the ROI. The micro-CT and dental CBCT images were imported into CTAn (Aartselaar, Belgium) to calculate the following four TBMPs of the ROI: BV/TV (unit = %), Tb.Th (unit = mm), Tb.N (unit = mm−1), and Tb.Sp (unit = mm).

2.3. Statistical Analysis

The mean and standard deviation were calculated for all measurements. The four TBMPs for the three groups were analyzed using one-way analysis of variance and Tukey’s test for multiple comparisons (p < 0.05). In addition, Pearson analysis was conducted to calculate the correlation coefficients (r values) for all pairs of groups from the three groups. All statistical analyses were performed using SPSS Version 19 (IBM Corporation, Armonk, NY, USA).

3. Results

3.1. Trabecular Bone Microarchitectures Measured with Micro-CT and Dental CBCT

Table 2 presents the measurements for four TBMPs obtained using micro-CT and dental CBCT. For BV/TV, the measurement values (23.85 ± 7.83%) for Group 1 (from micro-CT) were significantly smaller than those (44.1 ± 12.55%) for Group 2 (from dental CBCT with 100 μm resolution) and those (49.96 ± 8.1%) for Group 3 (from dental CBCT with 150 μm resolution). For Tb.Th, the measurement values (0.20 ± 0.02 mm) for Group 1 (from micro-CT) were significantly smaller than those (0.65 ± 0.08 mm) for Group 2 (from dental CBCT with 100 μm resolution) and those (0.72 ± 0.08 mm) for Group 3 (from dental CBCT with 150 μm resolution). For Tb.Sp, the measurement values (1.18 ± 0.37 mm−1) for Group 1 (from micro-CT) were significantly smaller than those (0.67 ± 0.15 mm−1) for Group 2 (from dental CBCT with 100 μm resolution) and those (0.70 ± 0.12 mm−1) for Group 3 (from dental CBCT with 150 μm resolution). Similarly, for Tb.N, the measurement values (0.72 ± 0.22 mm) for Group 1 (from micro-CT) were significantly smaller than those (0.85 ± 0.22 mm) for Group 2 (from dental CBCT with 100 μm resolution) and those (0.81 ± 0.17 mm) for Group 3 (from dental CBCT with 150 μm resolution). Among the three groups, the measurement values for Group 1 (from micro-CT) significantly differed from those for Group 2 (from dental CBCT with 100 μm resolution) and those for Group 3 (from dental CBCT with 150 μm resolution). However, although the measurement values for Group 2 (from dental CBCT with 100 μm resolution) differed from those for Group 3 (from dental CBCT with 150 μm resolution), the difference was, on average, not significant.

3.2. Relation between the Trabecular Bone Microstructures from Micro-CT and Dental CBCT

Table 3 presents the correlations between four TBMPs measured with micro-CT and those measured with dental CBCT. For BV/TV, Group 2 (from dental CBCT with 100 μm resolution) was closely correlated with Group 1 (from micro-CT); the correlation coefficient was 0.840 (p < 0.001), which was greater than the correlation coefficient between Group 3 (from dental CBCT with 150 μm resolution) and Group 1 (0.758, p < 0.001). Similarly, for both Tb.N and Tb.Sp, the correlation coefficient between Groups 1 and 2 was greater than that between Groups 1 and 3. However, for Tb.Th, neither Group 2 nor Group 3 was correlated with Group 1.

4. Discussion

An increasing number of researchers have used dental CBCT to measure the trabecular bone architecture of the jawbone. However, insufficient reports have been provided regarding the ability of dental CBCT with various scanning resolutions to predict TBMPs. The present study adopted two scanning resolutions of dental CBCT to measure TBMPs. The experimental results indicated that, although the measurement values of the TBMPs obtained by dental CBCT with 100 μm or 150 μm resolution differed from ideal values, the higher resolution yielded more accurate predication results, particularly for BV/TV, Tb.N, and Tb.Sp.
In studies using dental CBCT to measure bones, some researchers have focused on the human cadaveric jawbone [13,22,23] or human dry jawbone [24,25,26] and artificial bones [27]. Fresh human cadaveric jawbone is not easily available. Therefore, this study used accessible fresh bovine vertebrae cancellous bone specimens as research samples. In accordance with Kang et al. [28], the specimens were wrapped with wet gauze and medical tape and placed in a refrigerator at a constant temperature of −20 °C. Prior to imaging, the bone specimens were defrosted to room temperature. Accordingly, a small outer area of the bone specimens contained moisture, enabling a soft tissue environment to be simulated. Per Bouxsein et al. [7], this study selected BV/TV, Tb.Th, Tb.N, and Tb.Sp as the TBMPs, which are the most crucial indicators.
Micro-CT measurement values for the TBMPs of bovine vertebrae cancellous bone specimens were compared with the corresponding measurement values from other studies measuring human jawbone specimens. When micro-CT was used to measure the bone specimens, the BV/TV values (24,900 ± 7.031%) measured in the present study fell within the range obtained by studies on human cadaveric jawbone specimens (18.53 ± 8.17–34.39 ± 5.41%). In addition, the values for Tb.Th (0.200 ± 0.021 mm), Tb.N (1.184 ± 0.367 m−1), and Tb.Sp (0.717 + 0.215 mm) obtained using micro-CT in the present study differed only slightly from the values obtained by studies on patients’ jawbones or human cadaveric jawbone [13,22,23,24,25,26].
Nicolielo et al. [29] have indicated that prior to dental implant insertion, attention should be given to extreme deviations in trabecular bone structure at the potential dental implant sites. In addition, Kulah et al. [30] have demonstrated that the BV/TV measured by dental CBCT were found to be useful for the assessment of maxillary trabecular bone microstructure. From the experimental results of this study, for BV/TV, the correlation coefficients between the value obtained from dental CBCT with 100 μm resolution and that obtained from micro-CT and the correlation coefficient between the value obtained from dental CBCT with 150 μm resolution and that obtained from micro-CT were 0.840 and 0.758, respectively. The two values were close to the values provided by other studies. For BV/TV, the correlation coefficients between dental CBCT and micro-CT reported by Parsa et al. [13], Van Dessel et al. [31], and Kim et al. [23] were 0.82, 0.76–0.89, and 0.61, respectively. In addition, the present study confirmed that, as reported elsewhere, for Tb.Th, the value obtained from dental CBCT was not correlated with that obtained from micro-CT.
Regarding the abilities of the two dental CBCT resolutions to predict TBMPs, for BV/TV, Tb.N, and Tb.Sp, the image with 100 μm resolution provided a greater correlation coefficient value than the image with 150 μm resolution. As such, the three parameters were more accurately predicted using the dental CBCT image with 100 μm resolution. Moreover, the Tb.Th (0.648 ± 0.075 mm) value obtained from the dental CBCT image with 100 μm resolution was smaller than that (0.719 ± 0.077 mm) obtained from the dental CBCT image with 150 μm resolution because of the partial volume effect (i.e., scanning methods with lower resolution more easily overestimate Tb.Th).
This study had several limitations. First, because fresh human cadaveric jawbone specimens are not easily available, like other studies, this research adopted fresh bovine vertebrae cancellous bones. Second, research has indicated that in vivo imaging yields images with less satisfactory quality than in vitro imaging. This study featured in vitro imaging of bone specimens. Other studies have shown that this method can be used to obtain clearer images than in vivo imaging because of the absence of interference from other bones and soft tissues. In addition, in this study, only one dental CBCT machine with two resolutions was used. In the future, other brands of dental CBCT machines with various resolutions and imaging configurations can be adopted to explore this topic thoroughly.

5. Conclusions

With the experimental design and limitations of this study, the experimental results revealed that, although the measurement values of TBMPs measured by dental CBCT with 100 μm or 150 μm resolution differed from ideal values, dental CBCT with the higher resolution yielded more accurate prediction results, particularly for BV/TV, Tb.N, and Tb.Sp.

Author Contributions

Conceptualization: M.-T.T., R.-T.H. and J.-T.H. Methodology: R.-T.H., M.-G.T., and J.-T.H. Writing—original draft: M.-T.T., H.-L.H., and J.-T.H. Writing—review and editing: M.-T.T., J.-T.H. Funding acquisition: J.-T.H. All authors have read and agreed to the published version of the manuscript.

Funding

This research was funded by China Medical University, grant number CMU108-S-01.

Conflicts of Interest

The authors declare no conflict of interest.

References

  1. Guillaume, B. Dental implants: A review. Morphologie 2016, 100, 189–198. [Google Scholar] [CrossRef] [PubMed]
  2. Pye, A.; Lockhart, D.; Dawson, M.; Murray, C.; Smith, A. A review of dental implants and infection. J. Hosp. Infect. 2009, 72, 104–110. [Google Scholar] [CrossRef] [PubMed]
  3. De Groot, R.; Oomens, M.; Forouzanfar, T.; Schulten, E. Bone augmentation followed by implant surgery in the edentulous mandible: A systematic review. J. Oral Rehabil. 2018, 45, 334–343. [Google Scholar] [CrossRef] [PubMed]
  4. Ko, Y.C.; Huang, H.L.; Shen, Y.W.; Cai, J.Y.; Fuh, L.J.; Hsu, J.T. Variations in crestal cortical bone thickness at dental implant sites in different regions of the jawbone. Clin. Implant Dent. Relat. Res. 2017, 19, 440–446. [Google Scholar] [CrossRef]
  5. Chrcanovic, B.R.; Albrektsson, T.; Wennerberg, A. Bone Quality and Quantity and Dental Implant Failure: A Systematic Review and Meta-analysis. Int. J. Prosthodont. 2017, 30, 219–237. [Google Scholar] [CrossRef]
  6. Porter, J.A.; Von Fraunhofer, J.A. Success or failure of dental implants? A literature review with treatment considerations. Gen. Dent. 2005, 53, 423–432. [Google Scholar]
  7. Bouxsein, M.L.; Boyd, S.K.; Christiansen, B.A.; Guldberg, R.E.; Jepsen, K.J.; Müller, R. Guidelines for assessment of bone microstructure in rodents using micro–computed tomography. J. Bone Miner. Res. 2010, 25, 1468–1486. [Google Scholar] [CrossRef]
  8. Donnelly, E. Methods for assessing bone quality: A review. Clin. Orthop. Relat. Res. 2011, 469, 2128–2138. [Google Scholar] [CrossRef] [Green Version]
  9. Schambach, S.J.; Bag, S.; Schilling, L.; Groden, C.; Brockmann, M.A. Application of micro-CT in small animal imaging. Methods 2010, 50, 2–13. [Google Scholar] [CrossRef]
  10. Holdsworth, D.W.; Thornton, M.M. Micro-CT in small animal and specimen imaging. Trends Biotechnol. 2002, 20, S34–S39. [Google Scholar] [CrossRef]
  11. Fuh, L.; Huang, H.; Chen, C.; Fu, K.; Shen, Y.; Tu, M.; Shen, W.; Hsu, J. Variations in bone density at dental implant sites in different regions of the jawbone. J. Oral Rehabil. 2010, 37, 346–351. [Google Scholar] [CrossRef] [PubMed]
  12. Norton, M.R.; Gamble, C. Bone classification: An objective scale of bone density using the computerized tomography scan. Clin. Oral Implant. Res. 2001, 12, 79–84. [Google Scholar] [CrossRef] [PubMed]
  13. Parsa, A.; Ibrahim, N.; Hassan, B.; Stelt, P.; Wismeijer, D. Bone quality evaluation at dental implant site using multislice CT, micro-CT, and cone beam CT. Clin. Oral Implant. Res. 2015, 26, e1–e7. [Google Scholar] [CrossRef]
  14. Aranyarachkul, P.; Caruso, J.; Gantes, B.; Schulz, E.; Riggs, M.; Dus, I.; Yamada, J.M.; Crigger, M. Bone density assessments of dental implant sites: 2. Quantitative cone-beam computerized tomography. Int. J. Oral Maxillofac. Implant. 2005, 20, 416–424. [Google Scholar]
  15. Lee, S.; Gantes, B.; Riggs, M.; Crigger, M. Bone density assessments of dental implant sites: 3. Bone quality evaluation during osteotomy and implant placement. Int. J. Oral Maxillofac. Implant. 2007, 22, 208–212. [Google Scholar]
  16. González-García, R.; Monje, F. The reliability of cone-beam computed tomography to assess bone density at dental implant recipient sites: A histomorphometric analysis by micro-CT. Clin. Oral Implant. Res. 2013, 24, 871–879. [Google Scholar] [CrossRef]
  17. Alamri, H.M.; Sadrameli, M.; Alshalhoob, M.; Alshehri, M. Applications of CBCT in dental practice: A review of the literature. Gen. Dent. 2012, 60, 390–400. [Google Scholar]
  18. Benavides, E.; Rios, H.F.; Ganz, S.D.; An, C.-H.; Resnik, R.; Reardon, G.T.; Feldman, S.J.; Mah, J.K.; Hatcher, D.; Kim, M.-J. Use of cone beam computed tomography in implant dentistry: The International Congress of Oral Implantologists consensus report. Implant Dent. 2012, 21, 78–86. [Google Scholar] [CrossRef] [Green Version]
  19. Benic, G.I.; Elmasry, M.; Hämmerle, C.H. Novel digital imaging techniques to assess the outcome in oral rehabilitation with dental implants: A narrative review. Clin. Oral Implant. Res. 2015, 26, 86–96. [Google Scholar] [CrossRef]
  20. Dawood, A.; Brown, J.; Sauret-Jackson, V.; Purkayastha, S. Optimization of cone beam CT exposure for pre-surgical evaluation of the implant site. Dentomaxillofac. Radiol. 2012, 41, 70–74. [Google Scholar] [CrossRef] [Green Version]
  21. He, R.-T.; Tu, M.-G.; Huang, H.-L.; Tsai, M.-T.; Wu, J.; Hsu, J.-T. Improving the prediction of the trabecular bone microarchitectural parameters using dental cone-beam computed tomography. BMC Med. Imaging 2019, 19, 10. [Google Scholar] [CrossRef] [PubMed]
  22. Ibrahim, N.; Parsa, A.; Hassan, B.; Stelt, P.; Aartman, I.H.; Wismeijer, D. Accuracy of trabecular bone microstructural measurement at planned dental implant sites using cone-beam CT datasets. Clin. Oral Implant. Res. 2014, 25, 941–945. [Google Scholar] [CrossRef] [PubMed]
  23. Kim, J.-E.; Yi, W.-J.; Heo, M.-S.; Lee, S.-S.; Choi, S.-C.; Huh, K.-H. Three-dimensional evaluation of human jaw bone microarchitecture: Correlation between the microarchitectural parameters of cone beam computed tomography and micro-computer tomography. Oral Surg. Oral Med. Oral Pathol. Oral Radiol. 2015, 120, 762–770. [Google Scholar] [CrossRef]
  24. Naitoh, M.; Aimiya, H.; Hirukawa, A.; Ariji, E. Morphometric analysis of mandibular trabecular bone using cone beam computed tomography: An in vitro study. Int. J. Oral Maxillofac. Implant. 2010, 25, 1093–1098. [Google Scholar]
  25. Panmekiate, S.; Ngonphloy, N.; Charoenkarn, T.; Faruangsaeng, T.; Pauwels, R. Comparison of mandibular bone microarchitecture between micro-CT and CBCT images. Dentomaxillofac. Radiol. 2015, 44, 20140322. [Google Scholar] [CrossRef] [Green Version]
  26. Pauwels, R.; Faruangsaeng, T.; Charoenkarn, T.; Ngonphloy, N.; Panmekiate, S. Effect of exposure parameters and voxel size on bone structure analysis in CBCT. Dentomaxillofac. Radiol. 2015, 44, 20150078. [Google Scholar] [CrossRef] [Green Version]
  27. Ho, J.-T.; Wu, J.; Huang, H.-L.; Chen, M.Y.; Fuh, L.-J.; Hsu, J.-T. Trabecular bone structural parameters evaluated using dental cone-beam computed tomography: Cellular synthetic bones. Biomed. Eng. Online 2013, 12, 115. [Google Scholar] [CrossRef] [Green Version]
  28. Kang, S.-R.; Bok, S.-C.; Choi, S.-C.; Lee, S.-S.; Heo, M.-S.; Huh, K.-H.; Kim, T.-I.; Yi, W.-J. The relationship between dental implant stability and trabecular bone structure using cone-beam computed tomography. J. Periodontal Implant Sci. 2016, 46, 116–127. [Google Scholar] [CrossRef] [Green Version]
  29. Nicolielo, L.; Van Dessel, J.; Jacobs, R.; Soares, M.; Collaert, B. Relationship Between Trabecular Bone Architecture and Early Dental Implant Failure in the Posterior Region of the Mandible. Clin. Oral Implant. Res. 2020, 31, 153–161. [Google Scholar] [CrossRef]
  30. Kulah, K.; Gulsahi, A.; Kamburoğlu, K.; Geneci, F.; Ocak, M.; Celik, H.; Ozen, T. Evaluation of Maxillary Trabecular Microstructure as an Indicator of Implant Stability by Using 2 Cone Beam Computed Tomography Systems and Micro-Computed Tomography. Oral Surg. Oral Med. Oral Pathol. Oral Radiol. 2019, 127, 247–256. [Google Scholar] [CrossRef]
  31. Van Dessel, J.; Huang, Y.; Depypere, M.; Rubira-Bullen, I.; Maes, F.; Jacobs, R. A comparative evaluation of cone beam CT and micro-CT on trabecular bone structures in the human mandible. Dentomaxillofac. Radiol. 2013, 42, 20130145. [Google Scholar] [CrossRef] [PubMed] [Green Version]
Figure 1. Original and binary images of regions of interest (ROI) from the two scanning methods: (a) micro-CT image; (b) 100 μm resolution dental CBCT image; (c) 150 μm resolution dental CBCT image.
Diagnostics 10 00368 g001
Table 1. Scanning modes and parameters of micro-computed tomography (micro-CT) and dental cone-beam computed tomography (CBCT).
Group NumberScanning MethodResolutionMachineScanning VoltageScanning CurrentScanning Time
1Micro-CT18 μmSkyscan 107680 kV313 μA450 ms
2Dental CBCT100 μmAsahi AZ 300085 kV6 mA17 s
3Dental CBCT150 μmAsahi AZ 300085 kV6 mA17 s
Table 2. Trabecular bone microarchitectural measurements of the three groups.
Scanning MethodGroupTrabecular Bone Microstructure Parameter
BV/TV (%)Tb.Th (mm)Tb.N (mm−1)Tb.Sp (mm)
Mean ± S.D. *Mean ± S.D. *Mean ± S.D. *Mean ± S.D. *
Micro-CT124.900 ± 7.031 a0.200 ± 0.021 a1.184 ± 0.367 a0.717 ± 0.215 a
Dental CBCT244.100 ± 12.554 b0.648 ± 0.075 b0.672 ± 0.155 b0.855 ± 0.215 b
Dental CBCT349.957 ± 8.100 b0.719 ± 0.077 b0.699 ± 0.117 b0.810 ± 0.172 b
* Post hoc pairwise comparisons were conducted using Tukey’s test, mean ± S.D. with the same letter (a or b) are not significantly different in the same column.
Table 3. Correlation coefficients for trabecular bone microarchitectural measurements between the three groups.
Comparison Trabecular Bone Microarchitecture
BV/TVTb.ThTb.NTb.Sp
Group 1 vs. Group 2r0.8400.2940.7390.820
p<0.0010.129<0.001<0.001
Group 1 vs. Group 3r0.7580.2150.3670.724
p<0.0010.2710.055<0.001
Group 2 vs. Group 3r0.8760.3500.6250.736
p<0.0010.068<0.001<0.001
Data are Pearson’s correlation coefficients (r values) and probability values (p).

