An Effective Mental Stress State Detection and Evaluation System Using Minimum Number of Frontal Brain Electrodes


Abstract
1. Introduction
2. Materials and Methods
2.1. Participants
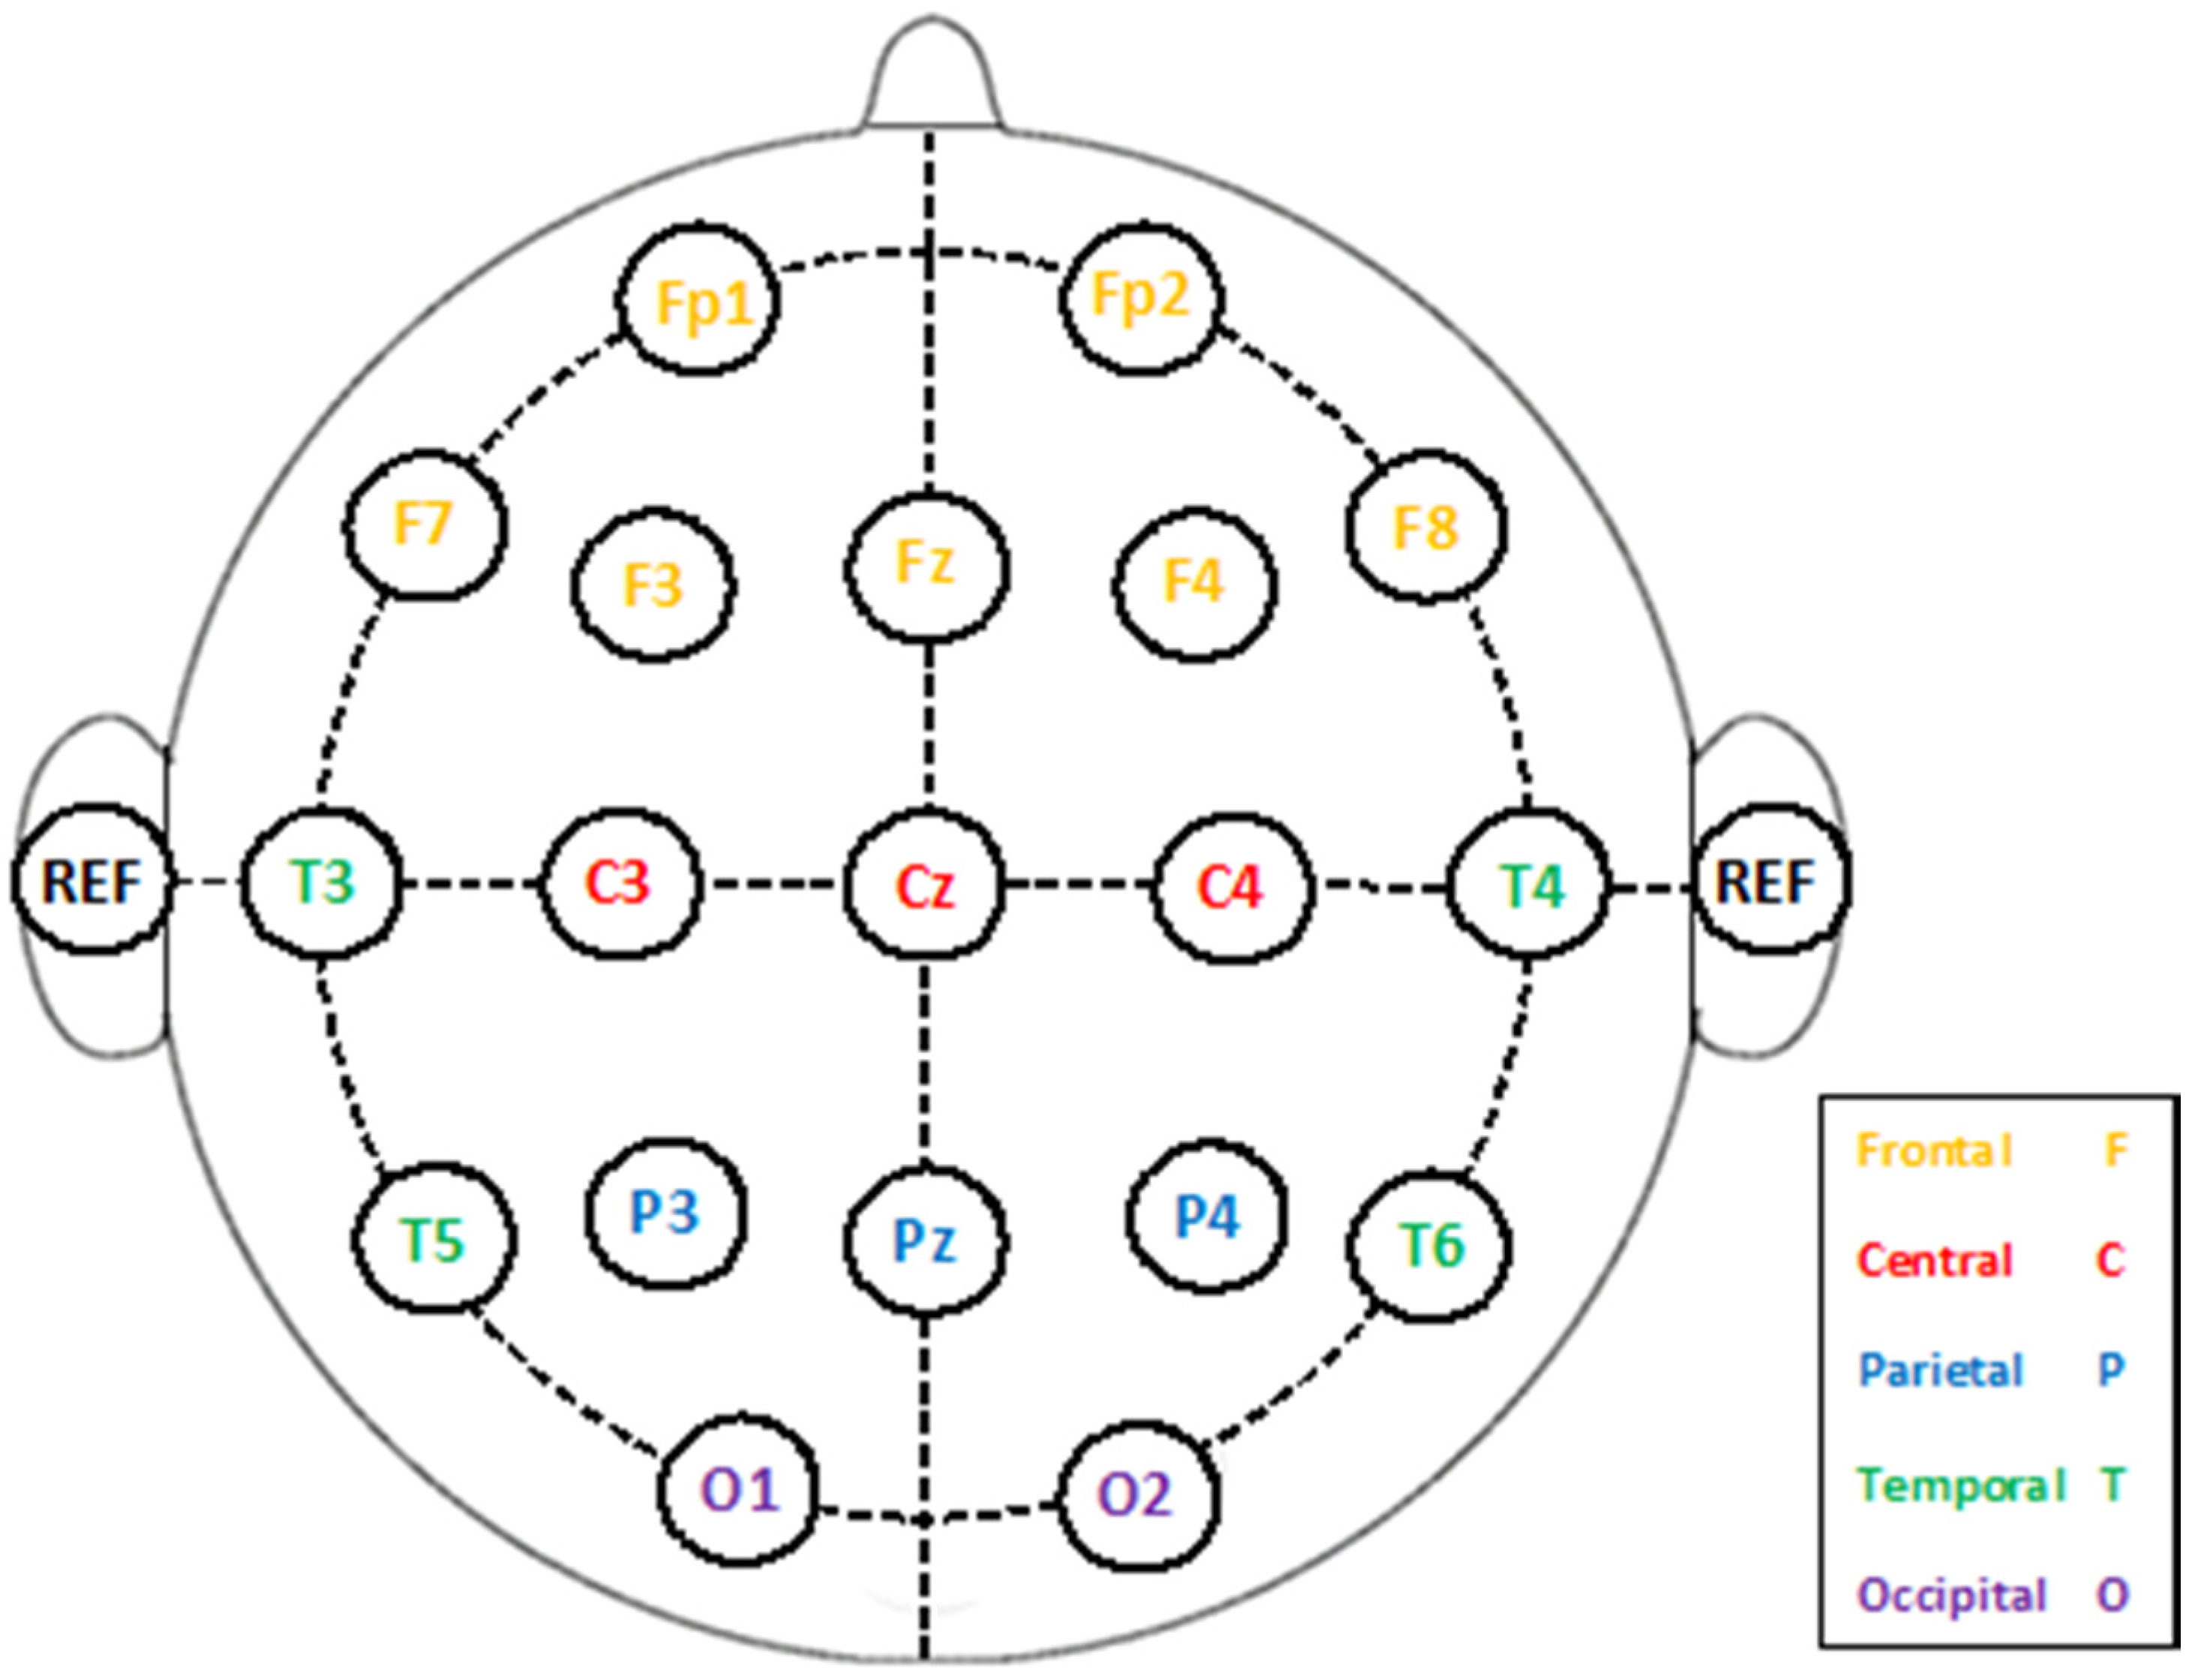
2.2. EEG Collection Procedure
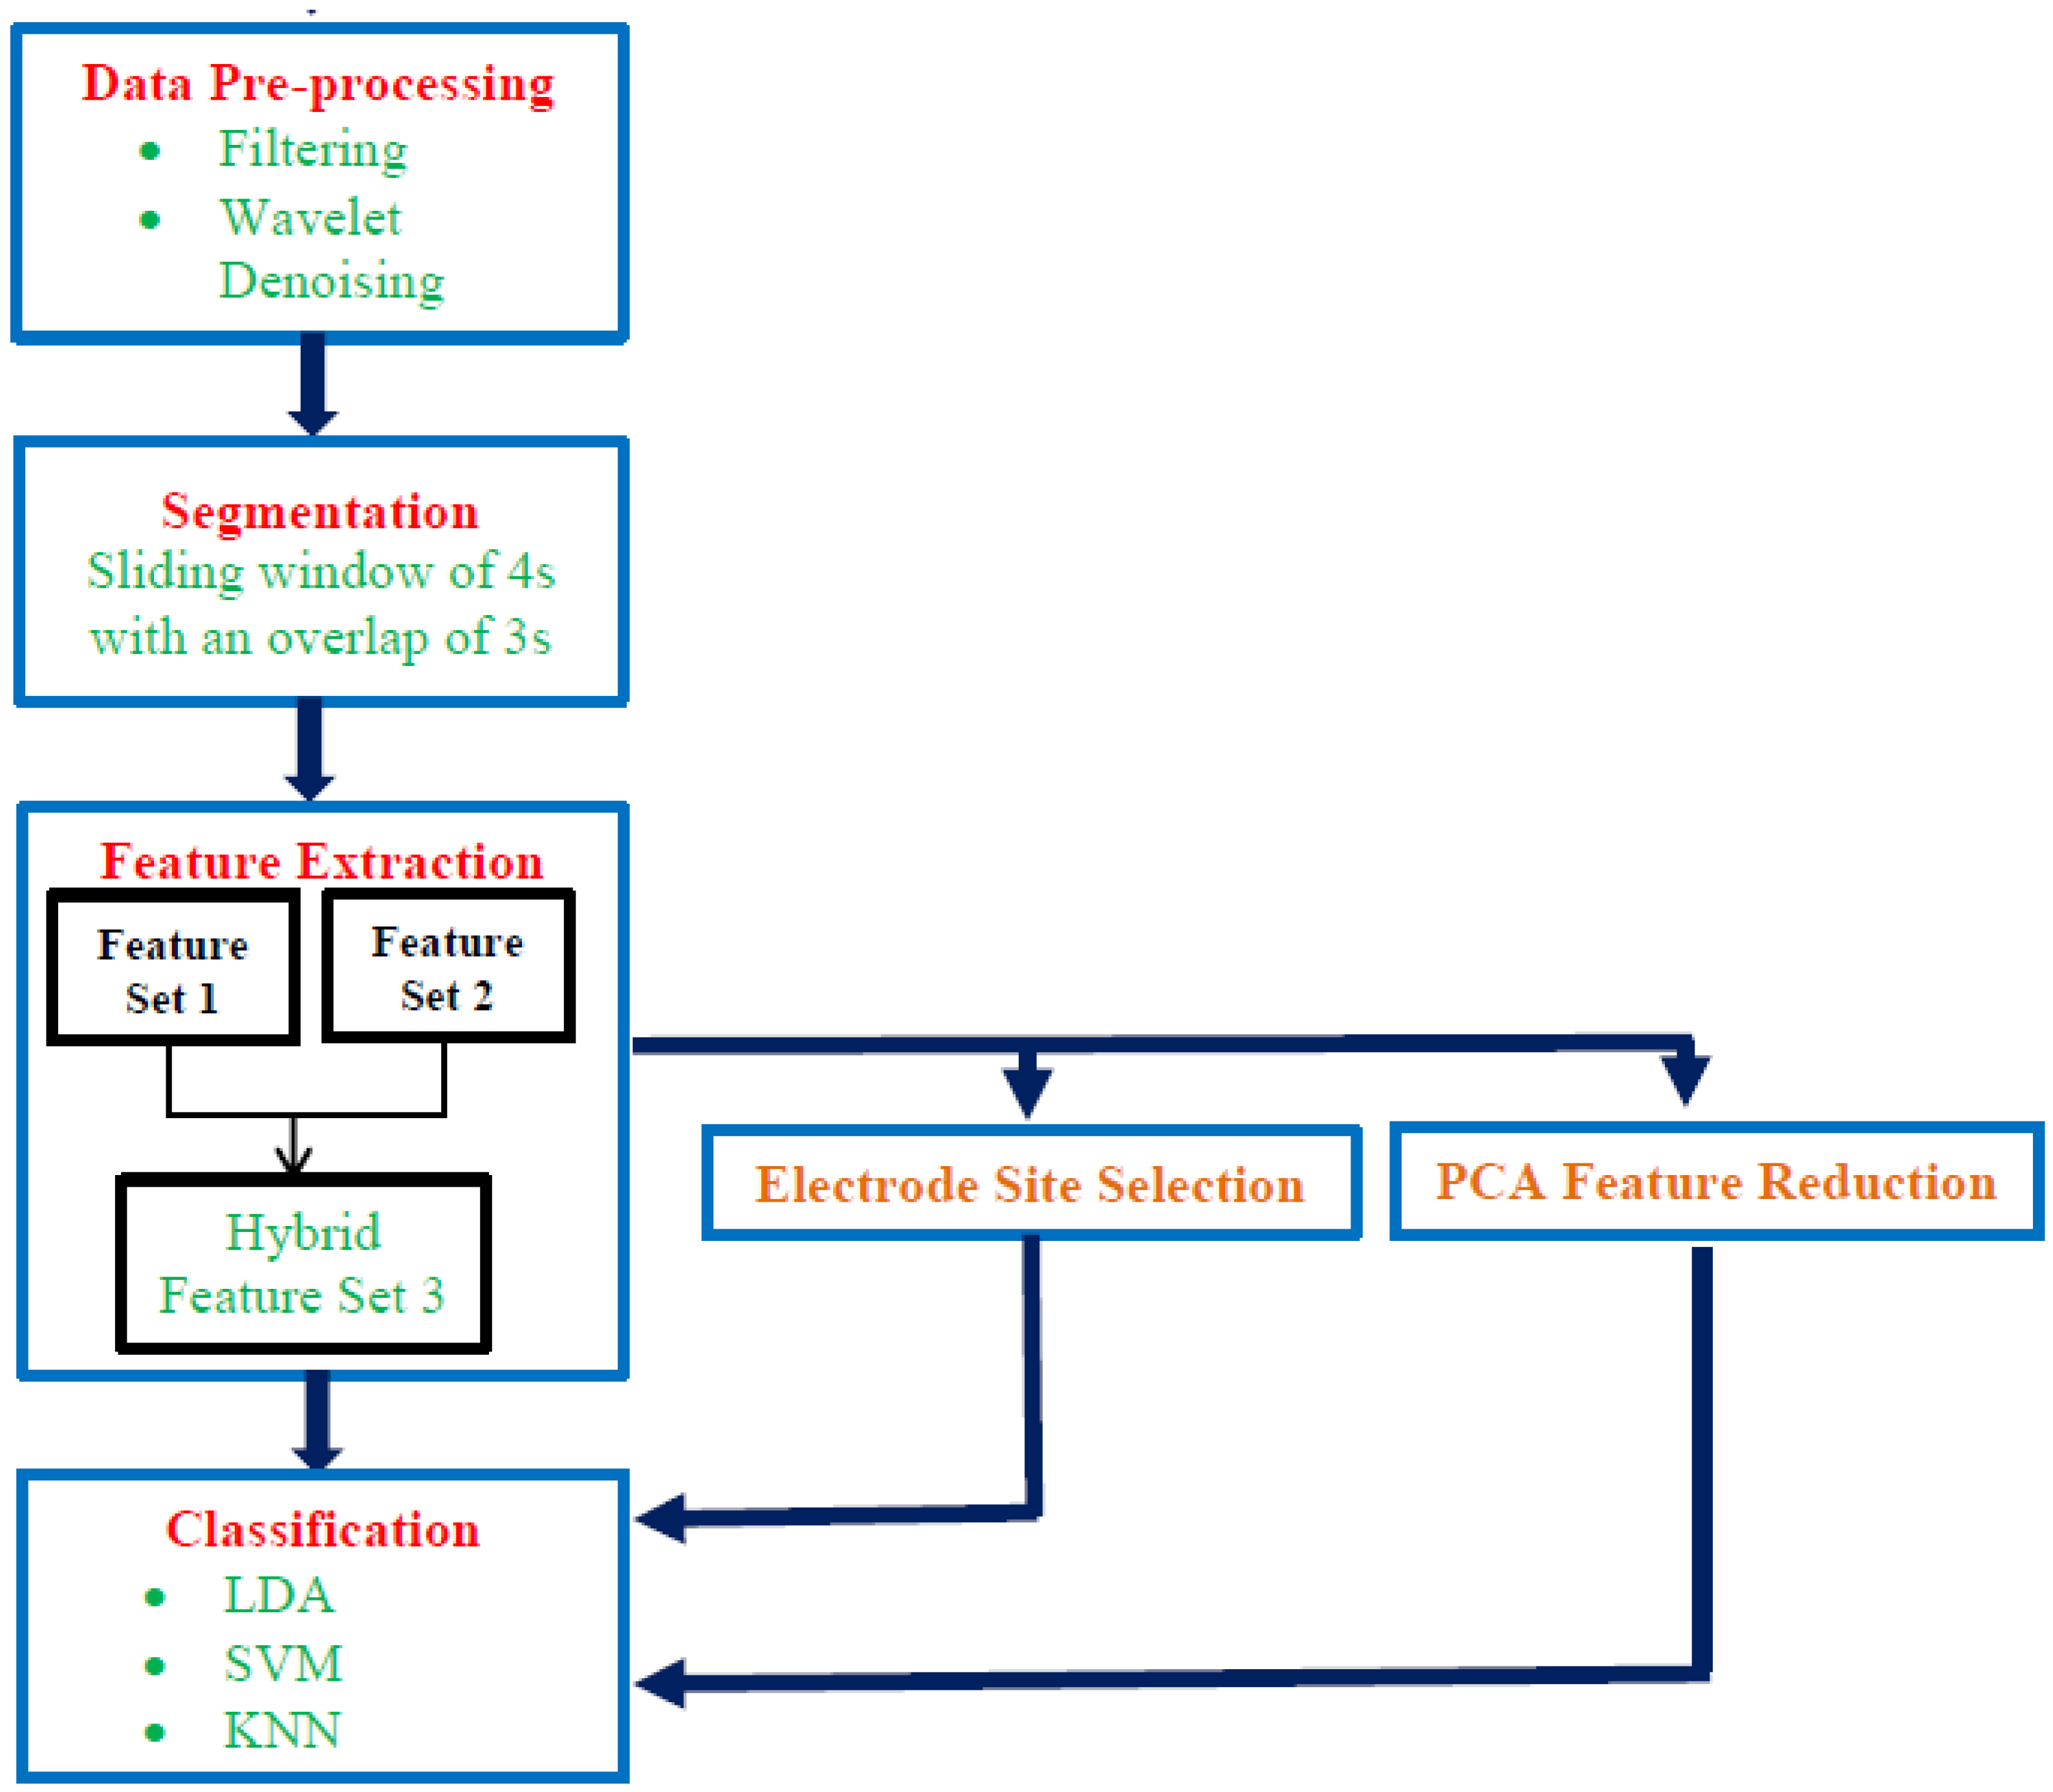
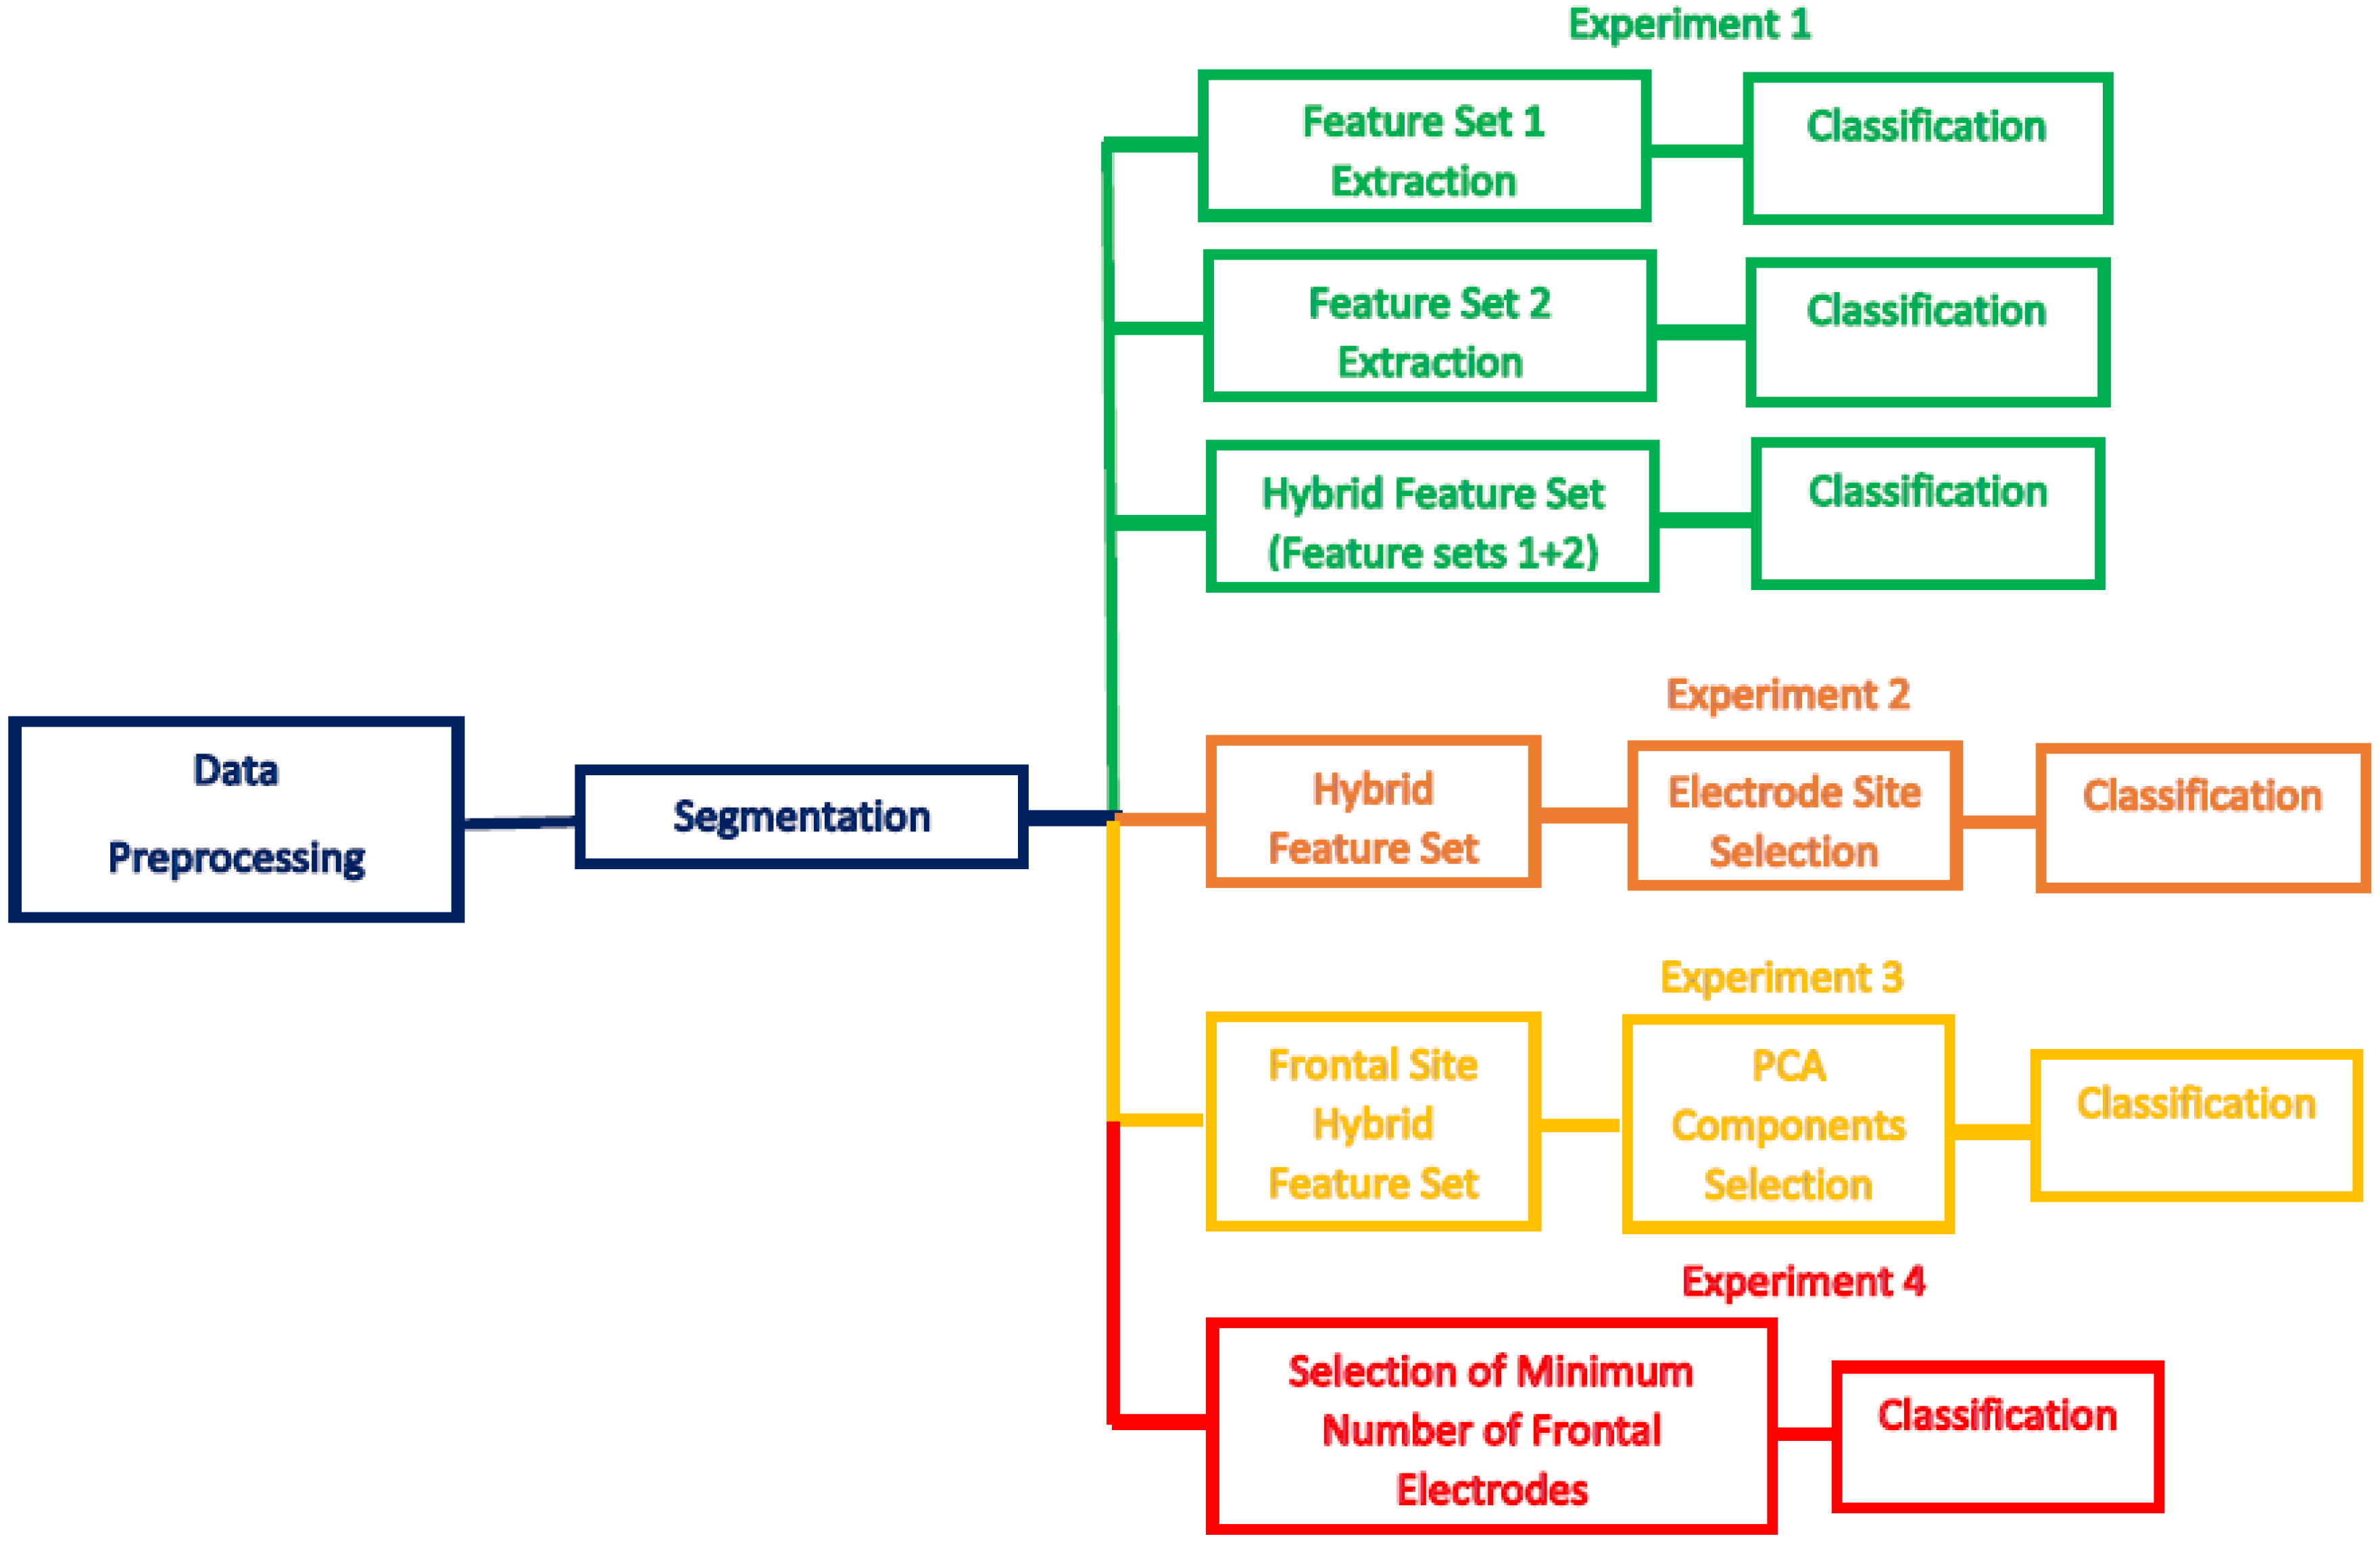
2.3. Proposed Mental Stress Detection System
2.3.1. Data Preprocessing
2.3.2. Segmentation
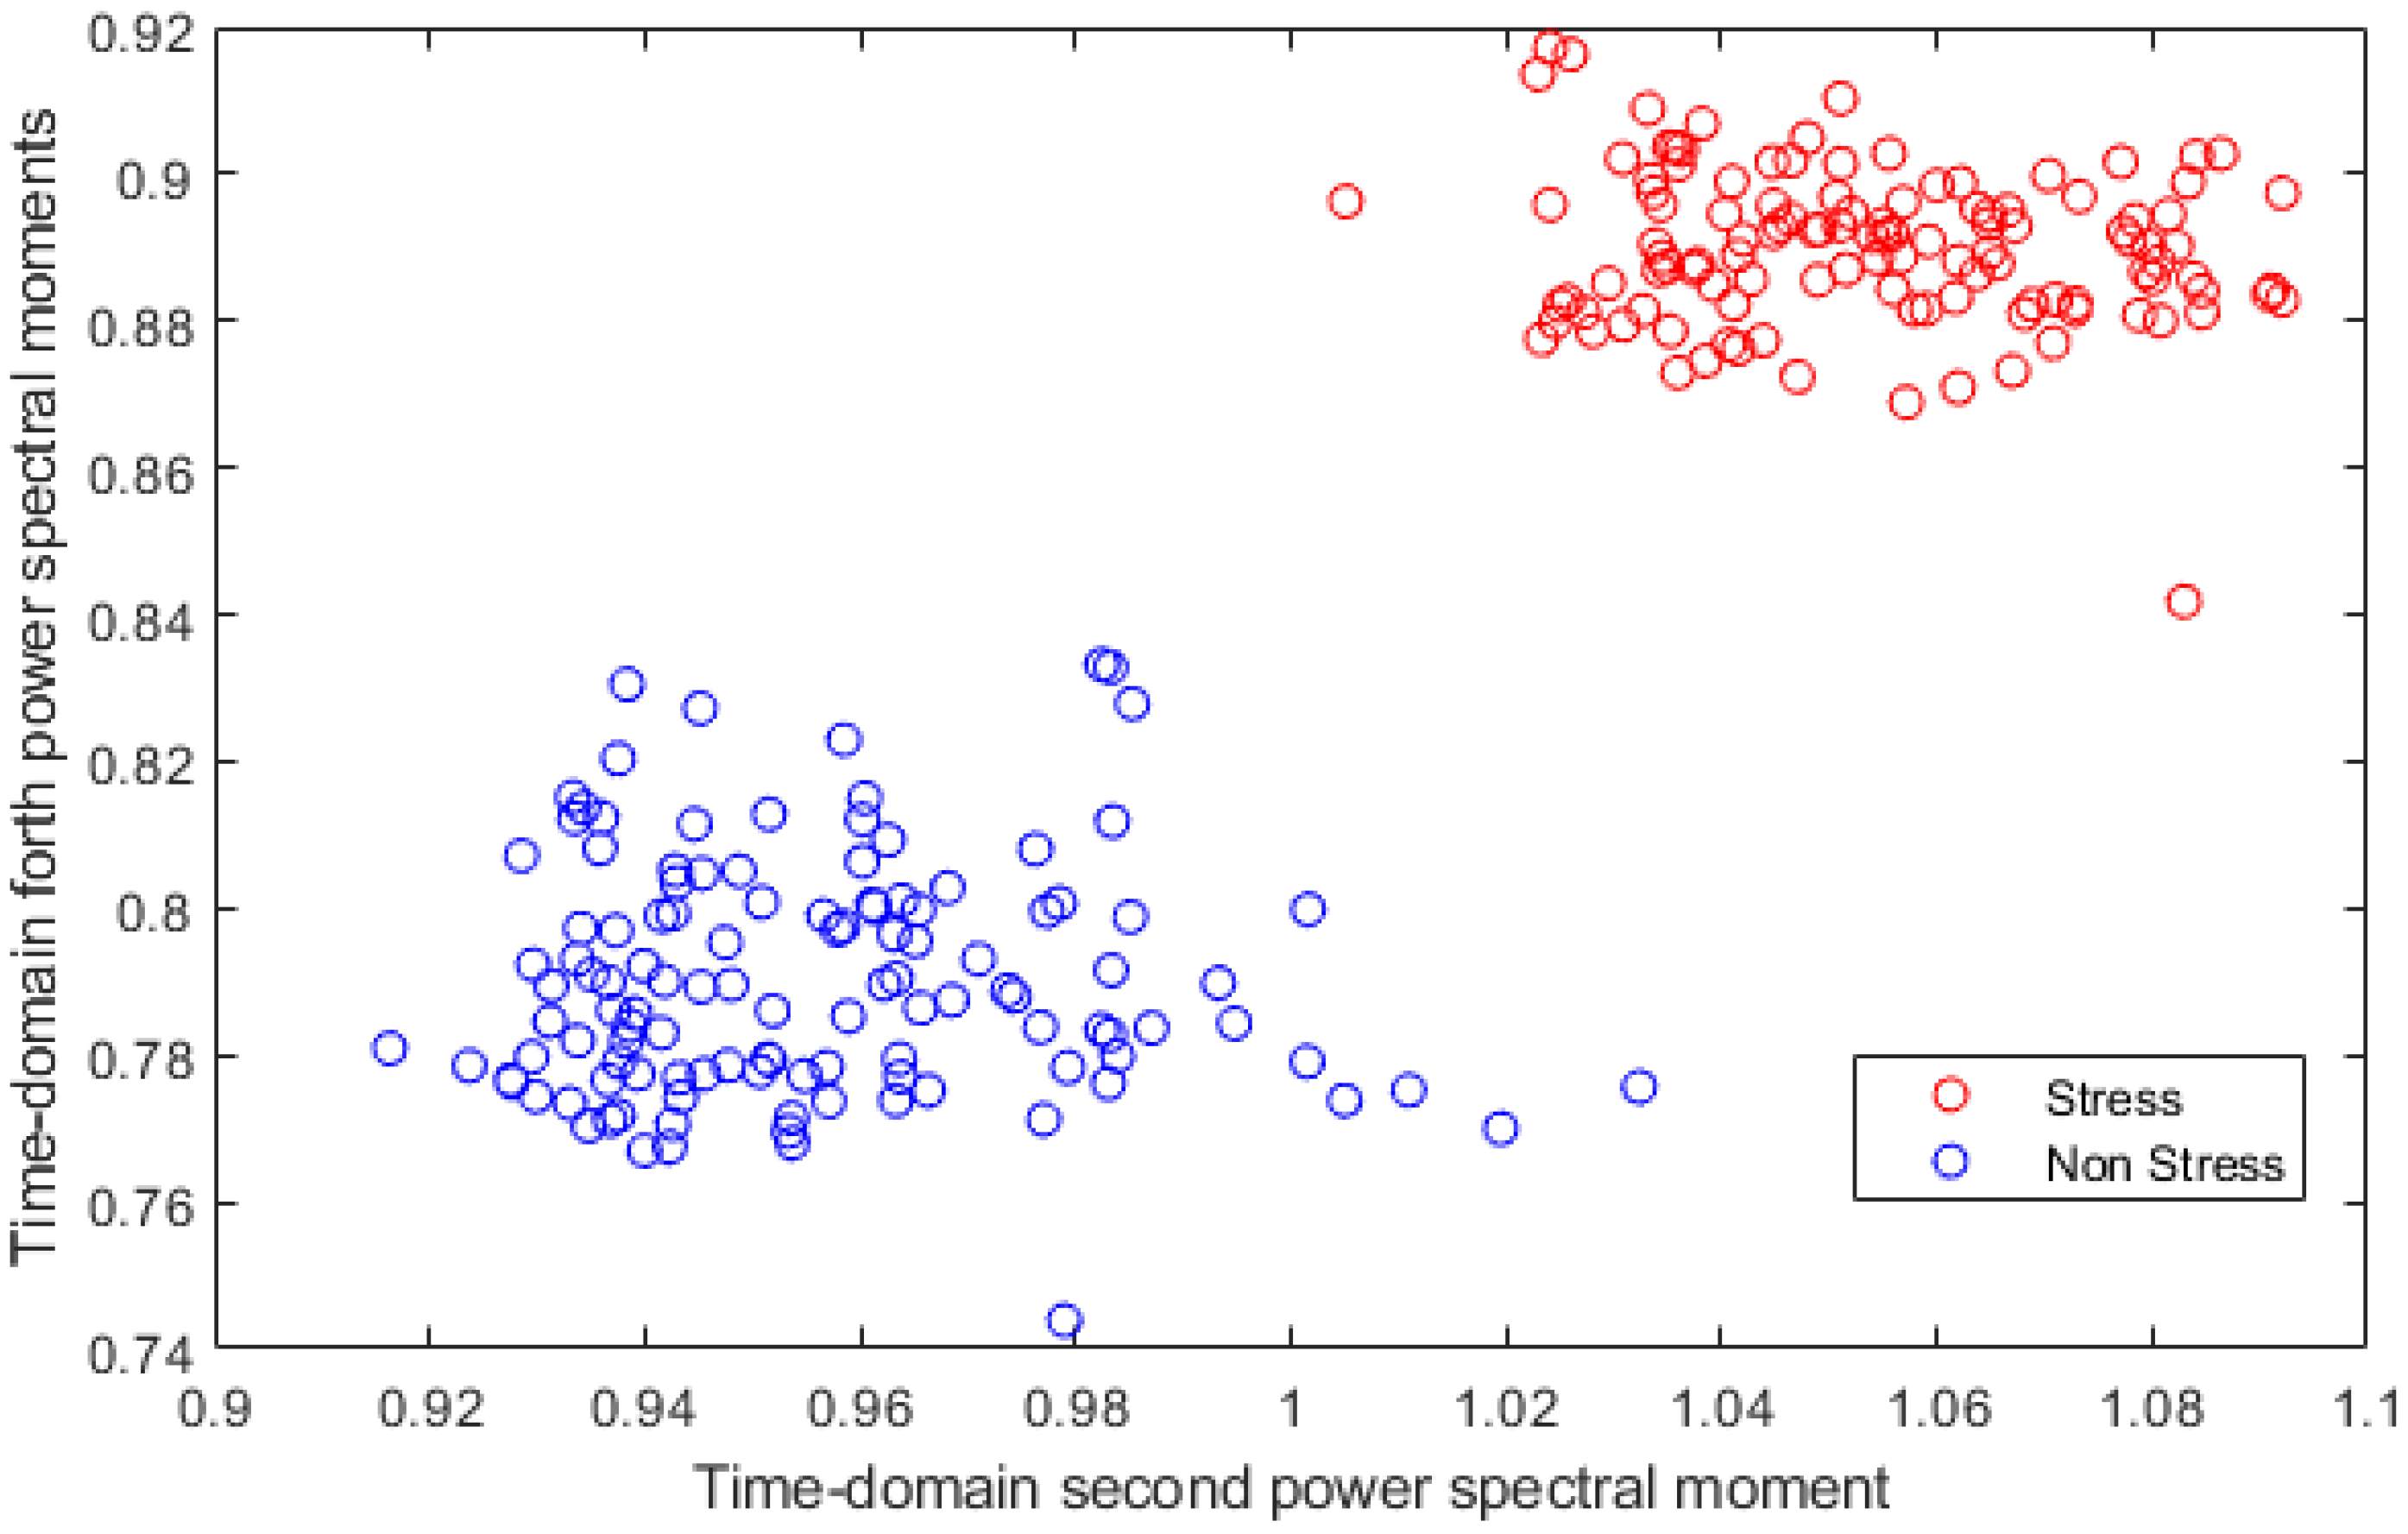
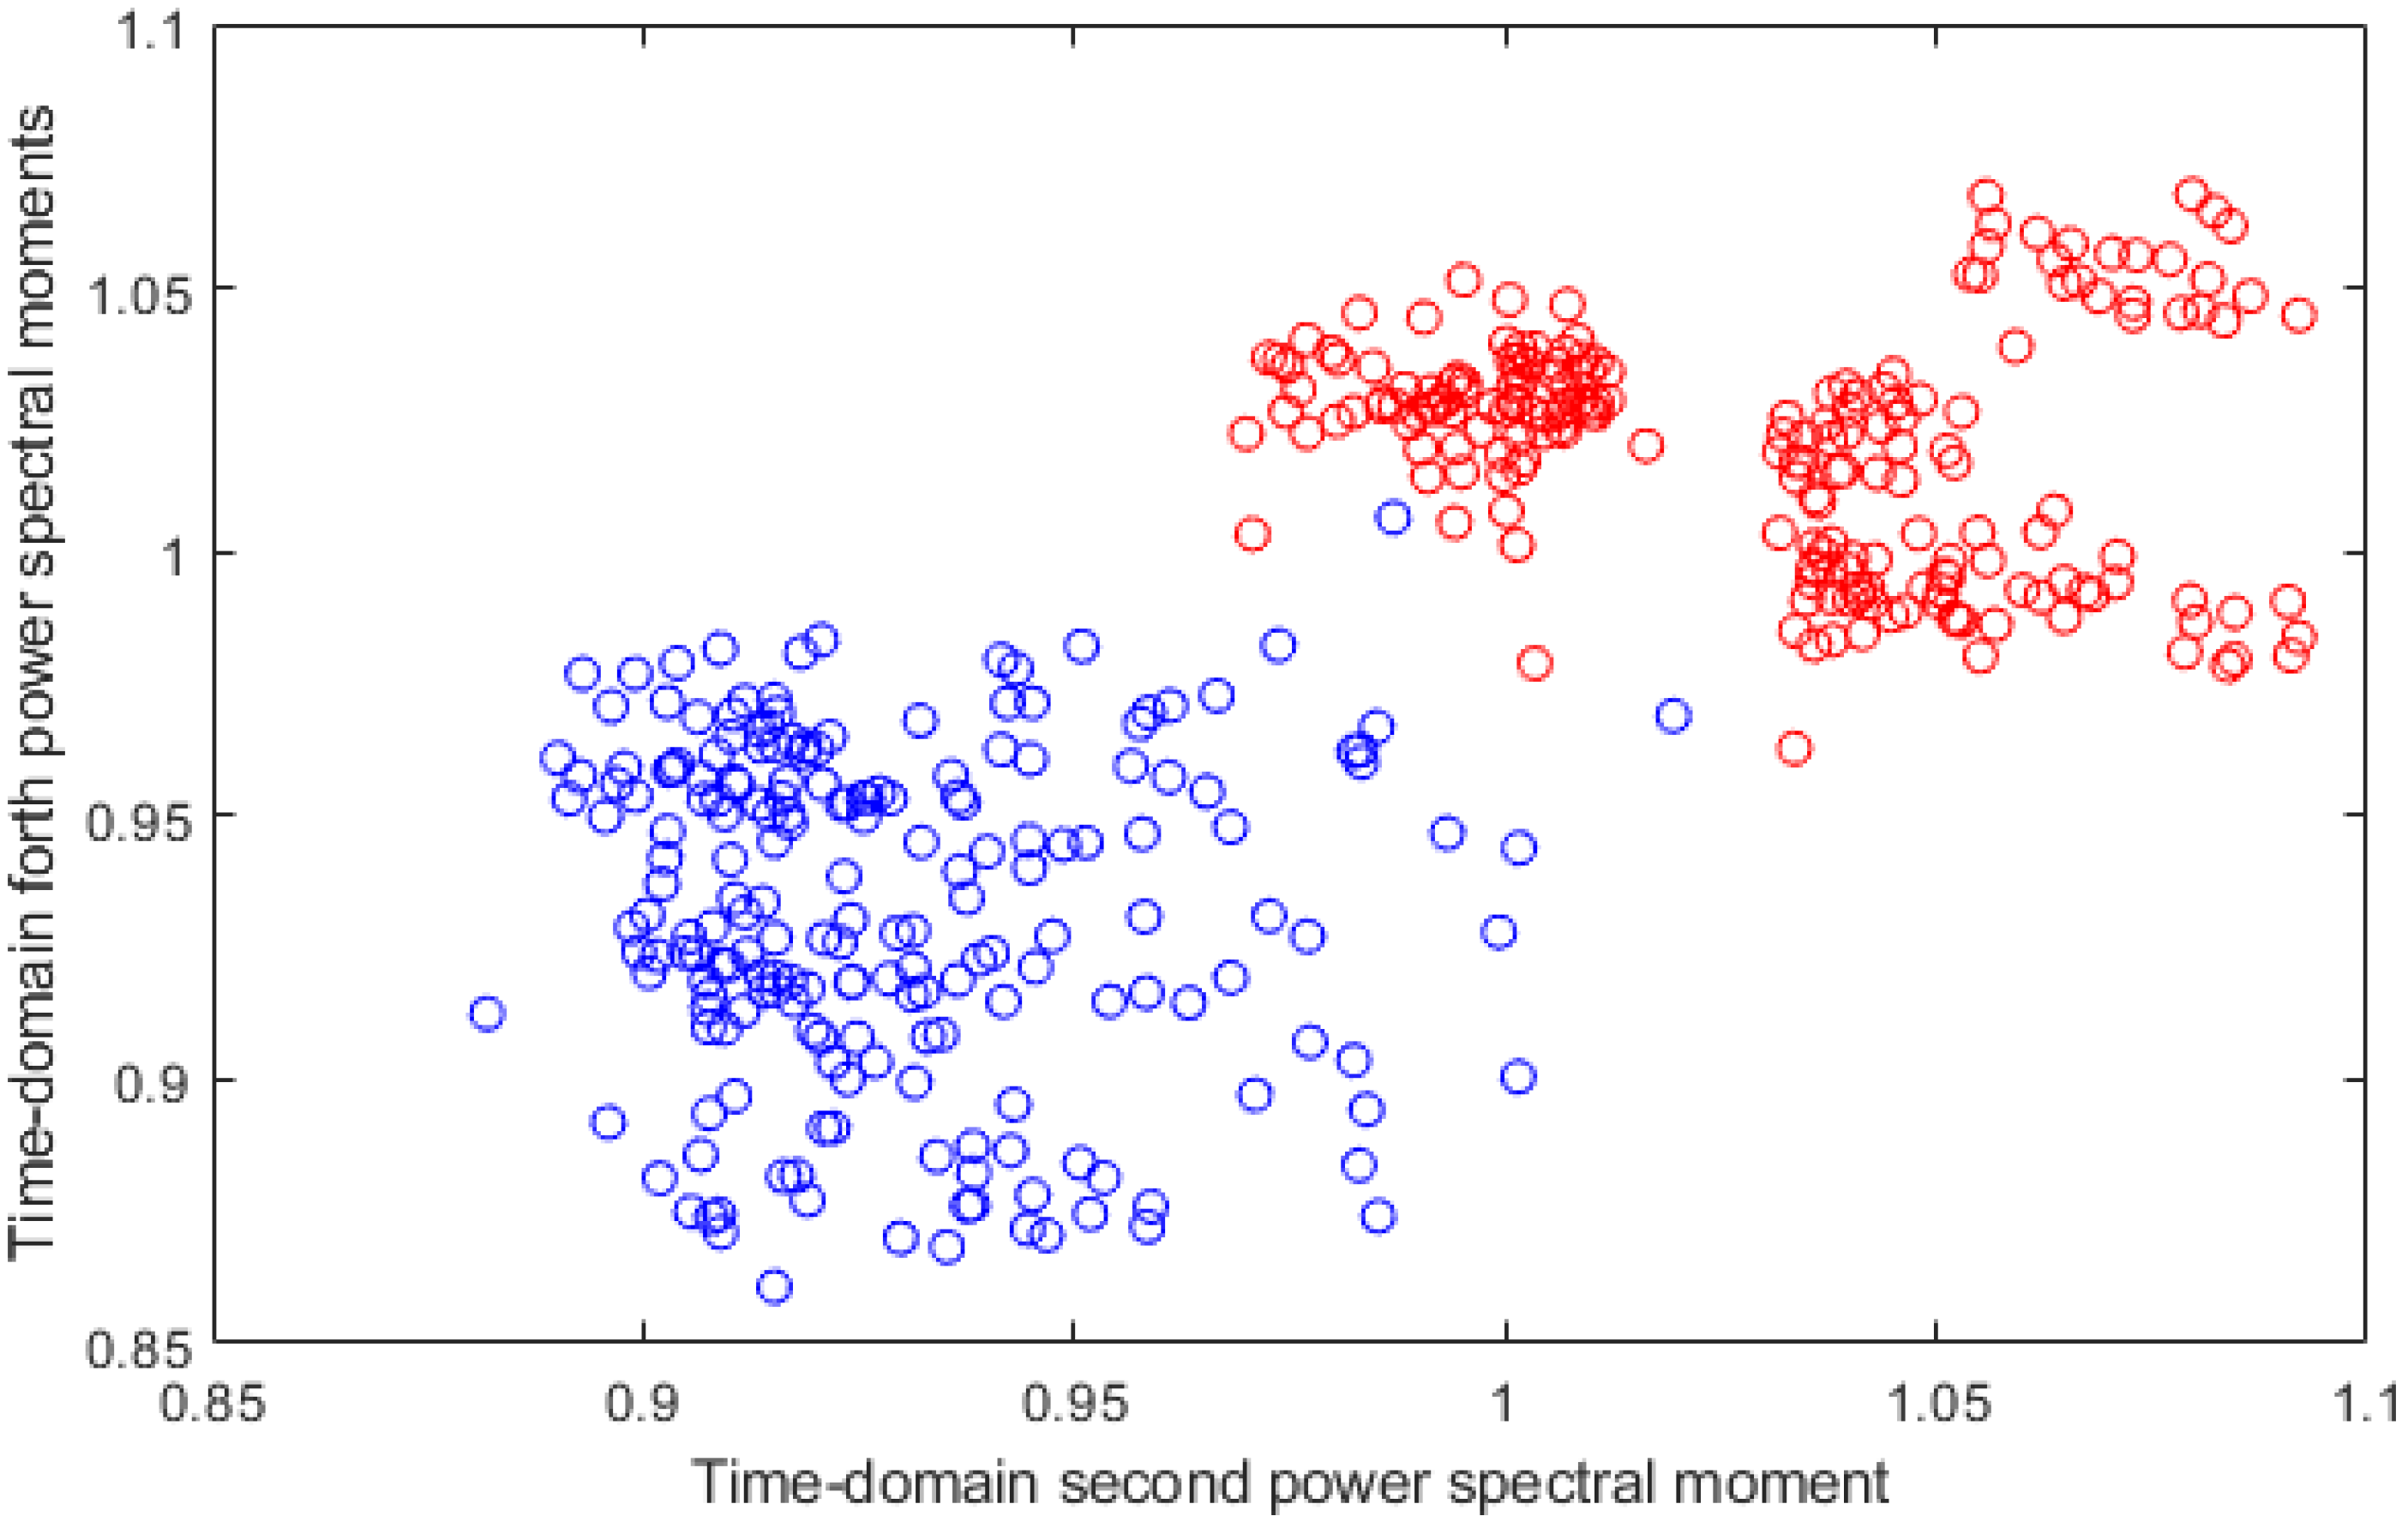
2.3.3. Feature Extraction
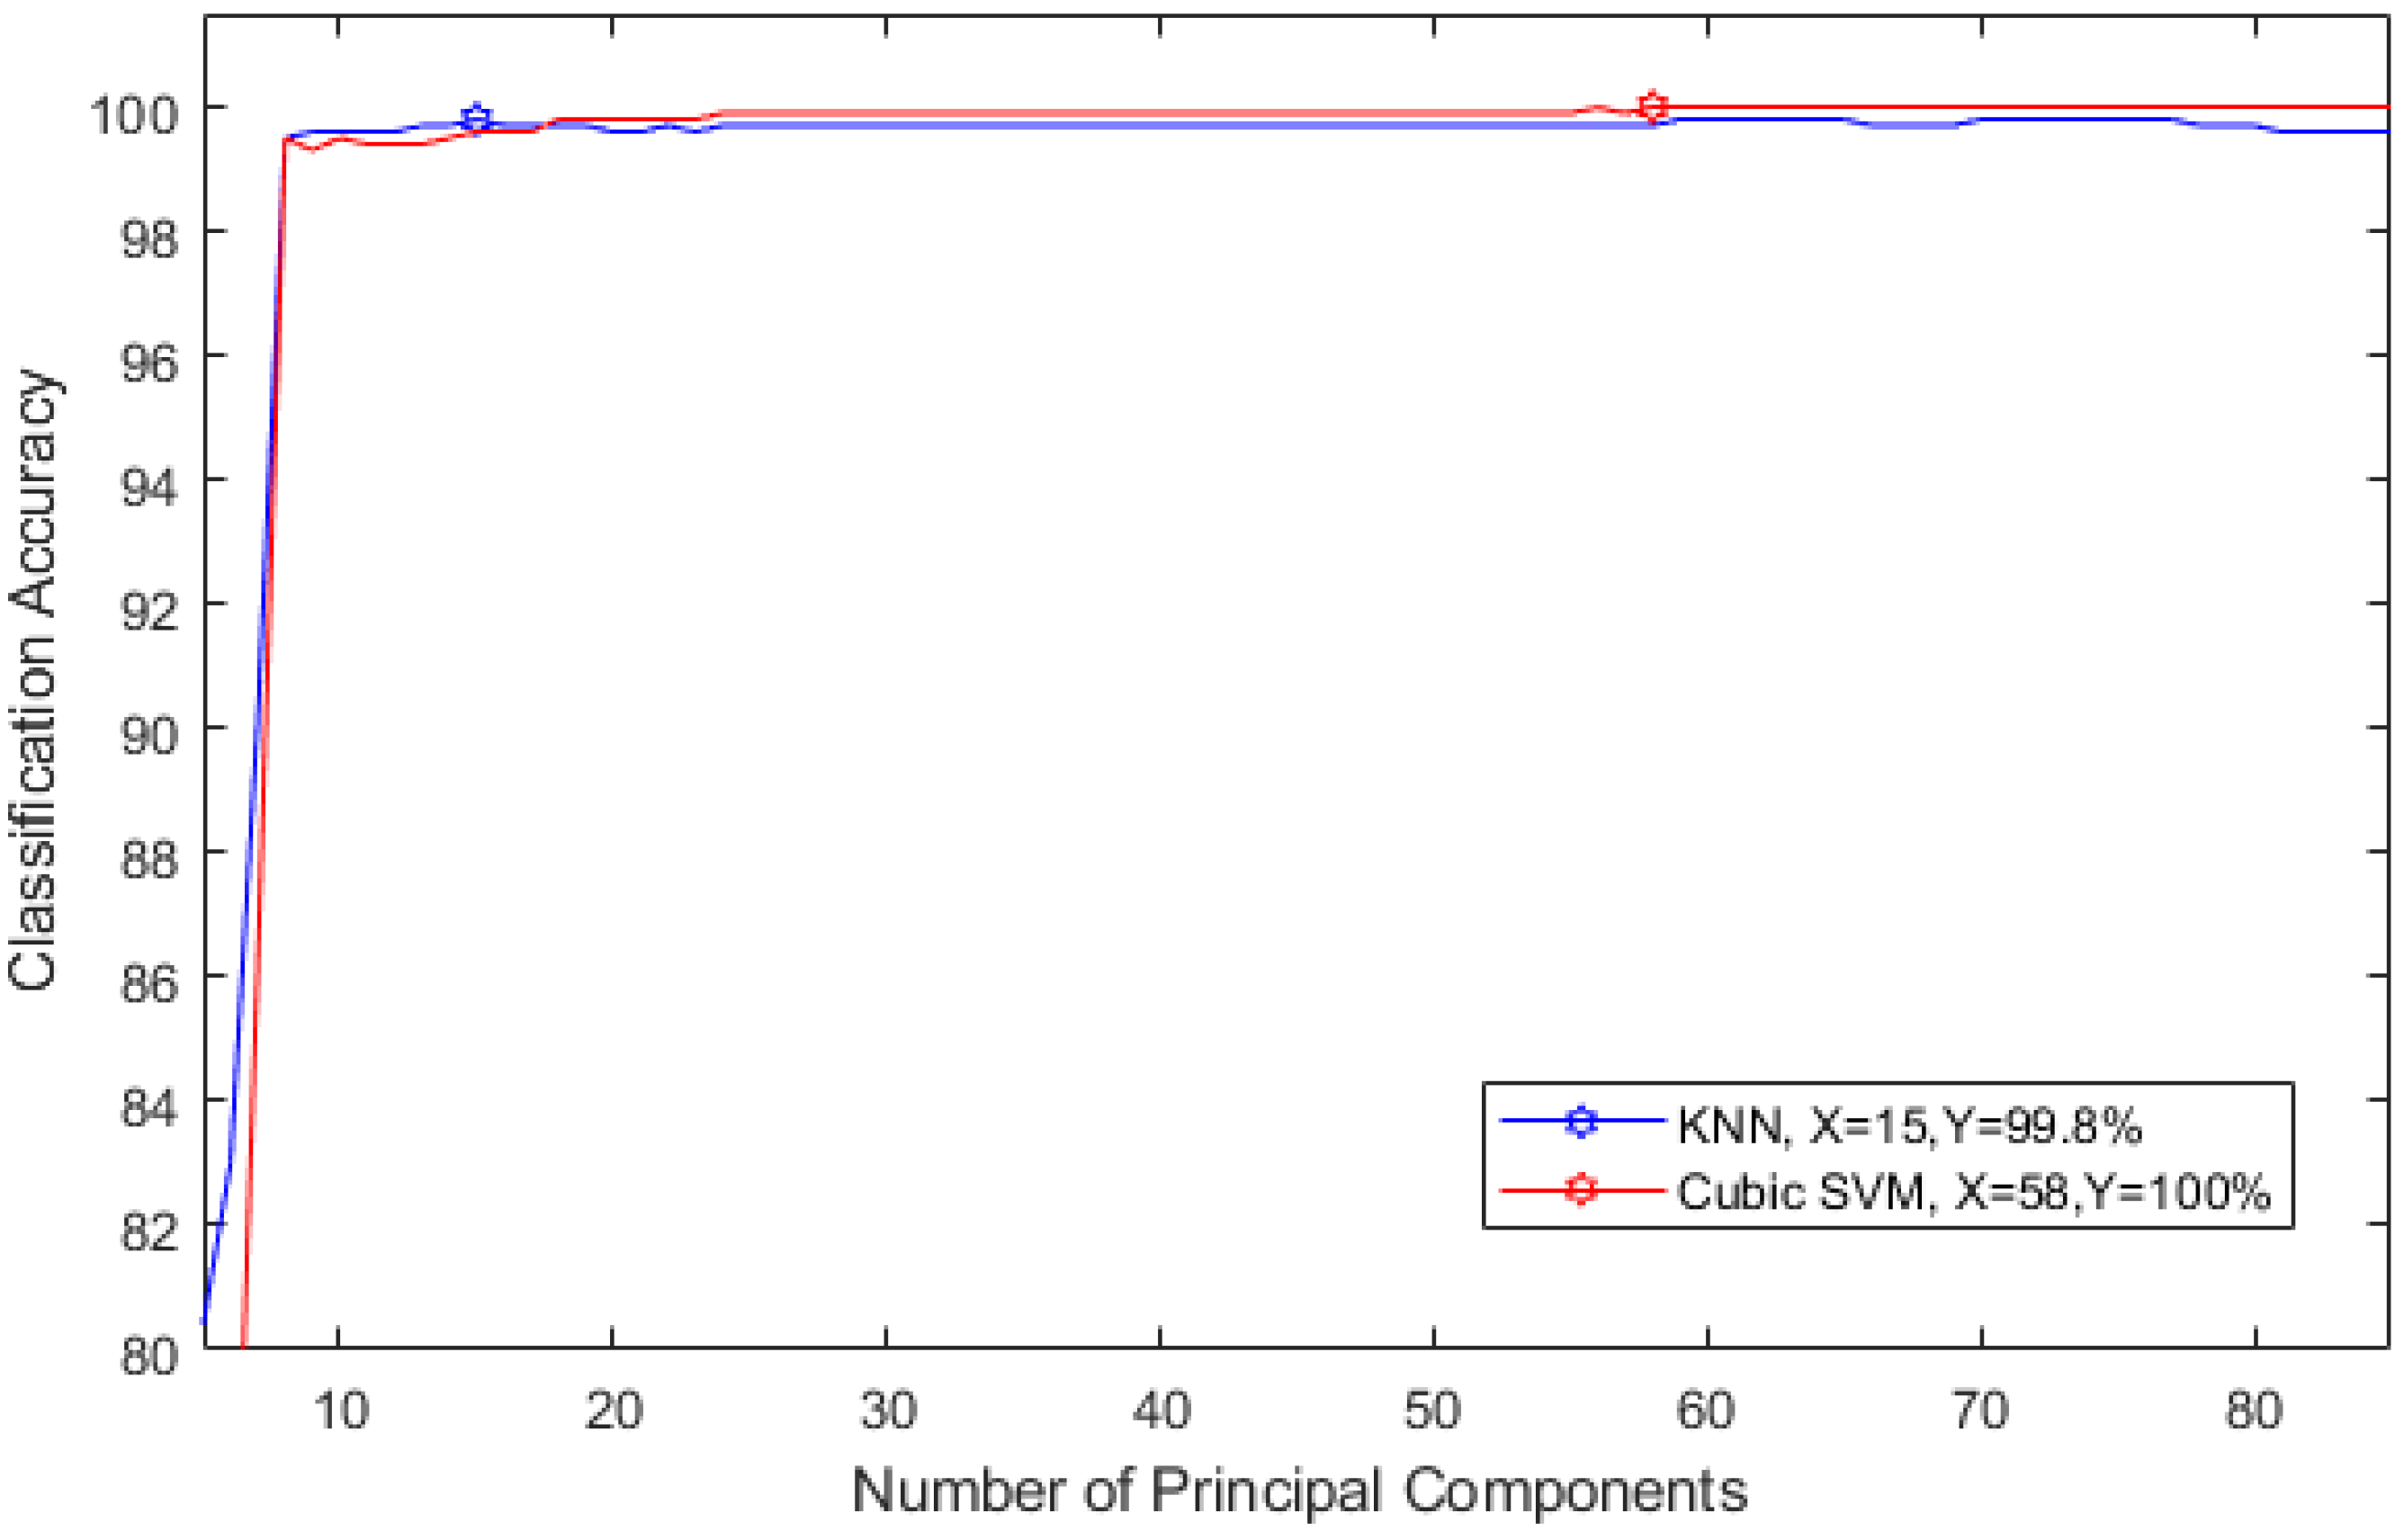
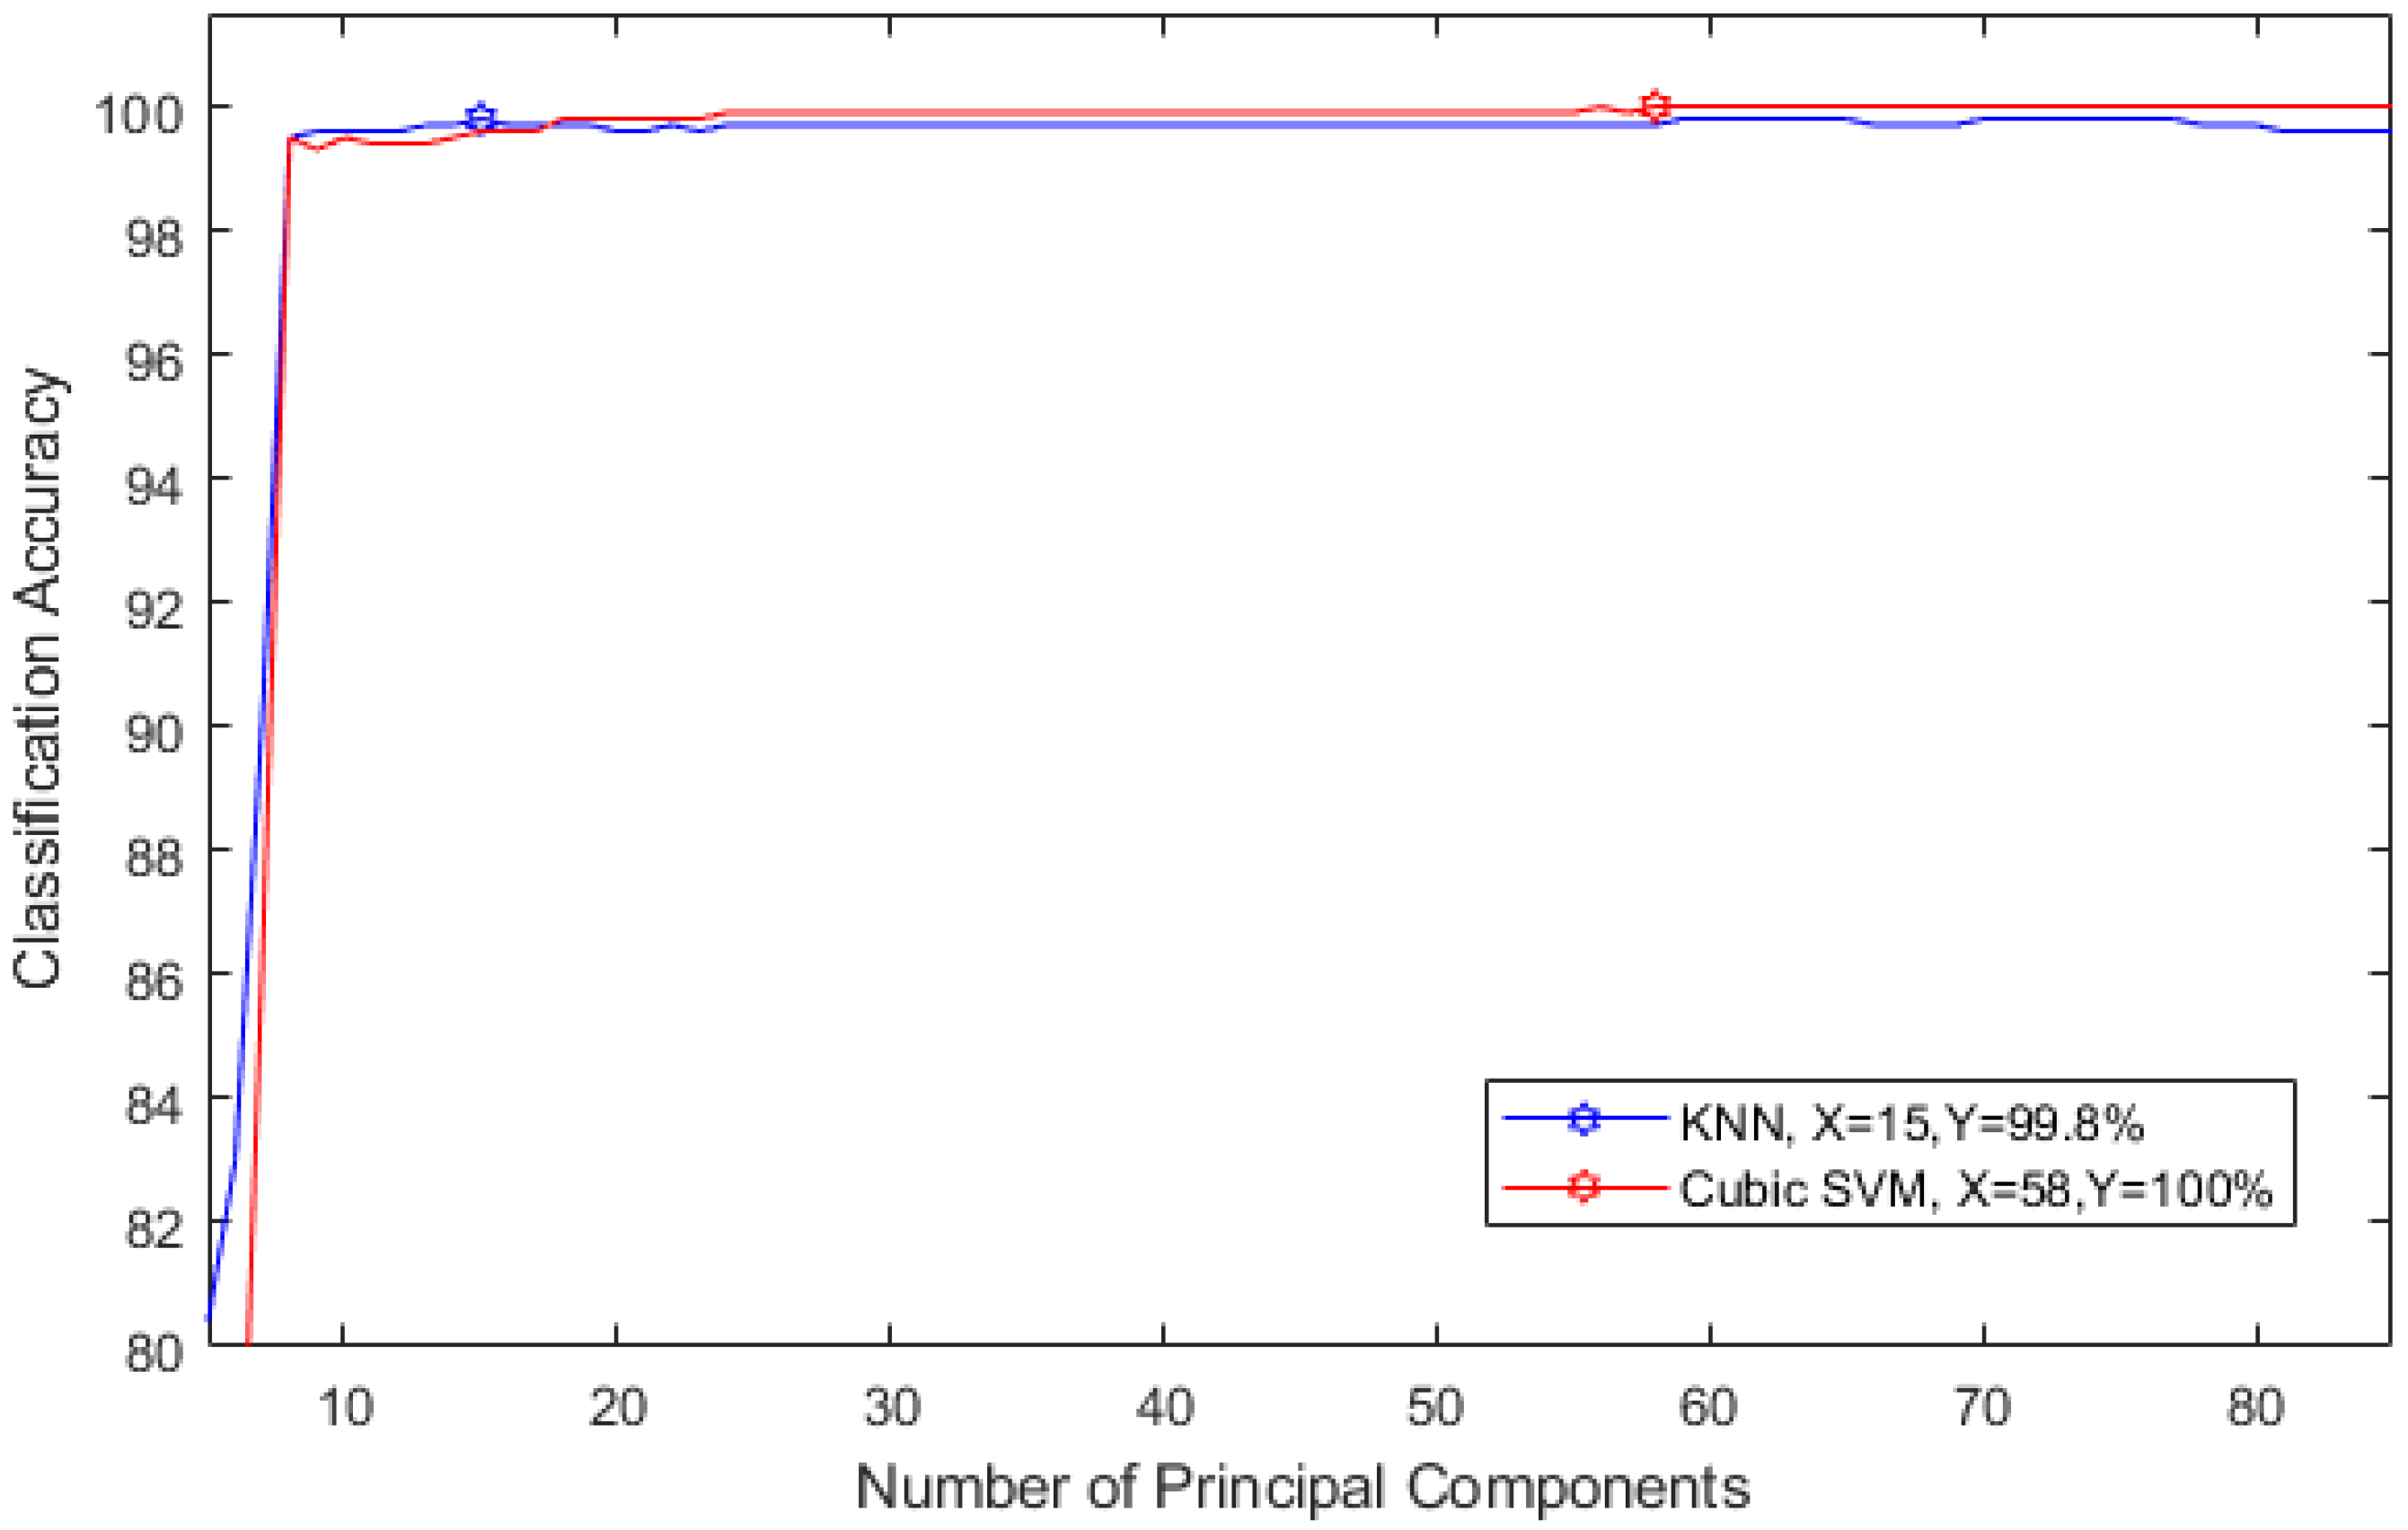
2.3.4. Feature Reduction
2.3.5. Classification
2.4. Performance Evaluation
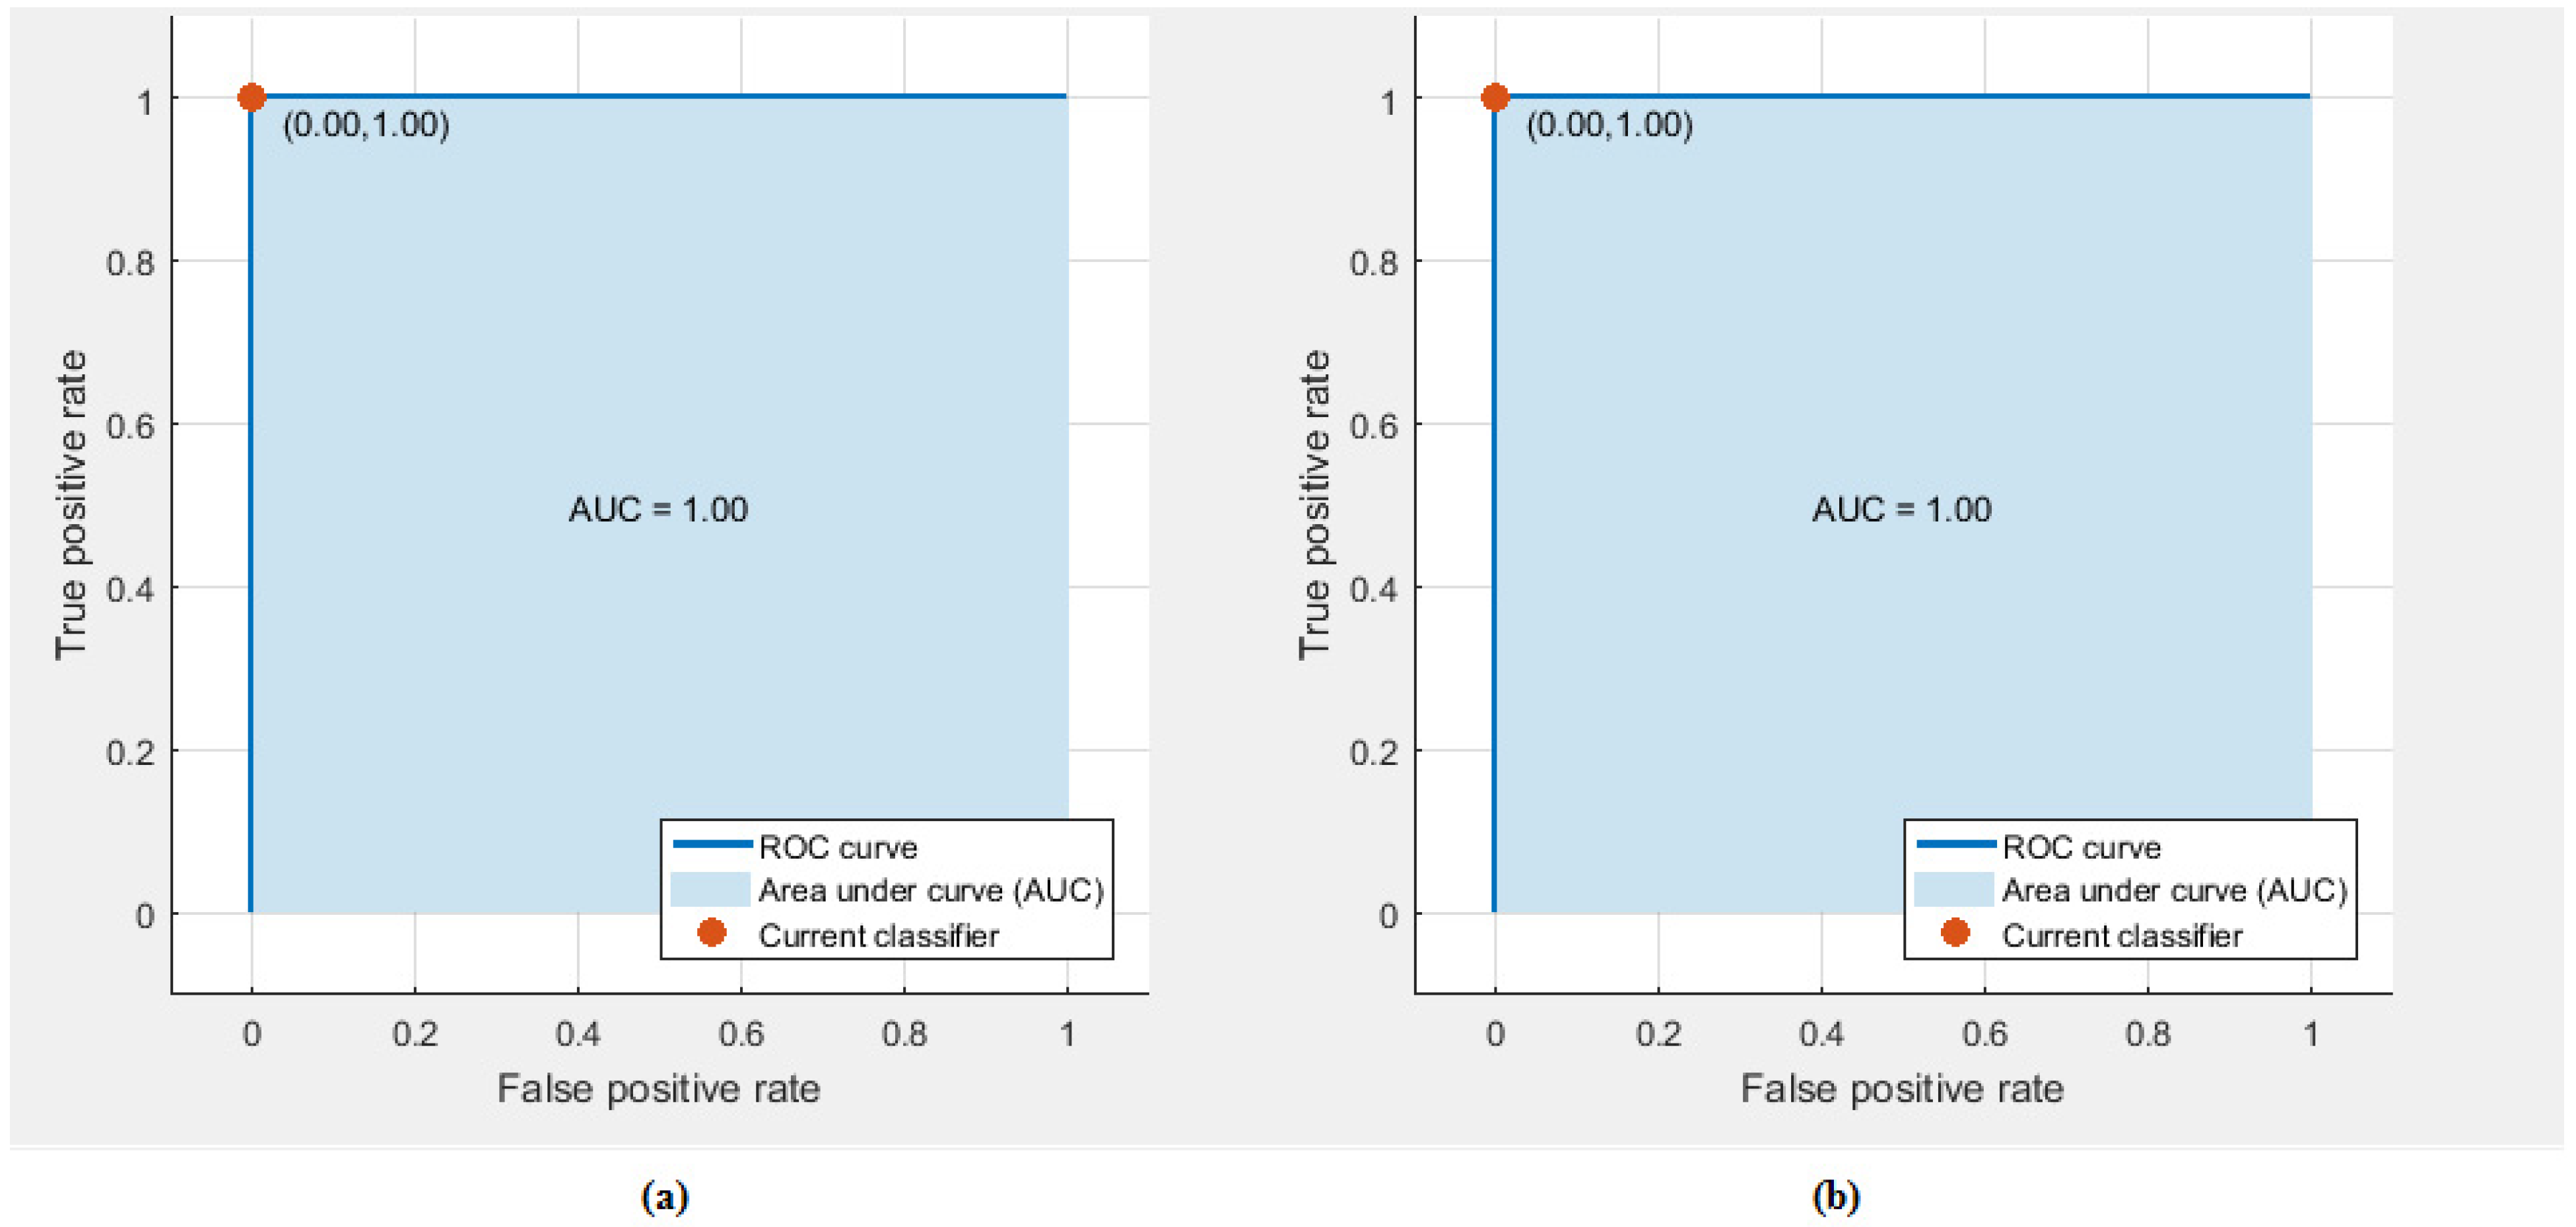
3. Results
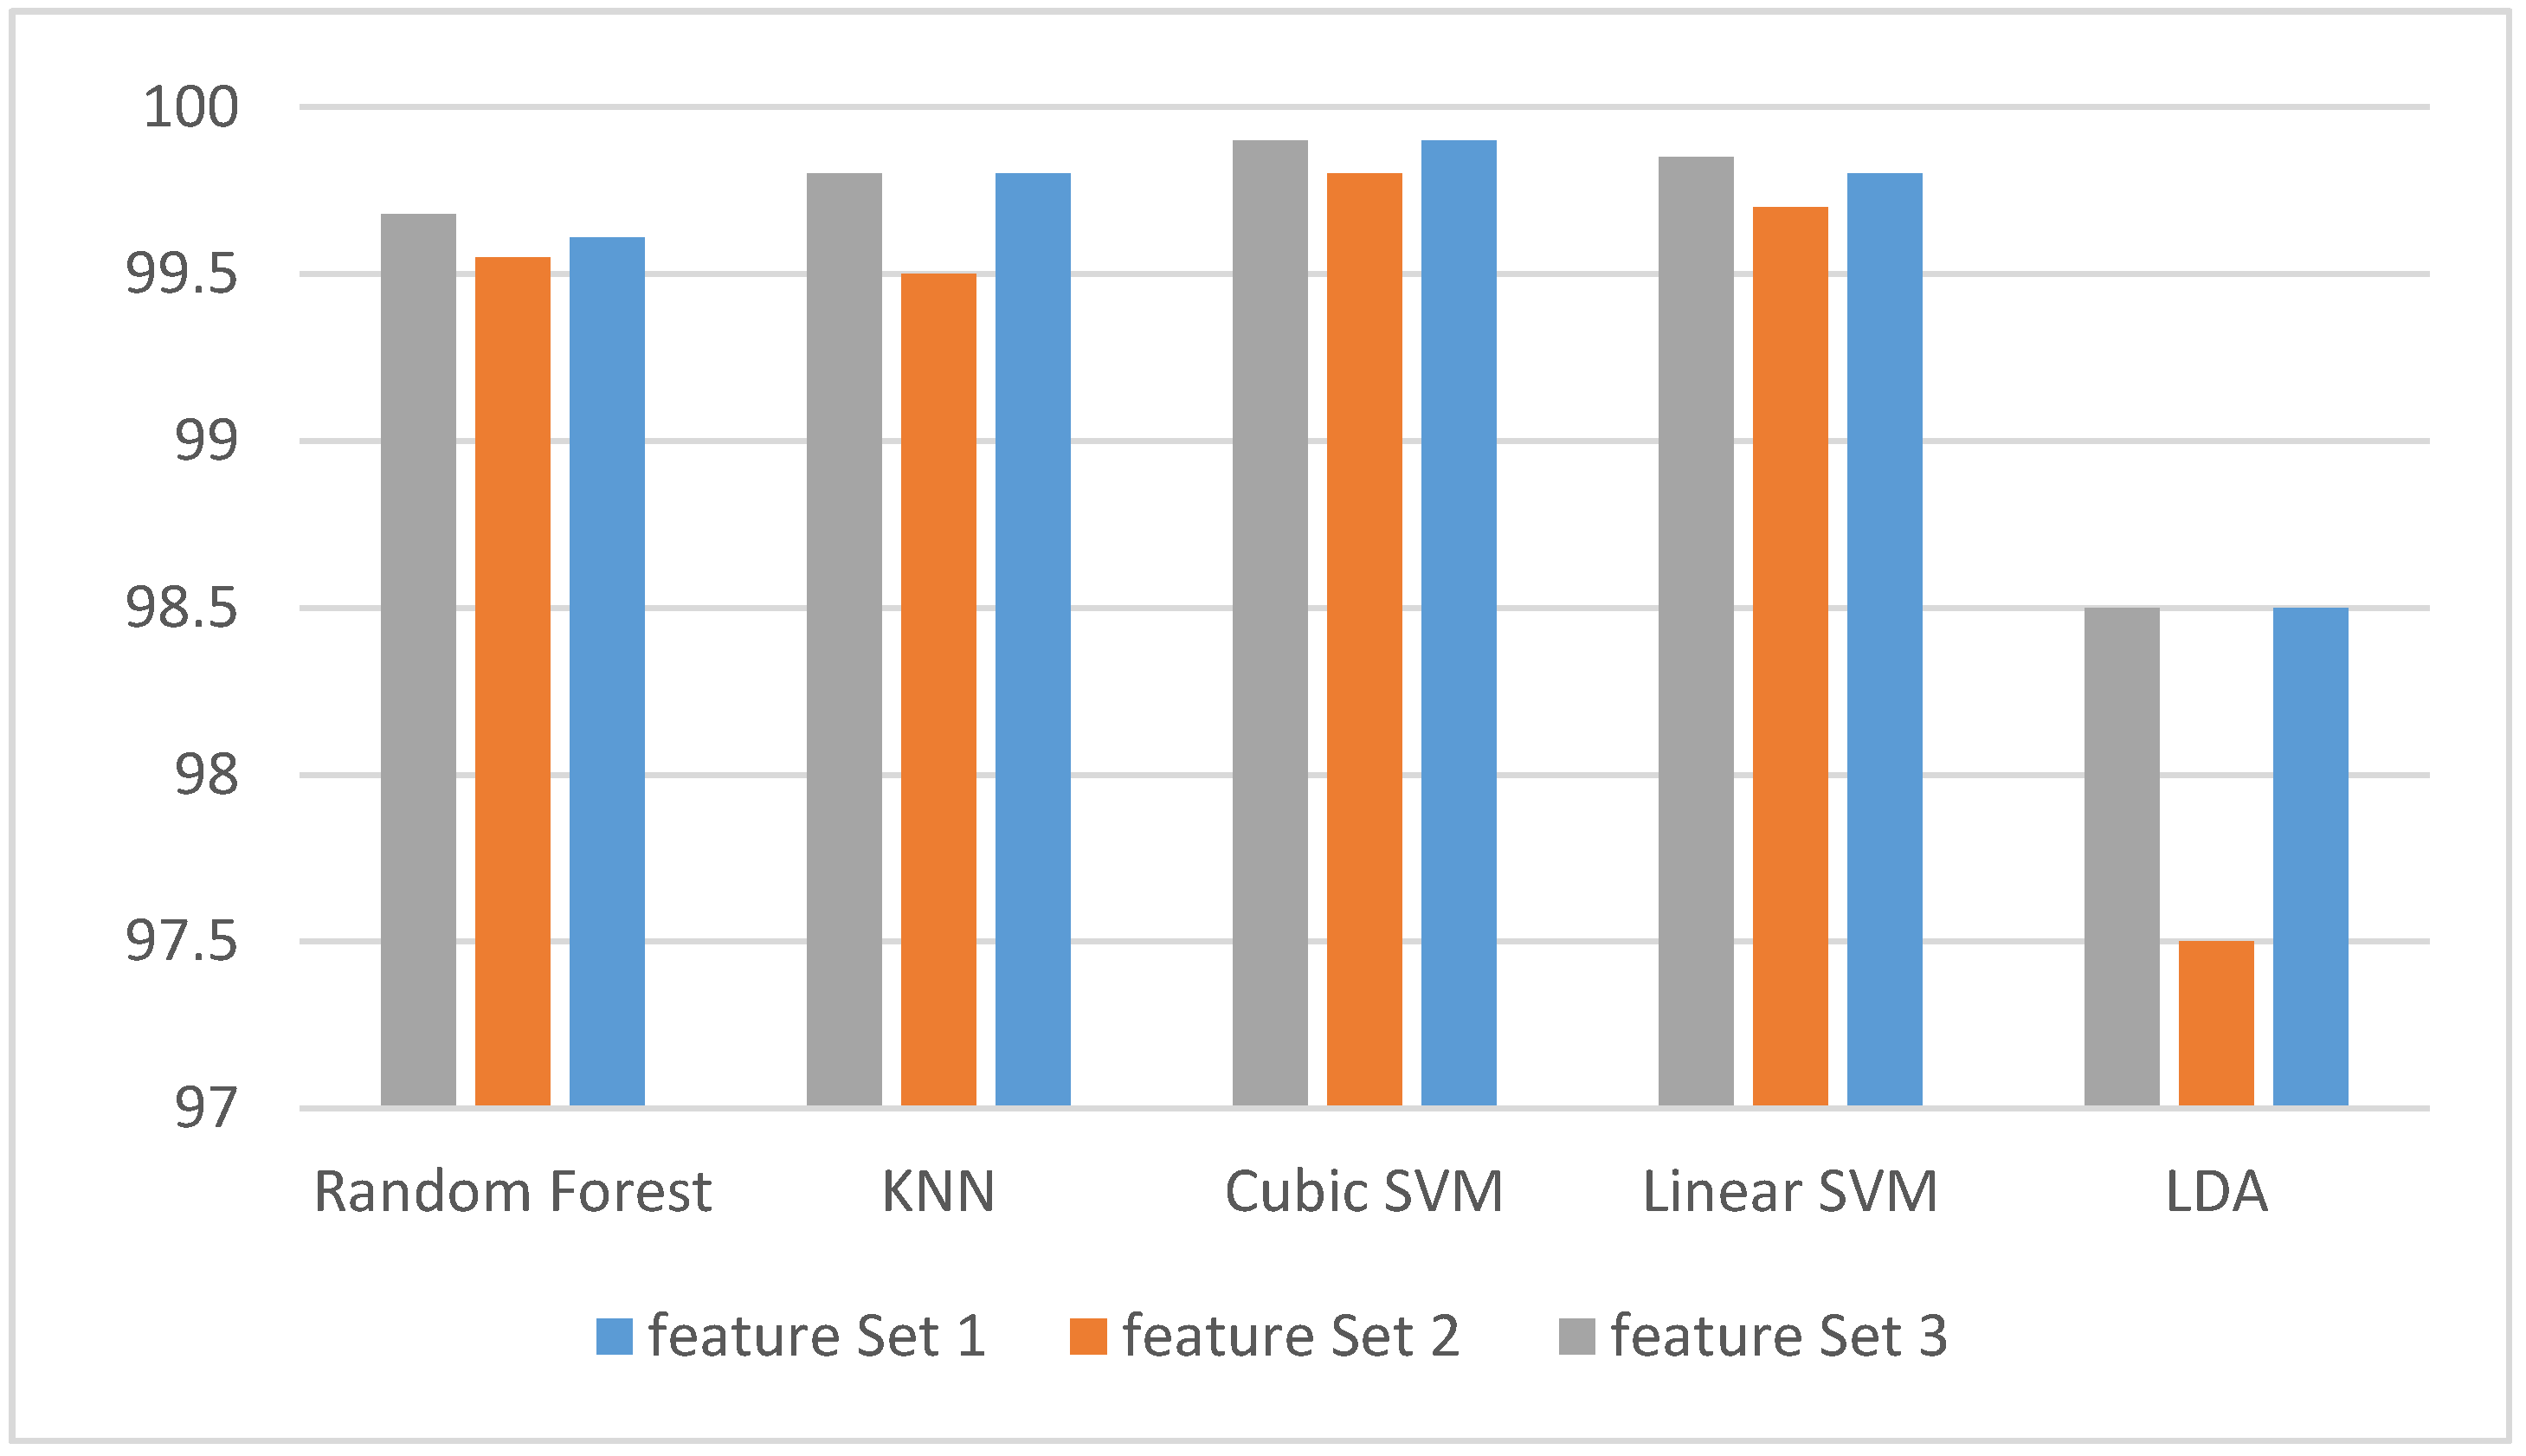
3.1. Experiment One Results
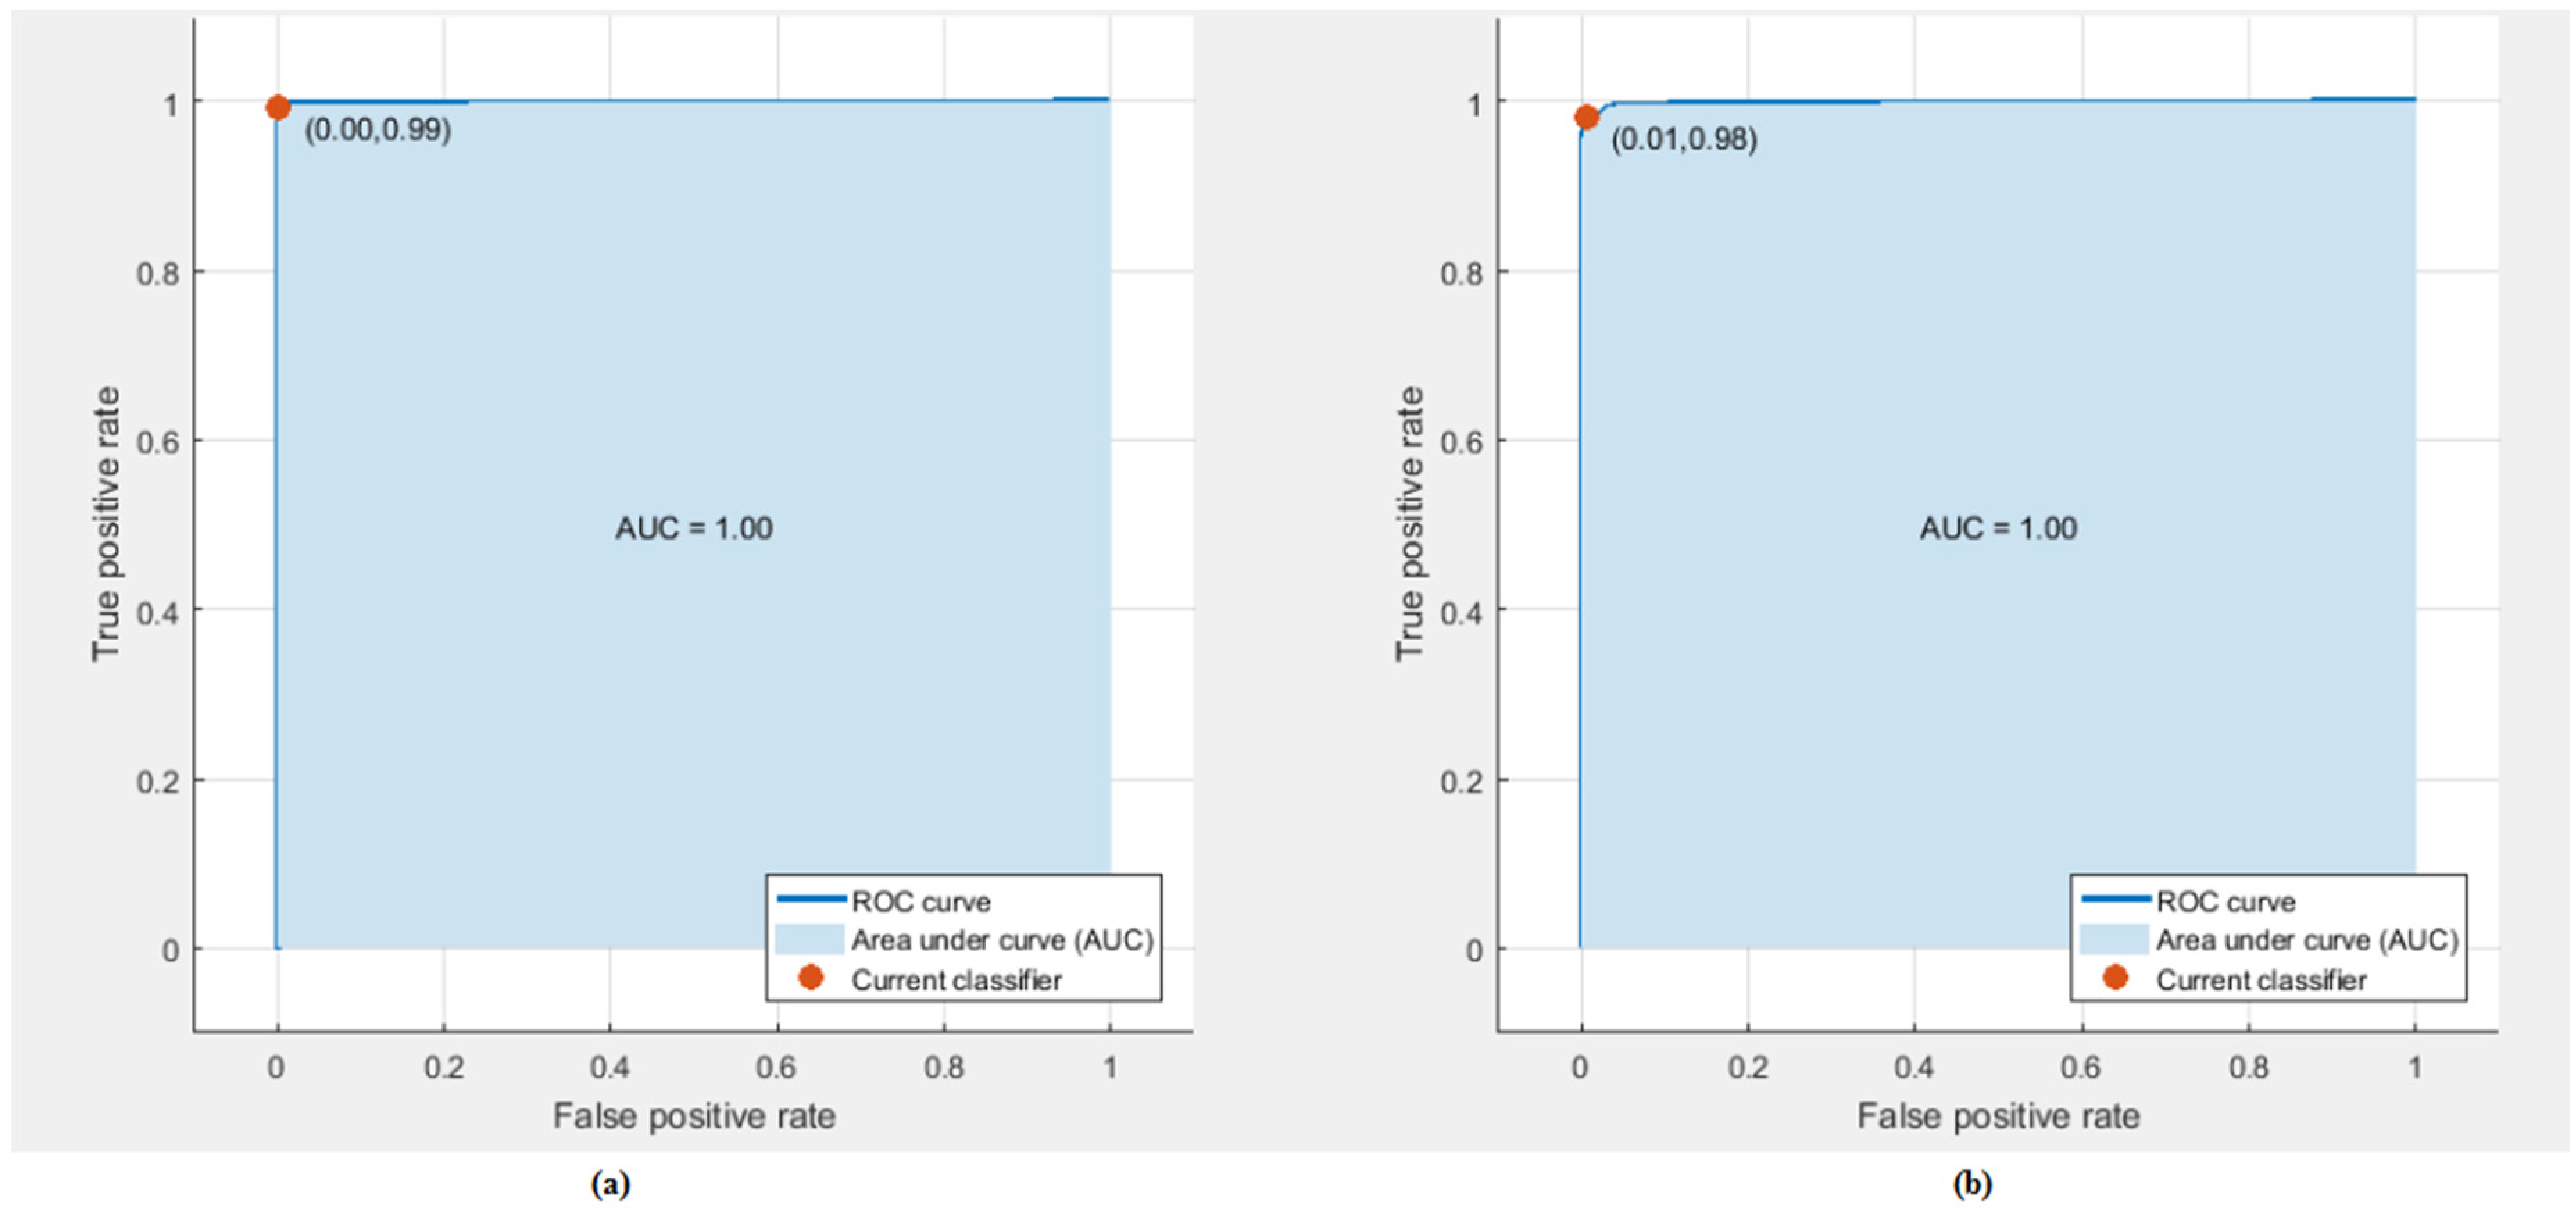
3.2. Experiment Two Results
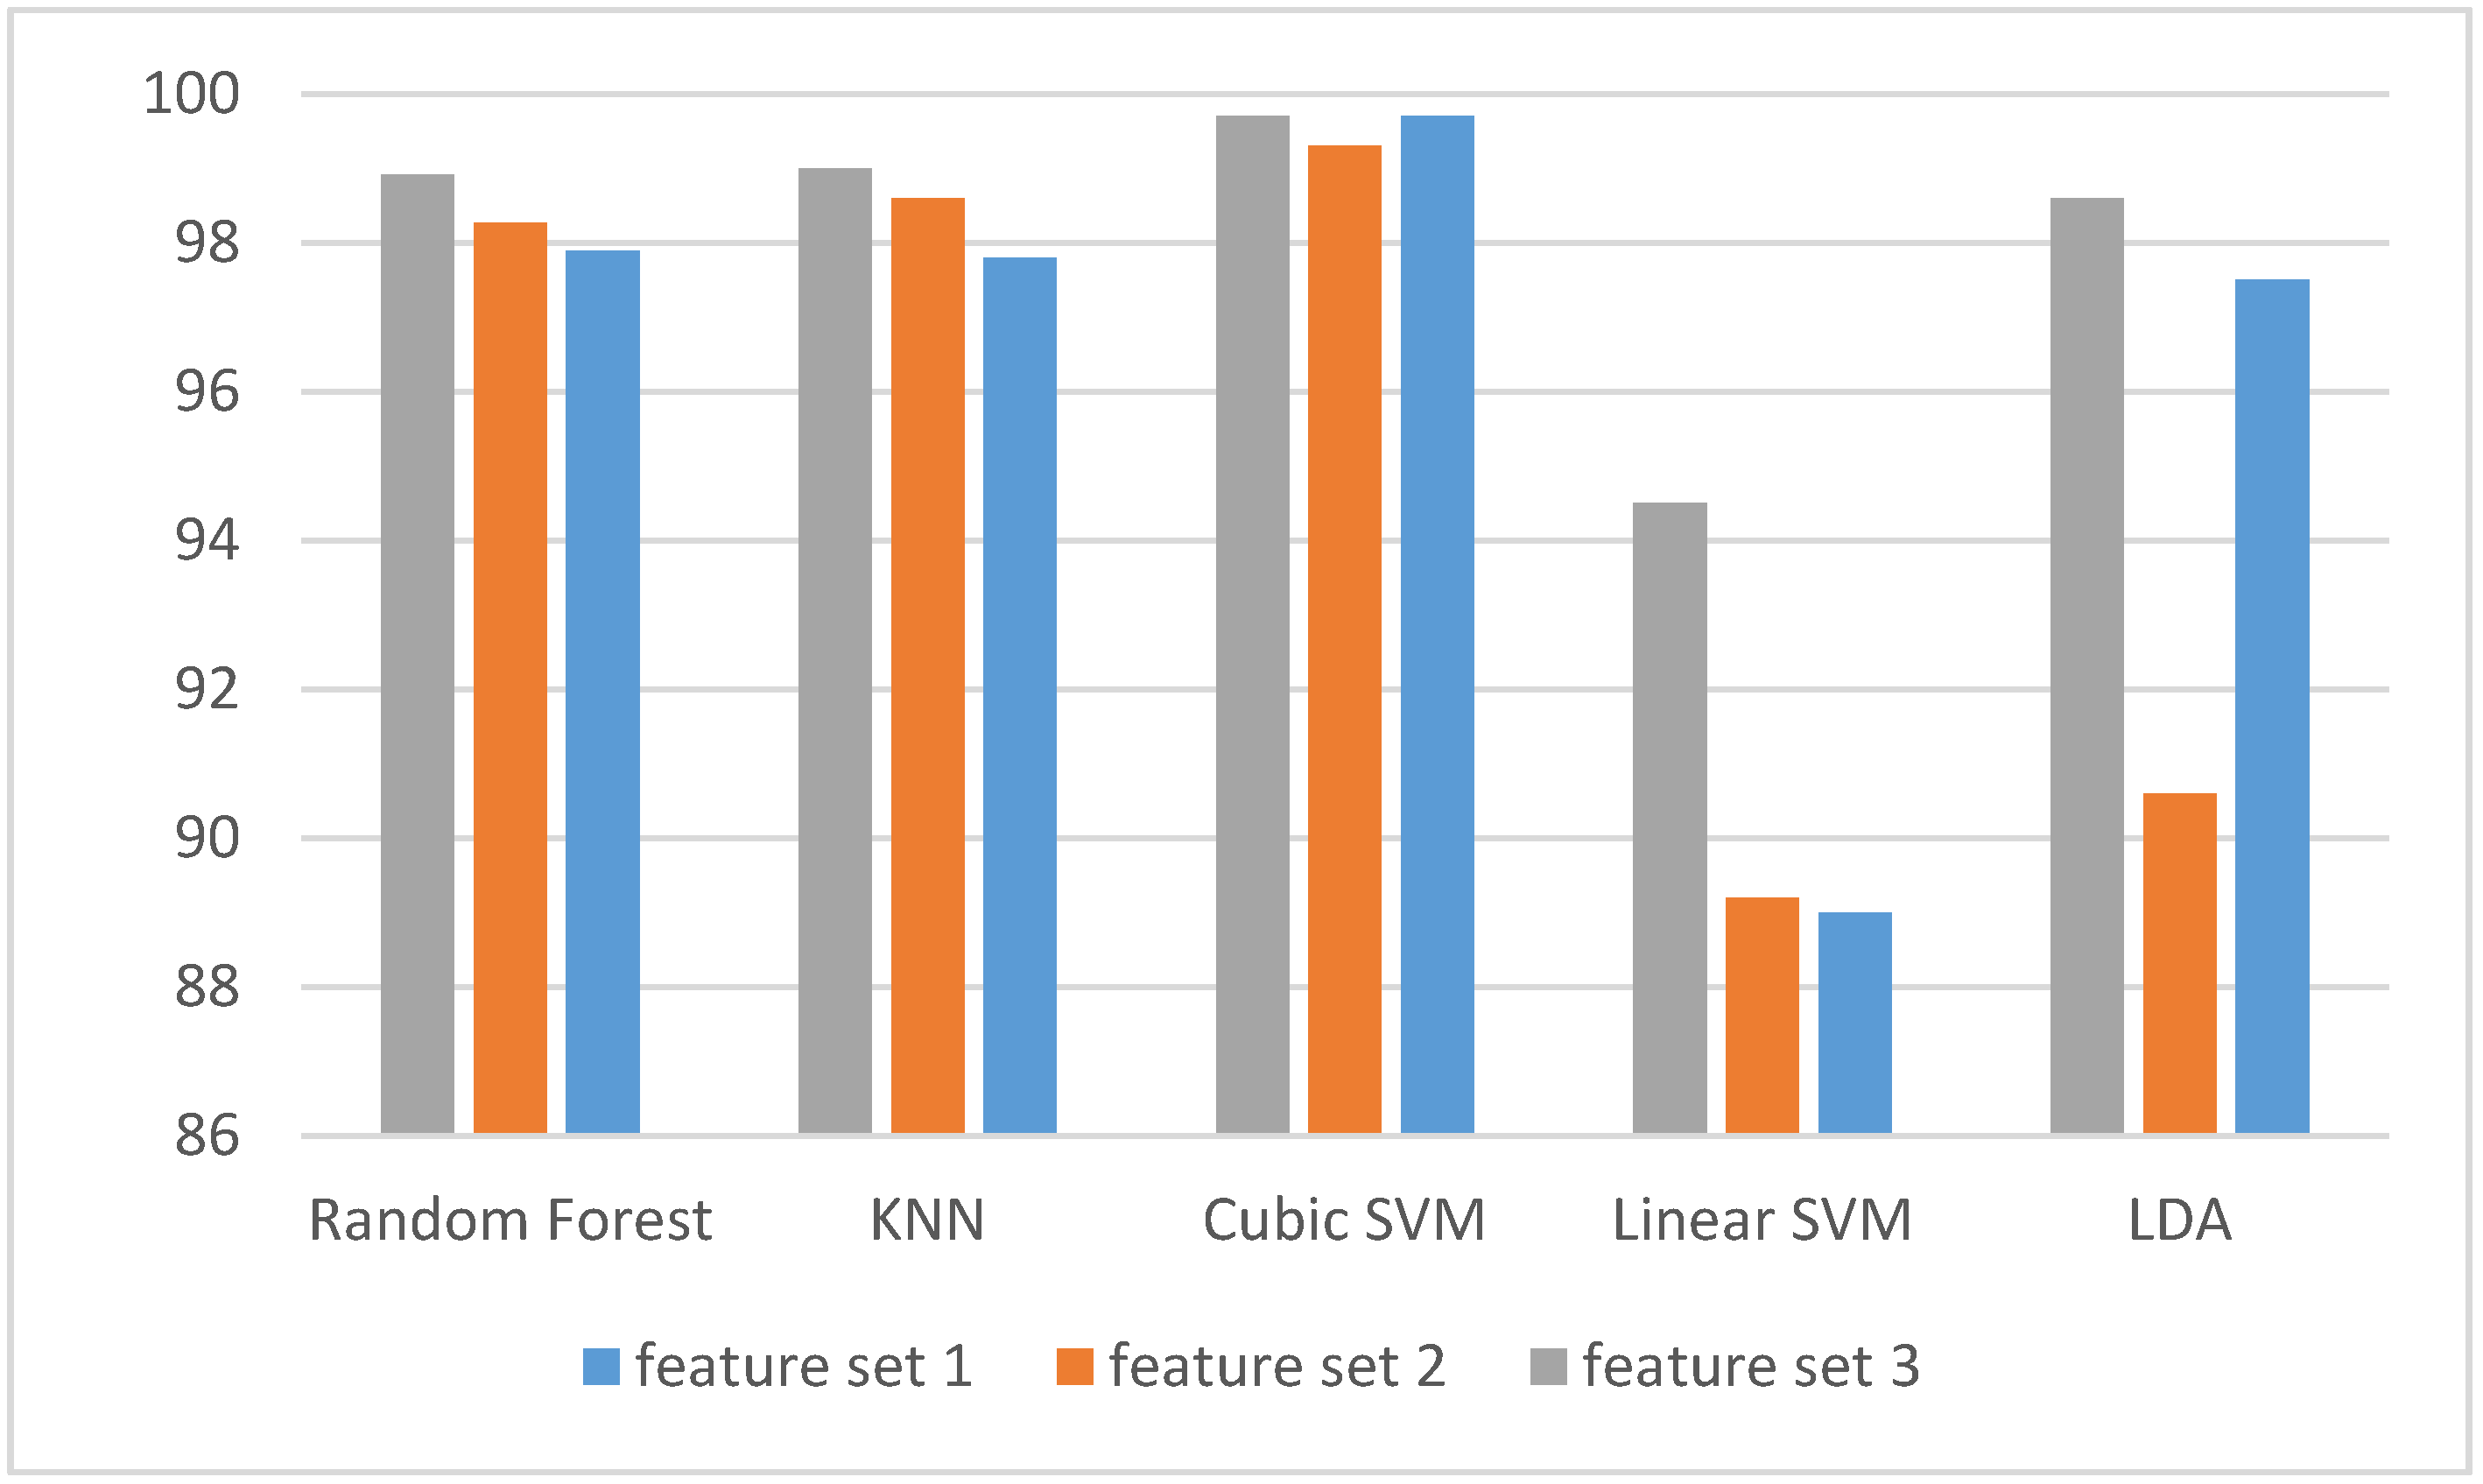
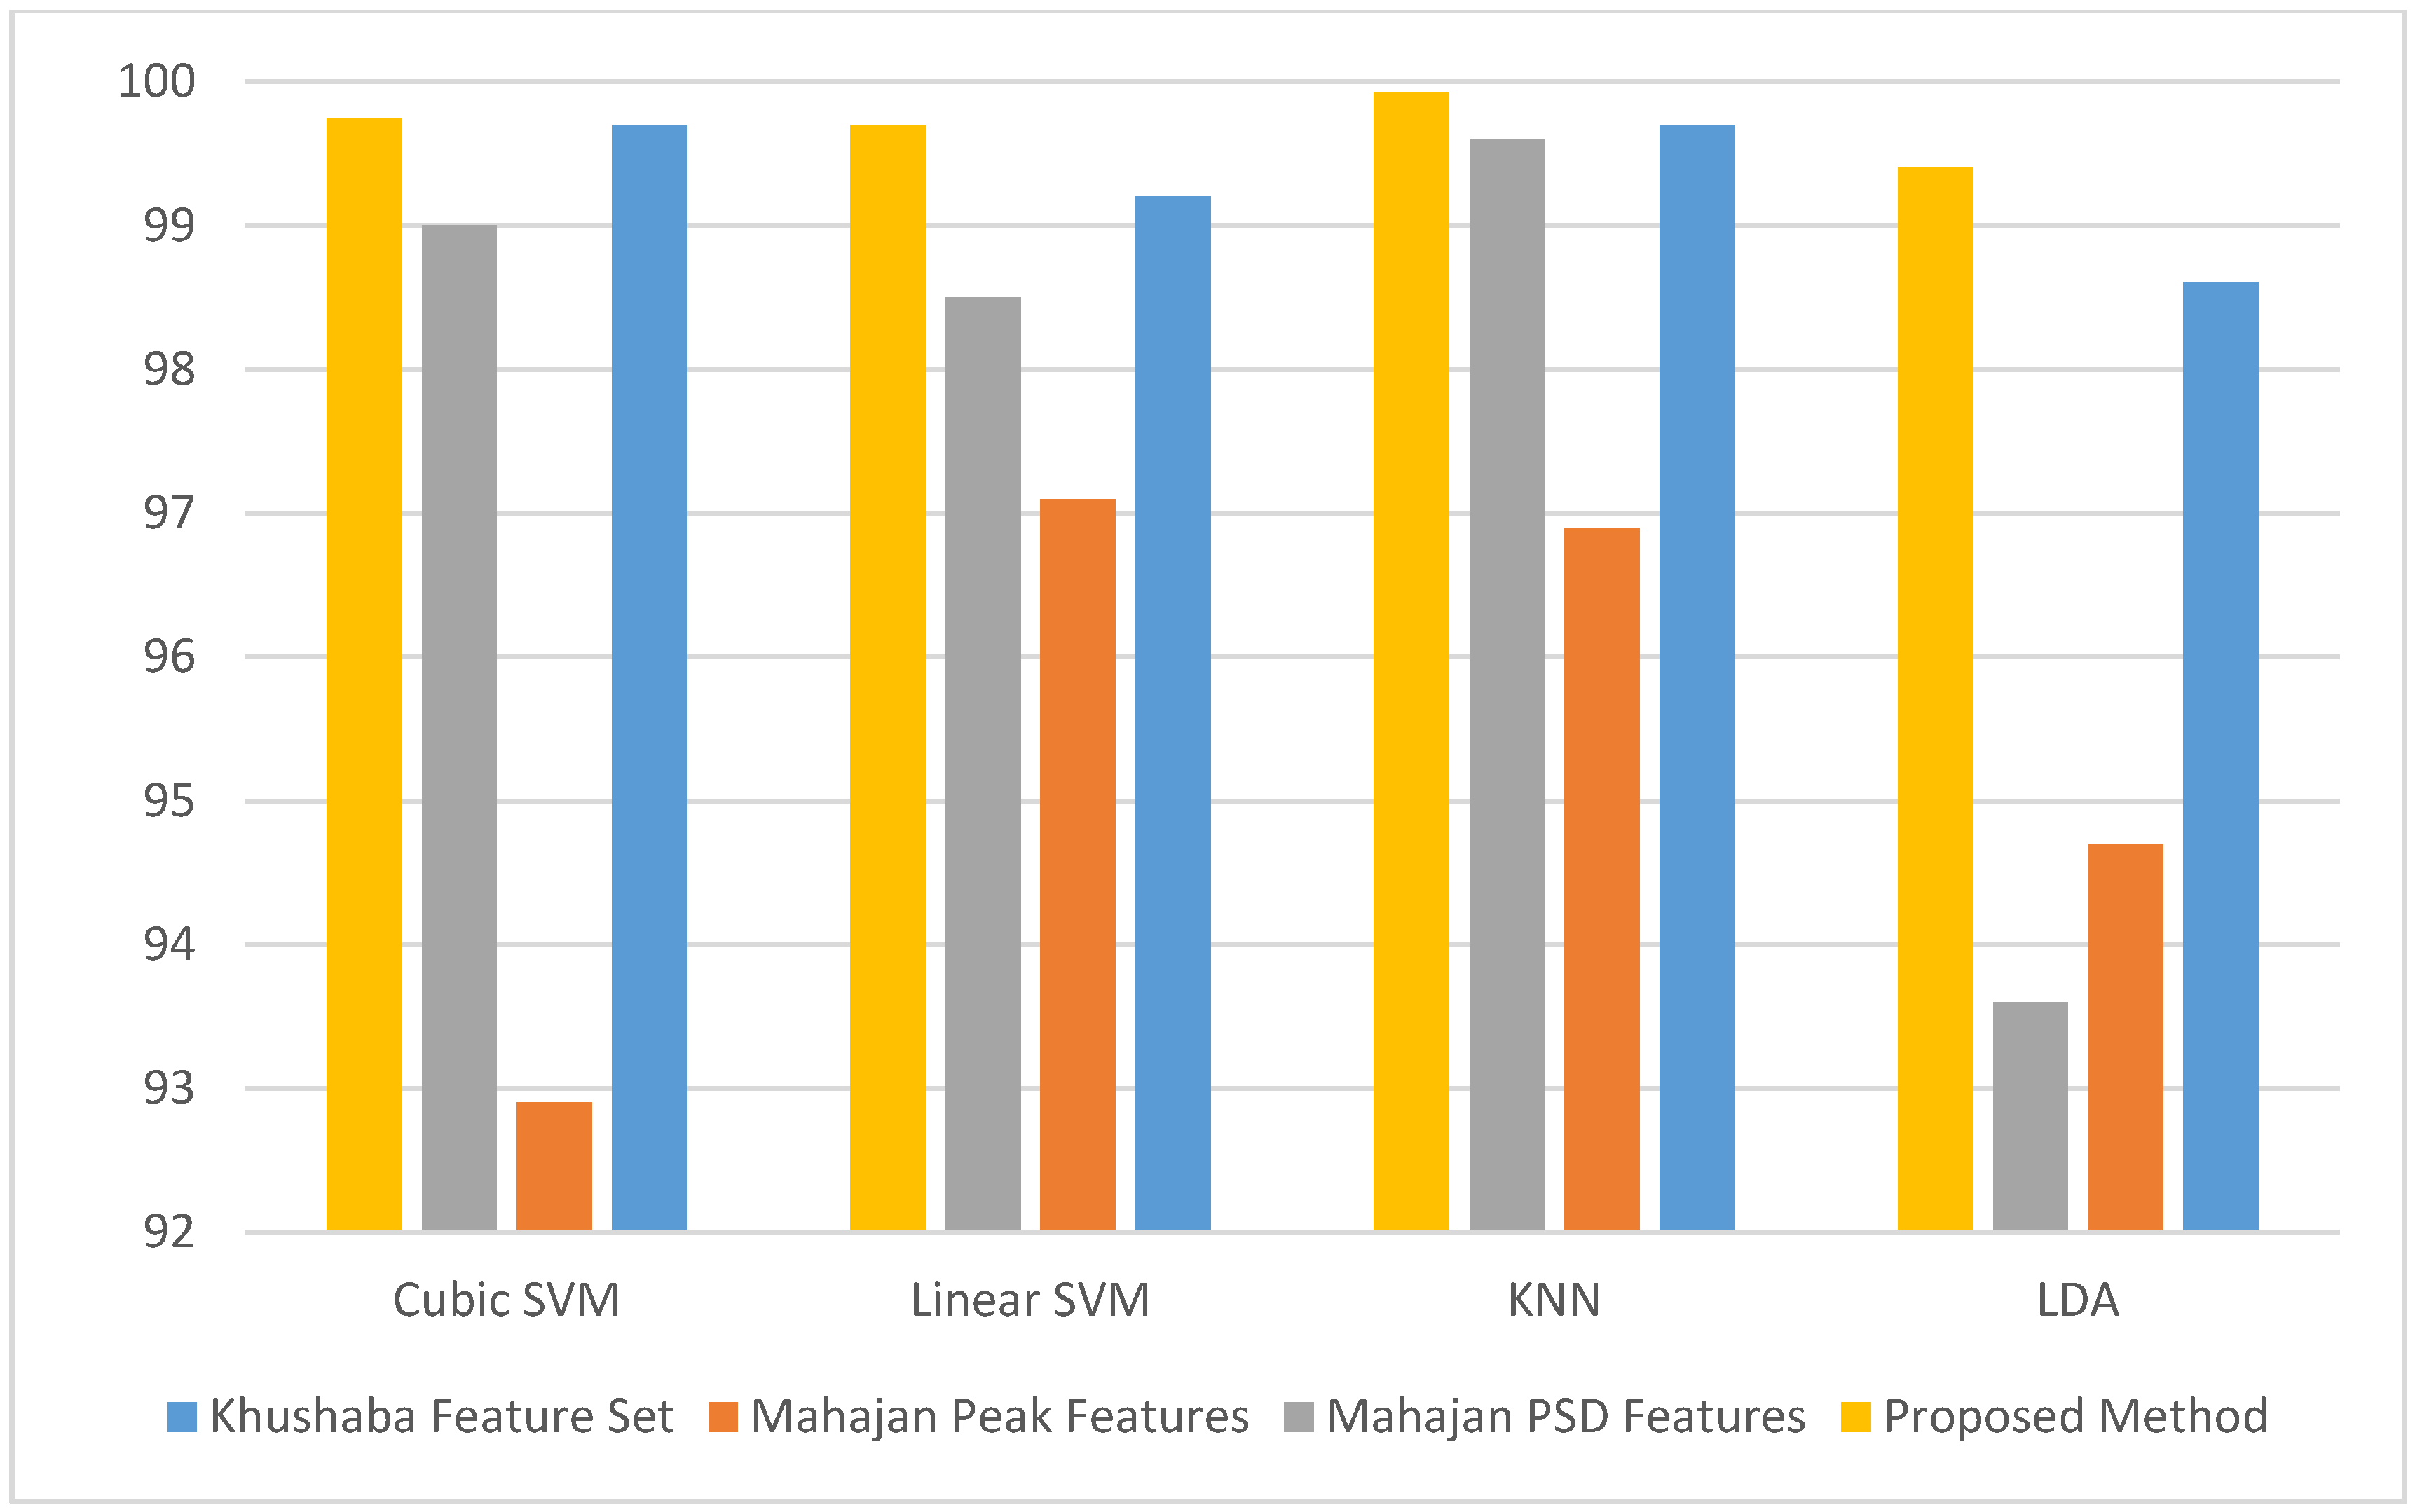
3.3. Experiment Three Results
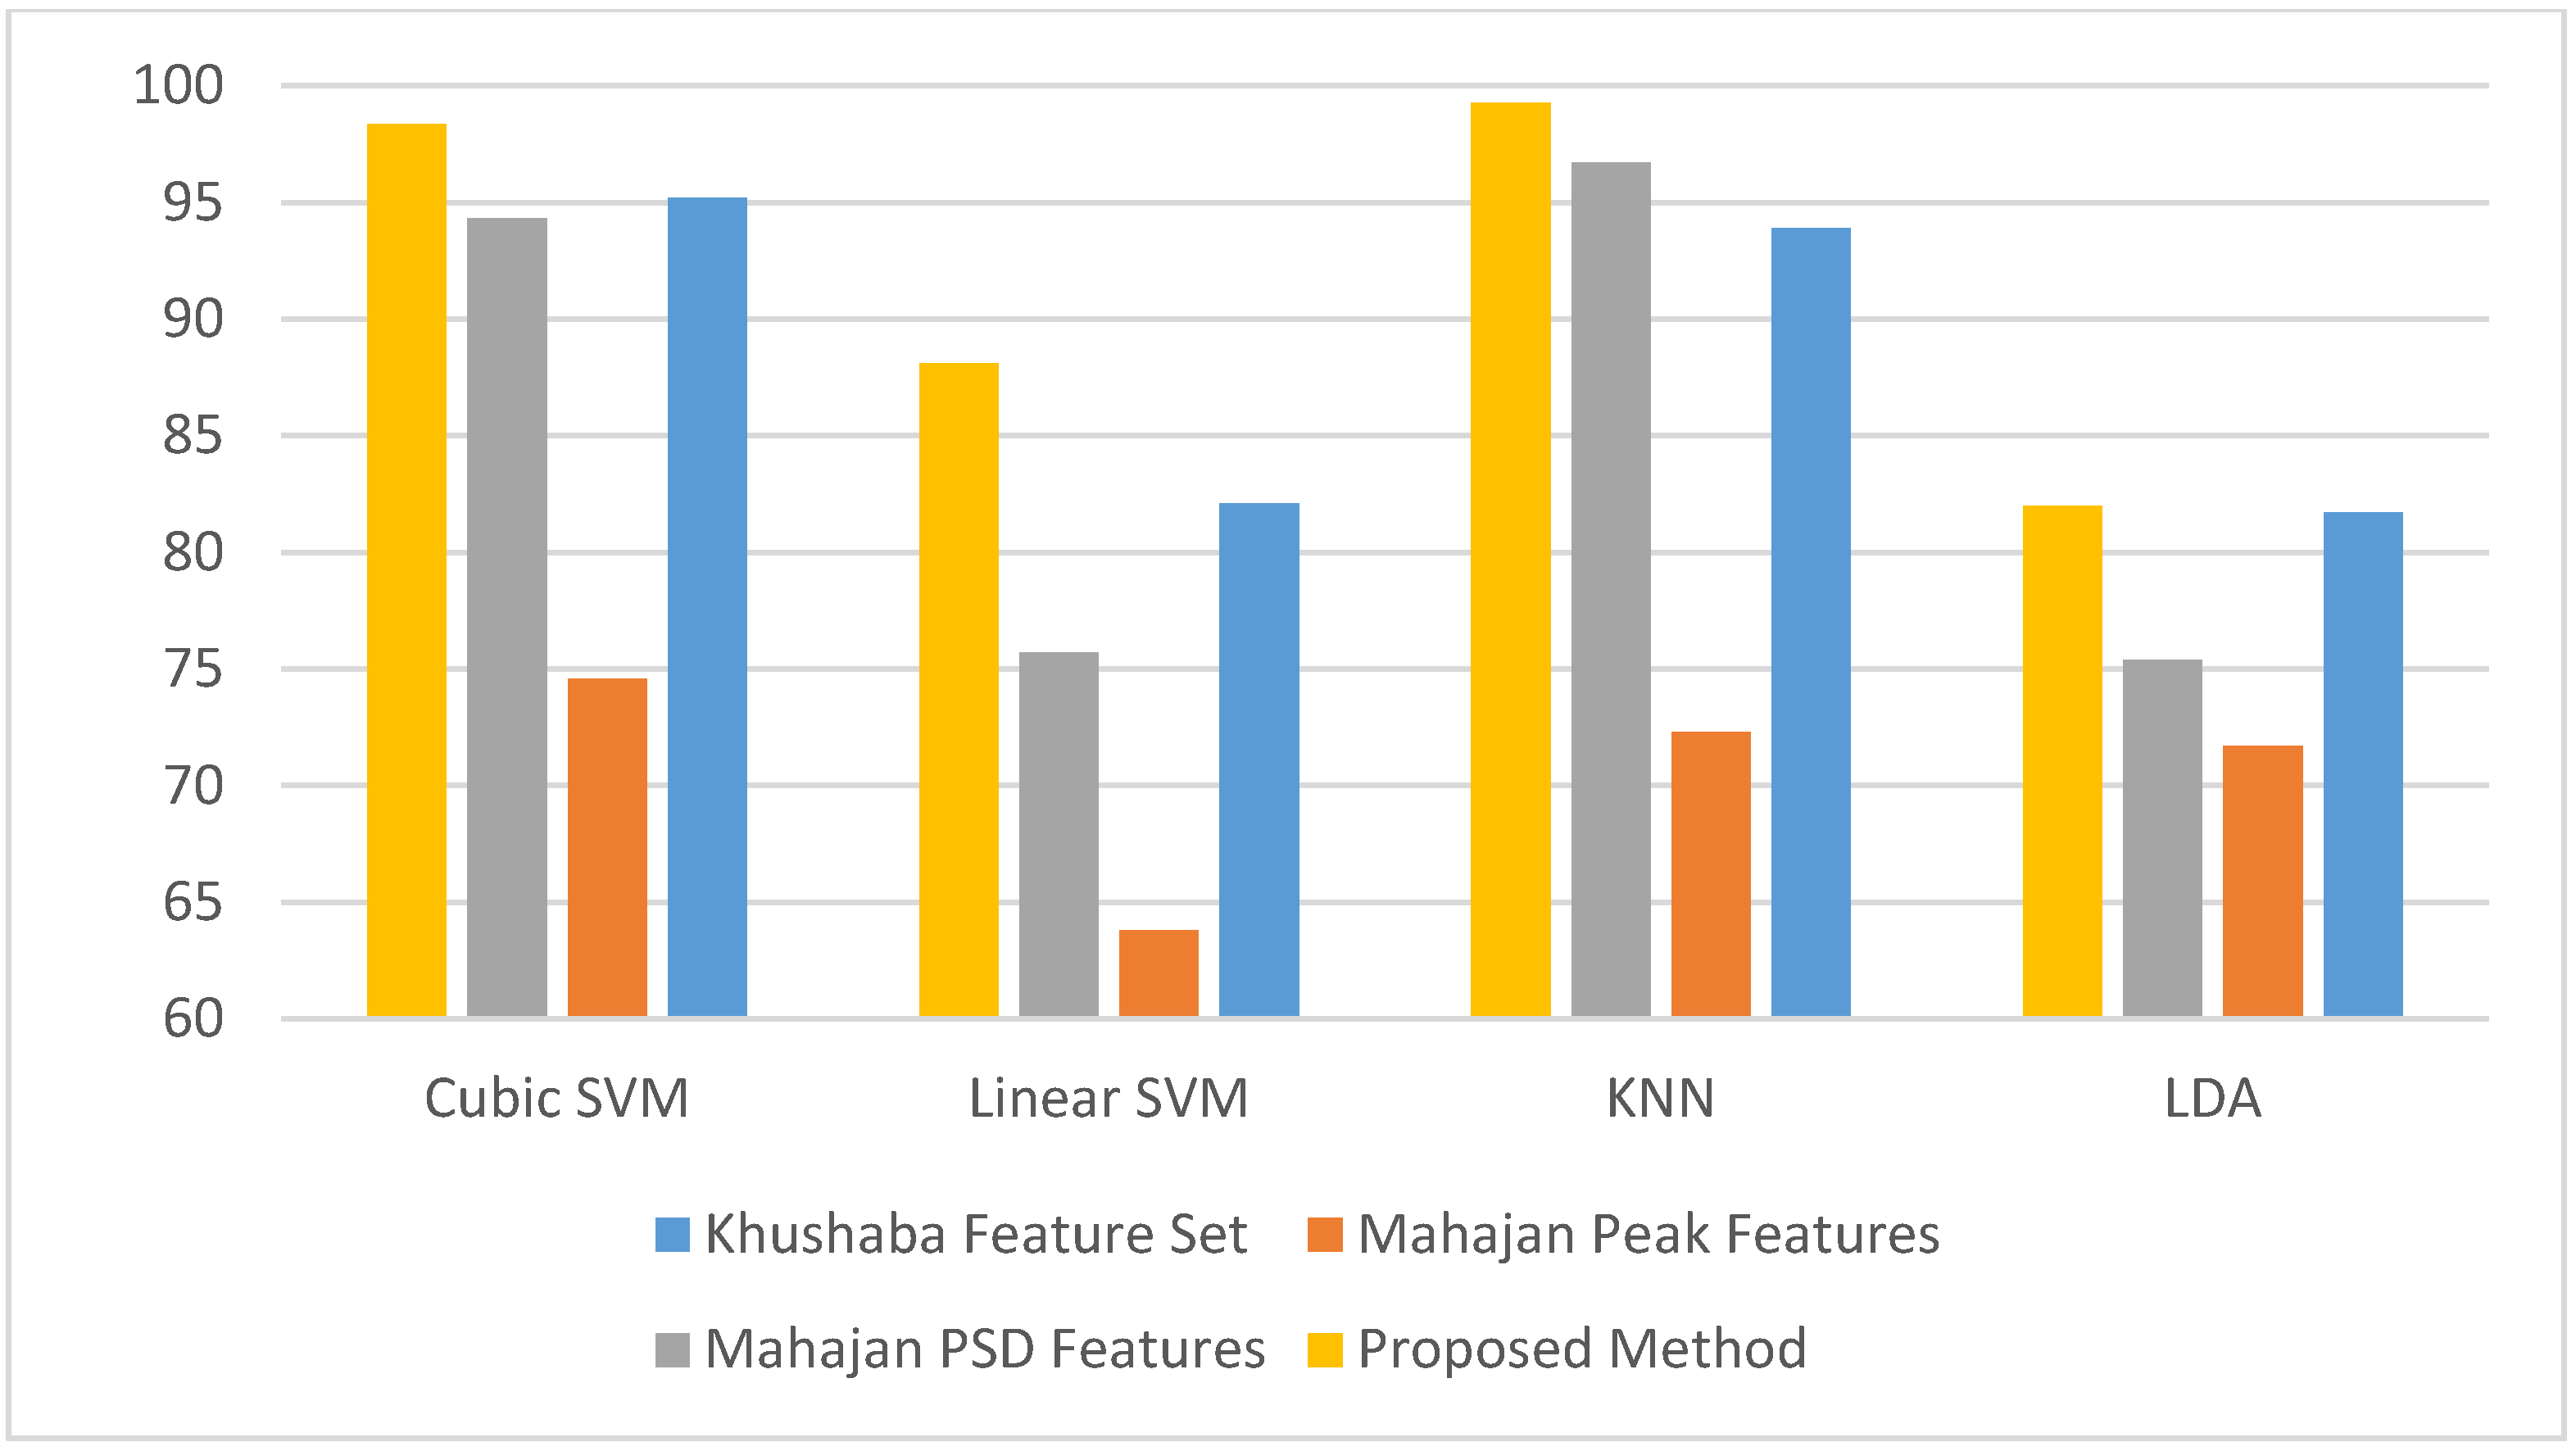
3.4. Experiment Four Results
4. Discussion
5. Conclusions
Funding
Conflicts of Interest
References
- Panicker, S.S.; Gayathri, P. A survey of machine learning techniques in physiology based mental stress detection systems. Biocybern. Biomed. Eng. 2019, 39, 444–469. [Google Scholar] [CrossRef]
- Al-Shargie, F.; Tang, T.B.; Badruddin, N.; Kiguchi, M. Towards multilevel mental stress assessment using SVM with ECOC: An EEG approach. Med. Biol. Eng. Comput. 2018, 56, 125–136. [Google Scholar] [CrossRef] [PubMed]
- Kumari, A.; Jain, J. Examination stress and anxiety: A study of college students. Glob. J. Multidiscip. Stud. 2014, 4, 31–40. [Google Scholar]
- So, W.K.; Wong, S.W.; Mak, J.N.; Chan, R.H. An evaluation of mental workload with frontal EEG. PLoS ONE 2017, 12, e0174949. [Google Scholar] [CrossRef]
- Kruger, J.-L.; Doherty, S. Measuring cognitive load in the presence of educational video: Towards a multimodal methodology. Australas. J. Educ. Technol. 2016, 32. [Google Scholar] [CrossRef]
- Hancock, P.A.; Chignell, M.H. Mental workload dynamics in adaptive interface design. IEEE Trans. Syst. ManCybern. 1988, 18, 647–658. [Google Scholar] [CrossRef]
- Hart, S.G. NASA-Task Load Index (NASA-TLX); 20 Years Later. In Proceedings of the Human Factors and Ergonomics Society Annual Meeting, San Fransisco, CA, USA, 16–20 October 2006; pp. 904–908. [Google Scholar]
- Elzeiny, S.; Qaraqe, M. Machine Learning Approaches to Automatic Stress Detection: A review. In Proceedings of the 2018 IEEE/ACS 15th International Conference on Computer Systems and Applications (AICCSA), Aqaba, Jordan, 28 October–1 November 2018; pp. 1–6. [Google Scholar]
- Chin, Z.Y.; Zhang, X.; Wang, C.; Ang, K.K. EEG-Based Discrimination of Different Cognitive Workload Levels from Mental Arithmetic. In Proceedings of the 2018 40th Annual International Conference of the IEEE Engineering in Medicine and Biology Society (EMBC), Honolulu, HI, USA, 17–21 July 2018; pp. 1984–1987. [Google Scholar]
- Plechawska-Wójcik, M.; Tokovarov, M.; Kaczorowska, M.; Zapała, D. A Three-Class Classification of Cognitive Workload Based on EEG Spectral Data. Appl. Sci. 2019, 9, 5340. [Google Scholar] [CrossRef]
- Hasan, M.J.; Kim, J.-M. A Hybrid Feature Pool-Based Emotional Stress State Detection Algorithm Using EEG Signals. Brain Sci. 2019, 9, 376. [Google Scholar] [CrossRef]
- Wang, Q.; Sourina, O. Real-time mental arithmetic task recognition from EEG signals. IEEE Trans. Neural Syst. Rehabil. Eng. 2013, 21, 225–232. [Google Scholar] [CrossRef]
- Bairagi, V.; Kulkarni, S. A Novel Method for Stress Measuring Using EEG Signals. In Proceedings of the Future of Information and Communication Conference, Singapore, Singapore, 4–5 April 2018; pp. 671–684. [Google Scholar]
- Choi, S.-I.; Choi, G.-Y.; Lee, H.-T.; Hwang, H.-J.; Shin, J. Classification of Mental Arithmetic and Resting-State Based on Ear-EEG. In Proceedings of the 2018 6th International Conference on Brain-Computer Interface (BCI), Gangwan, Korea, 15–17 January 2018; pp. 1–4. [Google Scholar]
- Richer, R.; Zhao, N.; Amores, J.; Eskofier, B.M.; Paradiso, J.A. Real-Time Mental State Recognition Using a Wearable EEG. In Proceedings of the 2018 40th Annual International Conference of the IEEE Engineering in Medicine and Biology Society (EMBC), Honolulu, HI, USA, 17–21 July 2018; pp. 5495–5498. [Google Scholar]
- Li, X.; Song, D.; Zhang, P.; Zhang, Y.; Hou, Y.; Hu, B. Exploring EEG features in cross-subject emotion recognition. Front. Neurosci. 2018, 12, 162. [Google Scholar] [CrossRef]
- Akar, S.A.; Kara, S.; Latifoğlu, F.; Bilgiç, V. Analysis of the complexity measures in the EEG of schizophrenia patients. Int. J. Neural Syst. 2016, 26, 1650008. [Google Scholar] [CrossRef] [PubMed]
- Mahajan, R. Emotion recognition via EEG using neural network classifier. In Soft Computing: Theories and Applications; Springer: Berlin/Heidelberg, Germany, 2018; pp. 429–438. [Google Scholar]
- Saidatul, A.; Paulraj, M.P.; Yaacob, S.; Yusnita, M.A. Analysis of EEG Signals during Relaxation and Mental Stress Condition Using AR Modeling Techniques. In Proceedings of the 2011 IEEE International Conference on Control System, Computing and Engineering, Penang, Malaysia, 25–27 November 2011; pp. 477–481. [Google Scholar]
- Jebelli, H.; Hwang, S.; Lee, S. EEG-based workers’ stress recognition at construction sites. Autom. Constr. 2018, 93, 315–324. [Google Scholar] [CrossRef]
- Patil, M.J.; Shaikh, A.; Dhopeshwarkar, M.G. Novel Approach for Classification of Stress EEG Data Using Statistical Techniques. In Proceedings of the 2016 International Conference System Modeling & Advancement in Research Trends (SMART), Moradabad, India, 25–27 November 2016; pp. 14–16. [Google Scholar]
- Khushaba, R.N.; Kodagoda, S.; Lal, S.; Dissanayake, G. Driver drowsiness classification using fuzzy wavelet-packet-based feature-extraction algorithm. IEEE Trans. Biomed. Eng. 2010, 58, 121–131. [Google Scholar] [CrossRef] [PubMed]
- Zennifa, F.; Ageno, S.; Hatano, S.; Iramina, K. Hybrid system for engagement recognition during cognitive tasks using a CFS+ KNN algorithm. Sensors 2018, 18, 3691. [Google Scholar] [CrossRef]
- Li, Y.; Zheng, W.; Wang, L.; Zong, Y.; Cui, Z. From Regional to Global Brain: A Novel Hierarchical Spatial-Temporal Neural Network Model for EEG Emotion Recognition. IEEE Trans. Affect. Comput. 2019. [Google Scholar] [CrossRef]
- Zanetti, M.; Faes, L.; De Cecco, M.; Fornaser, A.; Valente, M.; Guandalini, G.; Nollo, G. Assessment of Mental Stress through the Analysis of Physiological Signals Acquired from Wearable Devices. In Proceedings of the Italian Forum of Ambient Assisted Living, Lece, Italy, 2–4 July 2018; pp. 243–256. [Google Scholar]
- Jun, G.; Smitha, K.G. EEG Based Stress Level Identification. In Proceedings of the 2016 IEEE International Conference on Systems, Man, and Cybernetics (SMC), Budapest, Hungary, 9–12 October 2016; pp. 003270–003274. [Google Scholar]
- Subhani, A.R.; Mumtaz, W.; Saad, M.N.B.M.; Kamel, N.; Malik, A.S. Machine learning framework for the detection of mental stress at multiple levels. IEEE Access 2017, 5, 13545–13556. [Google Scholar] [CrossRef]
- Zammouri, A.; Moussa, A.A.; Mebrouk, Y. Brain-computer interface for workload estimation: Assessment of mental efforts in learning processes. Expert Syst. Appl. 2018, 112, 138–147. [Google Scholar] [CrossRef]
- Shon, D.; Im, K.; Park, J.-H.; Lim, D.-S.; Jang, B.; Kim, J.-M. Emotional stress state detection using genetic algorithm-based feature selection on EEG signals. Int. J. Environ. Res. Public Health 2018, 15, 2461. [Google Scholar] [CrossRef]
- Al-Shargie, F.; Kiguchi, M.; Badruddin, N.; Dass, S.C.; Hani, A.F.M.; Tang, T.B. Mental stress assessment using simultaneous measurement of EEG and fNIRS. Biomed. Opt. Express 2016, 7, 3882–3898. [Google Scholar] [CrossRef]
- Al-Shargie, F.; Tang, T.B.; Kiguchi, M. Assessment of mental stress effects on prefrontal cortical activities using canonical correlation analysis: An fNIRS-EEG study. Biomed. Opt. Express 2017, 8, 2583–2598. [Google Scholar] [CrossRef]
- Hefron, R.; Borghetti, B.; Schubert Kabban, C.; Christensen, J.; Estepp, J. Cross-participant EEG-based assessment of cognitive workload using multi-path convolutional recurrent neural networks. Sensors 2018, 18, 1339. [Google Scholar] [CrossRef] [PubMed]
- Kuanar, S.; Athitsos, V.; Pradhan, N.; Mishra, A.; Rao, K.R. Cognitive Analysis of Working Memory Load from EEG, by a Deep Recurrent Neural Network. In Proceedings of the 2018 IEEE International Conference on Acoustics, Speech and Signal Processing (ICASSP), Calgary, AB, Canada, 15–20 April 2018; pp. 2576–2580. [Google Scholar]
- Asif, A.; Majid, M.; Anwar, S.M. Human stress classification using EEG signals in response to music tracks. Comput. Biol. Med. 2019, 107, 182–196. [Google Scholar] [CrossRef] [PubMed]
- Halim, Z.; Rehan, M. On identification of driving-induced stress using electroencephalogram signals: A framework based on wearable safety-critical scheme and machine learning. Inf. Fusion 2020, 53, 66–79. [Google Scholar] [CrossRef]
- Khosrowabadi, R. Stress and Perception of Emotional Stimuli: Long-term Stress Rewiring the Brain. Basic Clin. Neurosci. 2018, 9, 107. [Google Scholar] [CrossRef]
- Minguillon, J.; Perez, E.; Lopez-Gordo, M.A.; Pelayo, F.; Sanchez-Carrion, M.J. Portable system for real-time detection of stress level. Sensors 2018, 18, 2504. [Google Scholar] [CrossRef]
- Al-Shargie, F.M.; Tang, T.B.; Badruddin, N.; Kiguchi, M. Mental Stress Quantification Using EEG Signals. In Proceedings of the International Conference for Innovation in Biomedical Engineering and Life Sciences, Putrajaya, Malaysia, 6–8 December 2015; pp. 15–19. [Google Scholar]
- Saeed, U.; Muhammad, S.; Anwar, S.M.; Majid, M.; Awais, M.; Alnowami, M. Selection of neural oscillatory features for human stress classification with single channel eeg headset. Biomed. Res. Int. 2018, 2018, 1049257. [Google Scholar] [CrossRef]
- Zyma, I.; Tukaev, S.; Seleznov, I.; Kiyono, K.; Popov, A.; Chernykh, M.; Shpenkov, O. Electroencephalograms during mental arithmetic task performance. Data 2019, 4, 14. [Google Scholar] [CrossRef]
- Jatoi, N.-A.; Kyvelou, S.-M.; Feely, J. The acute effects of mental arithmetic, cold pressor and maximal voluntary contraction on arterial stiffness in young healthy subjects. Artery Res. 2014, 8, 44–50. [Google Scholar] [CrossRef]
- Noto, Y.; Sato, T.; Kudo, M.; Kurata, K.; Hirota, K. The relationship between salivary biomarkers and state-trait anxiety inventory score under mental arithmetic stress: A pilot study. Anesth. Analg. 2005, 101, 1873–1876. [Google Scholar] [CrossRef]
- Donoho, D.L.; Johnstone, I.M.; Kerkyacharian, G.; Picard, D. Wavelet shrinkage: Asymptopia? J. R. Stat. Soc. 1995, 57, 301–337. [Google Scholar] [CrossRef]
- Gorry, P.A. General least-squares smoothing and differentiation by the convolution (Savitzky-Golay) method. Anal. Chem. 1990, 62, 570–573. [Google Scholar] [CrossRef]
- Saeed, S.M.U.; Anwar, S.M.; Khalid, H.; Majid, M.; Bagci, U. Electroencephalography based Classification of Long-term Stress using Psychological Labeling. arXiv 2019, arXiv:1907.07671. [Google Scholar]
- Jenke, R.; Peer, A.; Buss, M. Feature extraction and selection for emotion recognition from EEG. IEEE Trans. Affect. Comput. 2014, 5, 327–339. [Google Scholar] [CrossRef]
- Zamanian, H.; Farsi, H. A New feature extraction method to Improve Emotion Detection Using EEG Signals. Elcvia Electron. Lett. Comput. Vis. Image Anal. 2018, 17, 29–44. [Google Scholar] [CrossRef]
- Veer, K.; Sharma, T. A novel feature extraction for robust EMG pattern recognition. J. Med. Eng. Technol. 2016, 40, 149–154. [Google Scholar] [CrossRef] [PubMed]
- Hindarto, H.; Hariadi, M.; Purnomo, M.H. EEG signal identification based on root mean square and average power spectrum by using backpropagation. J. Theor. Appl. Inf. Technol. 2014, 66, 782–787. [Google Scholar]
- Bhuvaneswari, P.; Kumar, J.S. Influence of linear features in nonlinear electroencephalography (EEG) signals. Procedia Comput. Sci. 2015, 47, 229–236. [Google Scholar] [CrossRef]
- Sabeti, M.; Boostani, R.; Katebi, S.D.; Price, G.W. Selection of relevant features for EEG signal classification of schizophrenic patients. Biomed. Signal Process. Control 2007, 2, 122–134. [Google Scholar] [CrossRef]
- Yom-Tov, E.; Inbar, G.F. Feature selection for the classification of movements from single movement-related potentials. IEEE Trans. Neural Syst. Rehabil. Eng. 2002, 10, 170–177. [Google Scholar] [CrossRef]
- Zhang, Y.; Liu, B.; Ji, X.; Huang, D. Classification of EEG signals based on autoregressive model and wavelet packet decomposition. Neural Process. Lett. 2017, 45, 365–378. [Google Scholar] [CrossRef]
- Attallah, O.; Sharkas, M.A.; Gadelkarim, H. Deep Learning Techniques for Automatic Detection of Embryonic Neurodevelopmental Disorders. Diagnostics 2020, 10, 27. [Google Scholar] [CrossRef] [PubMed]
- Shin, J.; Müller, K.-R.; Hwang, H.-J. Eyes-closed hybrid brain-computer interface employing frontal brain activation. PLoS ONE 2018, 13, e0196359. [Google Scholar] [CrossRef] [PubMed]
- Ragab, D.A.; Sharkas, M.; Attallah, O. Breast cancer diagnosis using an efficient CAD system based on multiple classifiers. Diagnostics 2019, 9, 165. [Google Scholar] [CrossRef] [PubMed]
- Lowsky, D.J.; Ding, Y.; Lee, D.K.K.; McCulloch, C.E.; Ross, L.F.; Thistlethwaite, J.R.; Zenios, S.A. A k-nearest neighbors survival probability prediction method. Stat. Med. 2013, 32, 2062–2069. [Google Scholar] [CrossRef]
- Kim, H.; Bredel, M. Feature selection and survival modeling in The Cancer Genome Atlas. Int. J. Nanomed. 2013, 8, 57–62. [Google Scholar] [CrossRef]
- Rasoulzadeh, V.; Erkus, E.C.; Yogurt, T.A.; Ulusoy, I.; Zergeroğlu, S.A. A comparative stationarity analysis of EEG signals. Ann. Oper. Res. 2017, 258, 133–157. [Google Scholar] [CrossRef]
- Gonen, F.F.; Tcheslavski, G.V. Techniques to assess stationarity and gaussianity of EEG: An overview. Int. J. Bioautom. 2012, 16, 135–142. [Google Scholar]
- Azami, H.; Bozorgtabar, B.; Shiroie, M. Automatic signal segmentation using the fractal dimension and weighted moving average filter. J. Electr. Comput. Sci. 2011, 11, 8–15. [Google Scholar]
- Colquhoun, D. An investigation of the false discovery rate and the misinterpretation of p-values. R. Soc. Open Sci. 2014, 1, 140216. [Google Scholar] [CrossRef]
- Ellis, P.D. The Essential Guide to Effect Sizes: Statistical Power, Meta-Analysis, and the Interpretation of Research Results; Cambridge University Press: Cambridge, UK, 2010. [Google Scholar]


| Reference | Number of Participants | Number of Electrodes | Class Label | Classifier | Validation Method | Accuracy |
|---|---|---|---|---|---|---|
| [25] | 1 | 14 | Stress and non-stress | Random Forest | k-fold cross validation | 97.5% |
| [13] | 50 | 14 | Stress and non-stress | Threshold-based | Hold out | 88% |
| [14] | 7 | 31 | Stress and non-stress | LDA | k-fold cross validation | 82.6% |
| [19] | 5 | 19 | Stress and non-stress | ANN | Hold out | 91.17% |
| [28] | 4 | 22 | Stress and non-stress | SVM | Hold out | 78–79% |
| [11] | 32 | 32 | Stress and non-stress | KNN | k-fold cross validation | 73.38% |
| [29] | 32 | 32 | Stress and non-stress | KNN | k-fold cross validation | 71.76% |
| [31] | 25 | 23 | Stress and non-stress | SVM | k-fold cross validation | 83.1%–89.8% |
| [30] | 22 | 7 | Stress and non-stress | SVM | Leave-one out | 91.7% |
| [34] | 27 | 5 | Stress and non-stress | Linear Regression | k-fold cross validation | 98.76% |
| [35] | 50 | 16 | Stress and non-stress | Ensemble | k-fold cross validation | 97.95% |
| [26] | 10 | 14 | Stress levels | SVM | k-fold cross validation | 96% |
| [20] | 11 | 14 | Stress levels | SVM | k-fold cross validation | 80.32% |
| [27] | 42 | 128 | Stress levels | SVM | k-fold cross validation | 94.6% |
| [10] | 12 | 19 | Stress levels | KNN | k-fold cross validation Hold out | 91.5% 90.5% |
| [4] | 20 | 1 | Stress levels | SVM | k-fold cross validation | 65%–75% |
| [34] | 27 | 5 | Stress Levels | Linear Regression | k-fold cross validation | 95.062% |
| [36] | 26 | 9 | Stress Levels | KNN | Leave one out | 90.9% |
| [37] | 10 | 4 | Stress Levels | LDA | Leave-one-out | 86% |
| [38] | 12 | 7 | Stress Levels | SVM | k-fold cross validation | 80%–85% |
| [39] | 28 | 1 | Stress Levels | SVM | k-fold cross validation | 78.57% |
| Name | Age (Years) | Gender |
|---|---|---|
| Participant 1 | 21 | Female |
| Participant 2 | 18 | Female |
| Participant 3 | 19 | Female |
| Participant 4 | 17 | Female |
| Participant 5 | 17 | Female |
| Participant 6 | 16 | Female |
| Participant 7 | 18 | Male |
| Participant 8 | 18 | Female |
| Participant 9 | 26 | Male |
| Participant 10 | 16 | Female |
| Participant 11 | 17 | Female |
| Participant 12 | 18 | Female |
| Participant 13 | 17 | Female |
| Participant 14 | 24 | Male |
| Participant 15 | 17 | Female |
| Participant 16 | 17 | Female |
| Participant 17 | 17 | Female |
| Participant 18 | 17 | Female |
| Participant 19 | 17 | Female |
| Participant 20 | 22 | Male |
| Participant 21 | 17 | Female |
| Participant 22 | 19 | Female |
| Participant 23 | 20 | Female |
| Participant 24 | 16 | Female |
| Participant 25 | 17 | Male |
| Participant 26 | 17 | Male |
| Participant 27 | 17 | Female |
| Participant 28 | 19 | Female |
| Participant 29 | 19 | Female |
| Participant 30 | 19 | Male |
| Participant 31 | 17 | Male |
| Participant 32 | 19 | Female |
| Participant 33 | 20 | Female |
| Participant 34 | 17 | Male |
| Participant 35 | 18 | Female |
| Participant 36 | 17 | Female |
| Classifier | Accuracy (%) | Sensitivity (%) | Specificity (%) | Goodness Index | Precision (%) | MCC (%) | DOR |
|---|---|---|---|---|---|---|---|
| LDA | 98.50 (98.49–8.63) | 98.89 (98.85–98.93) | 98.45 (98.17–98.73) | 0.0198 (0.0196–0.020) | 99.83 (99.69–99.96) | 99.7 (99.66–99.76) | 1.3 × 10⁶ (0.669–1.952) × 106 |
| Linear SVM | 99.85 (99.8–99.88) | 98.84 (99.81–9.876) | 99.86 (99.85–99.88) | 0.020 (0.0017–0.002) | 99.95 (99.94–99.95) | 99.64 (99.57–99.7) | 1.36 × 10⁶ (0.504–3.2306) × 106 |
| Cubic SVM | 99.90 (99.85–99.93) | 99.88 (99.81–99.95) | 99.9 (99.88–99.93) | 0.015 (0.0009–0.002) | 99.96 (99.94–99.96) | 99.7 (99.67–99.74) | 8.08 × 10⁵ (6.209–9.946) × 105 |
| KNN | 99.86 (99.84–99.89) | 99.95 (99.91–99.99) | 99.79 (99.75–99.81) | 0.0022 (0.002–0.0025) | 99.99 (99.98–100) | 99.64 (99.94–99.98) | >1000 |
| Random Forest | 99.68 (99.64–99.72) | 99.52 (99.42–99.62) | 99.76 (99.69–99.83) | 0.0054 (0.0044–0.006) | 99.8 (99.8–99.8) | 99.14 (99.08–99.19) | 7.8 × 10⁴ (6.8783–8.733) × 104 |
| Classifier | Accuracy (%) | Sensitivity (%) | Specificity (%) | Goodness Index | Precision (%) | MCC (%) | DOR |
|---|---|---|---|---|---|---|---|
| LDA | 98.6 (98.37–98.83) | 99 (98.85–99.56) | 97 (96.32–97.60) | 0.03156 (0.0259–0.037) | 97.98 (97.68–98.27) | 96.63 (96.25–97) | 4589.8 (3451–5728.6) |
| Linear SVM | 94.5 (94.08–94.84) | 98 (97.83–98.24) | 85 (83.93–86.11) | 0.151 (0.1401–0.161) | 94.16 (93.55–94.77) | 85.42 (85.19–85.71) | 271.2 (244.74–297.65) |
| Cubic SVM | 99.7 (99.52–99.79) | 99.85 (99.82–99.89) | 99.4 (99.05–99.73) | 0.00634 (0.0032–0.009) | 99.69 (99.61–99.76) | 99.49 (99.37–99.62) | 2.39 × 10⁵ (1.255–3.53) × 105 |
| KNN | 99 (98.86–99.03) | 99.4 (99.25–99.47) | 97.7 (97.49–98.10) | 0.02296 (0.020–0.0259) | 98.27 (97.88–98.66) | 97.27 (97.03–97.51) | 6.97 × 10³ (5.426–8.50) × 103 |
| Random Forest | 98.91 (98.77–99.05) | 100 (100–100) | 96.02 (95.44–96.59) | 0.0398 (0.034–0.0456) | 100 (100–100 | 97.38 (97.19–97.56) | >1000 |
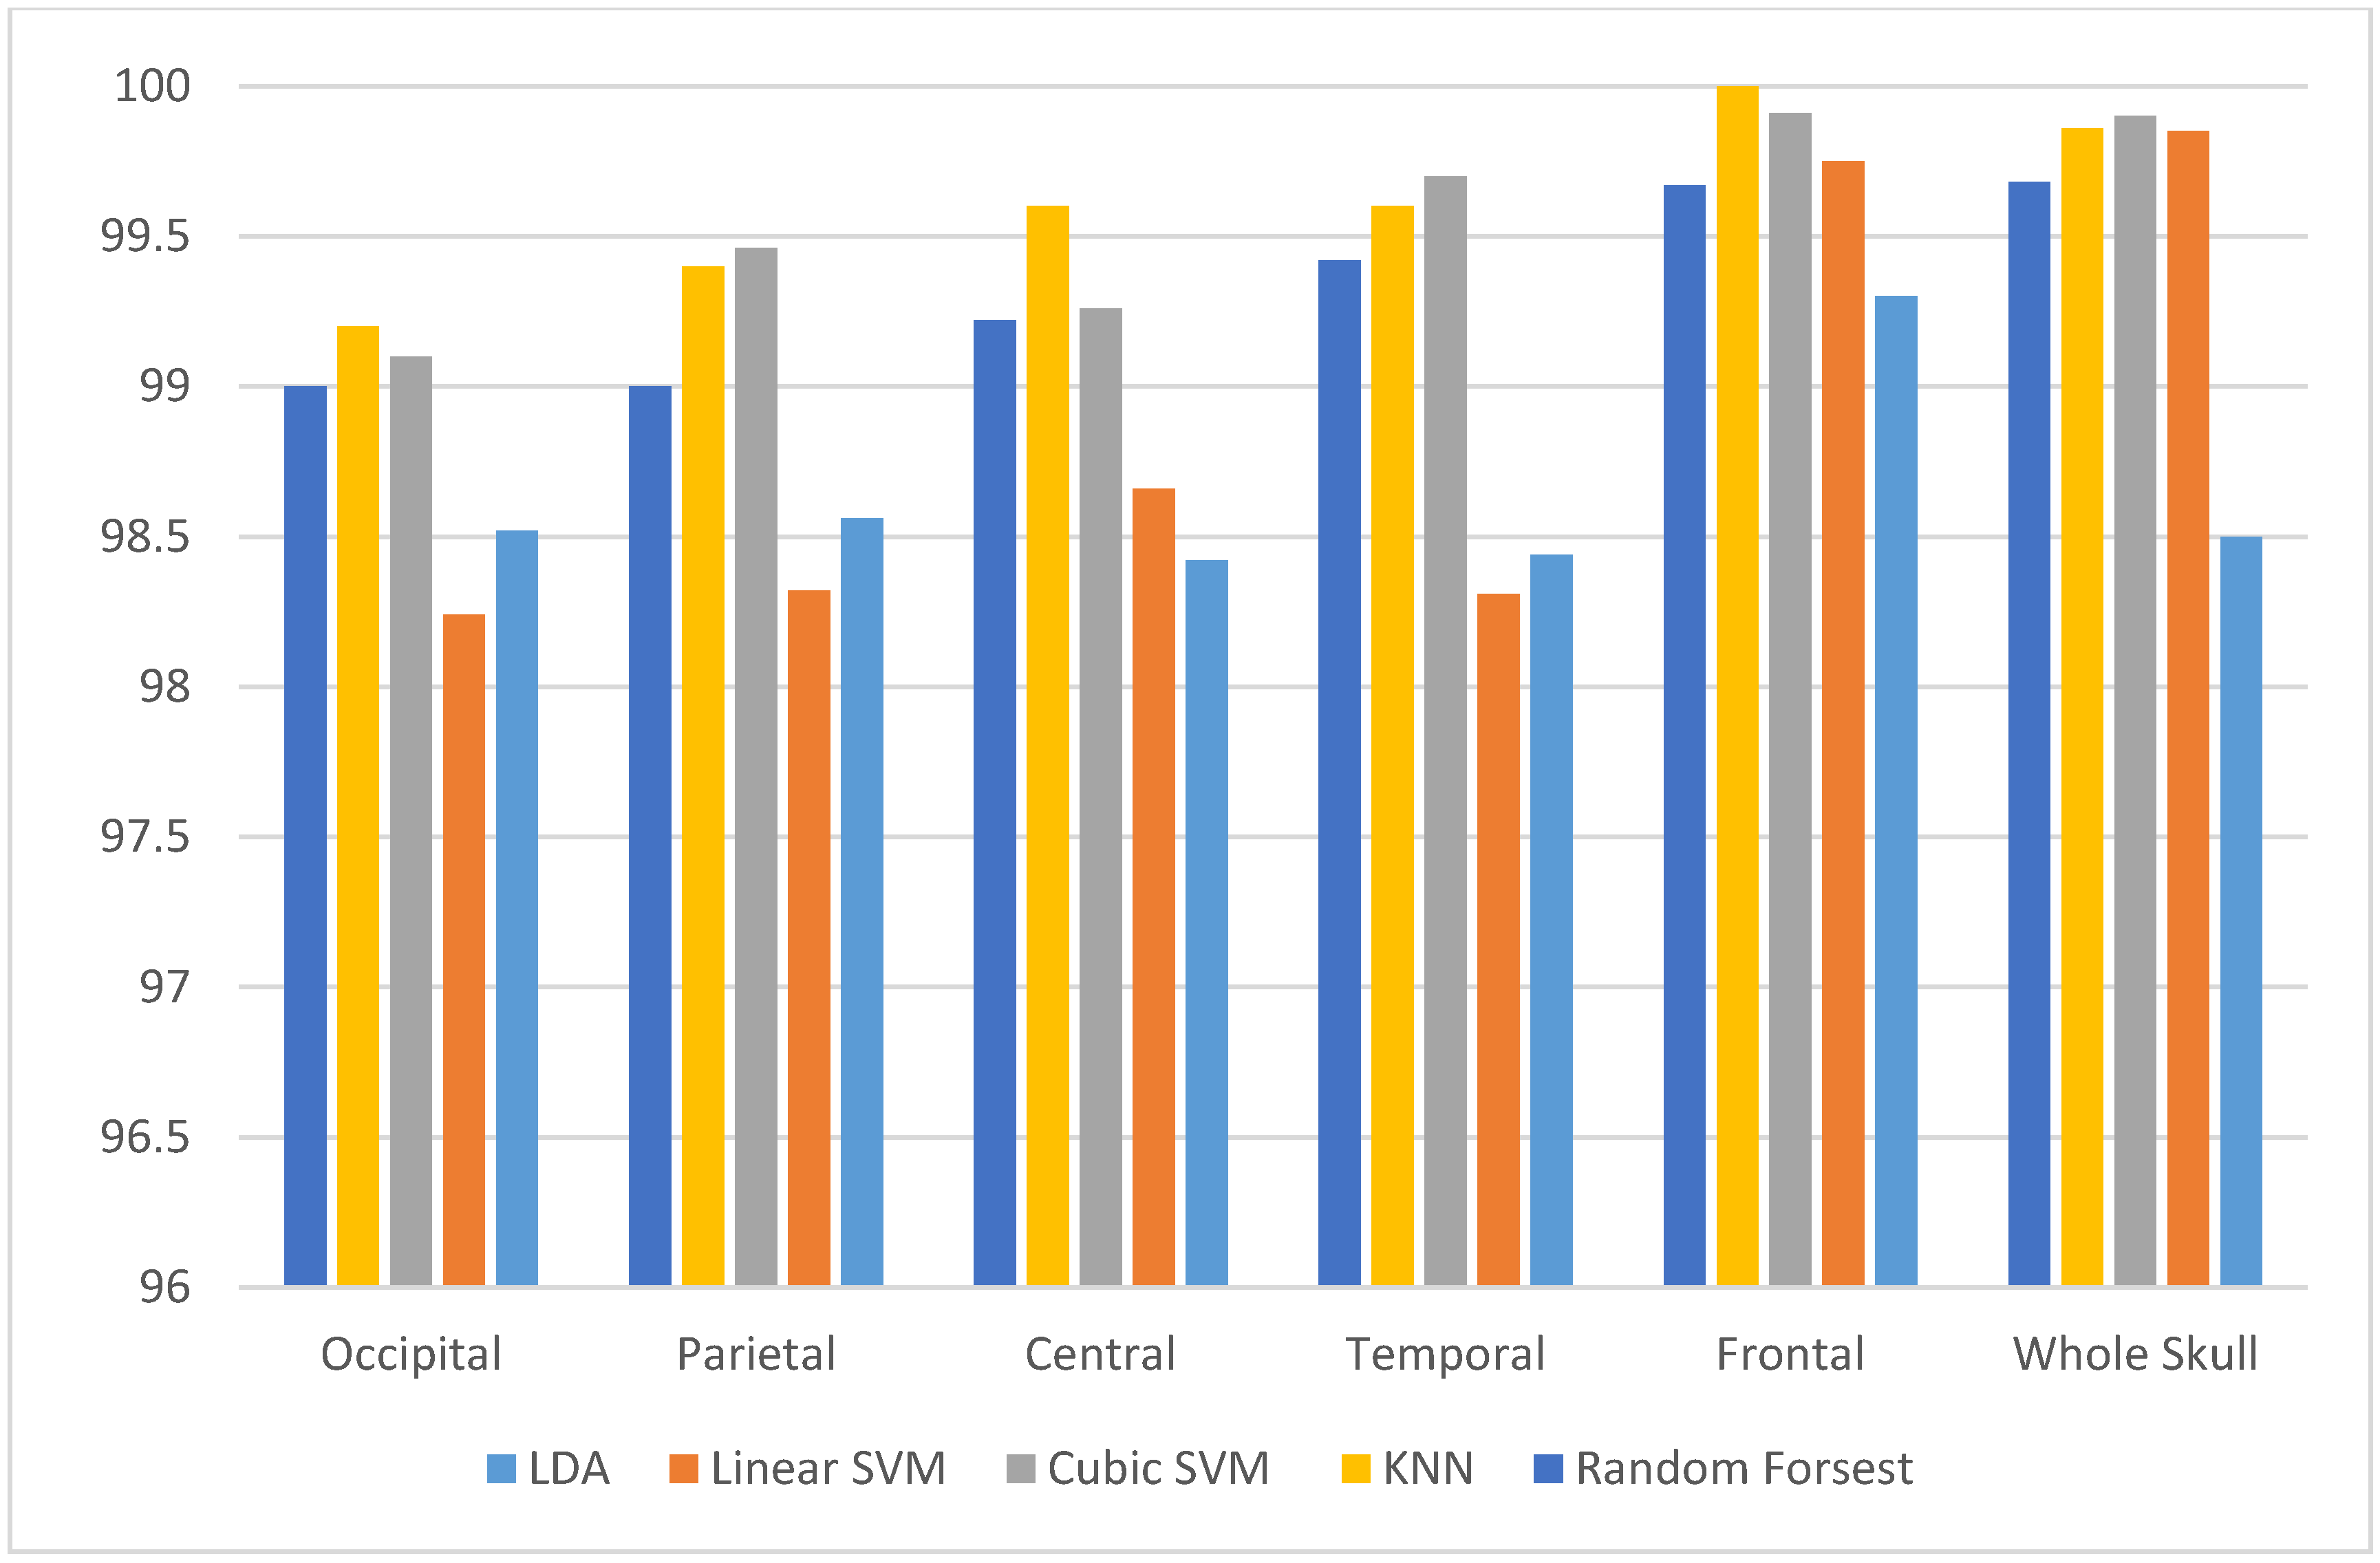
| Classifier | Frontal | Temporal | Central | Parietal | Occipital |
|---|---|---|---|---|---|
| LDA | 99.3 (99.28–99.32) | 98.44 (98.37–98.50) | 98.42 (98.36–98.48) | 98.56 (98.45–98.67) | 98.52 (98.46–98.58) |
| Linear SVM | 99.75 (99.67–99.82) | 98.31 (98.26–98.38) | 98.66 (98.14–99.18) | 98.32 (98.18–98.46) | 98.24 (98.17–98.30) |
| Cubic SVM | 99.91 (99.88–99.93) | 99.7 (99.67–99.73) | 99.26 (99.19–99.33) | 99.46 (99.39–99.53) | 99 (98.92–99.12) |
| KNN | 99.98 (99.96–100) | 99.6 (99.81–99.92) | 99.6 (99.56–99.67) | 99.4 (99.245–99.55) | 99.2 (99.05–99.35) |
| Random Forest | 99.67 (99.65–99.69) | 99.42 (99.39–99.46) | 99.22 (99.19–99.25) | 99 (98.97–99.11) | 99 (98.96–99.08) |
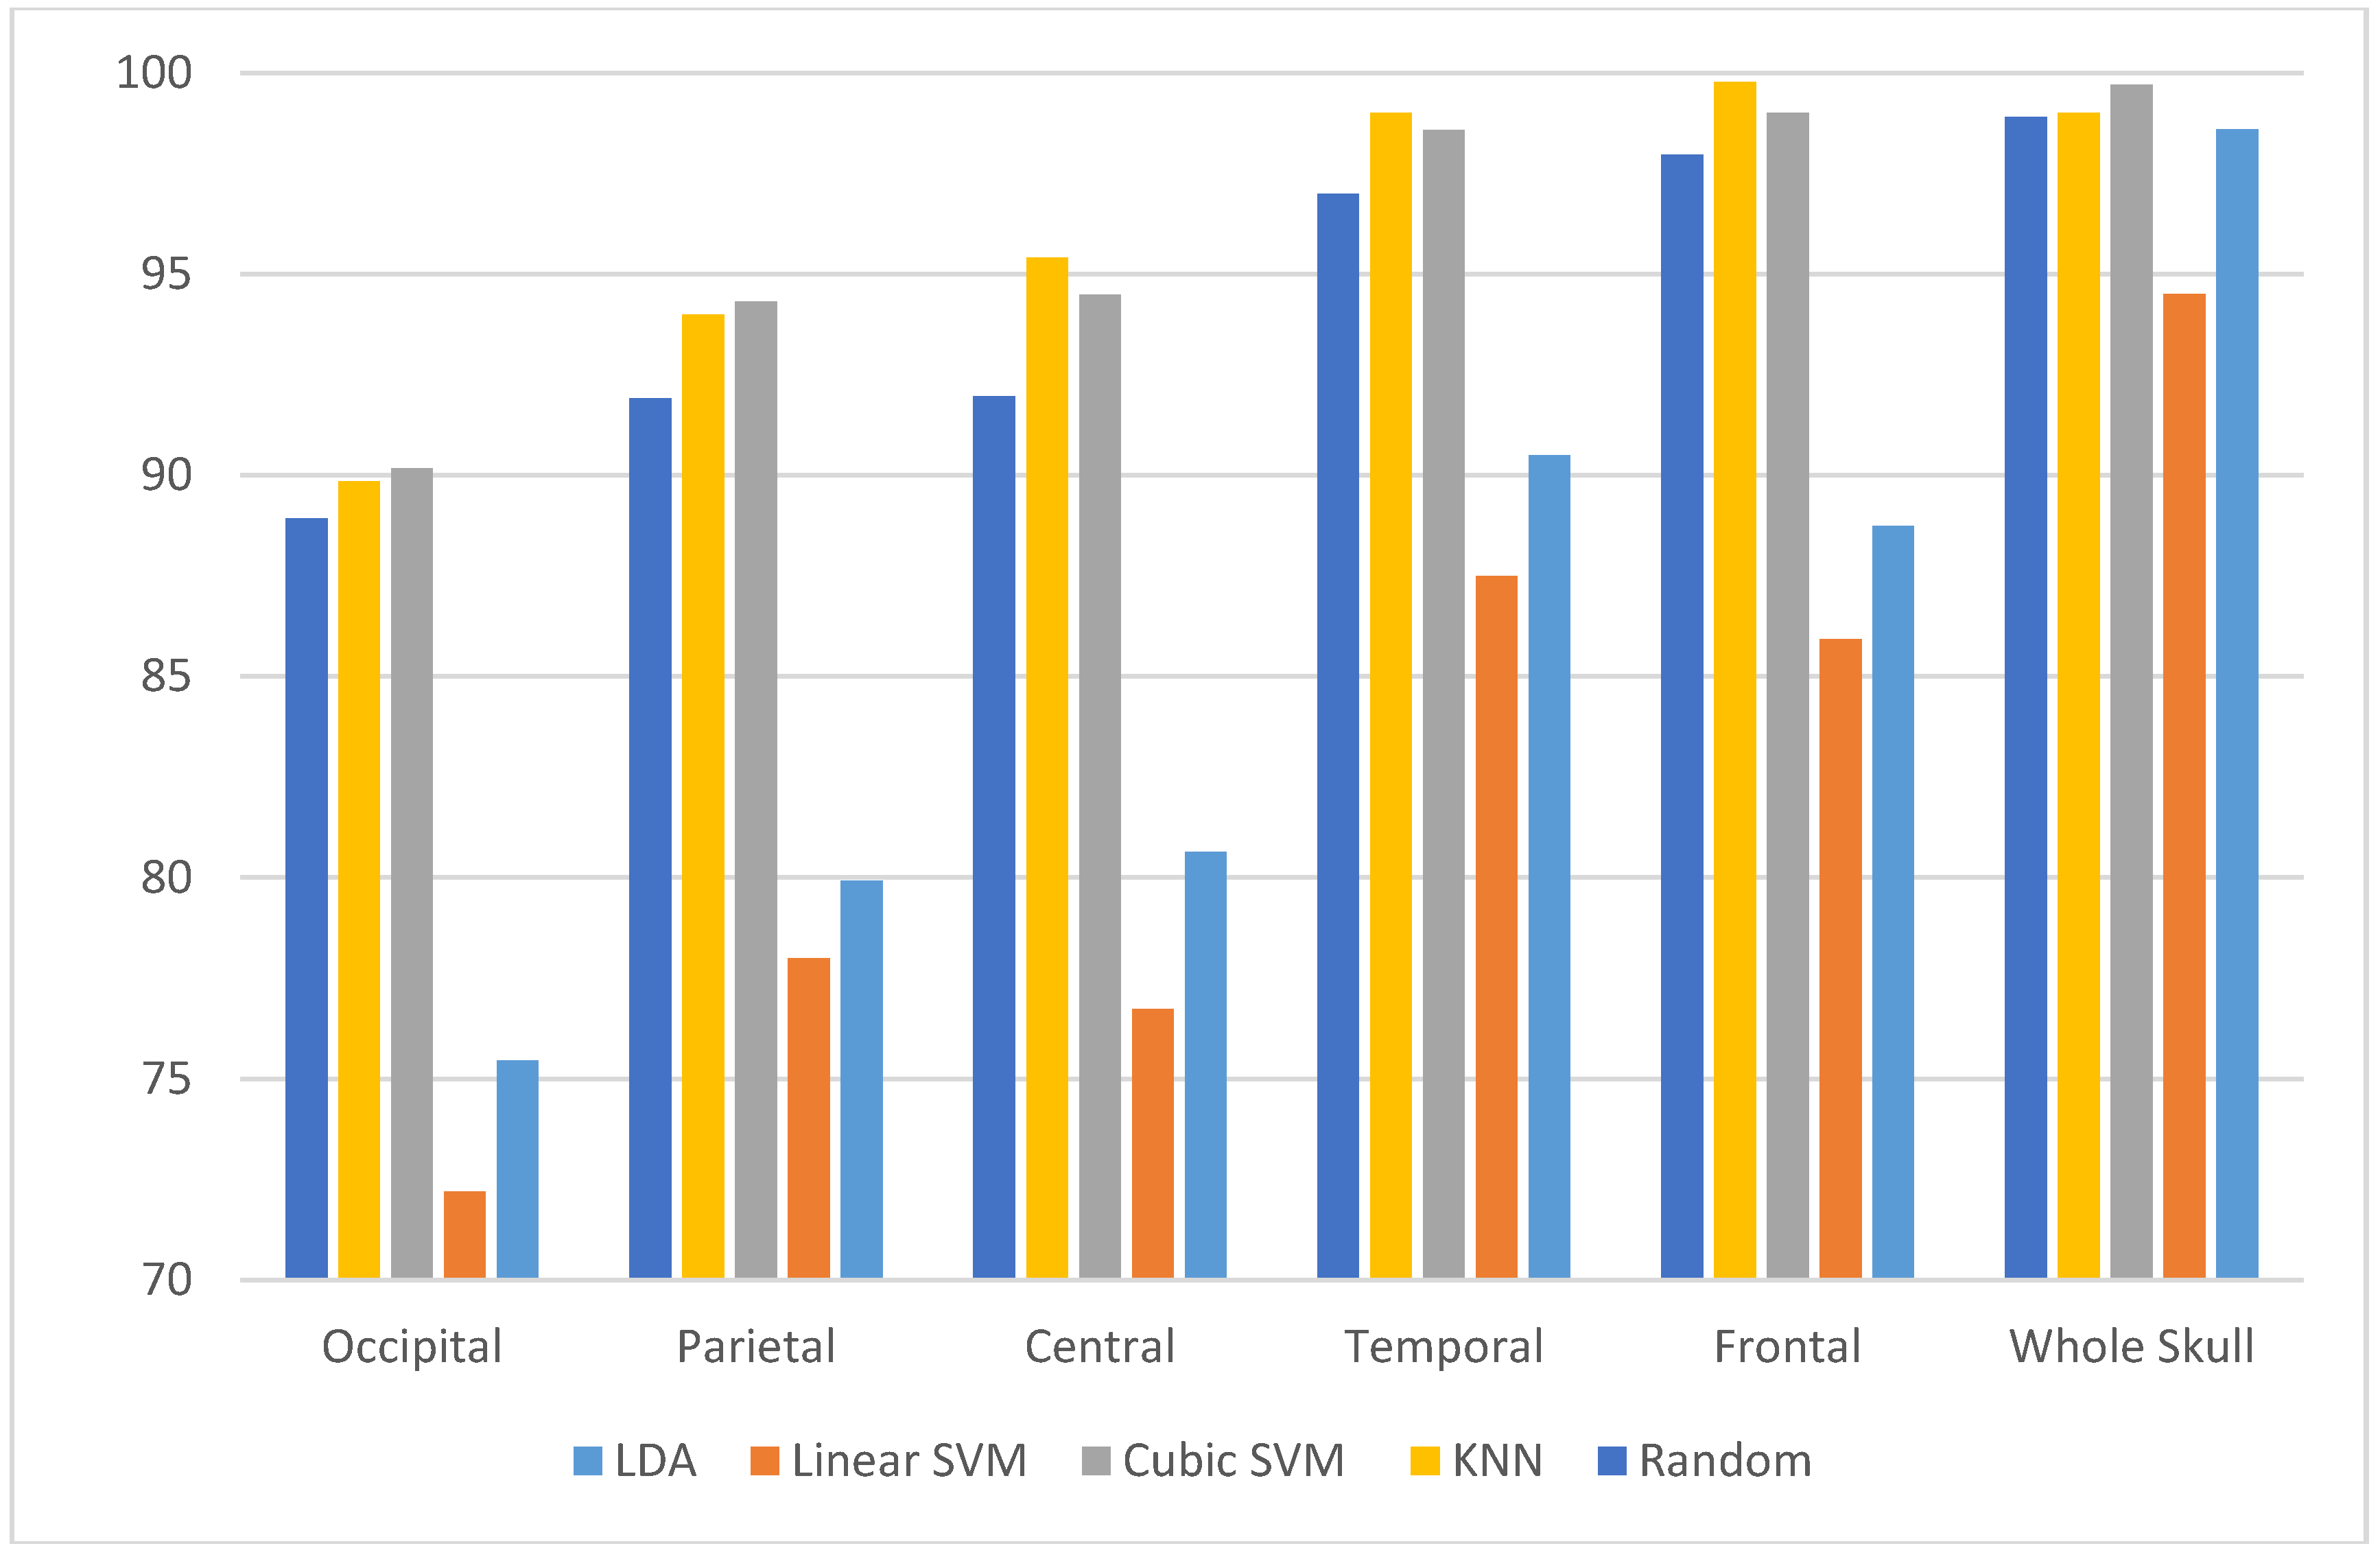
| Classifier | Frontal | Temporal | Central | Parietal | Occipital |
|---|---|---|---|---|---|
| LDA | 88.74 (88.30–89.18) | 90.5 (90.11–90.89) | 80.64 (80.39–80.88) | 79.92 (79.59–80.05) | 75.46 (75.29–75.63) |
| Linear SVM | 85.92 (85.34–86.49) | 87.5 (87.19–87.76) | 76.74 (76.43–77.04) | 78 (77.79–78.25) | 72.2 (72.2–72.2) |
| Cubic SVM | 99 (98.79–99.24) | 98.58 (98.31- 98.85) | 94.48 (93.96–95.0) | 93.32 (92.83–93.80) | 90.18 (89.82– 90.53) |
| KNN | 99.78 (99.72–99.84) | 99 (98.88–99.12) | 95.4 (94.96–95.84) | 94 (93.81–94.27) | 89.84 (89.64–90.03) |
| Random Forest | 97.91 (97.73–98.09) | 97 (96.73–97.33) | 91.96 (91.69–92.22) | 91.92 (91.73–92.12) | 88.93 (88.64–89.22) |
| Classifier | Fp1 | Fp2 | F3 | F4 | FZ | F7 | F8 |
|---|---|---|---|---|---|---|---|
| Detection of Stress and Non-stress | |||||||
| KNN | 99.74 (99.70–99.78) | 99.54 (99.49–99.59) | 99.37 (99.35–99.39) | 97.82 (97.77–97.86) | 99 (98.98–99.08) | 99.29 (99.21–99.37) | 98.87 (98.93–99.02) |
| Cubic SVM | 99.64 (99.63–99.65) | 99.39 (99.35–99.43) | 99.18 (99.14–99.22) | 97.78 (97.73–97.84) | 99.22 (99.20–99.25 | 99.14 (99.09–99.19) | 99 (98.99–99.07) |
| Evaluating Stress Levels | |||||||
| KNN | 92 (91.71–92.29) | 90 (89.82–90.34) | 90.74 (90.32–91.16) | 85.58 (85.32–85.85) | 88.76 (87.96–89.56) | 91.36 (90.92–91.79) | 92.5 (92.18–92.82) |
| Cubic SVM | 88.48 (88.06–88.89) | 88.48 (88.21–88.75) | 88.62 (88.07–89.17) | 87.3 (87.0–87.59) | 89.58 (89.29–89.87) | 92.26 (91.89–92.63) | 90.98 (90.60–91.36) |
| Classifier | Accuracy | Sensitivity | Specificity | Precision | MCC | Goodness Index | DOR |
|---|---|---|---|---|---|---|---|
| KNN | 99.9 (99.84–99.97) | 99.9 (99.65–99.99) | 99.94 (99.84–99.98) | 99.81 (99.49–99.93) | 99.74 (99.71–99.77) | 0.006 (0.004–0.007) | 1057474 (0.67–1.44) × 106 |
| Cubic SVM | 99.75 (99.74–99.77) | 99.65 (99.58–99.71) | 99.79 (99.77–99.81) | 99.37 (99.31–99.43) | 99.34 (99.29–99.40) | 0.0041 (0.003–0.005) | 124250 (1.14–1.35) × 105 |
| Classifier | Accuracy (%) | Sensitivity (%) | Specificity (%) | Precision (%) | MCC (%) | Goodness Index | DOR |
|---|---|---|---|---|---|---|---|
| KNN | 98.48 (97.47–99.49) | 97.78 (97.07–100) | 97.75 (95.90–99.59) | 99.26 (98.66–99.86) | 96.14 (93.69–98.58) | 0.032 (0.0041–0.05) | >1000 |
| Cubic SVM | 98.67 (97.82–99.53) | 98.96 (97.67–100) | 98.26 (95.68–100) | 99.29 (98.44- 100) | 96.6 (94.47–98.73) | 0.02 (0–0.04) | >1000 |
| Classifier | Accuracy (%) | Sensitivity (%) | Specificity (%) | Precision (%) | MCC (%) | Goodness Index | DOR |
|---|---|---|---|---|---|---|---|
| Fp1 + F8 | |||||||
| KNN | 97.52 (94.68–100) | 97.59 (97.19–97.97) | 99.36 (99.15–99.57) | 98.37 (97.9–98.83) | 97.32 (96.94–97.69) | 0.025 (0.021–0.096) | 7708 (0.51–1.03) × 104 |
| Cubic SVM | 97.48 (97.37–97.58) | 94.96 (94.6–95.27) | 98.46 (98.37–98.54) | 95.56 (95.75–96.16) | 93.73 (93.47–93.97) | 0.053 (0.049–0.056) | 3611 (1.56–8.78) × 103 |
| Fp1 + F7 + F8 | |||||||
| KNN | 99.26 (99.17–99.34) | 98.35 (98.05–98.64) | 99.6 (99.56–99.66) | 98.9 (98.65–99.15) | 98.15 (97.99–98.32) | 0.017 (0.014–0.02) | 15935 (1.37–1.81) × 104 |
| Cubic SVM | 98.36 (98.25–98.46) | 96.65 (96.23–97.07) | 99 (98.89–99.15) | 97.43 (97.10–97.75) | 95.89 (95.62–96.15) | 0.035 (0.031–0.04) | 2977 (2.6–3.34) × 103 |
| Classifier | Accuracy (%) | Sensitivity (%) | Specificity (%) | Precision (%) | MCC (%) | Goodness Index | DOR |
|---|---|---|---|---|---|---|---|
| Fp1 + F8 | |||||||
| KNN | 76.85 (67.14–86.58) | 67.15 (53.17–81.25) | 78.85 (64.54–93.15) | 63.83 (49.6–77.56) | 48.88 (34.13–63.63) | 0.39 (0.2–0.58) | 17 (7.669–26.4) |
| Cubic SVM | 75.8 (66.59–84.99) | 65.26 (50.37–76.14) | 80.3 (65.89–94.73) | 61.64 (47.85–75.42) | 44.87 (30.79–58.95) | 0.4 (0.24–0.61) | 14.13 (2.675–25.59) |
| Fp1 + F7 + F8 | |||||||
| KNN | 76.2 (65.77–86.61) | 65.66 (48.56–82.77) | 80.14 (64.02–96.256 | 63.48 (47.97–78.99) | 47.85 (32.13–63.57) | 0.444 (0.295–0.593) | 22.28 (0.6879–43.87) |
| Cubic SVM | 73.83 (62.82–84.83) | 52.04 (34.86–69.22) | 77 (58.98–95.13) | 60.77 (44.26–77.28) | 48 (32.25–63.81) | 0.545 (0.424–0.67) | 12.39 (3.92–20.86) |
© 2020 by the author. Licensee MDPI, Basel, Switzerland. This article is an open access article distributed under the terms and conditions of the Creative Commons Attribution (CC BY) license (http://creativecommons.org/licenses/by/4.0/).
Share and Cite
Attallah, O. An Effective Mental Stress State Detection and Evaluation System Using Minimum Number of Frontal Brain Electrodes. Diagnostics 2020, 10, 292. https://doi.org/10.3390/diagnostics10050292
Attallah O. An Effective Mental Stress State Detection and Evaluation System Using Minimum Number of Frontal Brain Electrodes. Diagnostics. 2020; 10(5):292. https://doi.org/10.3390/diagnostics10050292
Chicago/Turabian StyleAttallah, Omneya. 2020. "An Effective Mental Stress State Detection and Evaluation System Using Minimum Number of Frontal Brain Electrodes" Diagnostics 10, no. 5: 292. https://doi.org/10.3390/diagnostics10050292
APA StyleAttallah, O. (2020). An Effective Mental Stress State Detection and Evaluation System Using Minimum Number of Frontal Brain Electrodes. Diagnostics, 10(5), 292. https://doi.org/10.3390/diagnostics10050292