3.1. Characterization of Phormidium sp. KS
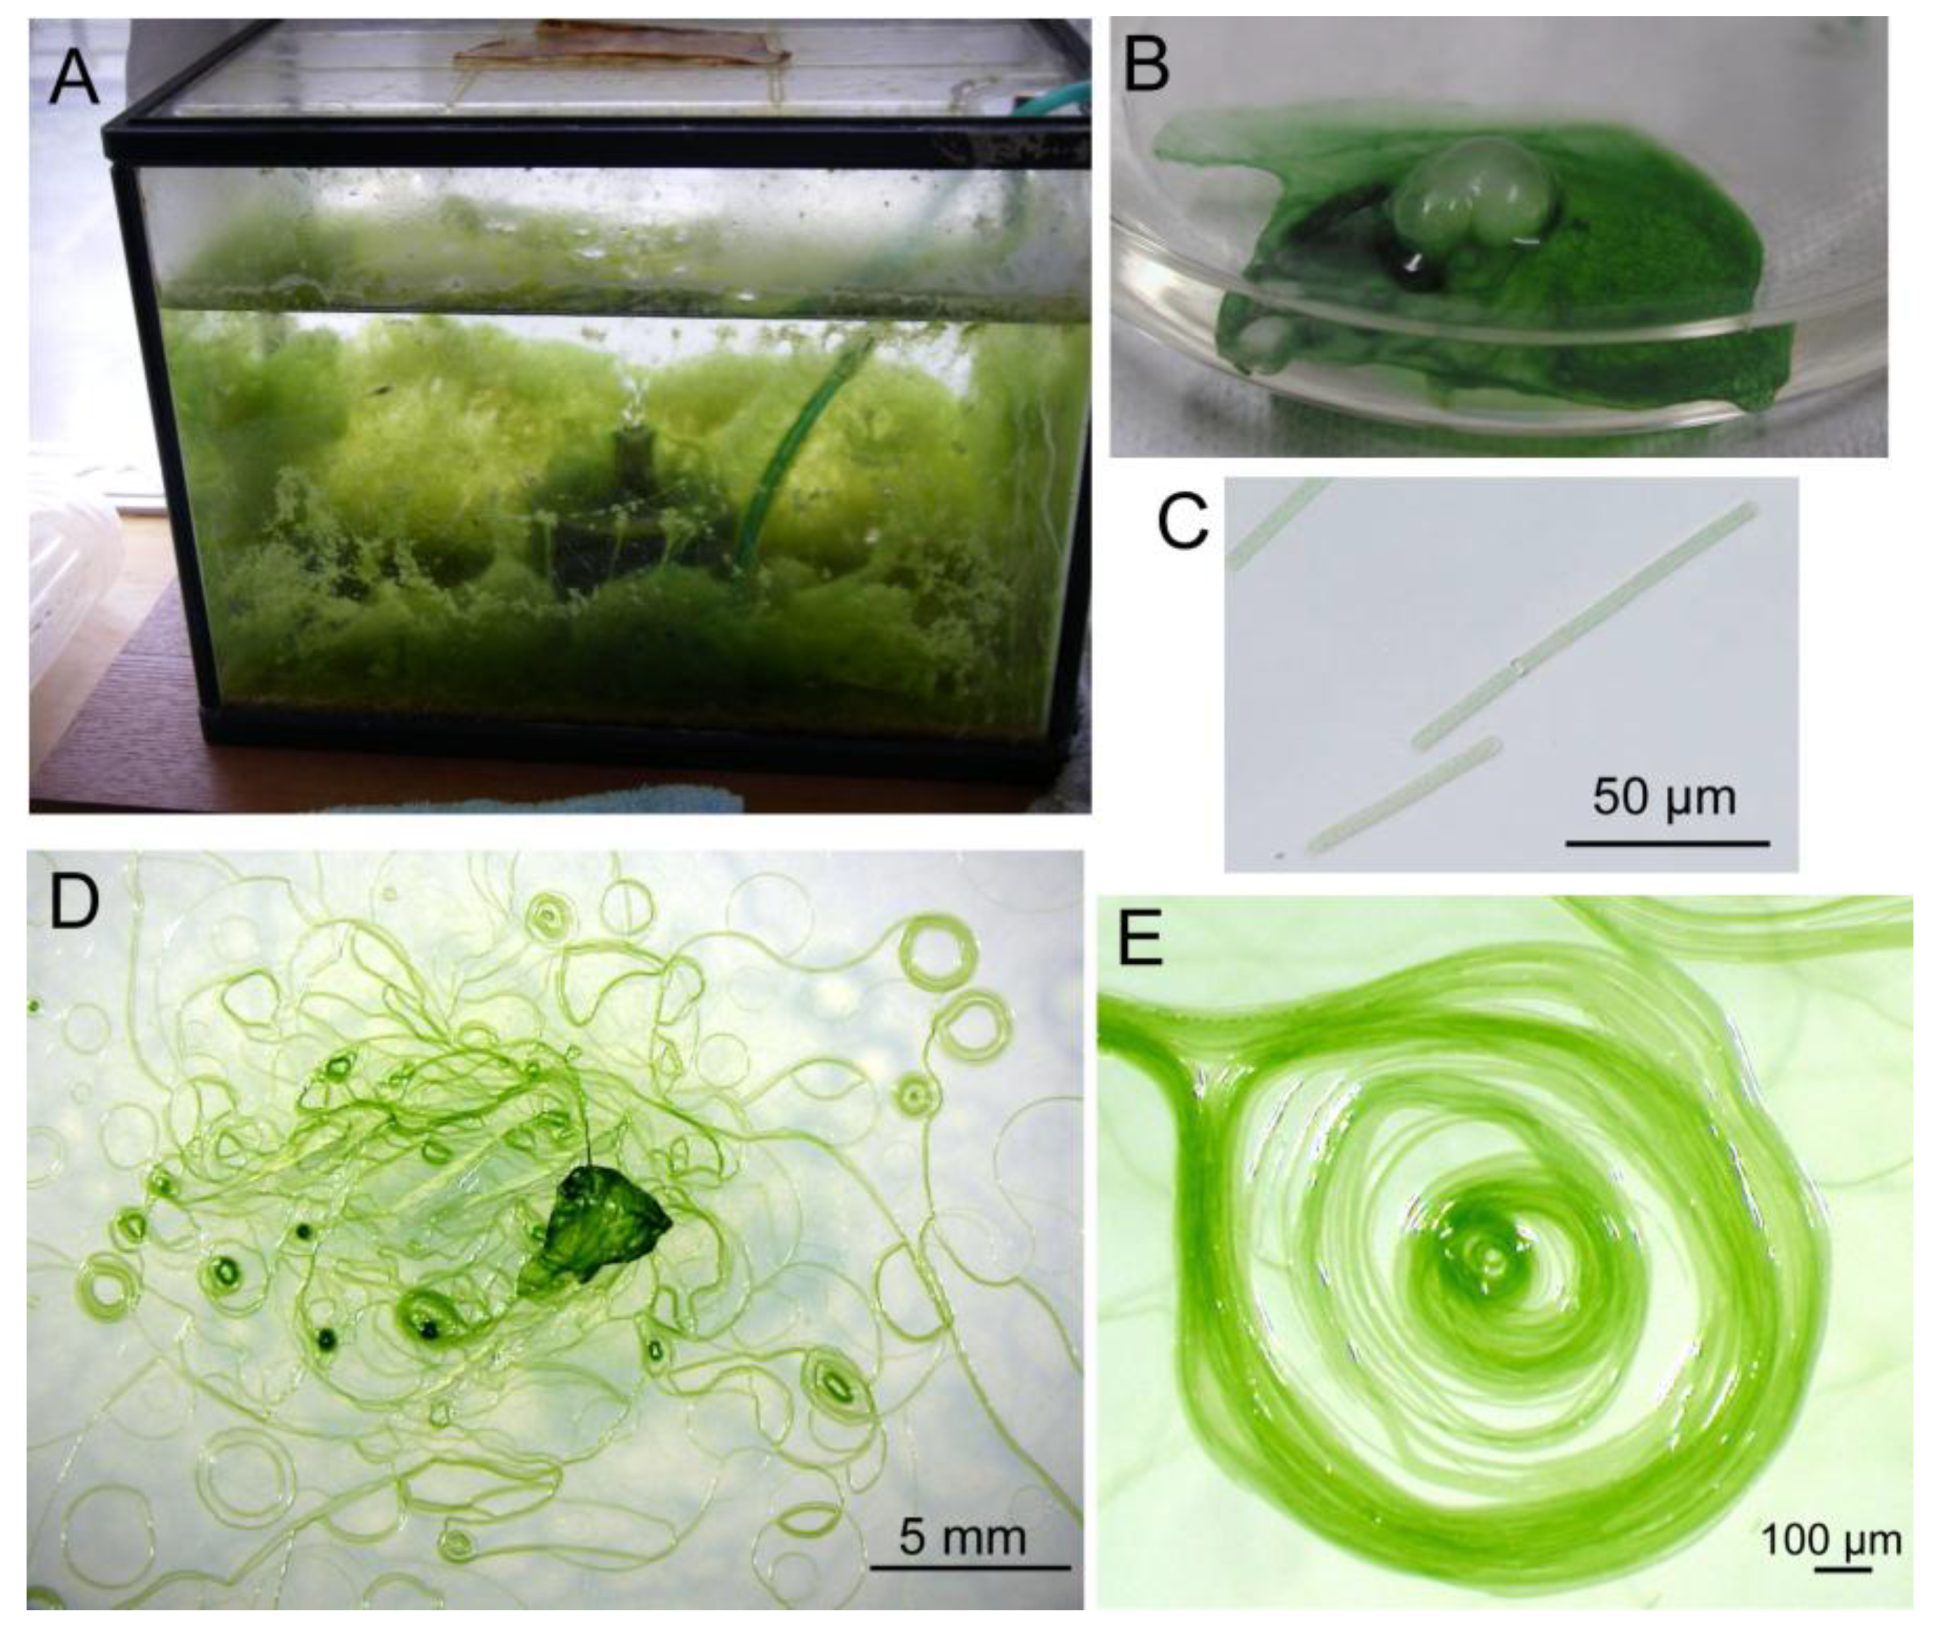
We obtained a filamentous cyanobacterium from an aquarium (
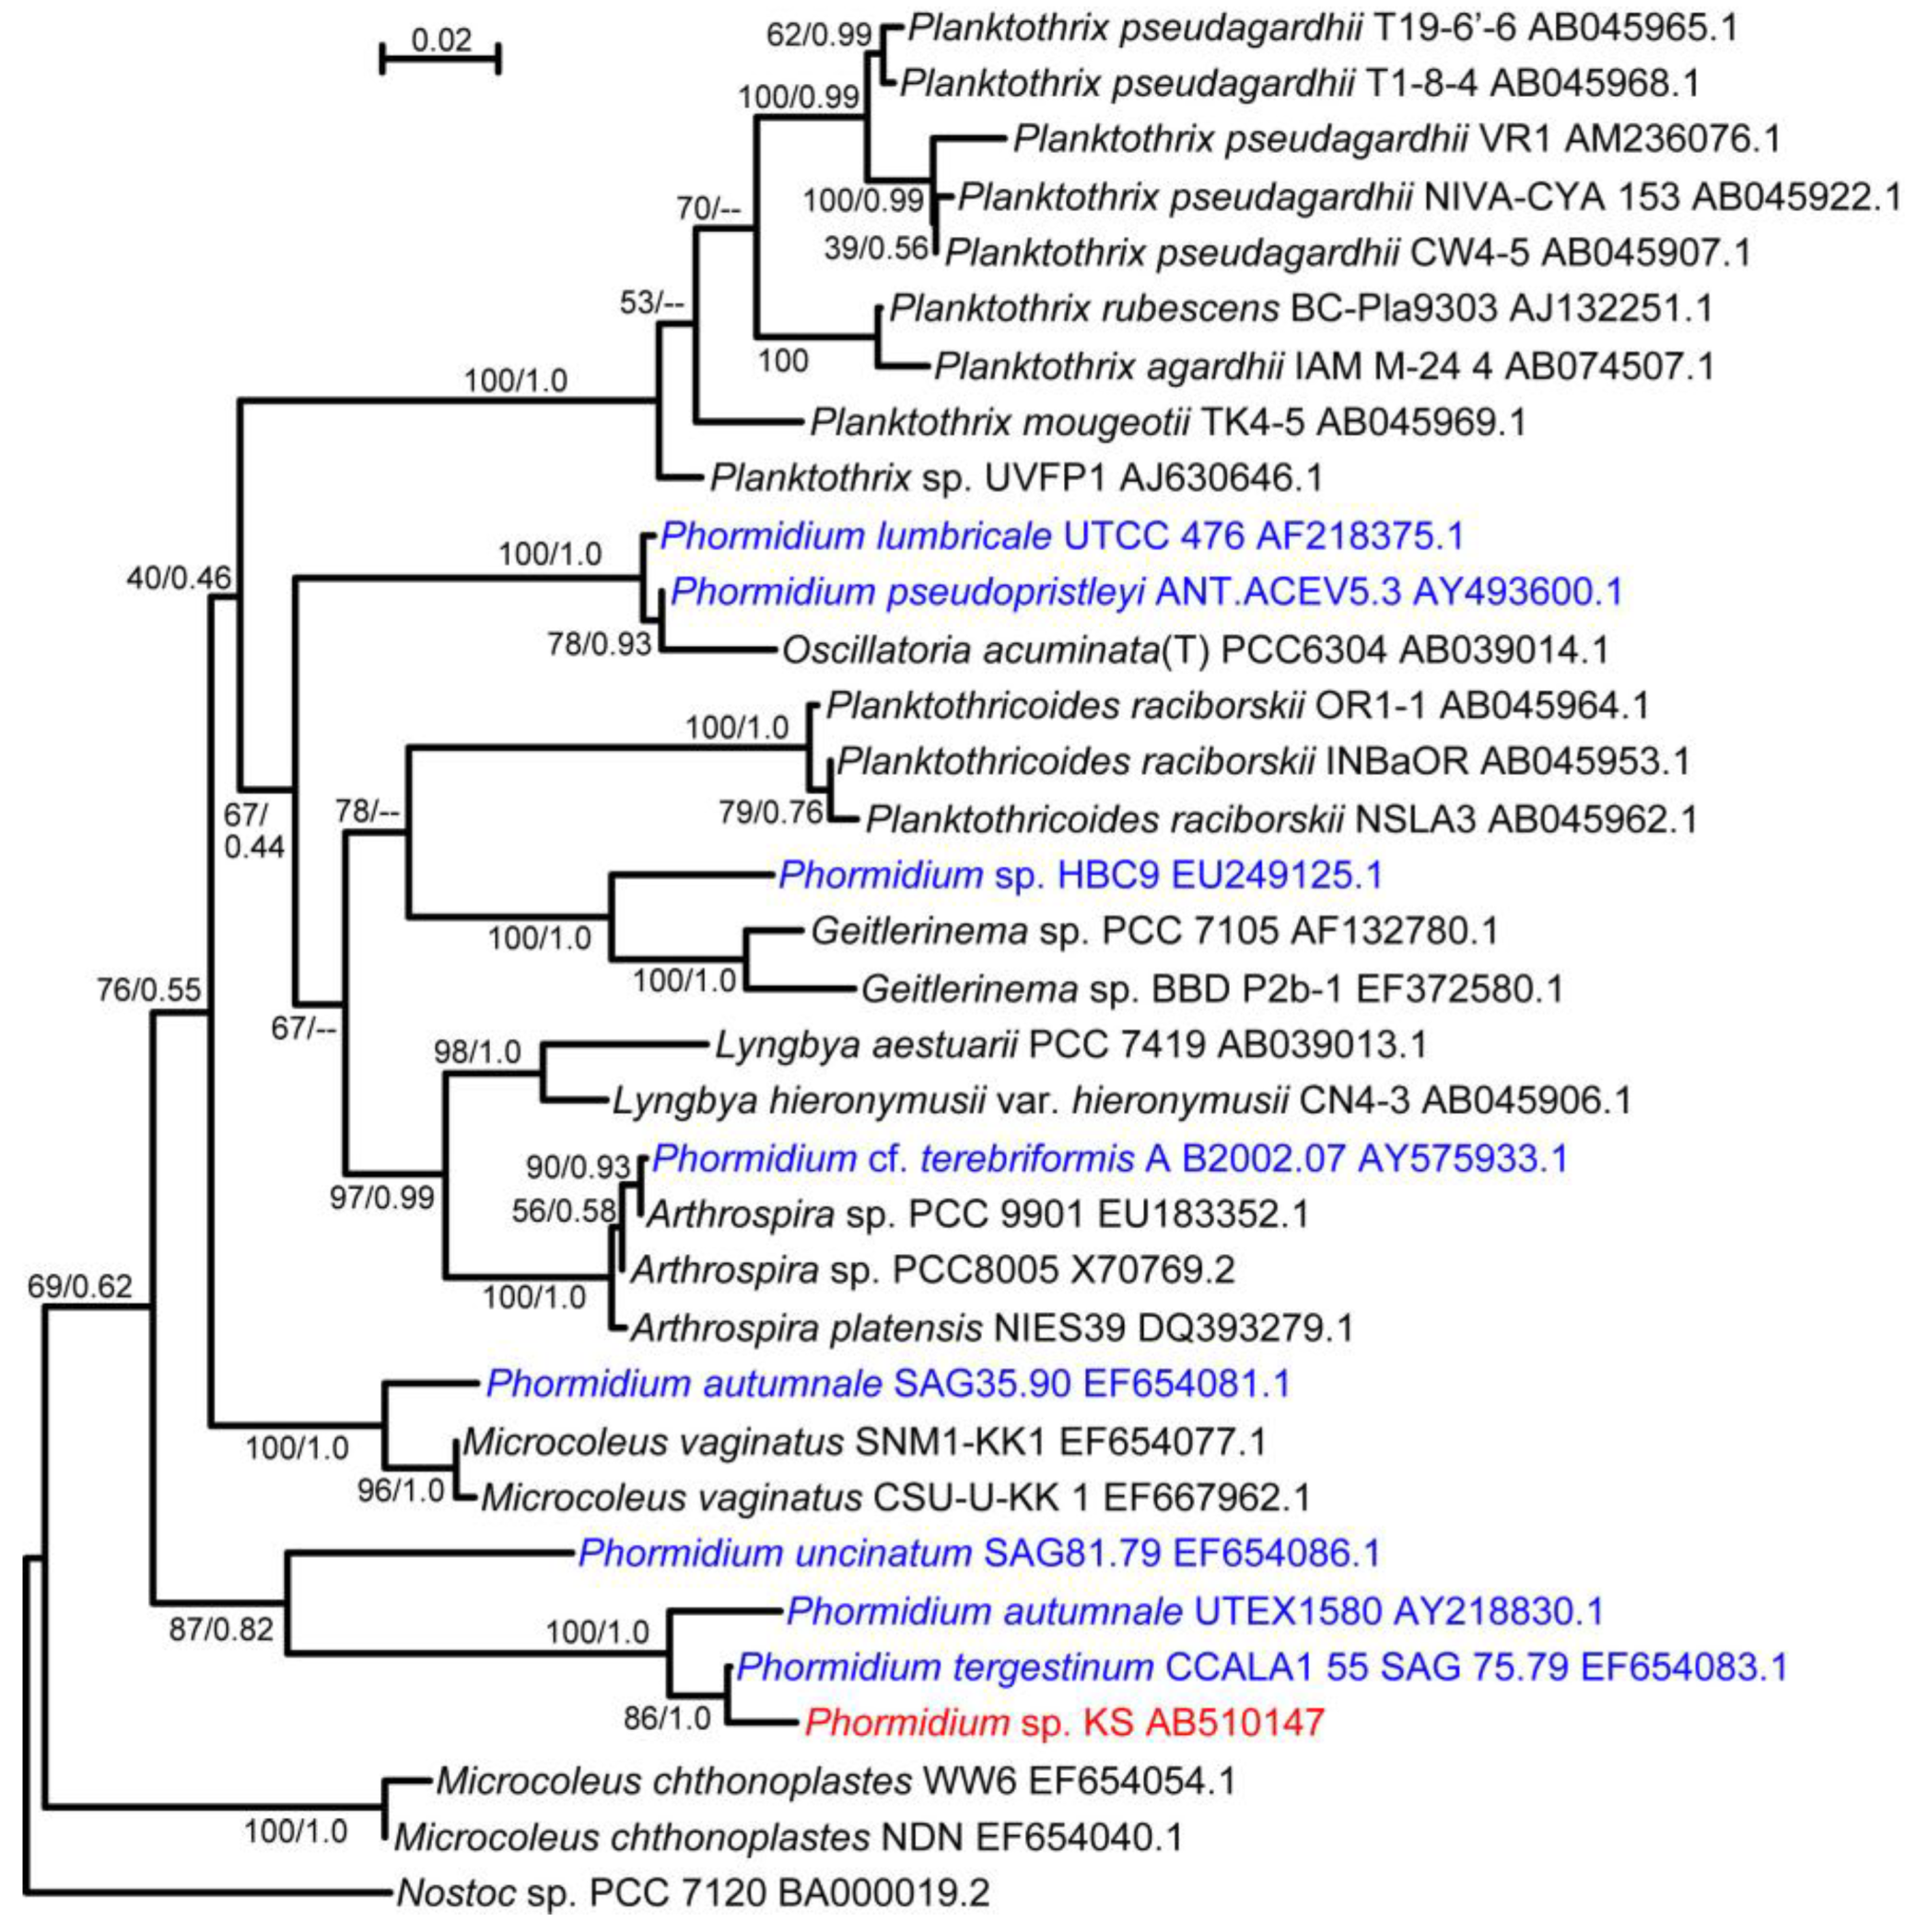
Figure 1A) and purified it by repeated plating. Since the filaments did not form colonies, a newly growing tip of a filament on a virgin agar plate was picked up and inoculated on a new plate. Sequencing analysis of the rDNA suggested that this cyanobacterium was a member of the
Phormidium clade (
Figure 2). It has been shown that various cyanobacterial strains under the name
Phormidium are, in fact, paraphyletic [
13]. In this respect, our isolate was included in clade number 11 [
13]. The closest relative was
Phormidium tergestinum CCALA1 55 SAG 75.79. We call our isolate
Phormidium sp. KS.
Figure 1.
Different views of growing Phormidium sp. KS. (A) Phormidium is growing like seaweed in an aquarium; (B) Biofilm of Phormidium with an air bubble formed spontaneously; (C) Individual short filaments of Phormidium; (D) Spirals formed on an agar plate; (E) Enlarged view of a spiral consisting of many filaments.
Figure 2.
Maximum likelihood (ML) tree of Phormidium sp. KS and related cyanobacteria based on 16S rDNA sequences. Each set of values separated by a slash on each branch indicates the confidence values with ML and neighbor joining (NJ) methods. Hyphens indicate that the branch was not supported by the NJ method. Various strains with the name Phormidium are in blue, whereas the strain KS is shown in red. The accession number in GenBank is shown with the strain name. Nostoc sp. PCC 7120 was added as an outgroup. The uppermost bar indicates the scale for the branch length (substitutions per site).
3.3. Ultrastructure of Phormidium Filaments
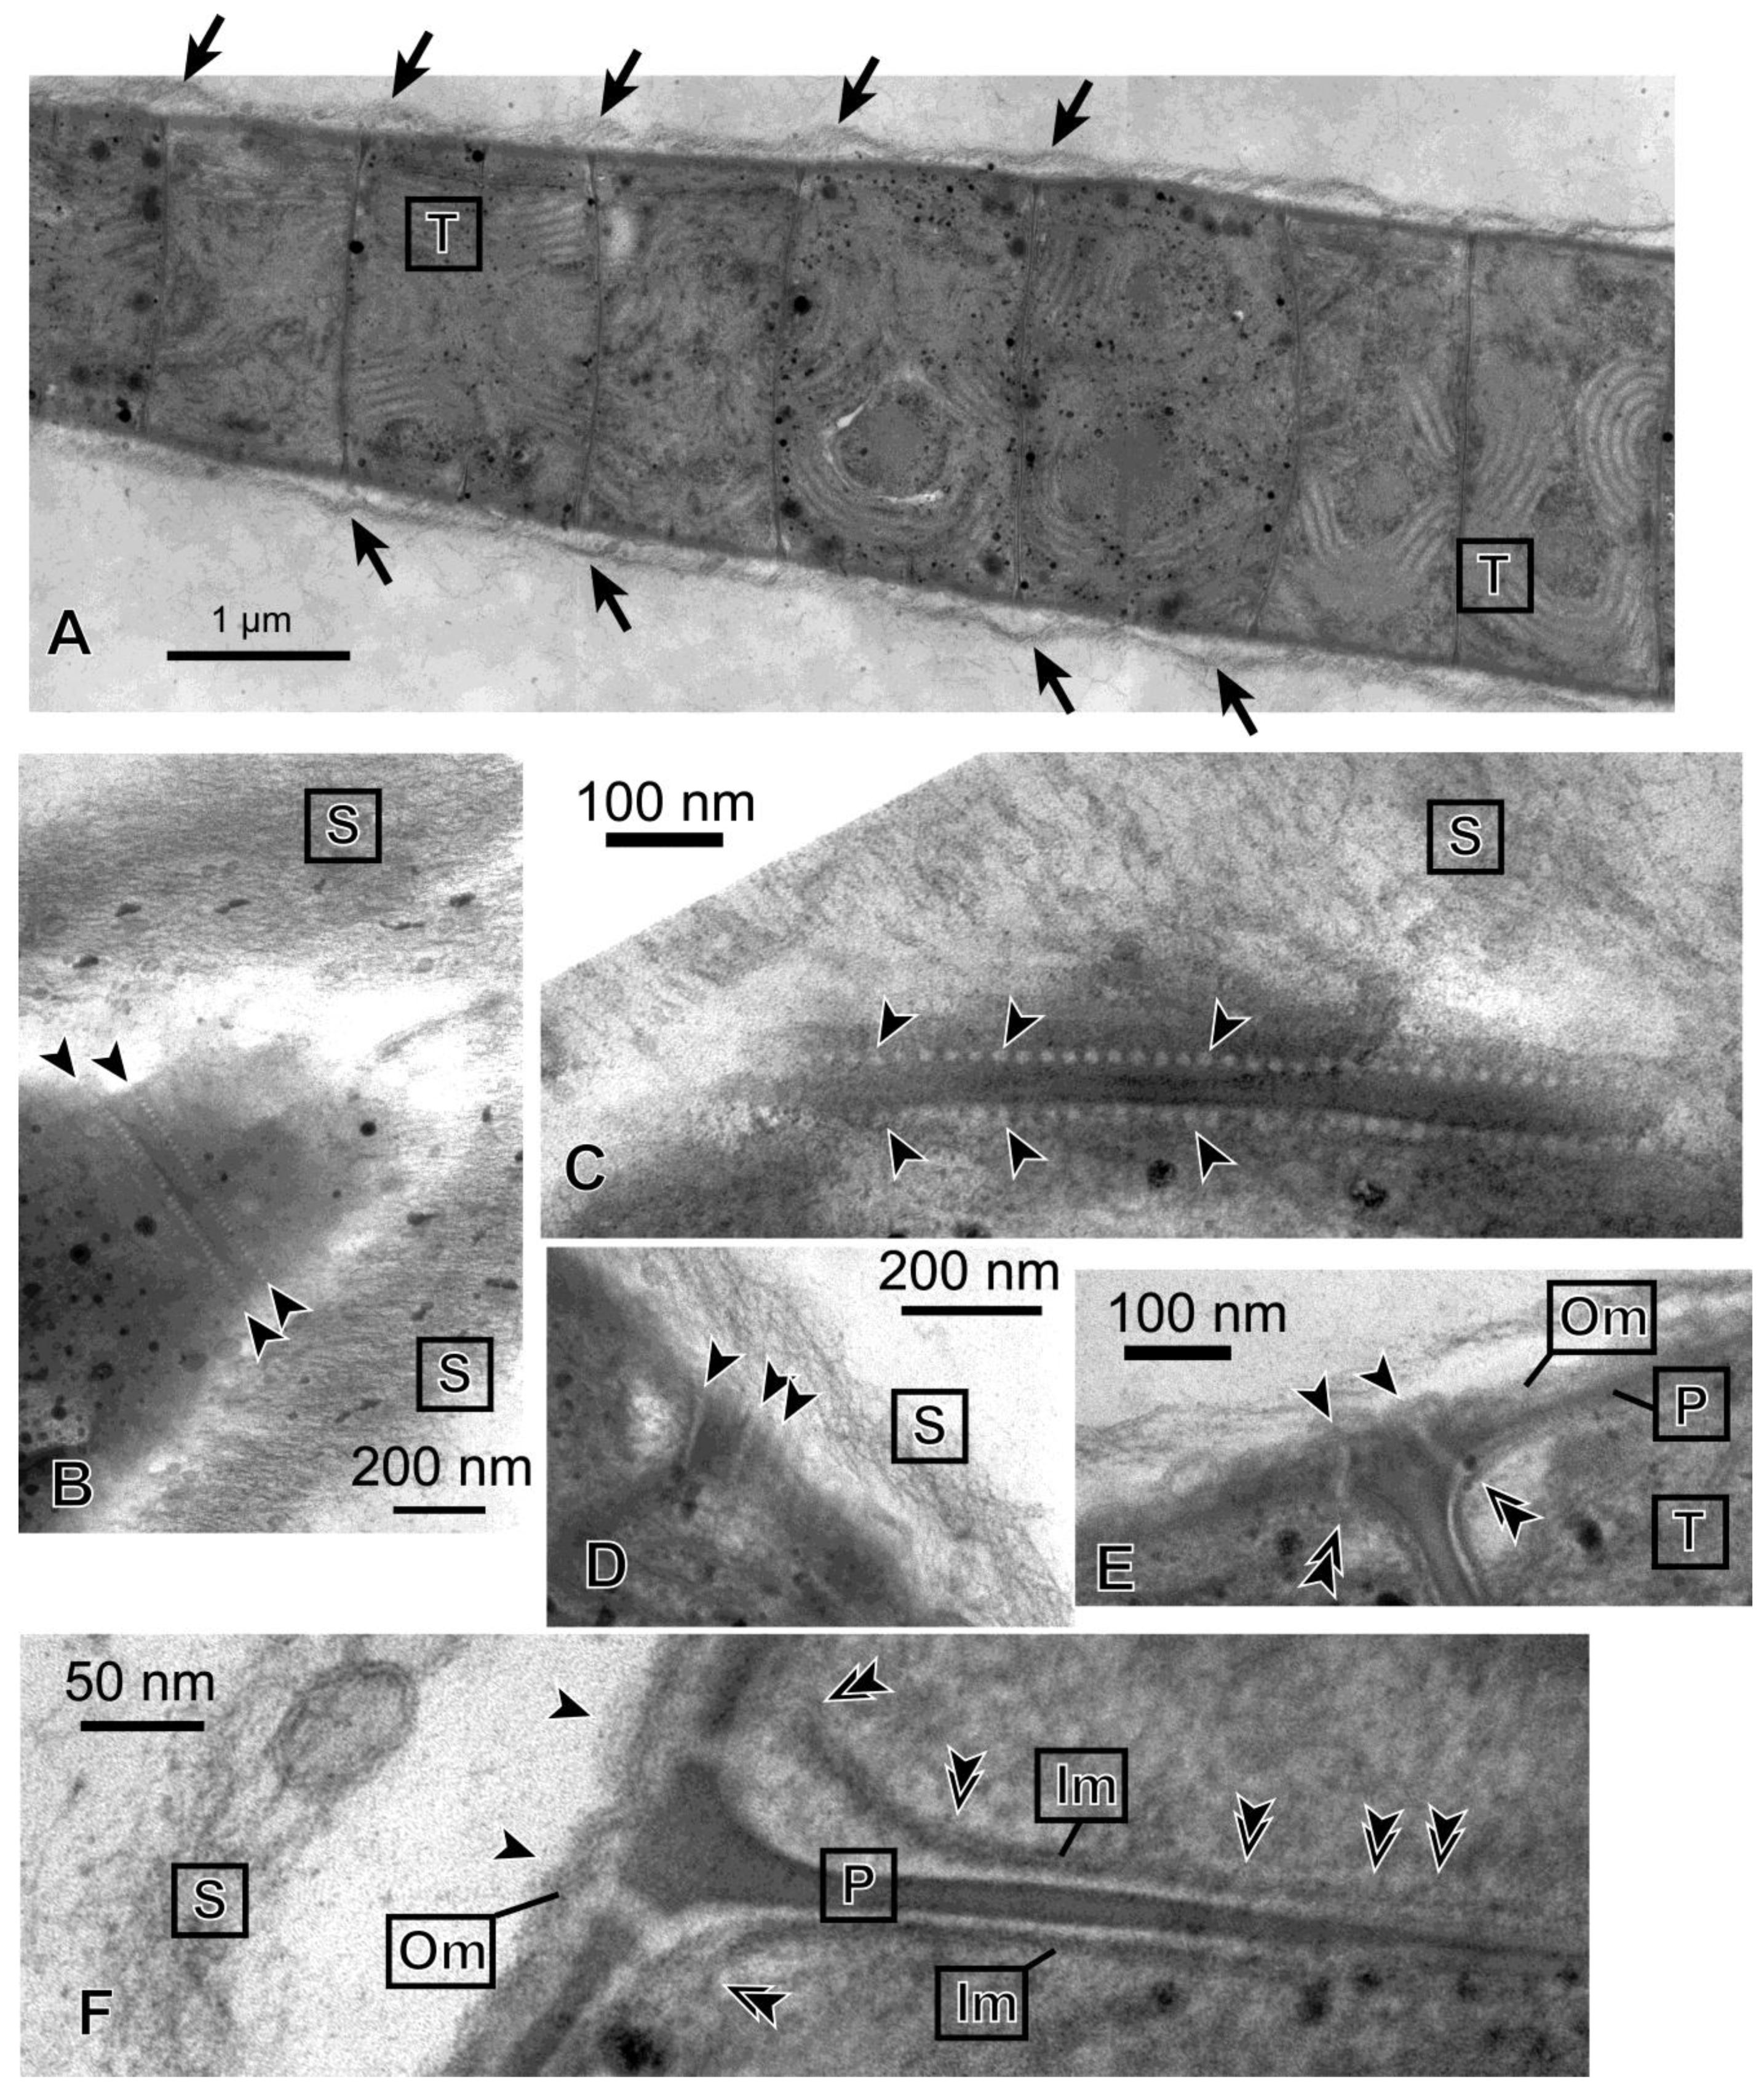
Figure 3 shows the ultrastructure of a filament of
Phormidium sp. KS. The entire filament was very long, and
Figure 3A shows only a part of it. The individual cells were thin discs that were stacked to form a filament. Within a cell, parallel rows of thylakoids (labeled “T”) were seen. The entire filament was covered with a thick sheath, which consisted of thin fibrous materials (labeled “S”). The sheath was separated from the cell body at the sites of septa. This is compatible with the idea that mucilage (or slime) is secreted from the junctional pores [
16], which were found to align on both sides of a septum (
Figure 3B,C). The size of a pore was about 10−15 nm in diameter, and the interval was about 20 nm. The pores seemed to penetrate the outer membrane, peptidoglycan layer and inner membrane like straight tubes (
Figure 3E,F). The diameter of the tube seemed larger, however, when it passed the space between the peptidoglycan layer and inner membrane. In an obliquely cut section (
Figure 3D), several pores in alignment were found to penetrate the cell envelope. The axis of the pore-forming tubes seemed to incline with respect to the axis of the filament, so that the excreted mucilage could generate a helical flow. In the interior region of an inner membrane facing a septum (
Figure 3F), bulge-like deformations were found to locate at an interval of 20 nm, suggesting that these correspond to the location of junctional pores.
Figure 3.
Transmission electron micrographs of Phormidium sp. KS. (A) Longitudinal section of a part of a long filament. Arrows indicate that the sheath layer is separated from the cell body at each septum. This large panel is a collage of three different images, which were assembled with imaging software Photoshop (Adobe); (B) The tangential section of a tapered tip of a filament. A row of junctional pores on each side of the septum is indicated between the arrowheads; (C) Close-up view of the rows of junctional pores (arrowheads); (D) Longitudinal view of junctional pores (arrowheads) seen in an obliquely cut section; (E) Junctional pores spanning the entire cell envelope. Each arrowhead indicates the site of connection of the junctional pore and outer membrane. Each double arrowhead indicates the site of connection of the junctional pore and inner membrane; (F) Enlarged view of a section of a septum. Two junctional pores spanning the left surface of the cells are shown, each between an arrowhead and a double arrowhead. The bulges of membrane identified in the inner membrane facing the septum (double arrowheads) could be the sites corresponding to the location of junctional pores (we assume that the pore-forming tube is oriented nearly vertically to the image). Note that the inner membranes were obscured at their left end, because the membranes were not cut at a right angle at these sites. Im, inner membrane; Om, outer membrane; P, peptidoglycan layer; S, sheath; T, thylakoid membrane.
![Life 04 00819 g003]()
3.4. Growth of Filaments on Agar Plates
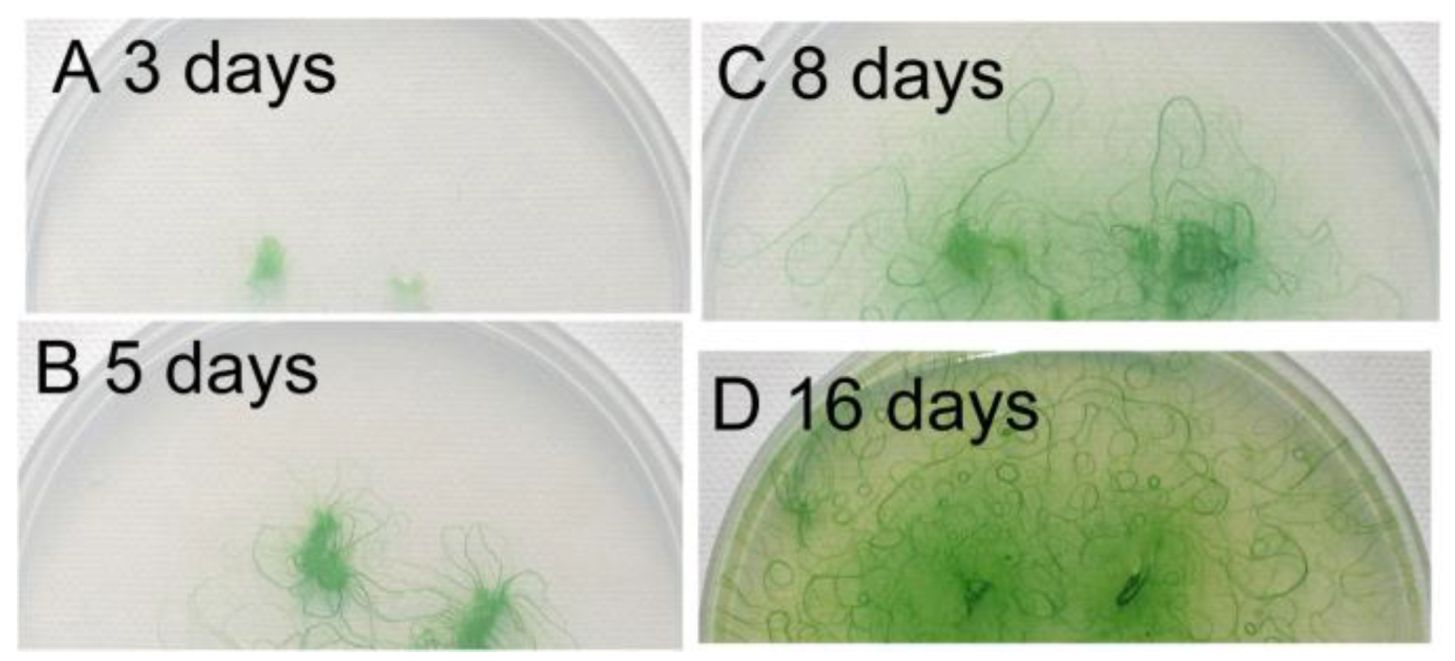
Figure 4 shows the growth of filaments on an agar plate, beginning from small agar plugs. The filaments developed radially during the first five days, but then, the direction of growth was diversified, because of the crowding of the filaments. At the same time, bundles of filaments were formed and became clearly visible (
Figure 4C). We can see some U-shaped bundles of filaments. Finally, many small circles became visible (
Figure 4D). These results indicate that the formation of spirals was an outcome of the dynamic growth of filaments accompanying the movement of filaments. Although any single short filament was straight (
Figure 1C), the curved shape of filaments developed with time, with the elongation of filaments by cell division.
Figure 4.
Growth of filaments on an agar plate. Small agar plugs containing filaments of Phormidium were placed on a 1.5% agar plate (diameter: 9 cm), and the cells were allowed to grow under continuous light at 30 °C. An identical plate was photographed at different time points. (A) Day 3; (B) Day 5; (C) Day 8; (D) Day 16. Note that many small spirals are formed after 16 days.
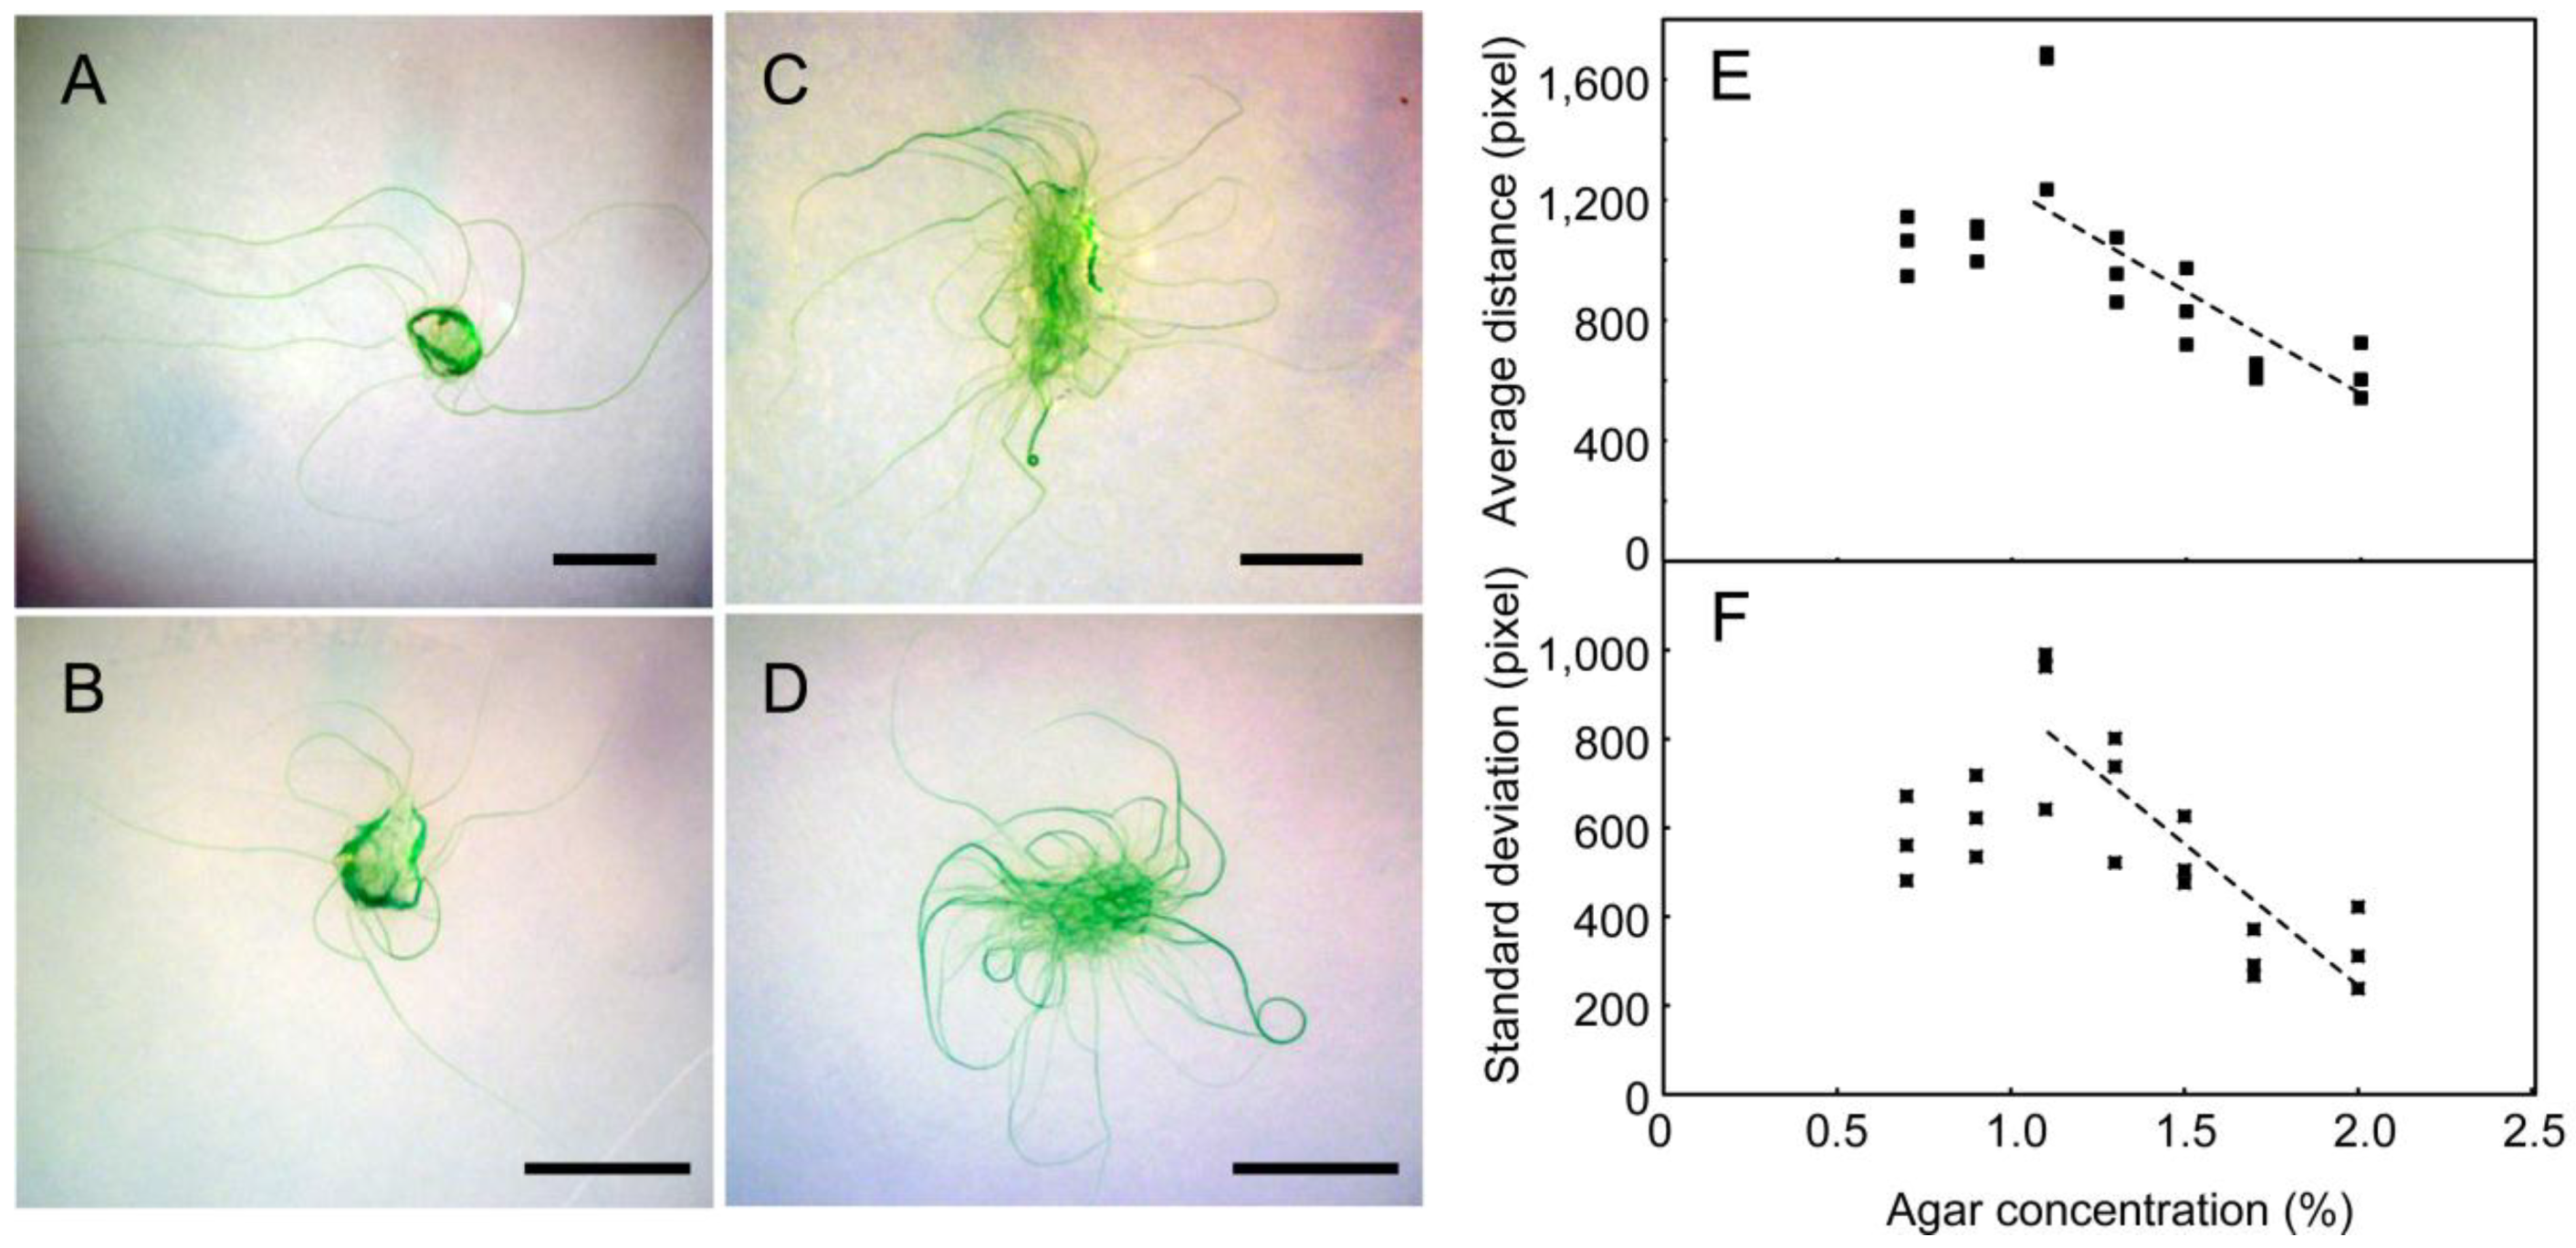
We then analyzed the effects of agar concentration on growth development (
Figure 5). Below 1.1% of agar, the filaments became submerged within the agar (
Figure 5A), and thus, the propagation of filaments was attenuated. Note that under these conditions, no spirals were formed, even after a long time. The growth was fastest on 1.1% agar. Above this concentration, the propagation decreased with increasing agar concentration (
Figure 5E). Since the growth of filaments was restricted on the surface of the plates above 1.1% agar, this decrease in development was a result of the stickiness of filaments to the agar surface, rather than a decrease in growth itself. As judged from the increase in green area (or precisely, the green channel intensity in pixels) in the images, the growth of cells was not markedly affected. Apparently, most of the filaments gradually curved counterclockwise on the plate under these free-growing conditions without crowding (
Figure 5C,D). This is likely to reflect the clockwise rotation of each filament around its axis during the movement, as explained later (see
Figure 9B). As shown in
Figure 5F, the standard deviation of filament growth also decreased with agar concentration, which corresponded to the local assembly and organization of filaments (including spiral formation) at the periphery of the growth area.
Figure 5.
The effects of agar concentration on the growth development of filaments: (A) 0.7%; (B) 1.1%; (C) 1.5%; (D) 2.0%; Bars: 1 cm. (E) Statistics of the average spread of filaments; (F) Standard deviation of the spread of filaments. This is a statistics of the distances of all pixels on the filaments from the starting point. Note that filaments grew in a radial manner at low concentrations of agar, whereas at higher concentrations, both the average distance and standard deviation were reduced. The decrease in standard deviation was an indication of spiral formation.
3.5. Analysis of Movement of Filaments
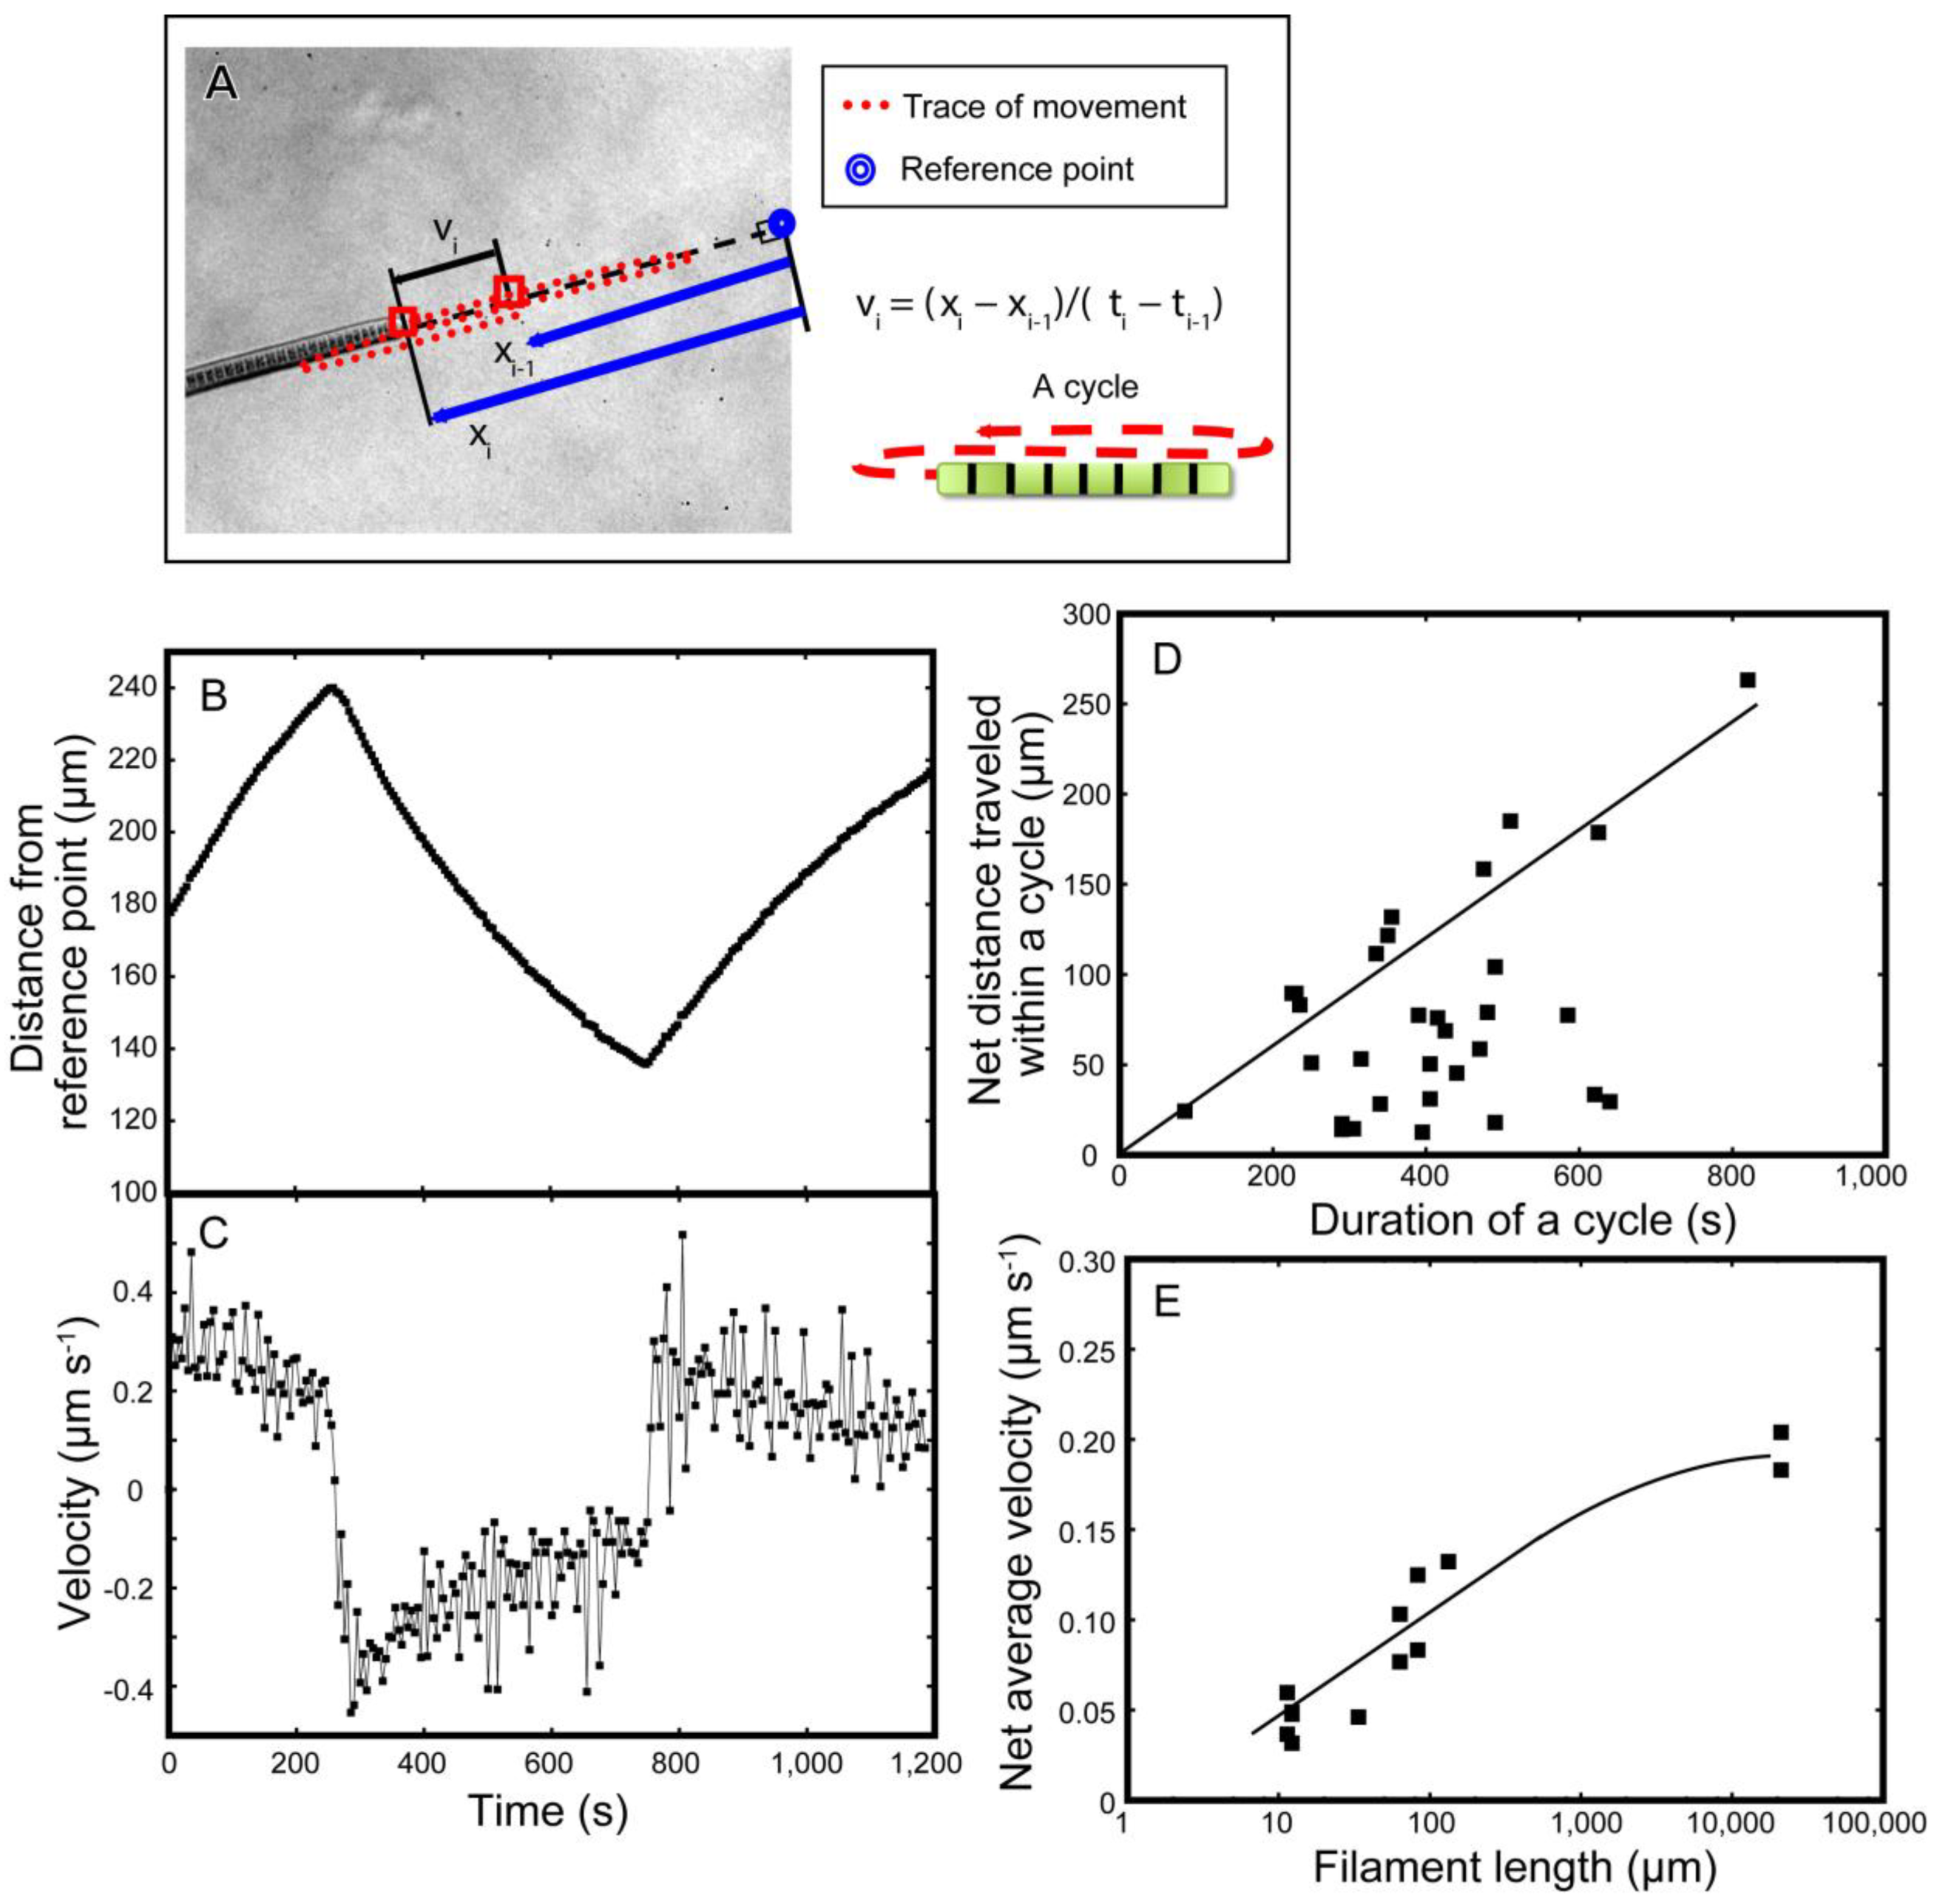
We then analyzed the movement of individual short filaments (
Figure 6). A single filament moved back and forth (
Figure 6B). Here, the position
xi of a tip of filament with respect to a reference point was traced with time
ti (
Figure 6A). The velocity
vi was calculated and plotted against time
ti (
Figure 6C). Curiously, the velocity was maximal immediately after each reversal of direction. The decline in velocity was exponential.
Such exponential decline in velocity might not be compatible with various mechanisms of movement using motor proteins, such as those with pili [
17] or flagella (not present in
Phormidium), because such mechanical motors should act at a constant rate. We found no description of an exponential or time-dependent decline in velocity in published papers on cellular movement by Type IV pili or focal adhesion. However, the mechanism involving mucilage secretion from junctional pores [
16] might be compatible with the observed time course in velocity, if we suppose that the secretion is maximal at the initial burst and then decreases with time.
As the movement reverted repeatedly, the overall average velocity of net movement was lower than the maximum velocity (
Figure 6D). Only in some exceptional cases (the straight line in
Figure 6D), net displacement with maximum velocity was achieved. In other cases (the points below the line), the average velocity was quite limited at about 0.1−0.15 µm·s
−1. Long filaments tend to achieve large net displacement (
Figure 6E), maybe because the forward and backward movements became asymmetric with filament length. However, we still do not know exactly the reason for this asymmetry.
Figure 7 shows the effects of agar concentration on the velocity of filaments over all time points during the measurements. Average velocity was 0.216 and 0.162 µm·s
−1 on 1.5% and 2.0% agar plates, respectively. This difference was significant at the 5% level. The distribution was similar to a log-normal distribution (
Figure 7C,D), rather than a normal distribution. In fact, such distributions are alternative representations of
Figure 6C, showing exponential decline in velocity. From these results, we can estimate the terminal velocity, which was 0.169 and 0.148 µm·s
−1 on 1.5% and 2.0% agar plates, respectively. The time constant of decline was 99 and 108 s
−1, respectively.
Figure 6.
Mathematical analysis of the movement of filaments on 1.5% agar plates. (A) Measurement of the displacement of a filament and calculation of the velocity; (B) Displacement of a tip of filament with respect to a fixed reference point; (C) Velocity of a tip of filament; (D) Relationship between the duration and length of the displacement of an oscillatory cycle. The line indicates the upper limit of displacement; (E) The relationship between filament length (in logarithmic scale) and average velocity. The line indicates that the net velocity increased to attain an upper limit asymptotically.
Figure 7.
The effects of agar concentration on the distribution of velocity. (A) Distribution of velocity on 1.5% agar plates (n = 8882); (B) Distribution of velocity on 2.0% agar plates (n = 1397); (C) Distribution of the logarithm of velocity on 1.5% agar plates; (D) Distribution of the logarithm of velocity on 2.0% agar plates. Here, each velocity value was taken as a positive value. Note that the distribution of velocity is similar to the log-normal distribution, and the average velocity was lower on 2.0% agar plates.
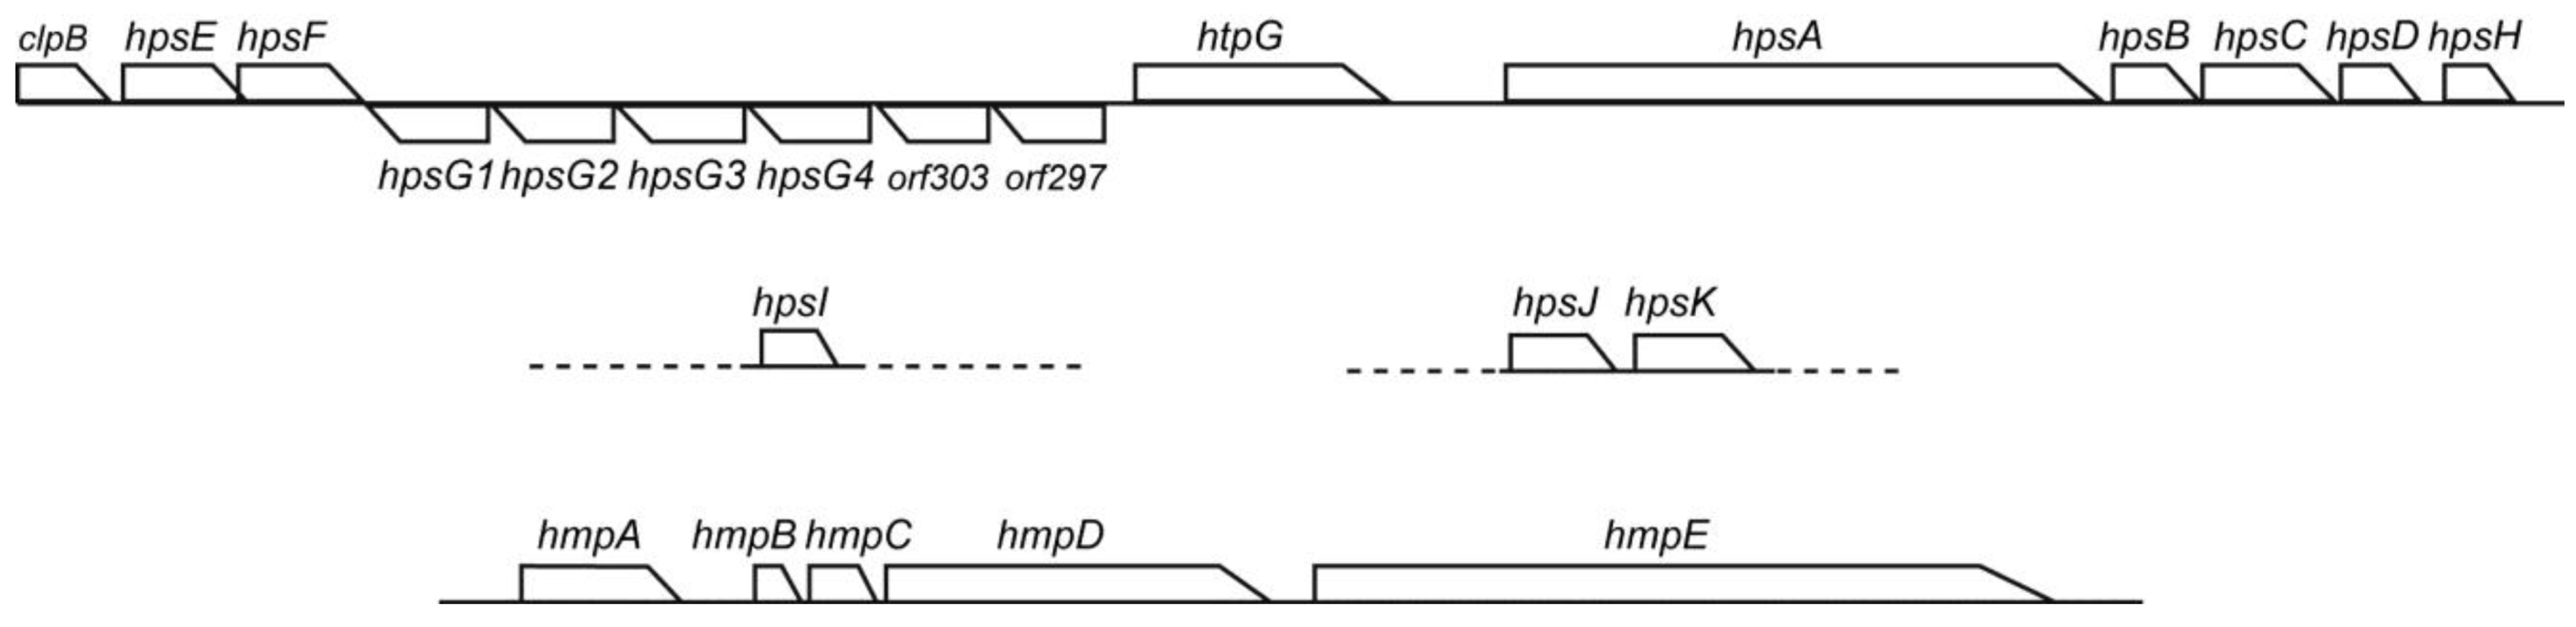
3.6. Conservation of Hps and Hmp Genes in Phormidium
A motility system with polysaccharide secretion was recently characterized in hormogonia of
Nostoc punctiforme [
18]. The
hps locus includes genes encoding pseudopilins (HpsB, C, D and H) and glycosyltransferases (HpsE, F, G, I and K), as well as functionally unknown proteins (HpsA and J). This system is conserved in filamentous cyanobacteria and is a plausible candidate for the mechanism of motility with mucilage secretion from junctional pores [
19]. We indeed detected
hps genes in
Phormidium sp. KS (
Figure 8). The E-values of
hpsA,
B,
C,
D,
E,
F,
H,
I,
J and
K for the
Nostoc ortholog were 2e−26, 2e−8, e−15, e−14, e−130, e−112, 2e−29, 3e−63, 4e−49 and e−143, respectively. There was another set of
hpsE and
F at a distant position within the genome. There were four copies of
hpsG arranged in tandem. The E-values of these four copies with respect to the
Nostoc hpsG was from 2e−94 to 3e−81. It should be noted that apparently unrelated genes,
clpB,
htpG,
orf303 and
orf297, were also present in the large
hps cluster. The
orf303 encodes a highly conserved sulfotransferase, whereas the
orf297 encodes a family 2 glycosyltransferase. In addition, the
hmp genes [
19,
20], which are involved in the regulation of
hps genes, were also conserved in the genome of
Phormidium sp. KS (
Figure 8). The E-values of
hmpA,
B,
C,
D and
E to the
Nostoc ortholog were e−130, 7e−58, 4e−69, 0.0 and 0.0, respectively.
Figure 8.
The hps and hmp gene clusters in Phormidium sp. KS. The large hps gene cluster is contiguous, whereas hpsI and hpsJ/K are located on different contigs, respectively. The hmp gene cluster is located on a further different contig.
Figure 8.
The hps and hmp gene clusters in Phormidium sp. KS. The large hps gene cluster is contiguous, whereas hpsI and hpsJ/K are located on different contigs, respectively. The hmp gene cluster is located on a further different contig.
3.7. Model of Filament Movement and Spiral Formation
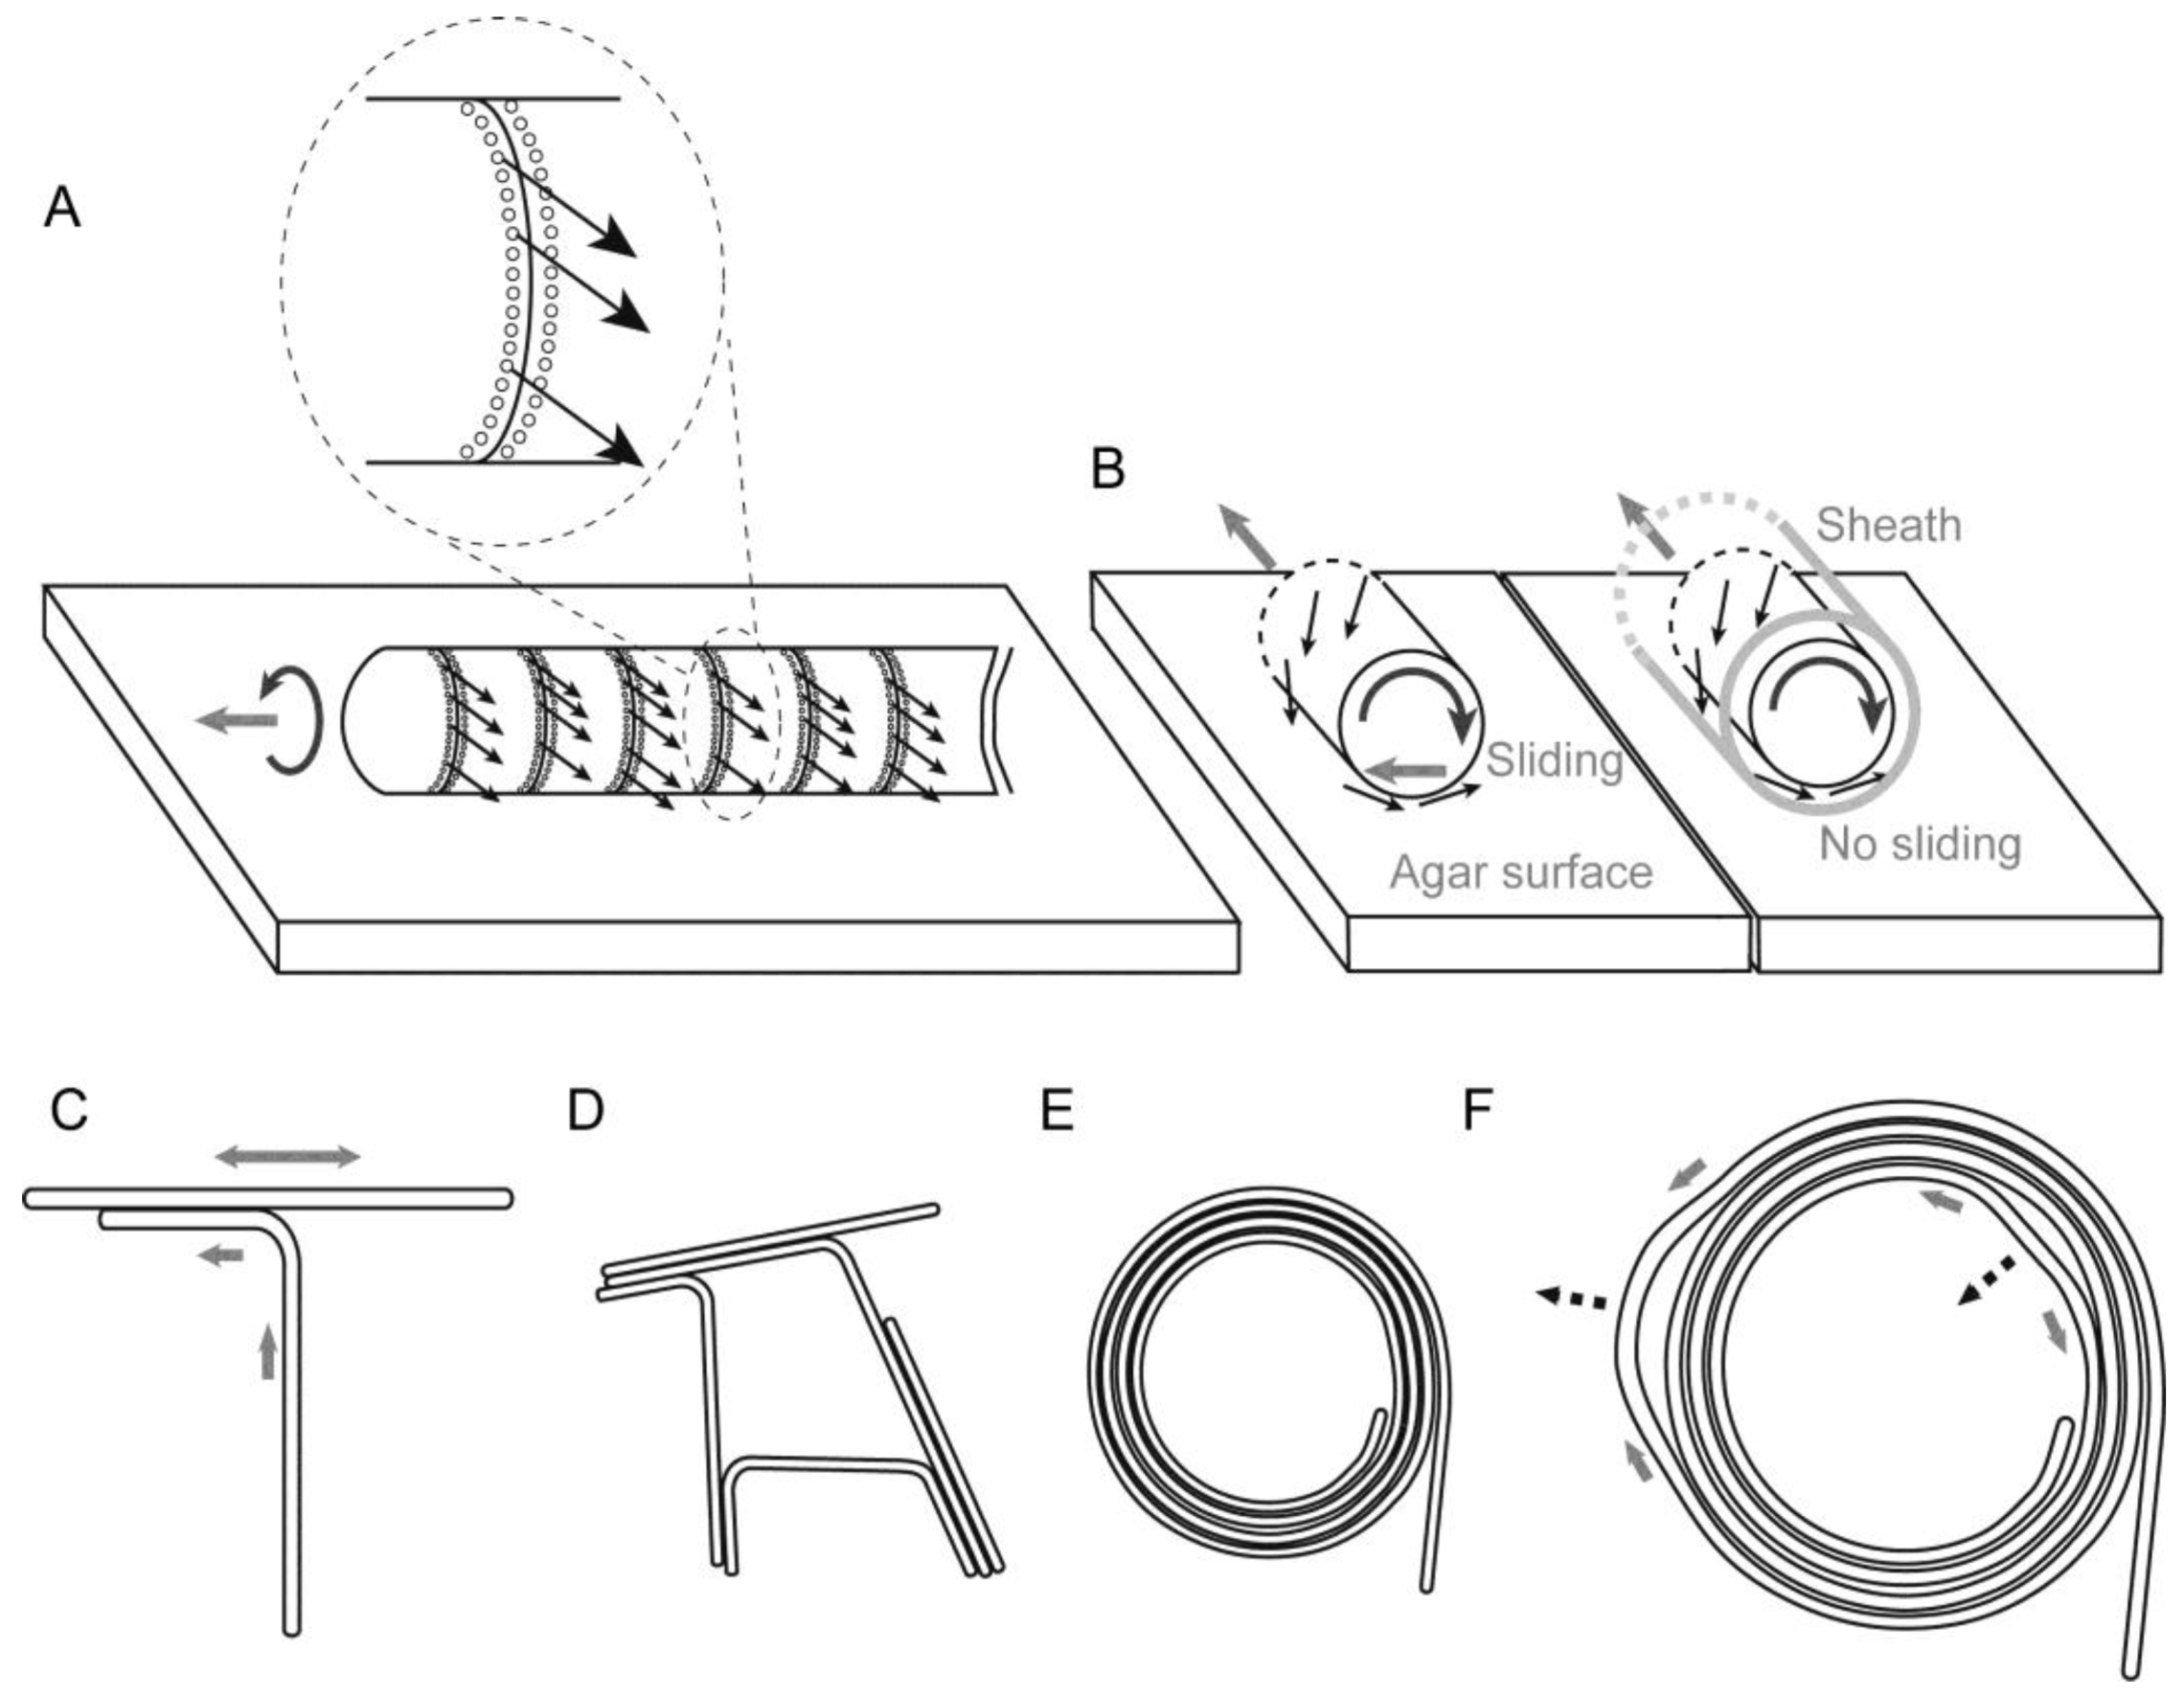
Based on these results, we describe the motion of
Phormidium filaments in the following way: a short filament moves by excreting mucilage or slime (uncharacterized polysaccharides) from the junctional pores aligned in a single row located at the lagging end of each cell. The junctional pores that seemed to be inclined with respect to the axis of the filament (
Figure 3D) generate a helical flow of mucilage surrounding the filament (
Figure 9A). It has been suggested that the helical flow of mucilage was directed by the rows of oscillin fibrils [
21], which were visualized by a cryoEM technique in
P. uncinatum. Unfortunately, our current electron microscopic procedure poorly preserves the surface structures, such as the S-layer and oscillin fibrils, which were not visible in
Figure 3. We are not sure if inclined junctional pores (this is still a hypothesis, but they look inclined in
Figure 3D) alone can produce a helical flow of mucilage sufficient for driving the rotation and movement of a filament. The flow-aligning role of fibril arrays documented 40 years ago is still an attractive hypothesis [
22]. It is not clear yet, however, if oscillin is present in
Phormidium sp. KS, because no homolog with high similarity (at most 34% identity) was found to be encoded in the genome. Oscillin was discovered in a related strain,
P. uncinatum (see the phylogenetic tree in
Figure 2), and is a very glycine-rich large protein having a calcium-binding activity. Even though an ortholog is not present in the strain KS, another protein with similar features could function to cause the helical flow of mucilage.
The velocity of filament displacement is likely to be determined by the force of secretion and the viscosity of the mucilage, the latter of which is dependent on dehydration by surrounding agar. According to the “slime gun model” originally proposed in
Myxobacteria ([
17] adapted from [
23]), hydration of the polysaccharide in the nozzle chamber of the junctional pore complex causes the filling of the nozzle chamber, which eventually generates a counter-force of the nozzle walls that results in the ejection of the slime. This is consistent with our current findings in
Phormidium: first, the velocity of movement was maximal just after the reversal and then declined exponentially. This is hardly expected to occur if other kinds of mechanical devices (Type IV pili or focal adhesions [
17]) drive the movement; second, a higher concentration of agar substratum decreased the velocity. This decrease could be explained by a lower rate of hydration of polysaccharide within the nozzle. This model also explains periodic changes in movement: once the content is ejected, a certain time is needed to refill the nozzle with hydrated slime. The
hps gene clusters in
Phormidium sp. KS encode eight glycosyltransferases and four pseudopilins [
18] (see
Figure 8), which are, respectively, involved in the synthesis and secretion of polysaccharides. The pseudopilins are known as components of the secretion/motility machineries [
24]. The secretion of slime might be regulated by a mechanism similar to the formation of Type IV pili, by the secretion of a finite amount of pilin proteins. Nevertheless, the mechanism of how a single row of junctional pores is selected and (probably) synchronized remains unknown. The reversal of the direction of movement is likely to be caused by switching the active row of junctional pores, as suggested in [
16], and a recent model suggested that this might be mediated by the
hmp chemotaxis-related genes (
Figure 8) [
18,
19,
20]. Another possibility could be a change in membrane potential, but we still need studies on this point.
It is also to be noted that the movement is not uniform along the entire filament, because larger net displacement was found in longer filaments (
Figure 6E). This is clearly seen in
Supplementary Movie S2. In this respect, the synchronization of movement is a local phenomenon within a single filament.
The spiral formation of
Phormidium filaments on the agar surface (more than 1.1%) can be explained in the following way: during the course of growth, each filament curved counterclockwise (
Figure 5), presumably due to its inherent rotatory motion around its long axis accompanying the forward movement (
Figure 9A,B). This should be considered carefully, because a forward movement and a backward movement might not be on the same track, if the trail should be curved. This is obviously not the case (
Supplementary Movie S1). Once formed, a sheath guides the movement of a filament. That is why repeated movements within a sheath do not normally change the trail. If we consider a forward movement on a virgin substratum, then the helical excretion of mucilage is expected to invoke a reaction that laterally slides the filament to the left (
Figure 9B, left). In the next backward movement, the filament would follow the trail without lateral sliding (
Figure 9B, right). As cells divide, the filament becomes longer. A longer filament will intrude into a new area of agar substratum. In this way, the intrusion of a growing filament into a virgin agar surface would curve the filament counterclockwise (
Figure 5). In addition, even a short, single filament is slightly twisted and showed precession movement, as seen in
Supplementary Movie S1. This would add an orienting role to the movement of a filament.
The tendency of counterclockwise curvature should be enhanced by an encounter with another filament running across ahead of an advancing filament (
Figure 9C). Such an encounter will lead to either a meshwork of filaments (
Figure 9D) or a spiral (
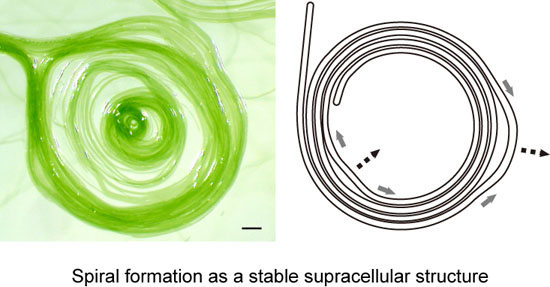
Figure 9E), although we still do not know exactly the process of spiral formation. However, we can easily understand the robustness of a spiral shape (
Figure 9F). The movement of a filament or filaments forming a spiral is not uniform. Detailed observation (
Supplementary Movie S2) showed that some part moves clockwise, while another part goes counterclockwise, and such non-synchronous movements changed with time. By this non-uniform motion, one part is relaxed, while another part is tightened (
Figure 9F). Nevertheless, the overall shape of a spiral is tolerant to this non-uniform motion by changing the local radius of curvature. Such robustness of form explains that a spiral persists once it is formed.
Figure 9.
Helical flow-driven rotation model explaining the formation and stability of the spiral structure. Each thin arrow indicates a hypothetical flow of mucilage. Mucilage might be secreted from all of the junctional pores (shown by tiny circles aligned in a row adjacent to a septum) in the lagging pole of each cell, but only a few arrows are drawn for clarity. A grey thick arrow indicates the direction of filament displacement. This figure depicts only a phase of left-hand movement during the continuous back and forth movement. (A) Movement of a filament by excretion of mucilage. The inset is an enlargement of a septum; (B) Rotation of a filament by helical flow of mucilage. (Left) Movement on an agar substratum without a previously formed sheath, (right) movement within a sheath. Lateral sliding is provoked in the left case; (C) The encounter of two filaments directs a left-hand turn; (D) A meshwork structure formed by many filaments stuck together; (E) A spiral formed by a filament. The counterclockwise curvature of filament on solid agar eventually engenders a spiral; (F) Robustness of a spiral structure against local non-uniform movement. The movement of a filament is not identical throughout a single filament. A spiral structure can accommodate such non-uniform local movements shown by grey thick arrows and deforms, as shown by the broken line arrows.
![Life 04 00819 g009]()

