Figure 1.
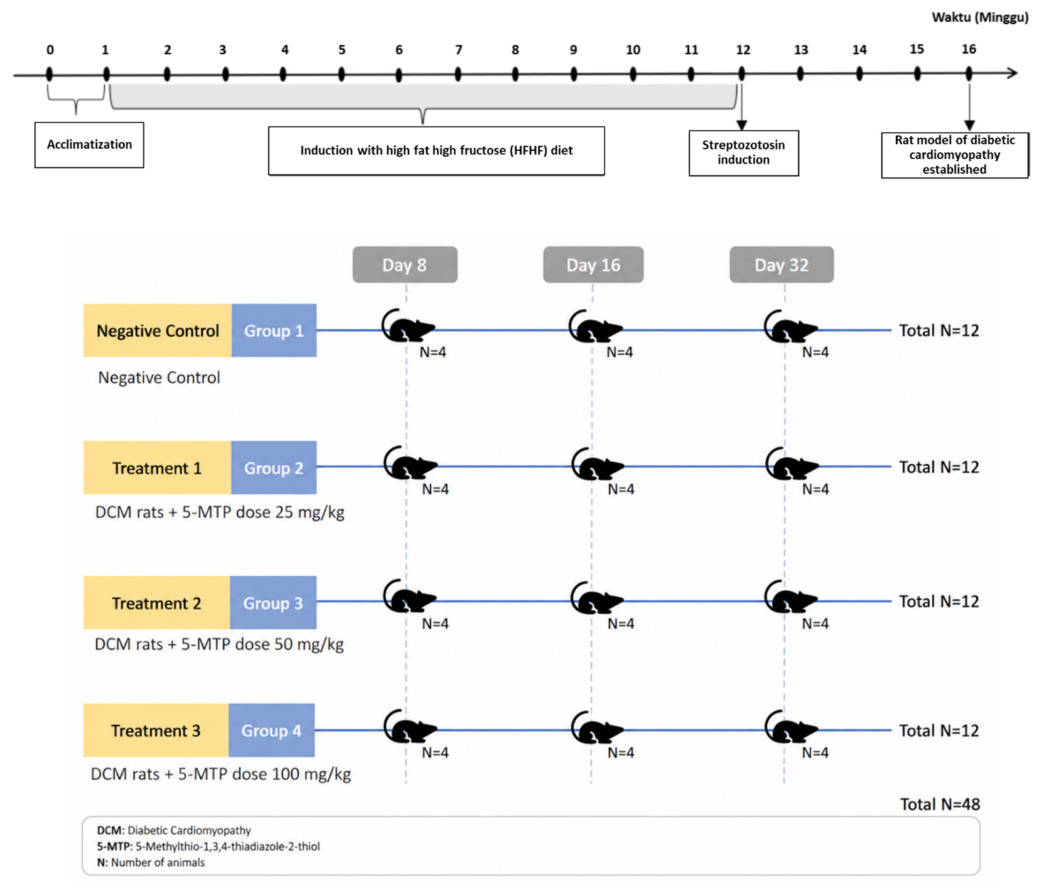
Study design of effects of different dose 5-MTP on rat model of diabetic cardiomyopathy on different treatment duration.
Figure 1.
Study design of effects of different dose 5-MTP on rat model of diabetic cardiomyopathy on different treatment duration.
Figure 2.
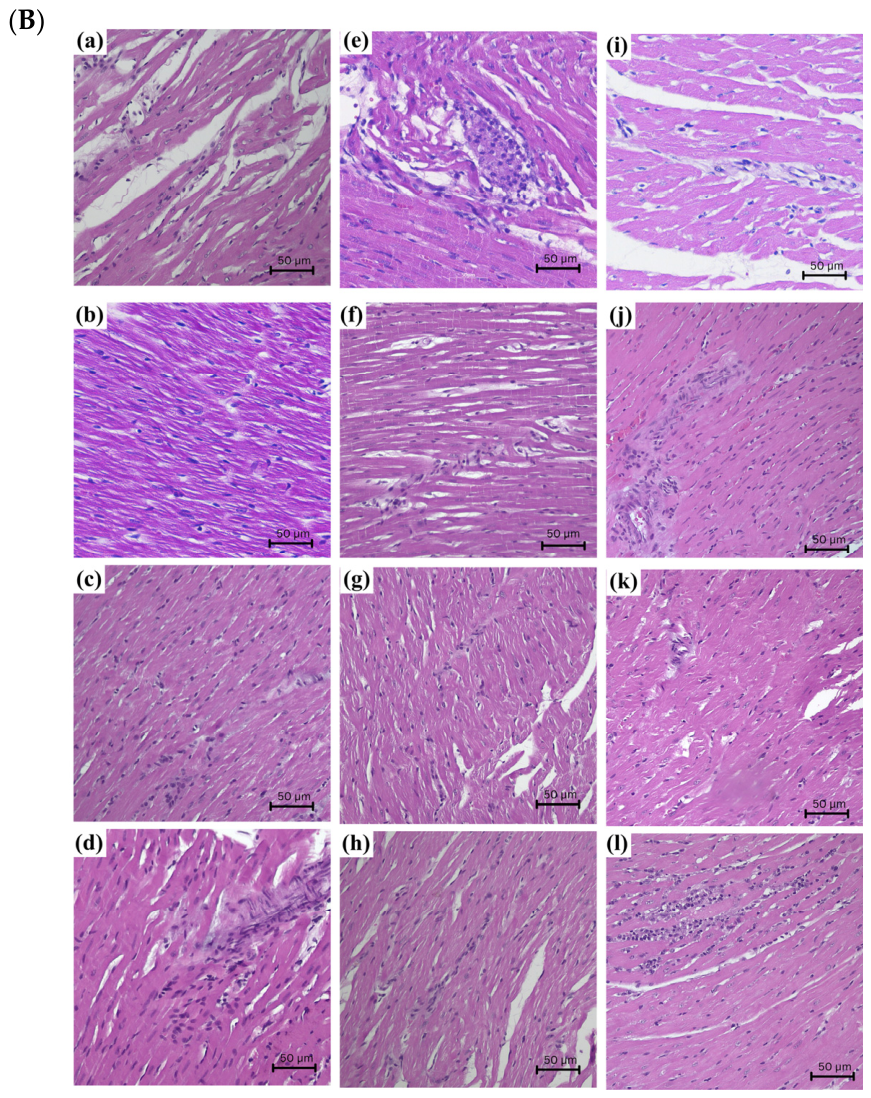
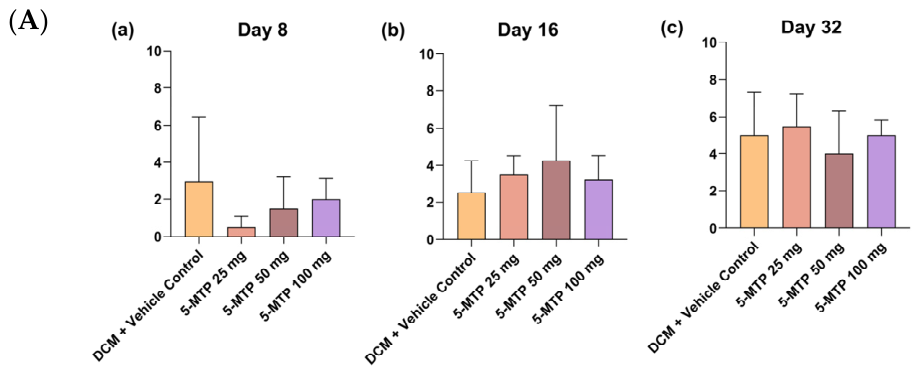
Representative hematoxylin–eosin staining and myocardial inflammatory score across treatment groups at different treatment durations. (A) Quantitative comparison of myocardial inflammatory scores among treatment groups at day 8 (a), day 16 (b), and day 32 (c). Data are presented as median (minimum–maximum) or mean ± standard deviation, as appropriate. (B) Representative HE-stained myocardial sections (400× magnification; scale bar = 50 μm) from each treatment group across time points: day 8 DCM + vehicle control (a), 5-MTP 25 mg/kg (b), 5-MTP 50 mg/kg (c), and 5-MTP 100 mg/kg (d); day 16 DCM + vehicle control (e), 5-MTP 25 mg/kg (f), 5-MTP 50 mg/kg (g), and 5-MTP 100 mg/kg (h); day 32 DCM + vehicle control (i), 5-MTP 25 mg/kg (j), 5-MTP 50 mg/kg (k), and 5-MTP 100 mg/kg (l). Histopathological evaluation demonstrated myocardial inflammatory cell infiltration of varying degrees without statistically significant differences among treatment groups at any time point.
Figure 2.
Representative hematoxylin–eosin staining and myocardial inflammatory score across treatment groups at different treatment durations. (A) Quantitative comparison of myocardial inflammatory scores among treatment groups at day 8 (a), day 16 (b), and day 32 (c). Data are presented as median (minimum–maximum) or mean ± standard deviation, as appropriate. (B) Representative HE-stained myocardial sections (400× magnification; scale bar = 50 μm) from each treatment group across time points: day 8 DCM + vehicle control (a), 5-MTP 25 mg/kg (b), 5-MTP 50 mg/kg (c), and 5-MTP 100 mg/kg (d); day 16 DCM + vehicle control (e), 5-MTP 25 mg/kg (f), 5-MTP 50 mg/kg (g), and 5-MTP 100 mg/kg (h); day 32 DCM + vehicle control (i), 5-MTP 25 mg/kg (j), 5-MTP 50 mg/kg (k), and 5-MTP 100 mg/kg (l). Histopathological evaluation demonstrated myocardial inflammatory cell infiltration of varying degrees without statistically significant differences among treatment groups at any time point.
Figure 3.
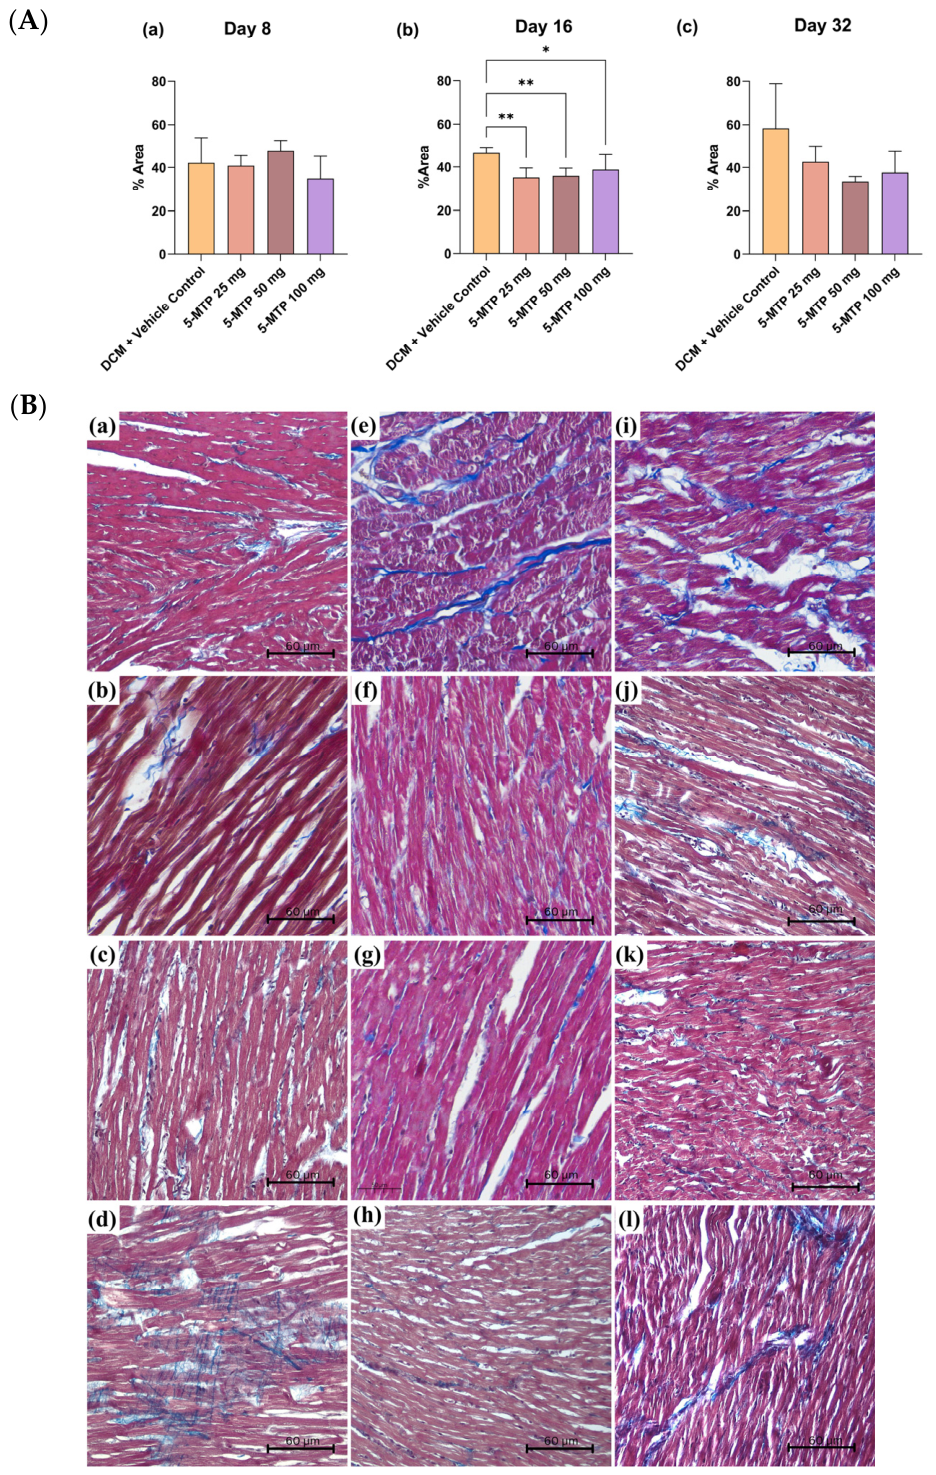
Representative Masson’s trichrome (MT) staining and quantitative myocardial fibrosis area across treatment groups at different treatment durations. (A) Quantitative comparison of myocardial fibrosis (% area) among treatment groups at day 8 (a), day 16 (b), and day 32 (c). At day 16, myocardial fibrosis differed significantly among groups, with all 5-MTP treatment groups demonstrating significantly lower fibrosis area compared with the DCM + vehicle control group (25 mg/kg, p = 0.005; 50 mg/kg, p = 0.008; 100 mg/kg, p = 0.037). No significant differences were observed at day 8 or day 32. * p < 0.05 and ** p < 0.01 vs DCM + vehicle control. (B) Representative MT-stained myocardial sections (400× magnification; scale bar = 60 μm) from each treatment group across time points: day 8 DCM + vehicle control (a), 5-MTP 25 mg/kg (b), 5-MTP 50 mg/kg (c), and 5-MTP 100 mg/kg (d); day 16 DCM + vehicle control (e), 5-MTP 25 mg/kg (f), 5-MTP 50 mg/kg (g), and 5-MTP 100 mg/kg (h); day 32 DCM + vehicle control (i), 5-MTP 25 mg/kg (j), 5-MTP 50 mg/kg (k), and 5-MTP 100 mg/kg (l). Blue staining represents collagen deposition and myocardial fibrosis. Histopathological evaluation demonstrated reduced collagen deposition following 5-MTP treatment at the intermediate time point, consistent with its transient antifibrotic effect during active myocardial remodeling.
Figure 3.
Representative Masson’s trichrome (MT) staining and quantitative myocardial fibrosis area across treatment groups at different treatment durations. (A) Quantitative comparison of myocardial fibrosis (% area) among treatment groups at day 8 (a), day 16 (b), and day 32 (c). At day 16, myocardial fibrosis differed significantly among groups, with all 5-MTP treatment groups demonstrating significantly lower fibrosis area compared with the DCM + vehicle control group (25 mg/kg, p = 0.005; 50 mg/kg, p = 0.008; 100 mg/kg, p = 0.037). No significant differences were observed at day 8 or day 32. * p < 0.05 and ** p < 0.01 vs DCM + vehicle control. (B) Representative MT-stained myocardial sections (400× magnification; scale bar = 60 μm) from each treatment group across time points: day 8 DCM + vehicle control (a), 5-MTP 25 mg/kg (b), 5-MTP 50 mg/kg (c), and 5-MTP 100 mg/kg (d); day 16 DCM + vehicle control (e), 5-MTP 25 mg/kg (f), 5-MTP 50 mg/kg (g), and 5-MTP 100 mg/kg (h); day 32 DCM + vehicle control (i), 5-MTP 25 mg/kg (j), 5-MTP 50 mg/kg (k), and 5-MTP 100 mg/kg (l). Blue staining represents collagen deposition and myocardial fibrosis. Histopathological evaluation demonstrated reduced collagen deposition following 5-MTP treatment at the intermediate time point, consistent with its transient antifibrotic effect during active myocardial remodeling.

Figure 4.
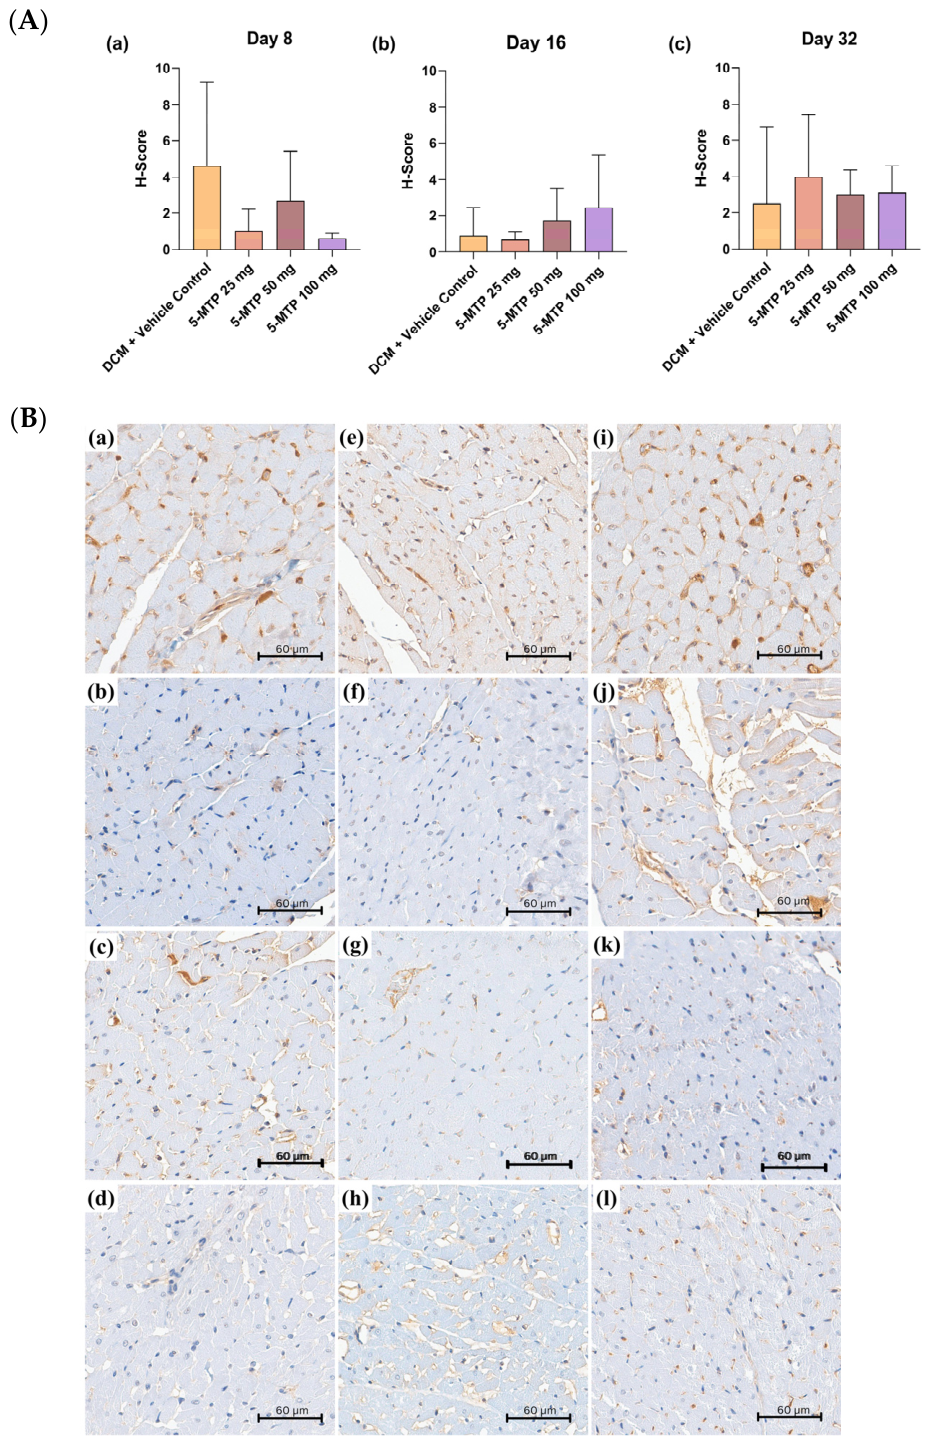
Collagen I immunohistochemical expression across treatment groups at different treatment durations. (A) Quantitative comparison of collagen I H-score among treatment groups at day 8 (a), day 16 (b), and day 32 (c). No significant differences in collagen I expression were observed among groups at any time point. (B) Representative collagen I immunohistochemical-stained myocardial sections (400× magnification; scale bar = 60 μm) from each treatment group across time points: day 8 DCM + vehicle control (a), 5-MTP 25 mg/kg (b), 5-MTP 50 mg/kg (c), and 5-MTP 100 mg/kg (d); day 16 DCM + vehicle control (e), 5-MTP 25 mg/kg (f), 5-MTP 50 mg/kg (g), and 5-MTP 100 mg/kg (h); day 32 DCM + vehicle control (i), 5-MTP 25 mg/kg (j), 5-MTP 50 mg/kg (k), and 5-MTP 100 mg/kg (l). Brown staining indicates collagen I expression within myocardial tissue. Although early molecular modulation of fibrotic pathways was observed in other markers, collagen I expression did not demonstrate significant between-group differences, suggesting that downstream extracellular matrix deposition may require longer remodeling duration to manifest measurable changes.
Figure 4.
Collagen I immunohistochemical expression across treatment groups at different treatment durations. (A) Quantitative comparison of collagen I H-score among treatment groups at day 8 (a), day 16 (b), and day 32 (c). No significant differences in collagen I expression were observed among groups at any time point. (B) Representative collagen I immunohistochemical-stained myocardial sections (400× magnification; scale bar = 60 μm) from each treatment group across time points: day 8 DCM + vehicle control (a), 5-MTP 25 mg/kg (b), 5-MTP 50 mg/kg (c), and 5-MTP 100 mg/kg (d); day 16 DCM + vehicle control (e), 5-MTP 25 mg/kg (f), 5-MTP 50 mg/kg (g), and 5-MTP 100 mg/kg (h); day 32 DCM + vehicle control (i), 5-MTP 25 mg/kg (j), 5-MTP 50 mg/kg (k), and 5-MTP 100 mg/kg (l). Brown staining indicates collagen I expression within myocardial tissue. Although early molecular modulation of fibrotic pathways was observed in other markers, collagen I expression did not demonstrate significant between-group differences, suggesting that downstream extracellular matrix deposition may require longer remodeling duration to manifest measurable changes.

Figure 5.
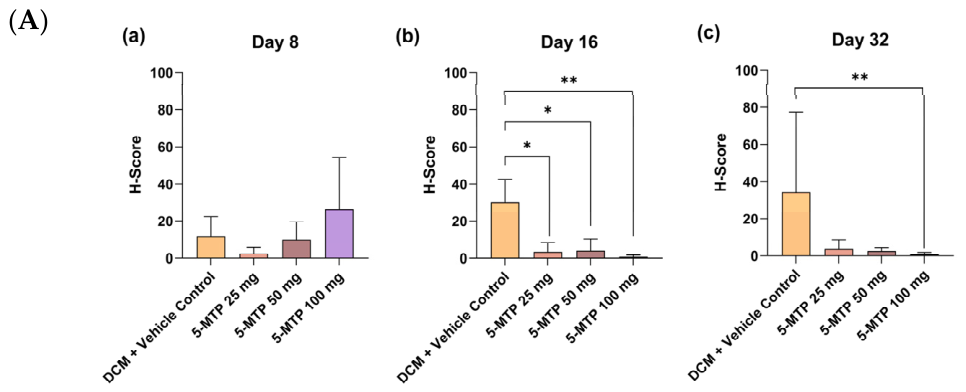
Caspase-3 immunohistochemical expression across treatment groups at different treatment durations. (A) Quantitative comparison of caspase-3 H-score among treatment groups at day 8 (a), day 16 (b), and day 32 (c). No significant differences were observed at day 8. At day 16, caspase-3 expression differed significantly among groups, with all 5-MTP treatment groups demonstrating significantly lower H-scores compared with the DCM + vehicle control group (25 mg/kg, p = 0.026; 50 mg/kg, p = 0.034; 100 mg/kg, p = 0.005). At day 32, a significant difference was also observed, with only the 100 mg/kg group showing significant reduction compared with the DCM + vehicle control group (p = 0.004). * p < 0.05 and ** p < 0.01 vs DCM + vehicle control. (B) Representative caspase-3 immunohistochemical-stained myocardial sections (400× magnification; scale bar = 60 μm) from each treatment group across time points: day 8 DCM + vehicle control (a), 5-MTP 25 mg/kg (b), 5-MTP 50 mg/kg (c), and 5-MTP 100 mg/kg (d); day 16 DCM + vehicle control (e), 5-MTP 25 mg/kg (f), 5-MTP 50 mg/kg (g), and 5-MTP 100 mg/kg (h); day 32 DCM + vehicle control (i), 5-MTP 25 mg/kg (j), 5-MTP 50 mg/kg (k), and 5-MTP 100 mg/kg (l). Brown staining indicates caspase-3 expression. These findings suggest time-dependent differences in caspase-3 expression following 5-MTP treatment.
Figure 5.
Caspase-3 immunohistochemical expression across treatment groups at different treatment durations. (A) Quantitative comparison of caspase-3 H-score among treatment groups at day 8 (a), day 16 (b), and day 32 (c). No significant differences were observed at day 8. At day 16, caspase-3 expression differed significantly among groups, with all 5-MTP treatment groups demonstrating significantly lower H-scores compared with the DCM + vehicle control group (25 mg/kg, p = 0.026; 50 mg/kg, p = 0.034; 100 mg/kg, p = 0.005). At day 32, a significant difference was also observed, with only the 100 mg/kg group showing significant reduction compared with the DCM + vehicle control group (p = 0.004). * p < 0.05 and ** p < 0.01 vs DCM + vehicle control. (B) Representative caspase-3 immunohistochemical-stained myocardial sections (400× magnification; scale bar = 60 μm) from each treatment group across time points: day 8 DCM + vehicle control (a), 5-MTP 25 mg/kg (b), 5-MTP 50 mg/kg (c), and 5-MTP 100 mg/kg (d); day 16 DCM + vehicle control (e), 5-MTP 25 mg/kg (f), 5-MTP 50 mg/kg (g), and 5-MTP 100 mg/kg (h); day 32 DCM + vehicle control (i), 5-MTP 25 mg/kg (j), 5-MTP 50 mg/kg (k), and 5-MTP 100 mg/kg (l). Brown staining indicates caspase-3 expression. These findings suggest time-dependent differences in caspase-3 expression following 5-MTP treatment.


Figure 6.
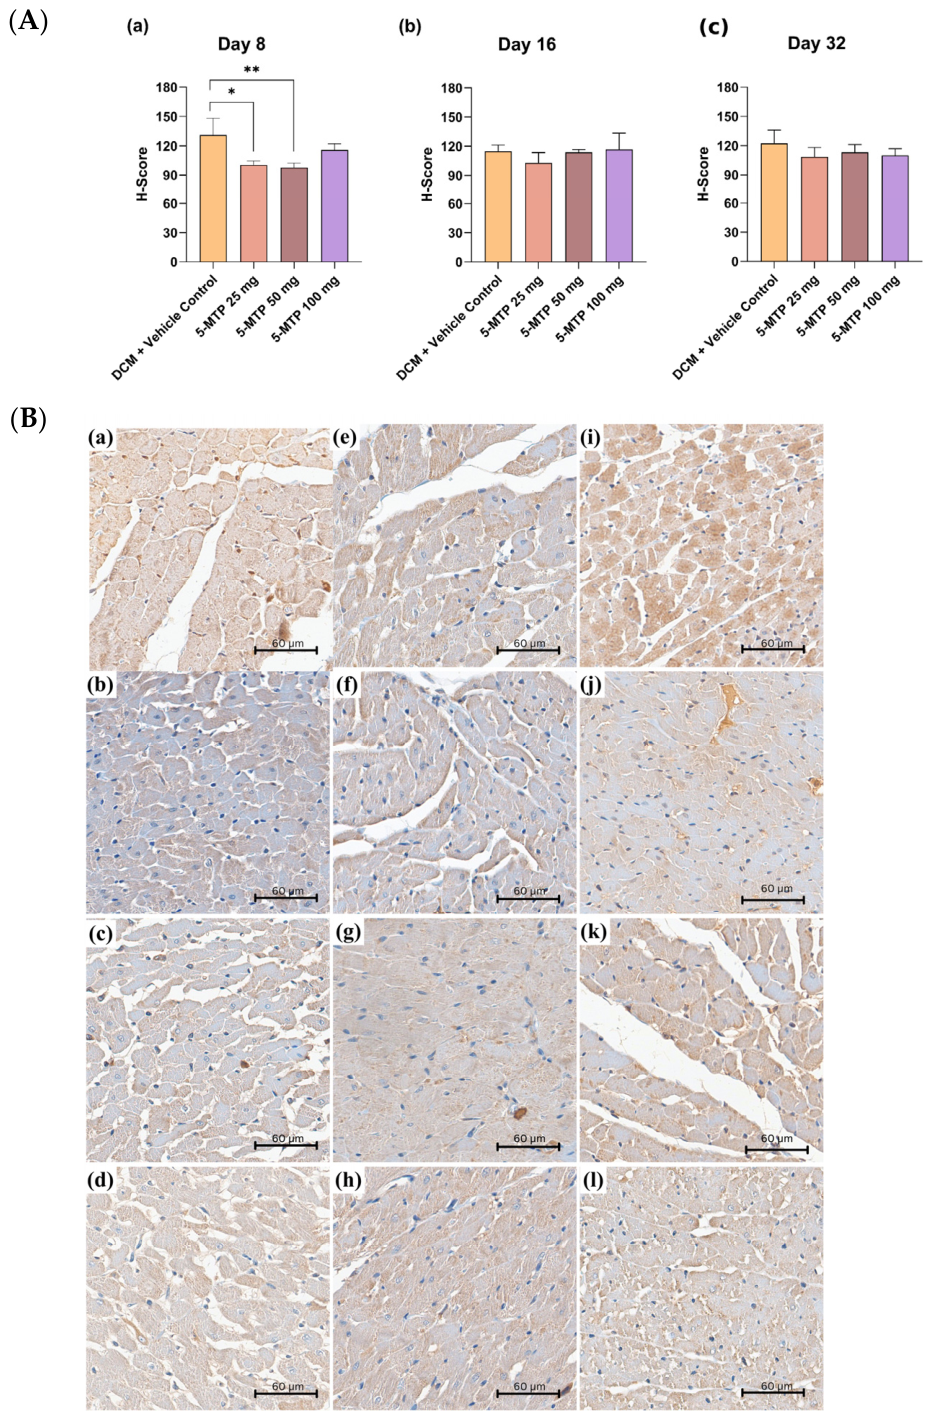
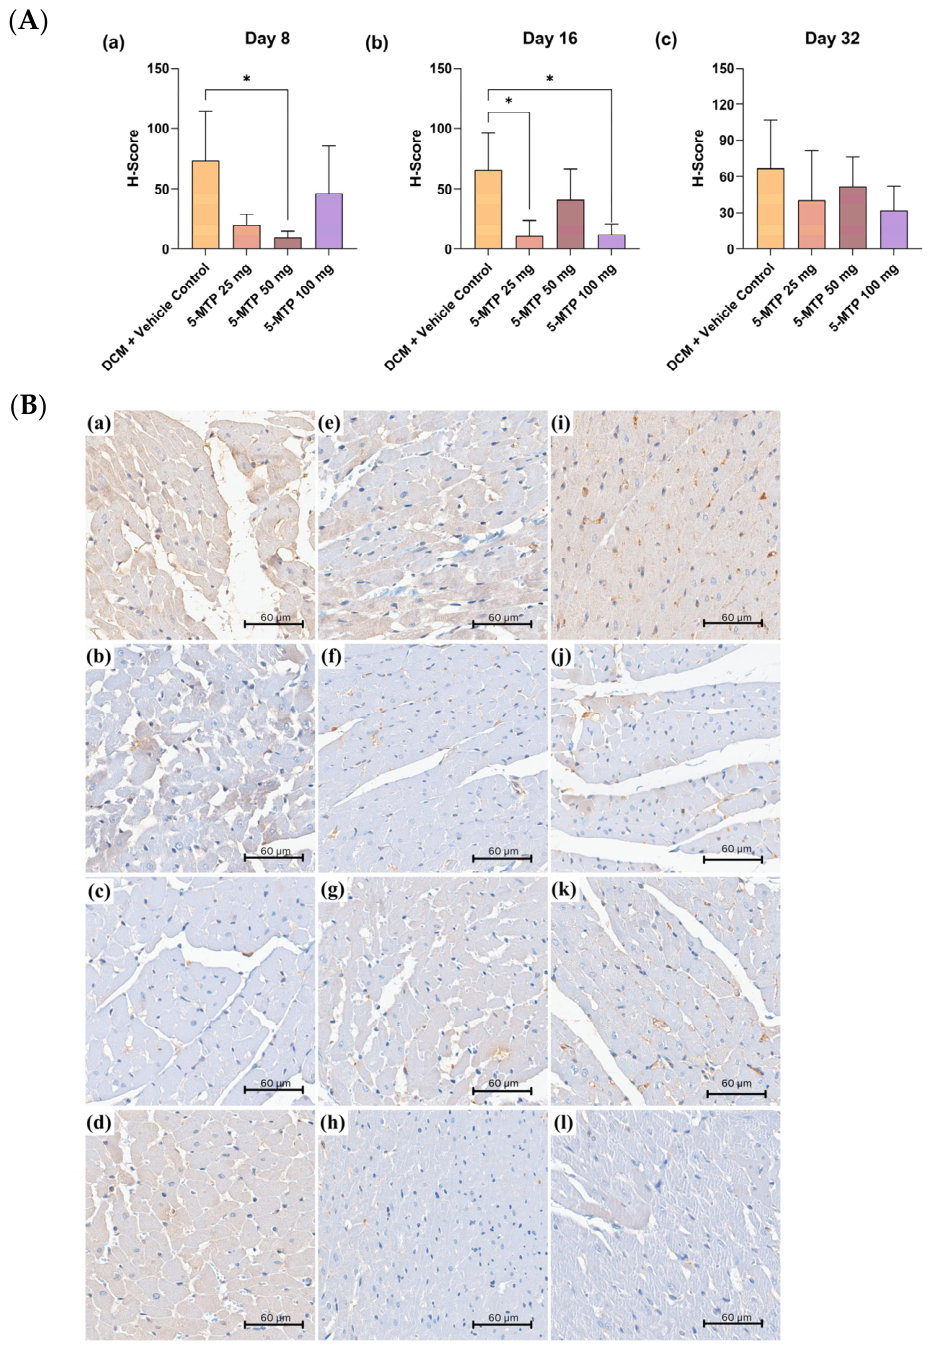
TGF-β immunohistochemical expression across treatment groups at different treatment durations. (A) Quantitative comparison of TGF-β H-score among treatment groups at day 8 (a), day 16 (b), and day 32 (c). At day 8, TGF-β expression differed significantly among groups, with the 5-MTP 25 mg/kg (p = 0.017) and 50 mg/kg (p = 0.002) groups demonstrating significantly lower H-scores compared with the DCM + vehicle control group, while the 100 mg/kg group did not differ significantly. No significant differences were observed at day 16 or day 32. * p < 0.05 and ** p < 0.01 vs DCM + vehicle control. (B) Representative TGF-β immunohistochemical-stained myocardial sections (400× magnification; scale bar = 60 μm) from each treatment group across time points: day 8 DCM + vehicle control (a), 5-MTP 25 mg/kg (b), 5-MTP 50 mg/kg (c), and 5-MTP 100 mg/kg (d); day 16 DCM + vehicle control (e), 5-MTP 25 mg/kg (f), 5-MTP 50 mg/kg (g), and 5-MTP 100 mg/kg (h); day 32 DCM + vehicle control (i), 5-MTP 25 mg/kg (j), 5-MTP 50 mg/kg (k), and 5-MTP 100 mg/kg (l). Brown staining indicates TGF-β expression. These findings suggest 5-MTP was associated with early differences in TGF-β expression, particularly during the initial remodeling phase, before broader downstream fibrotic changes became apparent.
Figure 6.
TGF-β immunohistochemical expression across treatment groups at different treatment durations. (A) Quantitative comparison of TGF-β H-score among treatment groups at day 8 (a), day 16 (b), and day 32 (c). At day 8, TGF-β expression differed significantly among groups, with the 5-MTP 25 mg/kg (p = 0.017) and 50 mg/kg (p = 0.002) groups demonstrating significantly lower H-scores compared with the DCM + vehicle control group, while the 100 mg/kg group did not differ significantly. No significant differences were observed at day 16 or day 32. * p < 0.05 and ** p < 0.01 vs DCM + vehicle control. (B) Representative TGF-β immunohistochemical-stained myocardial sections (400× magnification; scale bar = 60 μm) from each treatment group across time points: day 8 DCM + vehicle control (a), 5-MTP 25 mg/kg (b), 5-MTP 50 mg/kg (c), and 5-MTP 100 mg/kg (d); day 16 DCM + vehicle control (e), 5-MTP 25 mg/kg (f), 5-MTP 50 mg/kg (g), and 5-MTP 100 mg/kg (h); day 32 DCM + vehicle control (i), 5-MTP 25 mg/kg (j), 5-MTP 50 mg/kg (k), and 5-MTP 100 mg/kg (l). Brown staining indicates TGF-β expression. These findings suggest 5-MTP was associated with early differences in TGF-β expression, particularly during the initial remodeling phase, before broader downstream fibrotic changes became apparent.

Figure 7.
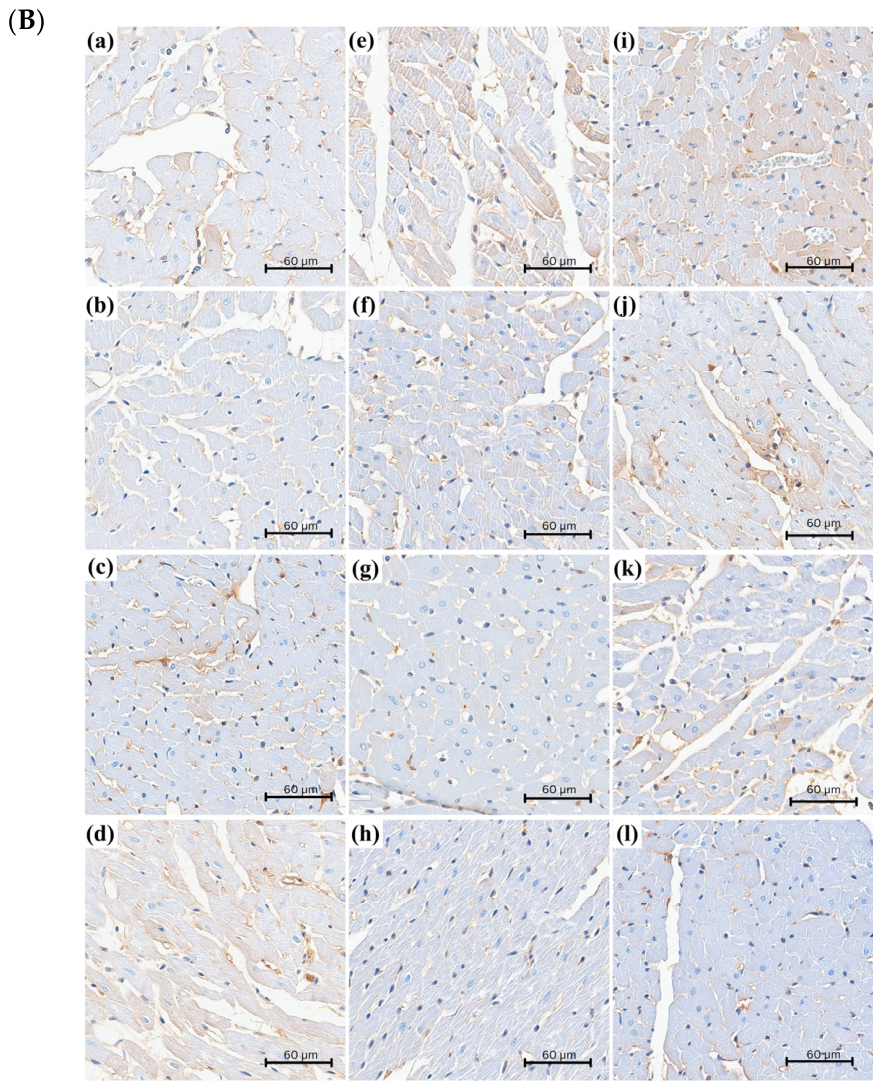
SMAD3 immunohistochemical expression across treatment groups at different treatment durations. (A) Quantitative comparison of SMAD3 H-score among treatment groups at day 8 (a), day 16 (b), and day 32 (c). At day 8, SMAD3 expression did show a significant difference in pairwise 5-MTP 50 mg/kg compared to control. At day 16, SMAD3 expression differed significantly among groups, with the 5-MTP 25 mg/kg (p = 0.017) and 100 mg/kg (p = 0.017) groups demonstrating significantly lower H-scores compared with the DCM + vehicle control group, whereas the 50 mg/kg group did not show a significant difference. No significant differences were observed at day 32. * p < 0.05 vs DCM + vehicle control. (B) Representative SMAD3 immunohistochemical-stained myocardial sections (400× magnification; scale bar = 60 μm) from each treatment group across time points: day 8 DCM + vehicle control (a), 5-MTP 25 mg/kg (b), 5-MTP 50 mg/kg (c), and 5-MTP 100 mg/kg (d); day 16 DCM + vehicle control (e), 5-MTP 25 mg/kg (f), 5-MTP 50 mg/kg (g), and 5-MTP 100 mg/kg (h); day 32 DCM + vehicle control (i), 5-MTP 25 mg/kg (j), 5-MTP 50 mg/kg (k), and 5-MTP 100 mg/kg (l). Brown staining indicates SMAD3 expression. These findings suggest 5-MTP was associated with intermediate-phase differences in SMAD3 expression, consistent with temporal suppression of active myocardial fibrogenesis during the remodeling process.
Figure 7.
SMAD3 immunohistochemical expression across treatment groups at different treatment durations. (A) Quantitative comparison of SMAD3 H-score among treatment groups at day 8 (a), day 16 (b), and day 32 (c). At day 8, SMAD3 expression did show a significant difference in pairwise 5-MTP 50 mg/kg compared to control. At day 16, SMAD3 expression differed significantly among groups, with the 5-MTP 25 mg/kg (p = 0.017) and 100 mg/kg (p = 0.017) groups demonstrating significantly lower H-scores compared with the DCM + vehicle control group, whereas the 50 mg/kg group did not show a significant difference. No significant differences were observed at day 32. * p < 0.05 vs DCM + vehicle control. (B) Representative SMAD3 immunohistochemical-stained myocardial sections (400× magnification; scale bar = 60 μm) from each treatment group across time points: day 8 DCM + vehicle control (a), 5-MTP 25 mg/kg (b), 5-MTP 50 mg/kg (c), and 5-MTP 100 mg/kg (d); day 16 DCM + vehicle control (e), 5-MTP 25 mg/kg (f), 5-MTP 50 mg/kg (g), and 5-MTP 100 mg/kg (h); day 32 DCM + vehicle control (i), 5-MTP 25 mg/kg (j), 5-MTP 50 mg/kg (k), and 5-MTP 100 mg/kg (l). Brown staining indicates SMAD3 expression. These findings suggest 5-MTP was associated with intermediate-phase differences in SMAD3 expression, consistent with temporal suppression of active myocardial fibrogenesis during the remodeling process.

Figure 8.
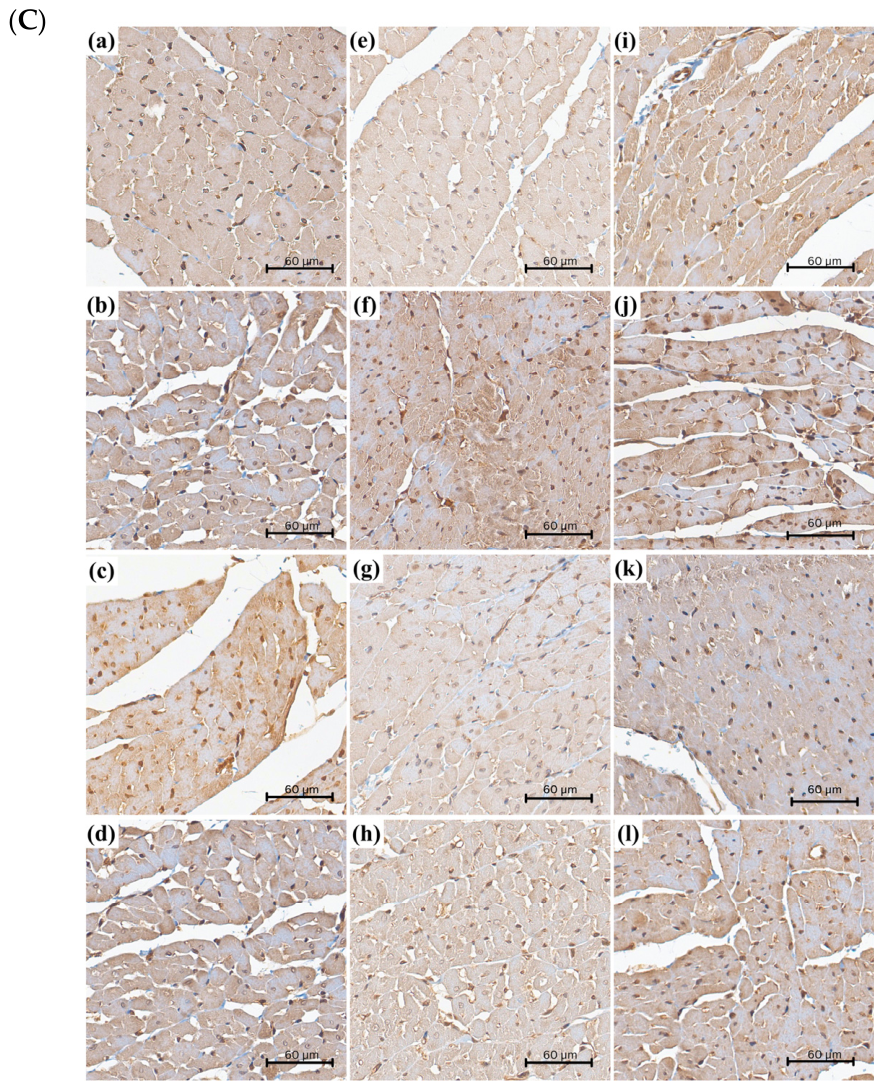
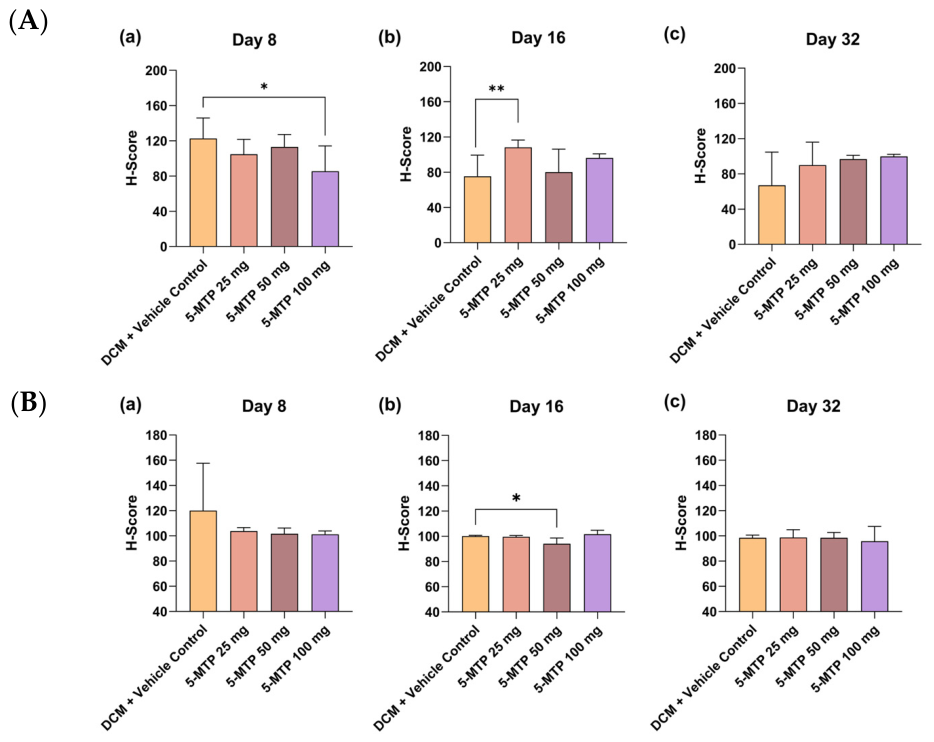
Nuclear and cytoplasmic AKT immunohistochemical expression across treatment groups at different treatment durations. (A) Quantitative comparison of AKT nuclear H-score among treatment groups at day 8 (a), day 16 (b), and day 32 (c). At day 8, no significant overall difference was observed among groups (p = 0.147), although the 100 mg/kg group demonstrated significantly lower nuclear AKT expression compared with the DCM + vehicle control group (p = 0.031). At day 16, AKT nuclear expression differed significantly among groups (p = 0.021), with the 25 mg/kg group demonstrating significantly higher nuclear AKT expression compared with the DCM + vehicle control group (p = 0.003), whereas no significant differences were observed in the 50 mg/kg or 100 mg/kg groups. No significant differences were observed at day 32. * p < 0.05 and ** p < 0.01 vs DCM + vehicle control. (B) Quantitative comparison of AKT cytoplasmic H-score among treatment groups at day 8 (a), day 16 (b), and day 32 (c). No significant differences were observed at day 8 or day 32. At day 16, AKT cytoplasmic expression differed significantly among groups (p = 0.023), with the 50 mg/kg group demonstrating significantly lower cytoplasmic AKT expression compared with the DCM + vehicle control group (p = 0.019), while no significant differences were observed in the 25 mg/kg or 100 mg/kg groups. (C) Representative AKT immunohistochemical-stained myocardial sections (400× magnification; scale bar = 60 μm) from each treatment group across time points: day 8 DCM + vehicle control (a), 5-MTP 25 mg/kg (b), 5-MTP 50 mg/kg (c), and 5-MTP 100 mg/kg (d); day 16 DCM + vehicle control (e), 5-MTP 25 mg/kg (f), 5-MTP 50 mg/kg (g), and 5-MTP 100 mg/kg (h); day 32 DCM + vehicle control (i), 5-MTP 25 mg/kg (j), 5-MTP 50 mg/kg (k), and 5-MTP 100 mg/kg (l). Brown staining indicates AKT expression. These findings demonstrate time-dependent differences in AKT expression following 5-MTP treatment.
Figure 8.
Nuclear and cytoplasmic AKT immunohistochemical expression across treatment groups at different treatment durations. (A) Quantitative comparison of AKT nuclear H-score among treatment groups at day 8 (a), day 16 (b), and day 32 (c). At day 8, no significant overall difference was observed among groups (p = 0.147), although the 100 mg/kg group demonstrated significantly lower nuclear AKT expression compared with the DCM + vehicle control group (p = 0.031). At day 16, AKT nuclear expression differed significantly among groups (p = 0.021), with the 25 mg/kg group demonstrating significantly higher nuclear AKT expression compared with the DCM + vehicle control group (p = 0.003), whereas no significant differences were observed in the 50 mg/kg or 100 mg/kg groups. No significant differences were observed at day 32. * p < 0.05 and ** p < 0.01 vs DCM + vehicle control. (B) Quantitative comparison of AKT cytoplasmic H-score among treatment groups at day 8 (a), day 16 (b), and day 32 (c). No significant differences were observed at day 8 or day 32. At day 16, AKT cytoplasmic expression differed significantly among groups (p = 0.023), with the 50 mg/kg group demonstrating significantly lower cytoplasmic AKT expression compared with the DCM + vehicle control group (p = 0.019), while no significant differences were observed in the 25 mg/kg or 100 mg/kg groups. (C) Representative AKT immunohistochemical-stained myocardial sections (400× magnification; scale bar = 60 μm) from each treatment group across time points: day 8 DCM + vehicle control (a), 5-MTP 25 mg/kg (b), 5-MTP 50 mg/kg (c), and 5-MTP 100 mg/kg (d); day 16 DCM + vehicle control (e), 5-MTP 25 mg/kg (f), 5-MTP 50 mg/kg (g), and 5-MTP 100 mg/kg (h); day 32 DCM + vehicle control (i), 5-MTP 25 mg/kg (j), 5-MTP 50 mg/kg (k), and 5-MTP 100 mg/kg (l). Brown staining indicates AKT expression. These findings demonstrate time-dependent differences in AKT expression following 5-MTP treatment.


Figure 9.
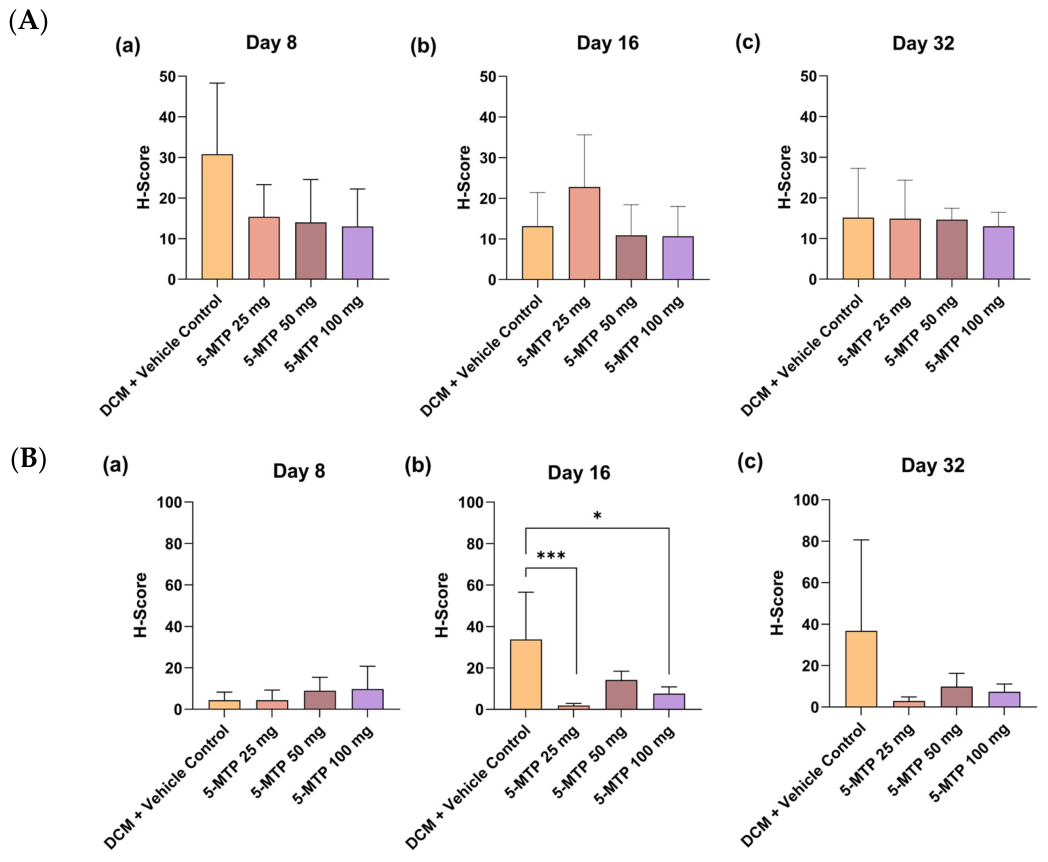
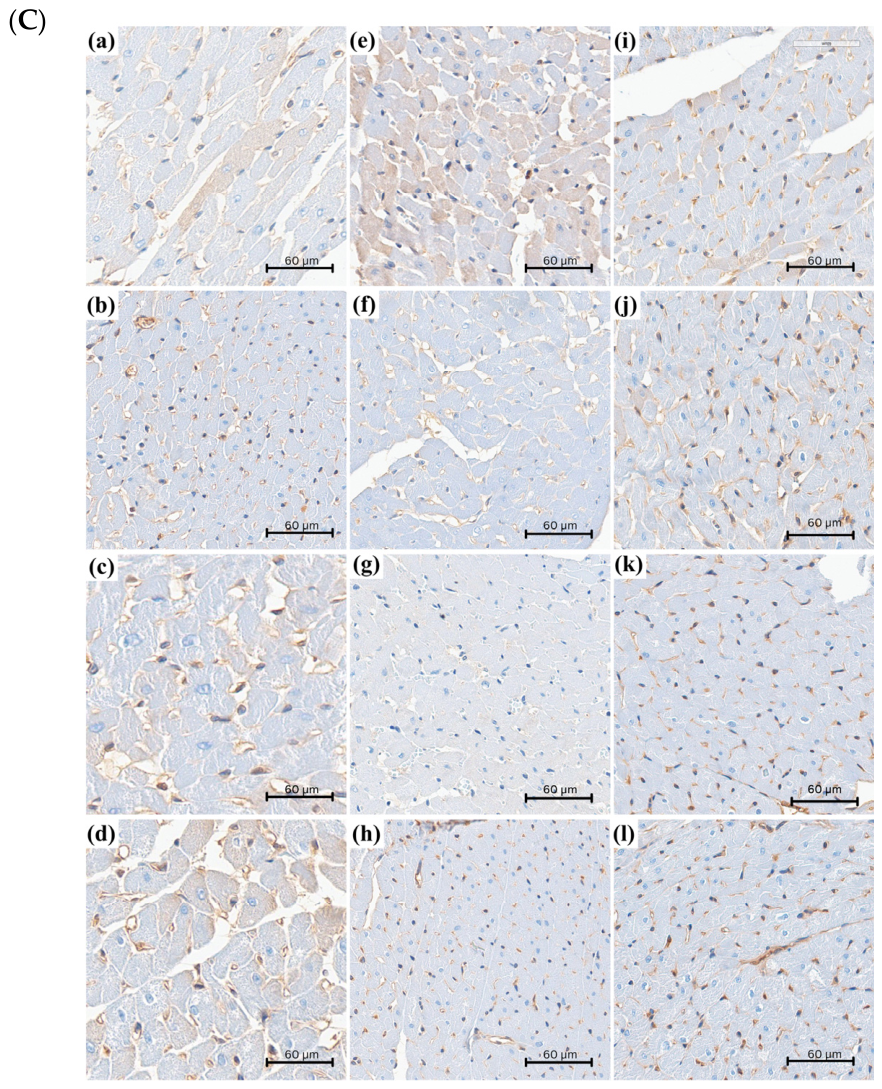
Nuclear and cytoplasmic NF-κB immunohistochemical expression across treatment groups at different treatment durations. (A) Quantitative comparison of NF-κB nuclear H-score among treatment groups at day 8 (a), day 16 (b), and day 32 (c). No significant differences in nuclear NF-κB expression were observed among groups at any time point. (B) Quantitative comparison of NF-κB cytoplasmic H-score among treatment groups at day 8 (a), day 16 (b), and day 32 (c). No significant differences were observed at day 8 or day 32. At day 16, cytoplasmic NF-κB expression differed significantly among groups (p = 0.006), with the 5-MTP 25 mg/kg group demonstrating significantly lower expression compared with the DCM + vehicle control group (p < 0.001), and the 100 mg/kg group also demonstrating significantly lower expression (p = 0.045), whereas no significant difference was observed in the 50 mg/kg group. * p < 0.05 and *** p < 0.001 vs DCM + vehicle control. (C) Representative NF-κB immunohistochemical-stained myocardial sections (400× magnification; scale bar = 60 μm) from each treatment group across time points: day 8 DCM + vehicle control (a), 5-MTP 25 mg/kg (b), 5-MTP 50 mg/kg (c), and 5-MTP 100 mg/kg (d); day 16 DCM + vehicle control (e), 5-MTP 25 mg/kg (f), 5-MTP 50 mg/kg (g), and 5-MTP 100 mg/kg (h); day 32 DCM + vehicle control (i), 5-MTP 25 mg/kg (j), 5-MTP 50 mg/kg (k), and 5-MTP 100 mg/kg (l). Brown staining indicates NF-κB expression. These findings indicate differences in cytoplasmic NF-κB expression at the intermediate time point following 5-MTP treatment.
Figure 9.
Nuclear and cytoplasmic NF-κB immunohistochemical expression across treatment groups at different treatment durations. (A) Quantitative comparison of NF-κB nuclear H-score among treatment groups at day 8 (a), day 16 (b), and day 32 (c). No significant differences in nuclear NF-κB expression were observed among groups at any time point. (B) Quantitative comparison of NF-κB cytoplasmic H-score among treatment groups at day 8 (a), day 16 (b), and day 32 (c). No significant differences were observed at day 8 or day 32. At day 16, cytoplasmic NF-κB expression differed significantly among groups (p = 0.006), with the 5-MTP 25 mg/kg group demonstrating significantly lower expression compared with the DCM + vehicle control group (p < 0.001), and the 100 mg/kg group also demonstrating significantly lower expression (p = 0.045), whereas no significant difference was observed in the 50 mg/kg group. * p < 0.05 and *** p < 0.001 vs DCM + vehicle control. (C) Representative NF-κB immunohistochemical-stained myocardial sections (400× magnification; scale bar = 60 μm) from each treatment group across time points: day 8 DCM + vehicle control (a), 5-MTP 25 mg/kg (b), 5-MTP 50 mg/kg (c), and 5-MTP 100 mg/kg (d); day 16 DCM + vehicle control (e), 5-MTP 25 mg/kg (f), 5-MTP 50 mg/kg (g), and 5-MTP 100 mg/kg (h); day 32 DCM + vehicle control (i), 5-MTP 25 mg/kg (j), 5-MTP 50 mg/kg (k), and 5-MTP 100 mg/kg (l). Brown staining indicates NF-κB expression. These findings indicate differences in cytoplasmic NF-κB expression at the intermediate time point following 5-MTP treatment.


Figure 10.
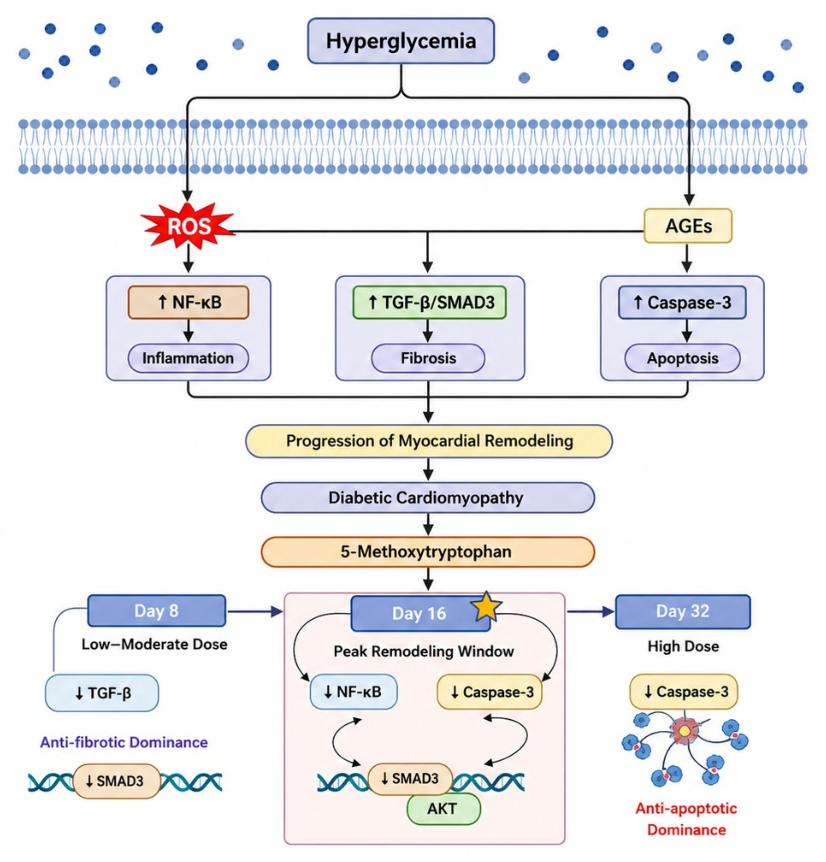
Proposed temporal framework of observed histopathological and molecular changes following 5-MTP treatment in experimental diabetic cardiomyopathy. Hyperglycemia promotes ROS and AGE formation, activating NF-κB-mediated inflammation, TGF-β/SMAD3-driven fibrosis, and caspase-3-associated apoptosis, which contribute to myocardial remodeling progression. Based on this study, 5-MTP was associated with early changes in TGF-β expression (day 8), broader intermediate changes in NF-κB, SMAD3, AKT, and caspase-3 expression (day 16), and persistent differences in caspase-3 expression at day 32. This figure summarizes the proposed temporal molecular effects of 5-MTP during DCM progression.
Figure 10.
Proposed temporal framework of observed histopathological and molecular changes following 5-MTP treatment in experimental diabetic cardiomyopathy. Hyperglycemia promotes ROS and AGE formation, activating NF-κB-mediated inflammation, TGF-β/SMAD3-driven fibrosis, and caspase-3-associated apoptosis, which contribute to myocardial remodeling progression. Based on this study, 5-MTP was associated with early changes in TGF-β expression (day 8), broader intermediate changes in NF-κB, SMAD3, AKT, and caspase-3 expression (day 16), and persistent differences in caspase-3 expression at day 32. This figure summarizes the proposed temporal molecular effects of 5-MTP during DCM progression.
Table 1.
Summary of temporal effects of 5-MTP on myocardial inflammation, apoptosis, fibrosis, and related molecular pathways in experimental diabetic cardiomyopathy.
Table 1.
Summary of temporal effects of 5-MTP on myocardial inflammation, apoptosis, fibrosis, and related molecular pathways in experimental diabetic cardiomyopathy.
| Outcome | Day 8 | Day 16 | Day 32 |
|---|
| HE | NS (overall p = 0.366) | NS (overall p = 0.642) | NS (overall p = 0.727) |
| MT | NS (overall p = 0.246) | Significant difference (overall p = 0.020 *)
DCM 46.6 ± 2.7
25 mg 35.3 ± 4.3 (p = 0.005 *)
50 mg 36.1 ± 3.5 (p = 0.008 *)
100 mg 38.8 ± 7.1 (p = 0.037 *) | NS (overall p = 0.367) |
| Collagen I | NS (overall p = 0.556) | NS (overall p = 0.371) | NS (overall p = 0.470) |
| Caspase-3 | NS (overall p = 0.255) | Significant difference (overall p = 0.029 *)
DCM 29.1 (15.8–46.4)
25 mg 1.5 (0–10.4), p = 0.026 *
50 mg 1.2 (0.4–13.4), p = 0.034 *
100 mg 0.6 (0–2.0), p = 0.005 * | Significant difference (overall p = 0.035 *)
DCM 17.3 (4.8–97.0);
25 mg 2.1 (0–10.4), p = 0.053
50 mg 2.3 (0.8–4.6), p = 0.080
100 mg 0.4 (0–2.3), p = 0.004 * |
| TGF-β | Significant difference (overall p = 0.006 *)
DCM 130.1 (113.8–149.6)
25 mg 99.7 (96.6–105.6), p = 0.017 *
50 mg 96.0 (94.2–104.8), p = 0.002 *
100 mg 115.0 (109.8–123.4), p = 0.458 | NS (overall p = 0.287) | NS (overall p = 0.241) |
| SMAD3 | NS (overall p = 0.069) | Significant difference (overall p = 0.029 *)
DCM 72.8 (25.8–91.2)
25 mg 7.2 (0.2–29.0), p = 0.017 *
50 mg 43.6 (12.8–64.4), p = 0.552
100 mg 9.5 (5.2–25.2), p = 0.017 * | NS (overall p = 0.500) |
| AKT nuclear | NS (overall p = 0.147) | Significant difference (overall p = 0.021 *)
DCM 80.5 (42.0–98.2)
25 mg 106.0 (101.2–119.6), p = 0.003 *
50 mg 87.2 (45.4–100.6), p = 0.480
100 mg 97.4 (90.4–100.0), p = 0.281 | NS (overall p = 0.314) |
| AKT cytoplasmic | NS (overall p = 0.564) | Significant difference (overall p = 0.023 *)
DCM 100.0 (99.8–101.0)
25 mg 99.9 (98.0–100.4), p = 0.624
50 mg 95.2 (88.2–98.0), p = 0.019 *
100 mg 100.1 (100.0–106.4), p = 0.571 | NS (overall p = 0.914) |
| NF-κB nuclear | NS (overall p = 0.375) | NS (overall p = 0.259) | NS (overall p = 0.981) |
| NF-κB cytoplasmic | NS (overall p = 0.702) | Significant difference (overall p = 0.006 *)
DCM 28.5 (12.0–65.8)
25 mg 2.0 (0.6–3.0), p < 0.001 *
50 mg 14.4 (9.2–18.7)
100 mg 8.6 (3.2–10.0), p = 0.045 * | NS (overall p = 0.220) |
Table 2.
MANOVA summary of treatment effects on fibrosis- and remodeling-related parameters.
Table 2.
MANOVA summary of treatment effects on fibrosis- and remodeling-related parameters.
| Time Point | Wilks’ Lambda | F | Partial η2 | Overall p-Value | Dominant Parameters |
|---|
| Day 8 | 0.072 | 5.289 | 0.584 | <0.001 | TGF-β, SMAD3 |
| Day 16 | 0.007 | 5.363 | 0.808 | <0.001 | Caspase-3, cytoplasmic NF-κB, SMAD3, cytoplasmic AKT, MT |



 ,
,