Article

Adaptation of Plants to UV-B Radiation with Altitude in Tuha Basin: Synergistic Regulation of Epidermal Structure, Secondary Metabolites, and Organic Element Allocation

1
Ministry of Education Key Laboratory of Cell Activities and Stress Adaptations, Gansu Province Key Laboratory of Gene Editing for Breeding, School of Life Sciences, Lanzhou University, Lanzhou 730000, China
2
State Key Laboratory of Plateau Ecology and Agriculture, Qinghai University, Xining 810016, China
*
Authors to whom correspondence should be addressed.
These authors contributed equally to this work.
Life 2025, 15(9), 1375; https://doi.org/10.3390/life15091375
Submission received: 5 August 2025 / Revised: 23 August 2025 / Accepted: 27 August 2025 / Published: 29 August 2025
(This article belongs to the Special Issue Physiological Responses and Adaptation Mechanisms of Plants to Stress)

Abstract

Ultraviolet B (UV-B) radiation is a key environmental factor that limits plant growth and development. High UV-B intensity is a typical environmental feature in Turpan-Hami (Tuha) Basin in Xinjiang, China. In this study, the altitude-dependent UV-B adaptation strategies of plants in Tuha Basin were analyzed. Chlorophyll (Chl) and flavonoid (Fla) play an important role in absorbing UV-B radiation, scavenging free radicals, and maintaining photosynthetic performance under UV-B stress. Principal component analysis indicated that the total chlorophyll (Chl t), Chl a, Chl b, and Fla contents and the Chl a/Chl b ratio are important indicators for evaluating plant tolerance to UV-B. Noticeably, with increased altitudes, the roles of Chl b, Chl a/Chl b, and Fla become markedly significant. The characteristics of stomata, epidermal hair, and wax layer are closely correlated with the UV-B amount that reaches leaves. Epidermal hair density and cuticle thickness in leaves decreased with increased altitudes, whereas hydrogen oxide (H2O2) was significantly accumulated, but superoxide anion (O2) remained unchanged. High altitude significantly increased the stomatal apparatus area, density and specific leaf area. Moreover, plants without epidermal hair had a larger stomatal apparatus area compared with plants with epidermal hair. However, the presence or absence of epidermal hair had no effect on cuticle thickness, H2O2 and O2 levels. The carbon (C), nitrogen (N), and hydrogen (H) contents were high in plant leaves at high altitude, but the sulfur (S) content and C/N ratio were low. Taken together, plants in Tuha Basin could cope with UV-B radiation by synergistically regulating epidermal structures and synthesis of secondary metabolites. Meanwhile, these plants could further allocate and reconstruct organic elements to optimize their resource distribution in adaptation to UV-B radiation with different altitudes.

1. Introduction

Tuha Basin, a collective term for the Turpan Basin and the Hami Basin, is located in the eastern part of Xinjiang, China, bordering the Junggar Basin in the southwest and the Tarim Basin in the northwest. It belongs to a typical arid and semi-arid continental climate. The lowest point of the Tuha Basin (−154 m) is one of the hottest and driest places on Earth; however, the Bogda Peak in the north has an elevation of 5445 m [1]. The drastic terrain changes and extreme climate conditions (low annual precipitation, high evaporation, strong solar radiation) have nurtured diverse ecosystems from arid deserts to alpine glacier zones [2]. The eastern part of Xinjiang has a relatively long annual sunshine duration (2900–3450 h; [3]). Moreover, the Hami Basin has the highest solar radiation intensity, and its annual total solar radiation reaches 403.3 kJ cm−2 a−1, of which UV radiation reaches 28.231 kJ cm−2 a−1. Thus, the desert plants in the Tuha Basin have evolved unique adaptation mechanisms, forming structurally simple but diverse desert plant communities [4], which provide valuable resources for studying the adaptive evolution of plants under combined stresses of high altitude, UV radiation, drought stress and so on.
About 7% of solar radiation falls in the UV range (200–400 nm), and UV-B radiation (280–315 nm) is an inherent component of sunlight that reaches the earth’s surface [5]. UV-B radiation intensity increases with altitude, resulting in differential UV-B exposure for plants at different altitudes. Fu [6] reported that UV-B radiation on the northern slope of the Tianshan Mountains in Tuha basin increases with altitude, with an average increase of 1.185 MJ m−2 a−1 per 100 m elevation. Although UV-B serves as an important light signal involved in regulating photomorphogenesis, radiation stress adaptation, and floral transition [7], excessive exposure to UV-B can seriously affect plant development, leading to UV-B stress, i.e., reduced plant height and leaf area, shortened internodes, thickened leaves, delayed flowering, inhibition of pollen germination, and reduction in transpiration rate [8,9,10]. UV-B can also inhibit chlorophyll biosynthesis and promote its degradation [11], destroy the photosystem II (PSII) reaction center, reduce the maximum quantum yield (Fv/Fm) of PSII [12], leading to plant yellowing and slow growth [13]. High UV-B radiation causes cellular damage through multiple pathways, for example, reactive oxygen species (ROS) burst, lipid peroxidation, DNA and protein damage, ultimately leading to cell death [14]. For example, UV-B can induce DNA damage through the formation of pyrimidine dimer, finally impairing DNA synthesis and replication [15]. At the molecular level, UV-induced DNA damage can be efficiently repaired by photolyase. Among these, the CPD photolyase (PHR) expression is regulated by the UV-B-dependent UVR8 signaling pathway, blue light and UV-A radiation [16].
To alleviate the damage caused by UV-B radiation, plants have evolved a set of physiological and molecular adaptation mechanisms, mainly involving reducing exposure, protection, shielding, and repair. Plants can reduce leaf area and induce leaf curling to minimize exposure. Meanwhile, changes in wax composition in cuticles, accumulation of UV-B absorbing pigments, and leaf thickening collectively enhance the ability of plants to shield against UV-B radiation [9]. Plants can reduce PSII degradation caused by high light through adjusting chloroplast distribution and repair it through PSII recombination [17,18]. Flavonoids (Fla), i.e., flavanols and anthocyanins (Ant), can directly absorb UV-B in the epidermis [13]. Ant, as natural antioxidants, can protect plants from excessive UV-B radiation through scavenging free radicals [19,20]. Moreover, Ant can enhance the total antioxidant capacity by increasing L-ascorbic acid and glutathione levels [21,22]. After the removal of epidermal hairs, the photosynthetic electron transfer rate in Verbascum thapsus L. is significantly inhibited under UV-B radiation [23]. The cuticle of leaf epidermis is composed of a series of very-long-chain fatty acids (VLCFA) and their derivatives [24], which is crucial for preventing non-stomatal water loss and damage caused by UV-B radiation, insects, and fungi [25,26,27]. The UV rays that reach the surface of plants can be reflected or scattered by epidermis and cuticles and absorbed by phenolic compounds in cuticles [28]. Meanwhile, phenolic substances present in cuticles play a crucial role in photoprotection under UV-B radiation, especially in the UV-C and UV-B ranges. Zhou et al. (2024) reported that calcium signal plays a significant role in UV-B responses by modulating phenolic acid accumulation to enhance plant UV-B tolerance [29]. Recent studies reveal that the UVR8 protein serves as the primary UV-B receptor in plants. UVR8 activation initiates downstream signaling pathways [30]. Under UV-B exposure, UVR8 undergoes monomerization and interacts with COP1 to facilitate the accumulation of HY5, a key transcription factor that regulates the expressions of numerous UV-B -associated genes [31].
Stomata serve as main channels for gas exchange between leaves and environments, and play a major role in regulating water and C cycle [32]. Plants can optimize transpiration and photosynthetic efficiency by regulating stomatal aperture to adapt to different environmental stresses, such as drought, salt, high light, UV-B radiation, etc. [33,34]. The changes in stomatal size, distribution and density are also key adaptive characteristics of plants in response to environmental stresses [35,36,37]. Yang et al. (2014) reported that the stomatal density of species in the Qinghai–Tibet plateau is significantly higher than that in the Mongolian grasslands (mean difference is 23%), while the stomatal size is smaller, reflecting a trade-off between photosynthetic efficiency and moisture preservation in high-radiation environments [36]. With the increase in altitude as well as the decrease in temperature and partial pressures of CO2 and O2, stomatal density changes accordingly; moreover, the pattern exhibits strong plasticity [36,37,38,39]. The lower temperatures in high-altitude areas slow down metabolic processes, while the lower levels of CO2 challenge the ability of plants to effectively carry out photosynthesis. Therefore, plants may reduce stomatal density to minimize water loss caused by transpiration and optimize photosynthetic performance. However, the characteristics and mechanism of plant stomata changing with altitude and UV-B radiation is still unclear.
To elucidate the altitude-dependent UV-B adaptation strategies of plants, the UV-adaptation mechanism of 78 plant species was systematically analyzed through detecting the UV-B tolerance- related physiological and morphological indicators under different altitudes in the Tuha Basin. On this basis, the longitudinal adaptation strategies and underlying mechanisms of plants adaptation to changes in altitude and UV-B radiation were investigated. Our results suggest that plants could cope with UV-B radiation by synergistically regulating epidermal structures (epidermal hairs, cuticle, and stomatal characteristics), synthesis of secondary metabolites (chloroplast pigments and Fla), and allocation and reconstruction of organic elements (C, N, S) under different altitudes in the Tuha Basin.

2. Materials and Methods

2.1. Study Area and Sample Collection

The Turpan-Hami Basin (the Tuha Basin) is located in Xinjiang, China (91°06′33″–96°23′00″ E, 40°52′47″–45°05′33″ N). Tuha Basin is approximately 660 km from east to west and 60–100 km from north to south, with a total area of about 53,500 km2. The Tuha Basin region belongs to a typical continental arid climate characterized by extreme drought and intense UV-B radiation, which forms unique and diverse resources of anti-adversity plants. To investigate the mechanisms of plant adaptation to UV-B radiation at different altitudes in the Tuha Basin, representative plant samples were collected in June 2023 and June 2024 at different altitudes (400–2500 m) in the East Tianshan Mountains in the Tuha Basin, and categorized into three groups, i.e., low-altitude region (LA; <1100 m), middle-altitude region (MA; 1100–1900 m) and high-altitude region (HA; >1900 m) based on the distribution characteristics of vegetation (Tables S1 and S2). In each sampling area, all plant species were collected with at least 6 replicates.

2.2. Chlorophyll Content Analysis

The chlorophyll content was detected according to Sartory and Grobbelaar [40]. Briefly, 25 mg of leaves was cut into pieces and extracted with 1 mL of 95% ethanol at 4 °C for 72 h in the dark. The absorbance at 470, 663 and 645 nm was determined, the contents of chlorophyll a (Chl a), chlorophyll b (Chl b), total chlorophyll (Ch t) and carotenoid (Car) were calculated according to the followed formula.
Chl a (μg/mL) = 12.7 OD663 − 2.69 OD645
Chl b (μg/mL) = 22.9 OD645 − 4.68 OD663
Chl t (μg/mL) =8.02 OD663 + 20.2 OD645
Car (μg/mL) = (1000 OD470 − 1.82 Chl a − 85.02 Chl b)/198

2.3. Analysis of Anthocyanin Content

The anthocyanin (Ant) content was detected according to Vandenbussche et al. [41]. 25 mg of leaves were extracted with 600 μL of acidic methanol (methanol/HCl = 99:1, v/v) at 4 °C for 72 h. After adding 400 μL of chloroform and 400 μL of water into the supernatant, the mixture was centrifuged at 10,000× g for 10 min at 4 °C. The absorbance of the supernatant was measured at 530 nm. Ant content was expressed as OD530/gFW.

2.4. Flavonoid Content Analysis

The flavonoid (Fla) content was determined with the Plant Flavonoids kit (Keming Biotechnology, Suzhou, China). After the leaves were dried, 0.2 g of dried samples were extracted with 2 mL of 60% ethanol at 60 °C for 2 h with shaking. After centrifuged at 10,000× g for 10 min, the supernatant was collected for analysis. The Fla content was determined according to the instructions of the kit. The Fla content (mg/gDW) was calculated based on a standard curve (y = 5.02x + 0.0007, R2 = 0.9996)

2.5. Analysis of Cuticle Thickness

The cuticle was analyzed according to Tanaka et al. [42]. Plant leaves were immersed in 0.5% of toluidine blue (TB) solution, vacuum-infiltrated for 30 min, and then incubated in darkness for 10 h. The cuticle thickness was quantified using Image J 6.0.

2.6. Statistics of Epidermal Hair Density

The morphology of epidermal hair of leaves was observed and photographed with the stereo microscope [43]. The density of epidermal hair (/mm2) was counted by using the TCapture software.

2.7. Analysis of Stomatal Features

The stomatal features were analyzed according to Han et al. [44]. The leaf segments (0.5 cm × 0.5 cm) from different parts (tip, margin, base) were fixed in fixative solution (ethanol/acetic acid = 3:1, v/v) (≥1 h), rinsed, and photographed under a light microscope. Stomatal apertures (length, μm; width μm; area, μm2; density, /mm2) on the abaxial surface were measured using Image J 6.0, and data was averaged as the final result.

2.8. Analysis of H2O2 and O2 Contents

The H2O2 content was analyzed according to Wang et al. [45]. The leaves were incubated in 3,3′-Diaminobenzidine (DAB) buffer containing 1 mg/mL DAB, 50 mM Tris-acetic acid, pH 5.0, and 0.05% TritonX-100 in the darkness at room temperature for 4 h. After chlorophyll was completely removed from the stained leaves with 75% ethanol at 75 °C, the samples were photographed. The H2O2 content was quantified using Image J 6.0.
The O2 content was analyzed according to Jha et al. [46]. The leaves were incubated in nitroblue tetrazolium (NBT) buffer containing 10.5 mg/mL NBT, 50 mM PBS, pH 7.4, and 0.05% TritonX-100 in the darkness at room temperature for 3 h. After chlorophyll was removed from the stained leaves with 75% ethanol at 75 °C, the samples were photographed. The O2 content was quantified using Image J 6.0.

2.9. Determination of Organic ELEMENT Content

Determination of organic element content in leaves was carried out following the method of Zhao et al. [47]. Leaves were initially dried at 105 °C for 30 min, then transferred to a 65 °C oven for 48 h and dried to constant weight. After the dried samples were uniformly ground using a ball mill, element content (%) was determined using an elemental analyzer (Elementar Vario EL cub, Elementar, Langenselbold, Germany).

2.10. Comprehensive Evaluation Based on Membership Function

The comprehensive evaluation method based on membership function was used to evaluate the UV-B tolerance in the selected species [48]. Firstly, fuzzy membership function value for each species was calculated based on Formula (1); secondly, the PCA was performed using IBM SPSS Statistics 21 to determine the correlation coefficient (r) and contribution rate between each principal component and each indicator; thirdly, a principal component membership function value was calculated based on Formula (2); finally, total membership function value (D value) was calculated based on Formula (3). After the sensitivity analysis, D value is used to evaluate the UV-B tolerance of species.
Wij = (Xij − Xmin)/(Xmax − Xmin)
Xmax: the maximum value of an index; Xmin: the minimum value of an index; Xij: the absolute value of an index.
Uj = ∑nj = 1WijRij
Rij: the r between index i and index j.
D = ∑nj = 1Ujx Pj/(∑nj = 1Pj)
Pj: the contribution rate of a principal component; ∑nj = 1Pj: the sum of the contribution rates of the selected principal components.

2.11. Statistical Analysis

The data were statistically analyzed using the IBM SPSS 22.0 software and expressed as means ± SD (n ≥ 3). For the comparison of two groups, the significant analysis was performed with Student’s t test. For multiple comparisons, the significant analysis was performed with one-way ANOVA and Tukey’s test. The images were created by Origin 2024. PCA was analyzed with OriginPro 2021.

3. Results

3.1. Changes in UV-B Absorbing Substances and Chloroplast Pigments in Plants Across Altitudes in the Tuha Basin

To elucidate altitude-dependent UV-B adaptation strategies in plants, the plants collected from the Tuha Basin were classified into three groups: low-altitude (LA, <1100 m) plants, middle-altitude (MA, 1100–1900 m) plants, and high-altitude plants (HA, >1900 m; Tables S1 and S2). A total of 24 plant species were collected from the LA regions, including Haloxylon ammodendron, Lycium ruthenicum, and Karelinia caspia (Tables S1 and S2). Twenty-two species were collected in the MA regions, including Phragmites australis, Pennisetum alopecuroides, and Carex ovatispioulata Thunb (Tables S1 and S2). Thirty-two plant species were collected from HA regions, including Oxytropis glabra, Potentilla chinensis, and Neotrinia splendens (Tables S1 and S2).
The Fla content was highest in the LA plants, followed by the HA plants, and lowest in the MA plants (Figure 1A; Table S3). Compared to the LA plants, the Fla content decreased by 11.88% in the HA plants and by 29.03% in the MA plants. The anthocyanin (Ant) content was highest in the HA plants, and it significantly increased by 18.63% and 32.02% compared to the LA and MA plants, respectively (Figure 1B; Table S3). The contents of chlorophyll a (Chl a), chlorophyll b (Chl b), total chlorophyll (Chl t), and Car increased with elevation. Compared to the LA group, the contents of Chl a, Chl b, Chl t and Car in the MA group were significantly increased by 18.03%, 18.19%, 18.11%, and 15.13%, respectively. Compared to the MA group, the HA group exhibited increases of 18.50% in Chl a, 12.05% in Chl b, 15.39% in Chl t, and 10.90% in Car (Figure 1C–F; Table S3). However, the Chl a/Chl b ratio showed no significant differences among the three groups (Figure 1G; Table S3). Comparatively, the Chl t/Car ratio increased significantly by 13.98% in the MA group and 10.75% in the HA group compared to the LA group; but there was no significant difference between the MA and HA groups (Figure 1D; Table S3). These results suggested that except for Fla, the contents of Ant, chlorophyll (Chl a, Chl b, Chl t), and Car showed consistent and significant increases with elevation, indicating that Ant and chloroplast pigments play important roles in plant adaptation to the changed UV-B environments with elevation in the Tuha Basin.

3.2. Principal Component Analysis (PCA) on the Physiological Indicators in Plant Tolerance to UV-B Under Different Altitudes

To further identify the key indicators in plant adaptation to the changing UV-B environments with increased altitudes in the Tuha Basin, and comprehensively assess their UV-B tolerance, PCA was performed on the eight physiological indicators, i.e., UV-B absorbing compounds (Fla, Ant), chloroplast pigments (Car, Chl t, Chl a, Chl b), Chl t/Car, and Chl a/Chl b. In the LA region, the first three axes of PCA explained 54.807%, 19.732%, and 13.145% of trait variation, respectively, with a cumulative contribution rate of 87.685%. The first principal component (λ = 4.358) was mainly represented by Chl a, Chl b, and Chl t, r = 0.977, 0.991, 0.987, respectively. It indicated that this principal component primarily reflects the variation in chlorophyll content in various plant species in the LA area of the Tuha Basin. The second principal component (λ = 1.579) was mainly represented by Chl a/Chl b (r = 0.714), indicating that it primarily reflects Chl a/Chl b variation. The third principal component (λ = 1.052) was mainly represented by Fla content (r = 0.695), indicating that it primarily reflects the variation in Fla content in various plant species in the LA area of the Tuha Basin (Table 1; Figure S1A).
In the MA regions, the first three axes of PCA explained 53.314%, 25.421%, and 10.430% of trait variation, respectively, with a cumulative contribution rate of 89.165%. The first principal component (λ = 4.265) was mainly represented by Chl a, Chl b, and Chl t, r = 0.975, 0.985, 0.985, respectively. It indicated that this principal component primarily reflects the variation in chlorophyll content. The second principal component (λ = 2.034) was mainly represented by Chl a/Chl b (r = 0.828), indicating that it primarily reflects the Chl a/Chl b variation. The third principal component (λ = 0.824) was mainly represented by Fla content (r = 0.744), indicating that it primarily reflects the variation in Fla content in the plant species in the MA area of the Tuha Basin (Table 1; Figure S1).
In the HA regions, the first three axes of PCA explained 45.635%, 30.247%, and 11.321% of trait variation, respectively, with a cumulative contribution rate of 87.203%. The first principal component (λ = 3.651) was mainly represented by chlorophyll content (Chl a, Chl b, Chl t), r = 0.877, 0.905, 0.946, respectively. It indicated that this principal component primarily reflects the variation in chlorophyll content. The second principal component (λ = 2.420) was mainly represented by Chl a/Chl b (r = 0.929), indicating that this component primarily reflects the Chl a/Chl b variation. The third principal component (λ = 0.906) was mainly represented by Fla content (r = 0.806), indicating that this component primarily reflects the variation in Fla content in the plant species in the HA area of the Tuha Basin (Table 1; Figure S1).
Based on PCA results, the chlorophyll content (Chl a, Chl b, Chl t), Chl a/Chl b ratio, and Fla content in low-, middle-, and high-altitude plants of the Tuha Basin cover most of the information on eight physiological indicators and are important indicators for evaluating UV-B tolerance of the plant species in the Tuha Basin. Noticeably, with the increased altitude, Chl b, Chl a/Chl b, and Fla played increasingly prominent roles (Table 1).

3.3. Comprehensive Evaluation of UV-B Tolerance in Tuha Plants Under Different Altitudes Based on Membership Function Analysis

To comprehensively evaluate the UV-B tolerance of typical plants in the Tuha Basin, the fuzzy mathematical membership function comprehensive evaluation method was used in combination with PCA results (Table 2). Based on the D values, Tuha plants at each altitude were classified into four categories: Class I (high UV-tolerant plants; D > 0.910), Class II (strong UV-tolerant plants; 0.500 < D < 0.910), Class III (moderate UV-tolerant plants; 0.300 < D < 0.500), and Class IV (low UV-tolerant plants; D < 0.300). Specifically, there were ten UV-tolerant plants (I and II) in the HA regions, including Oxytropis glabra (0.947), Potentilla chinensis (0.933), Neotrinia splendens (0.870), and Medicago sativa (0.859). There were 11 UV-tolerant plants (I and II) in the MA areas, including Phragmites australis (0.973), Pennisetum alopecuroides (0.959), Carex ovatispioulata (0.951), Oxytropis glabra (0.782), and Caragana sinica (0.771). There were six UV-tolerant plants (I and II) in the LA area, including Sophora alopecuroides (0.913), Phragmites australis (0.839), Populus euphratica (0.645), and Apocynum venetum (0.622). The low UV-tolerant plants included Neotorularia humilis (0.293) from the HA regions, Neotrinia splendens (0.279), Anabasis brevifolia (0.253), Lycium ruthenicum (0.224), and Anabasis aphylla (0.152) from the MA regions, and Haloxylon ammodendron (0.243), Lycium ruthenicum (0.283), and Karelinia caspia (0.217) from the LA regions (Table 2). It is noteworthy that Braya humilis in the HA region belongs to the low UV-tolerant plant; comparatively, it belongs to moderate UV-tolerant plant in the MA region (Table 2). These results indicate that the differences in stress tolerance of the same plant species in different environments might reflect an adaptive strategy to adapt to changing environments.
To clarify the biological significance of the total membership function values, linear regression analysis was performed between the total membership function values and the fuzzy mathematics membership functions of eight physiological indicators. As shown in Figure S2, in the LA regions, except for Chl a/Chl b, all other indicators showed significantly positive correlations with the total membership function. In the MA area, except for Fla and Chl a/Chl b, all other indicators exhibited highly and significantly positive correlations with the total membership function. In the HA area, except for Fla and Chl t/Car, all other indicators showed significantly positive correlations with the total membership function. These results demonstrate that the total membership function value can serve as a comprehensive indicator for evaluating UV tolerance of plant species in different altitudes of the Tuha Basin. Plants with high D values have stronger tolerance to UV environments.

3.4. Variations in Epidermal Hairs and Cuticles in Various Plant Species from Different Altitudes of the Tuha Basin

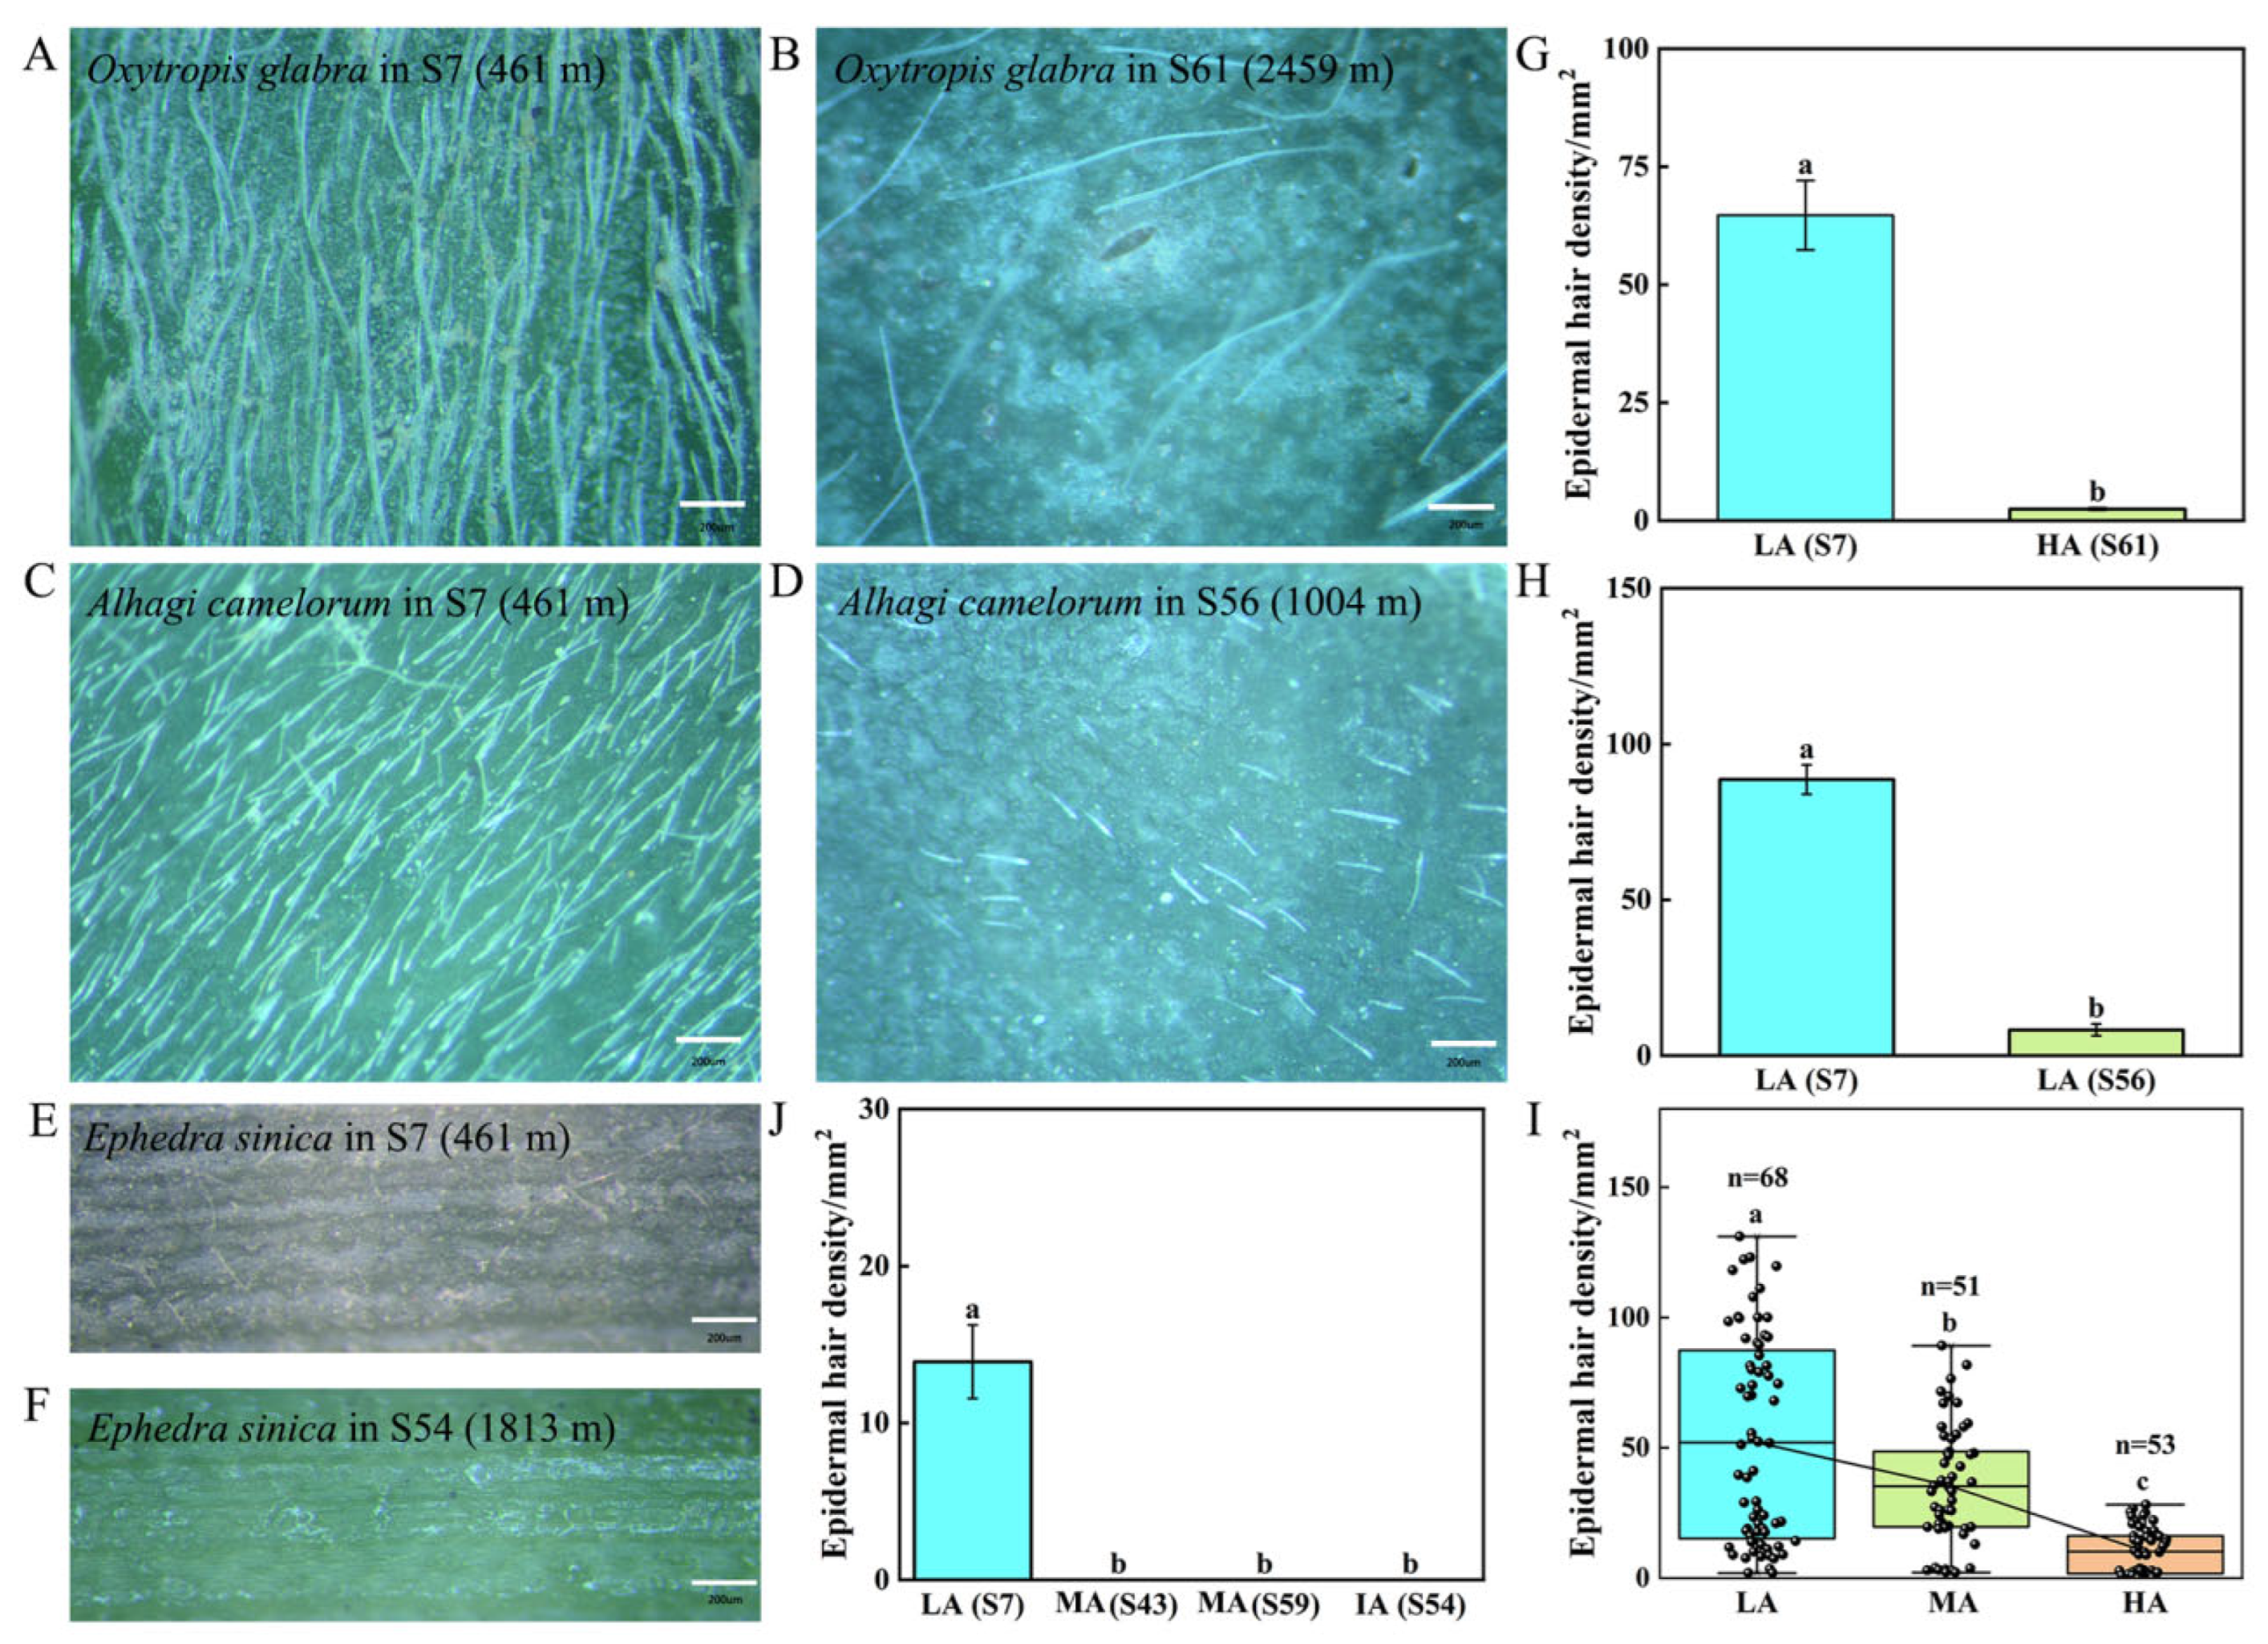
Research has demonstrated that epidermal hairs and cuticles play crucial roles in plant protection against UV-B radiation [23,49]. To investigate the variation in epidermal hairs with changing altitudes and UV-B intensity among Tuha plants, the epidermal hair density was further analyzed. For this purpose, the samples collected in 2024 were used for analysis, and based on the density of epidermal hairs, Tuha plants at each altitude were classified into four categories (Table S4): Class I (plants with high density of epidermal hairs; density > 60/mm2), Class II (plants with moderate density of epidermal hairs; 20/mm2 < density < 60/mm2), Class III (plants with low density of epidermal hairs; 10/mm2 < density < 20/mm2), and Class IV (plants with sparse epidermal hairs; density < 10/mm2). The results further showed that the density of epidermal hairs in Oxytropis glabra at S7 site (461 m) was 26.2 times higher than that in the same species at the HA site-S61 (2459 m; Figure 2A,B,G). Similarly, the density of epidermal hairs in Alhagi sparsifolia at the LA site-S7 (461 m) was 10.7 times higher than that in the same species at the MA site-S56 (1004 m; Figure 2C,D,H). Ephedra sinica only displayed sparse epidermal hairs at LA site-S7; comparatively, its epidermal hairs were completely absent at the MA site-S54 (1813 m; Figure 2E–J). Thus, as the altitude increased, the density of epidermal hairs continued to decrease within species in the Tuha Basin. Moreover, this pattern extended among species, as shown in Figure 2I and Table S4.
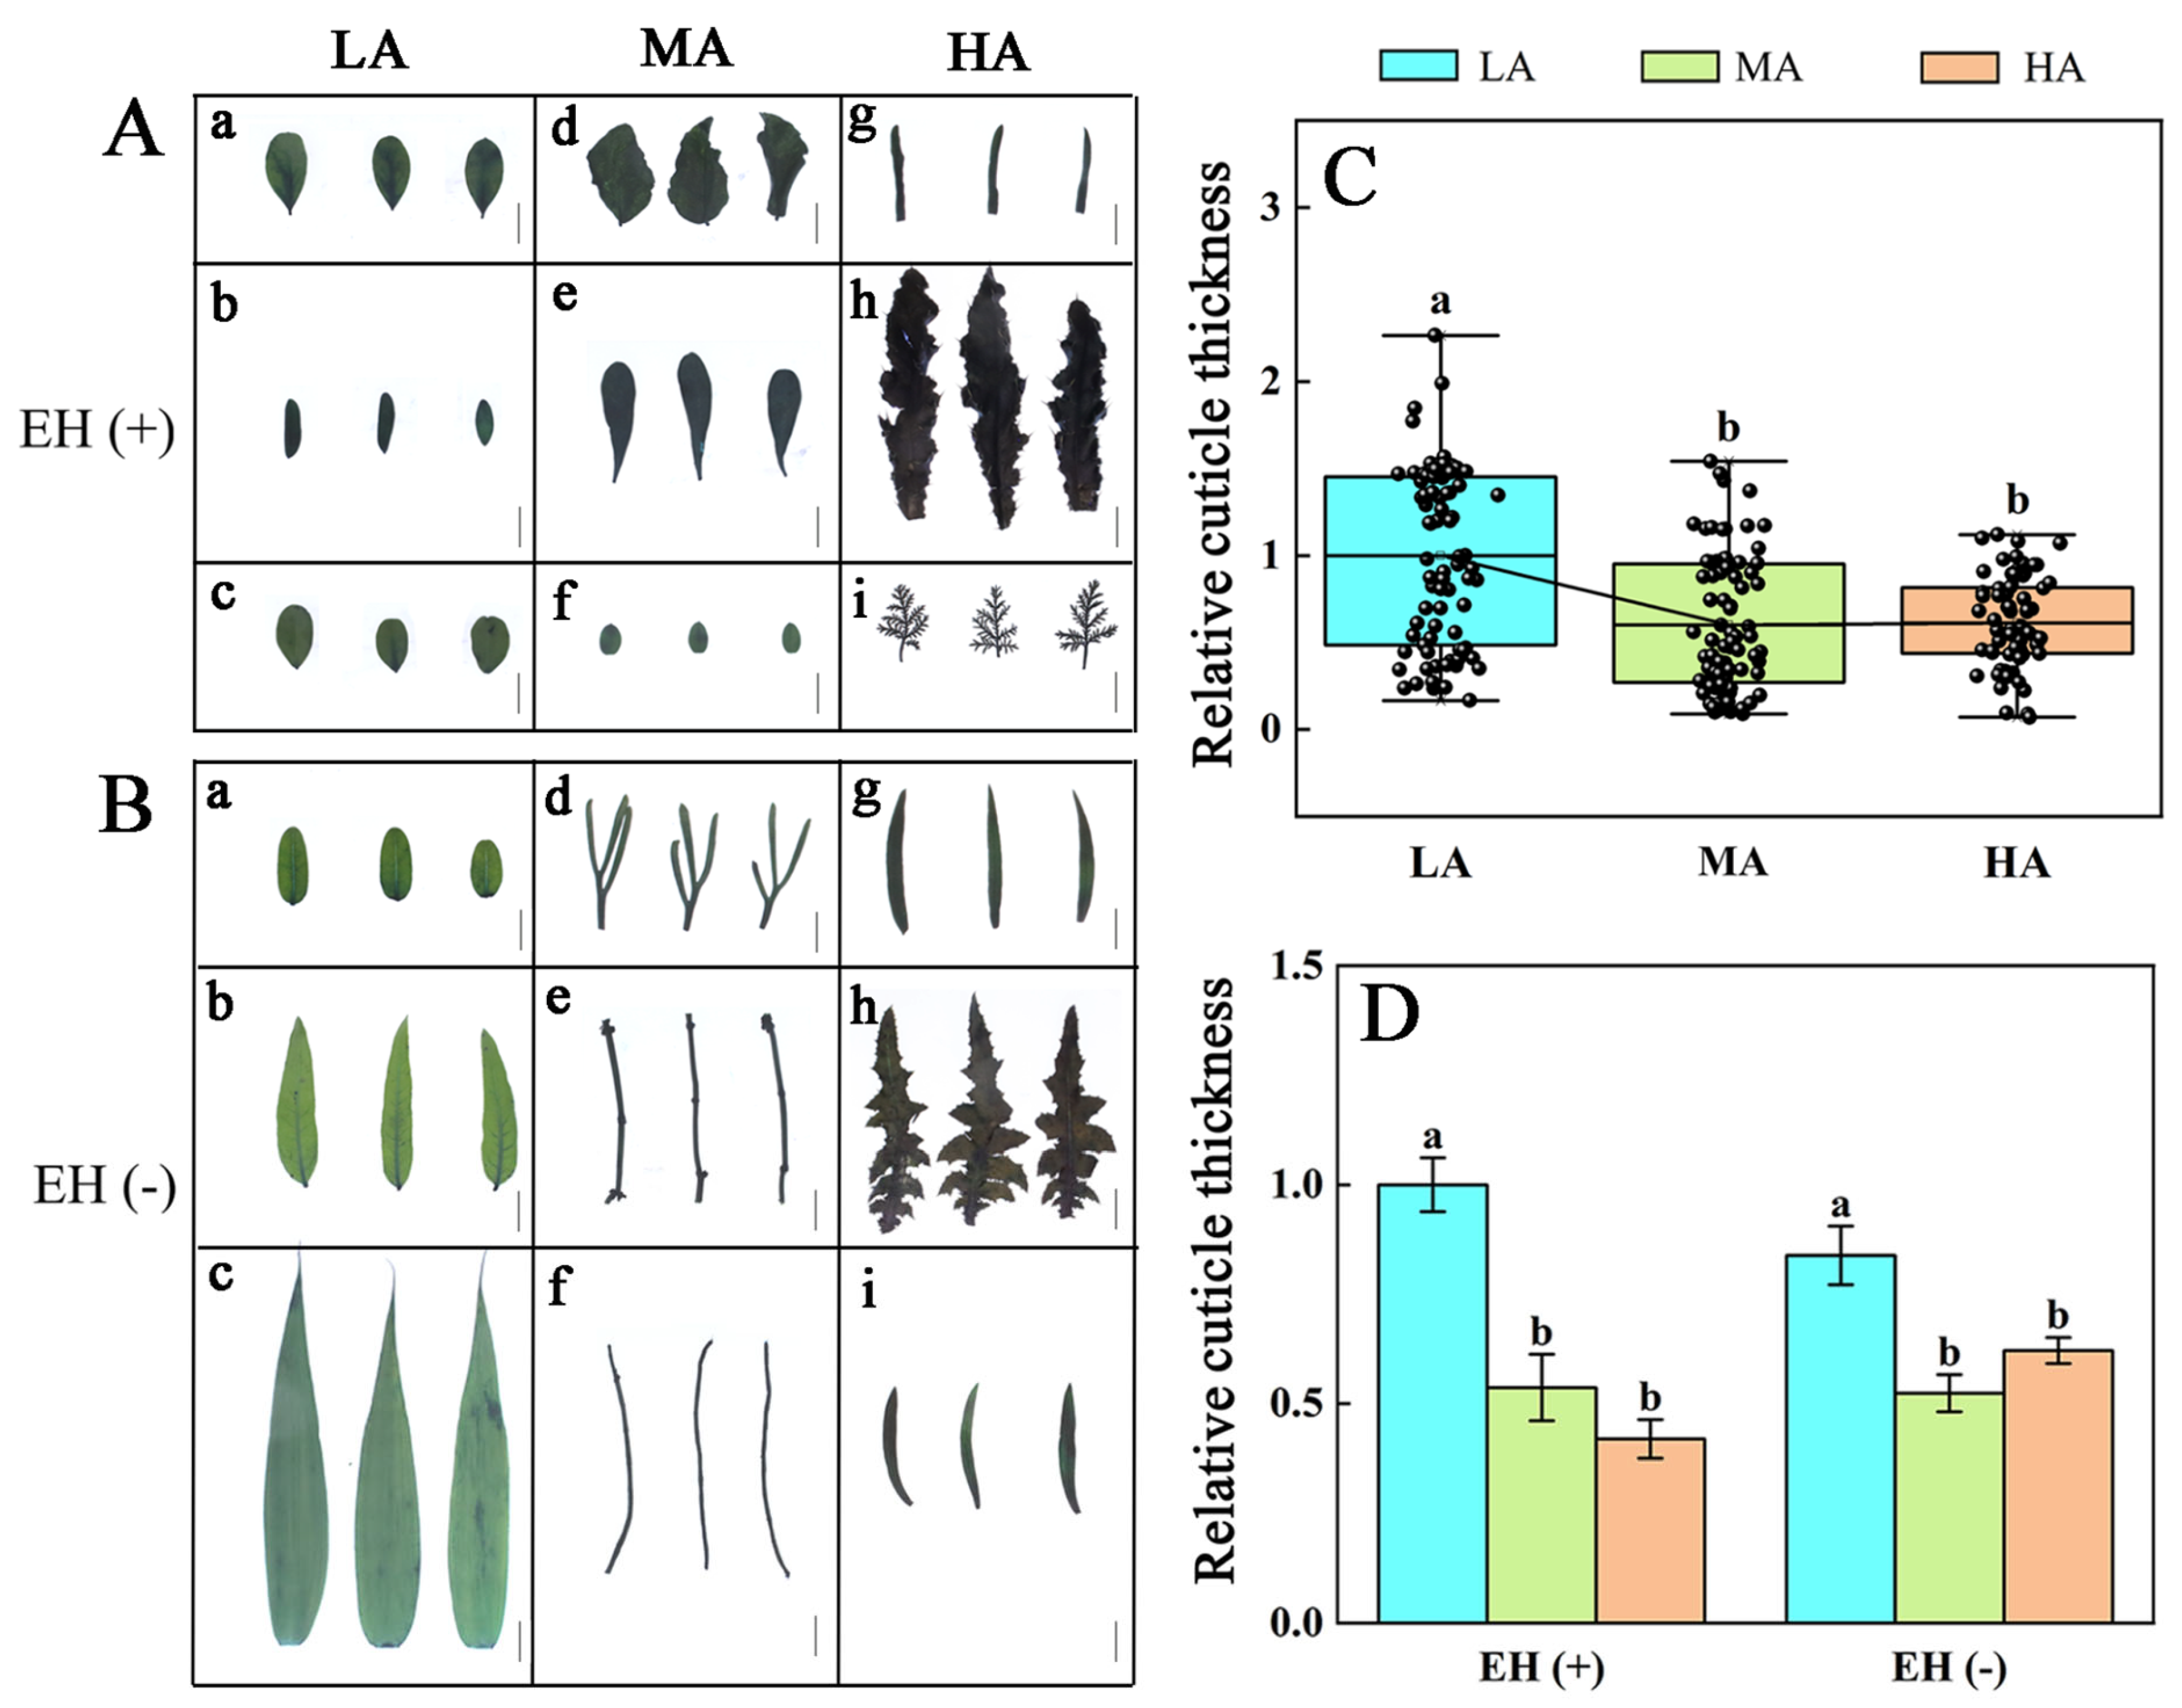
The analysis of cuticle thickness revealed that in the Tuha Basin ecosystem, the cuticle thickness of leaves exhibited a decreasing trend with increased altitudes, although no significant difference was observed among plants from middle to high altitudes (Figure 3A–C; Table S5). To further investigate the influence of epidermal hairs on cuticle thickness, the samples were divided into two groups based on the presence or absence of epidermal hairs. The results demonstrated that the presence or absence of epidermal hairs had no significant effects on cuticle thickness at the same altitude (Figure 3D). Moreover, regardless of presence or absence of epidermal hairs, there was a significant decrease in cuticle thickness with increased altitude in the LA and MA areas. However, no significant difference was detected between the MA and HA areas (Figure 3D). These findings indicate that the variation in cuticle thickness was not significantly correlated with epidermal hair structure, and plant species in the Tuha Basin exhibited a decreasing trend in cuticle thickness with the increased altitude.

3.5. Stomatal Morphology in Various Plant Species from Different Altitudes of the Tuha Basin

Under UV-B radiation, UVR8, the UV-B receptor, interacts with COP1 to stabilize the HY5 protein, thereby participating in the regulation of stomatal development [50]. Based on this, we investigated the changes in stomatal morphology in Tuha plants from different altitude regions. The results revealed that as altitude increased, the length, width, and area of stomata were significantly increased (Figure 4A,B,D). Compared with the LA plants, the length, width, and area of stomata were increased by 14.08%, 9.17%, and 28.58% in the MA plants, respectively, and by 20.97%, 17.10%, and 43.95% in the HA plants, respectively (Figure 4A,B,D). This suggests that stomatal size and area were increased with elevated altitude and UV-B intensity. However, the length-to-width ratio of stomata did not follow the same trend, and it was significantly greater in the MA plants than that in the LA and HA plants (Figure 4C). The stomatal density exhibited an opposite trend (Figure 4E). Compared with the LA plants, the stomatal density was decreased by 42.54% in the MA plants and by 27.41% in the HA plants (Figure 4E). Similarly, the stomatal specific leaf area (SLA) in the MA plants was decreased by 34.94% compared with that in the LA plants and by 13.83% in the HA plants (Figure 4F).
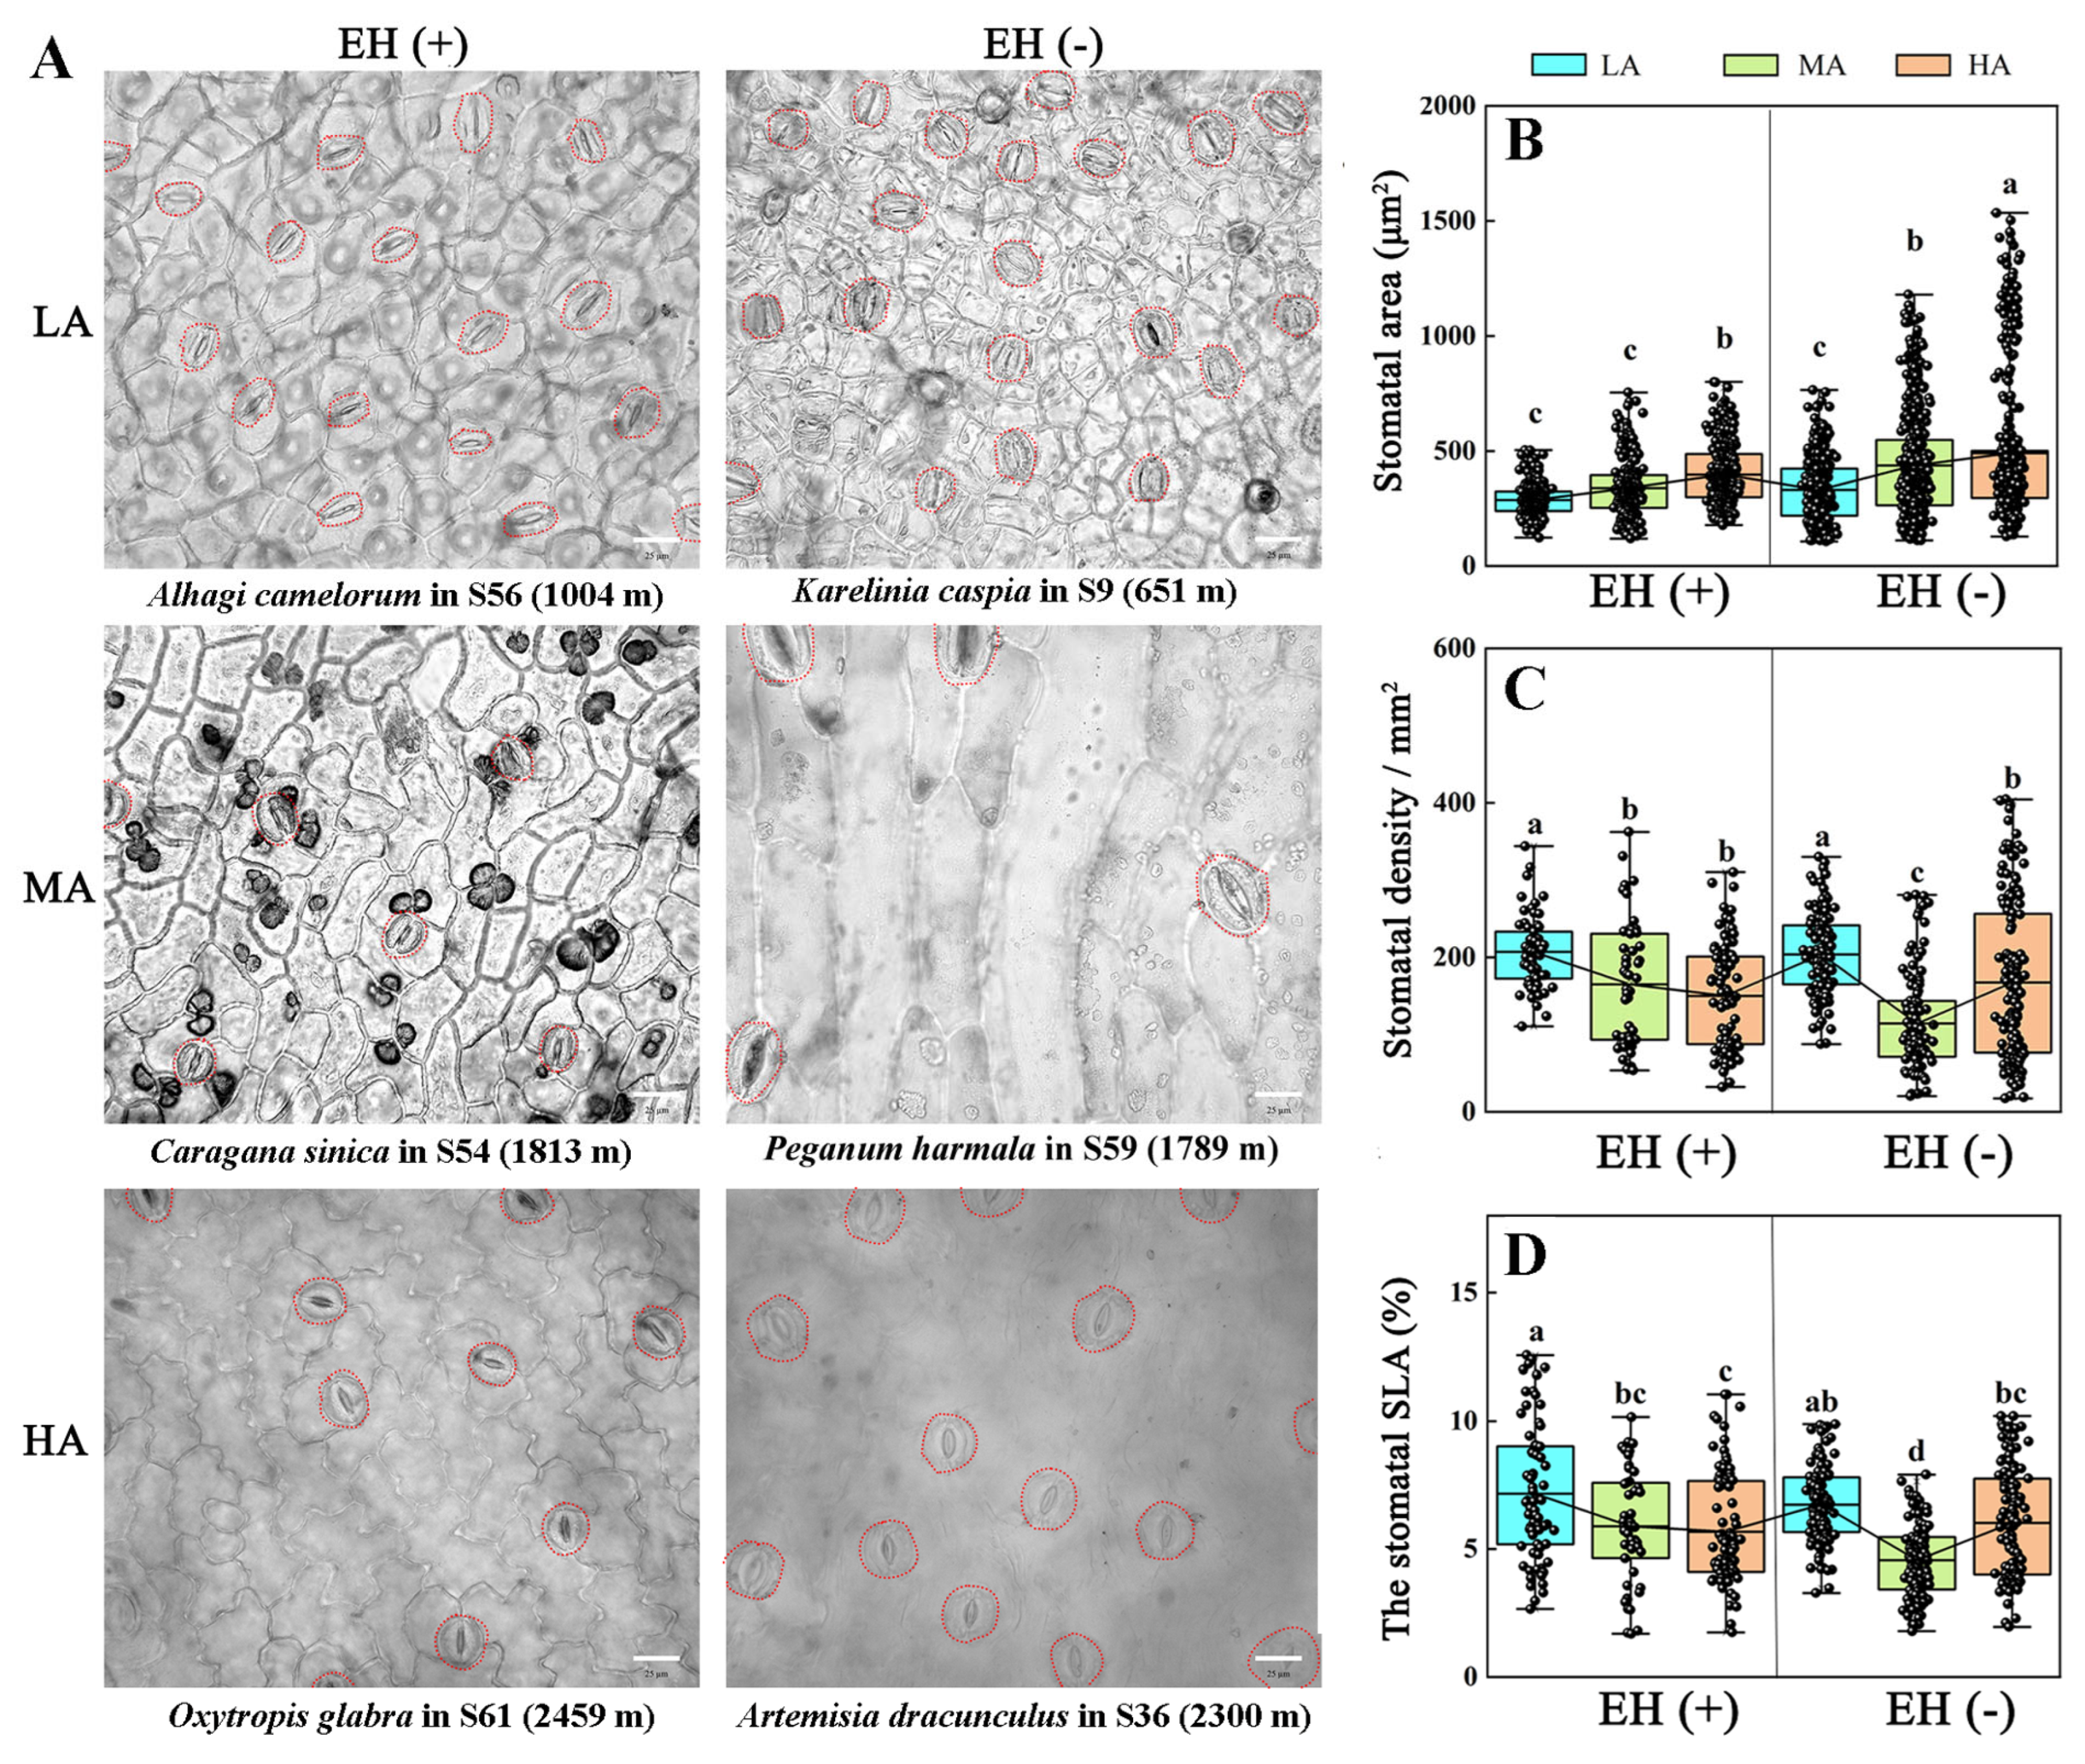
The influence of epidermal hairs on stomatal morphology of Tuha plants at different altitudes was further analyzed. The results showed that, in the LA regions, the presence or absence of epidermal hairs had no significant effect on stomatal area (Figure 5A,B), stomatal density (Figure 5A,C), or stomatal SLA (Figure 5A,D). However, in the MA regions, Tuha plants without epidermal hairs had significantly larger area of stomatal apparatus (26.39%), lower stomatal density (30.72%) and SLA (44.21%) compared with Tuha plants with epidermal hairs (Figure 5). In the HA regions, Tuha plants without epidermal hairs had significantly larger area of stomatal apparatus (19.67%) compared with Tuha plants with epidermal hairs (Figure 5A,B). However, there were no significant differences in stomatal density or SLA (Figure 5A,C,D). These results indicated that increase in altitude induces stomatal enlargement and enhances stomatal density and SLA. Additionally, in the middle- and high-altitude regions, Tuha plants without epidermal hairs tended to develop larger stomata compared to Tuha plants with epidermal hairs, but with a reduction in the stomatal density and SLA. The increased stomatal area, along with decreased density and SLA at higher altitudes, may contribute to reduced transpiration rate of plants.

3.6. Difference in ROS Contents in PLANT Species from Different Altitudes of the Tuha Basin

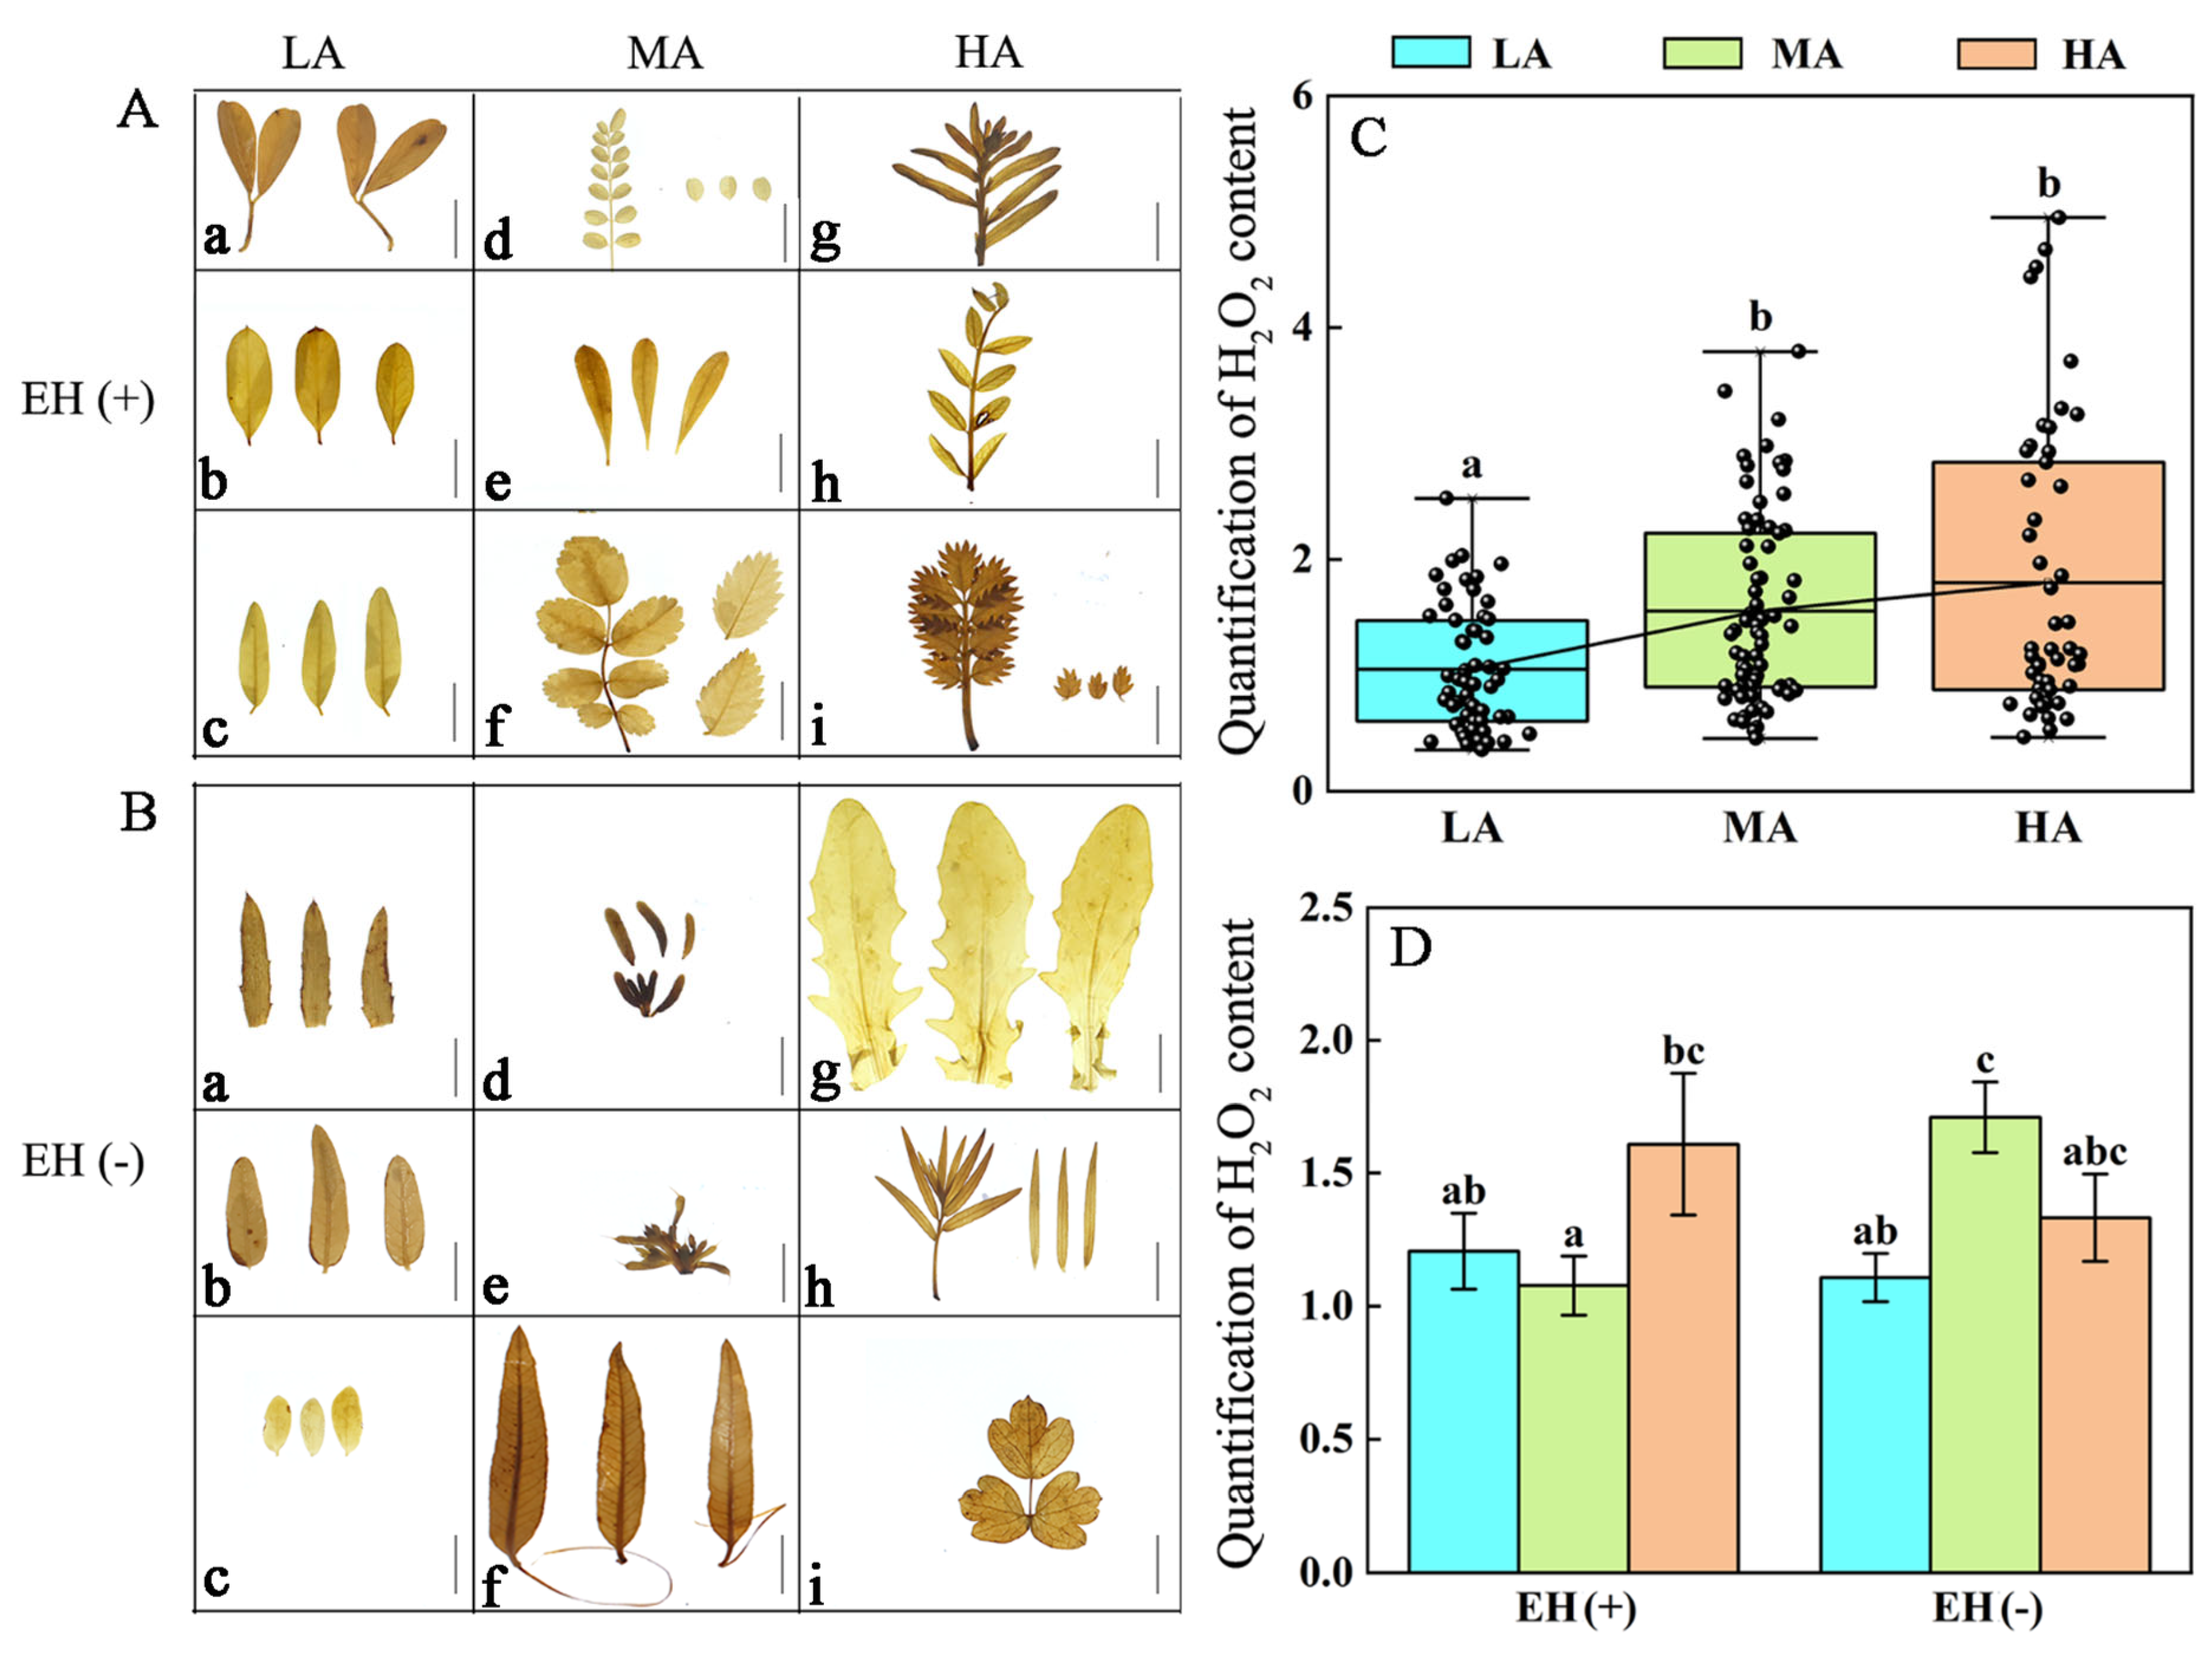
UV-B radiation can induce ROS production, thereby activating the plant antioxidant system; meanwhile, changes in ROS levels can influence gene expressions and subsequently regulate metabolism and metabolite levels in plants to adapt to UV-B stress [51]. Therefore, we investigated changes in ROS (H2O2 and O2) contents in Tuha plants under different altitudes. Results of the H2O2 content showed that leaves of LA plants contained the lowest H2O2 levels compared with middle- and high-altitude plants. The H2O2 content in leaves of LA plants was significantly decreased by 32.28% compared with that in MA plants and by 70.65% compared with that in HA plants (Figure 6A–C). The effect of epidermal hairs on H2O2 levels of the Tuha plants at different altitudes was further analyzed. In low-, middle- and high-altitude areas, regardless of presence of epidermal hairs, there were no significant differences in the H2O2 content (Figure 6D).
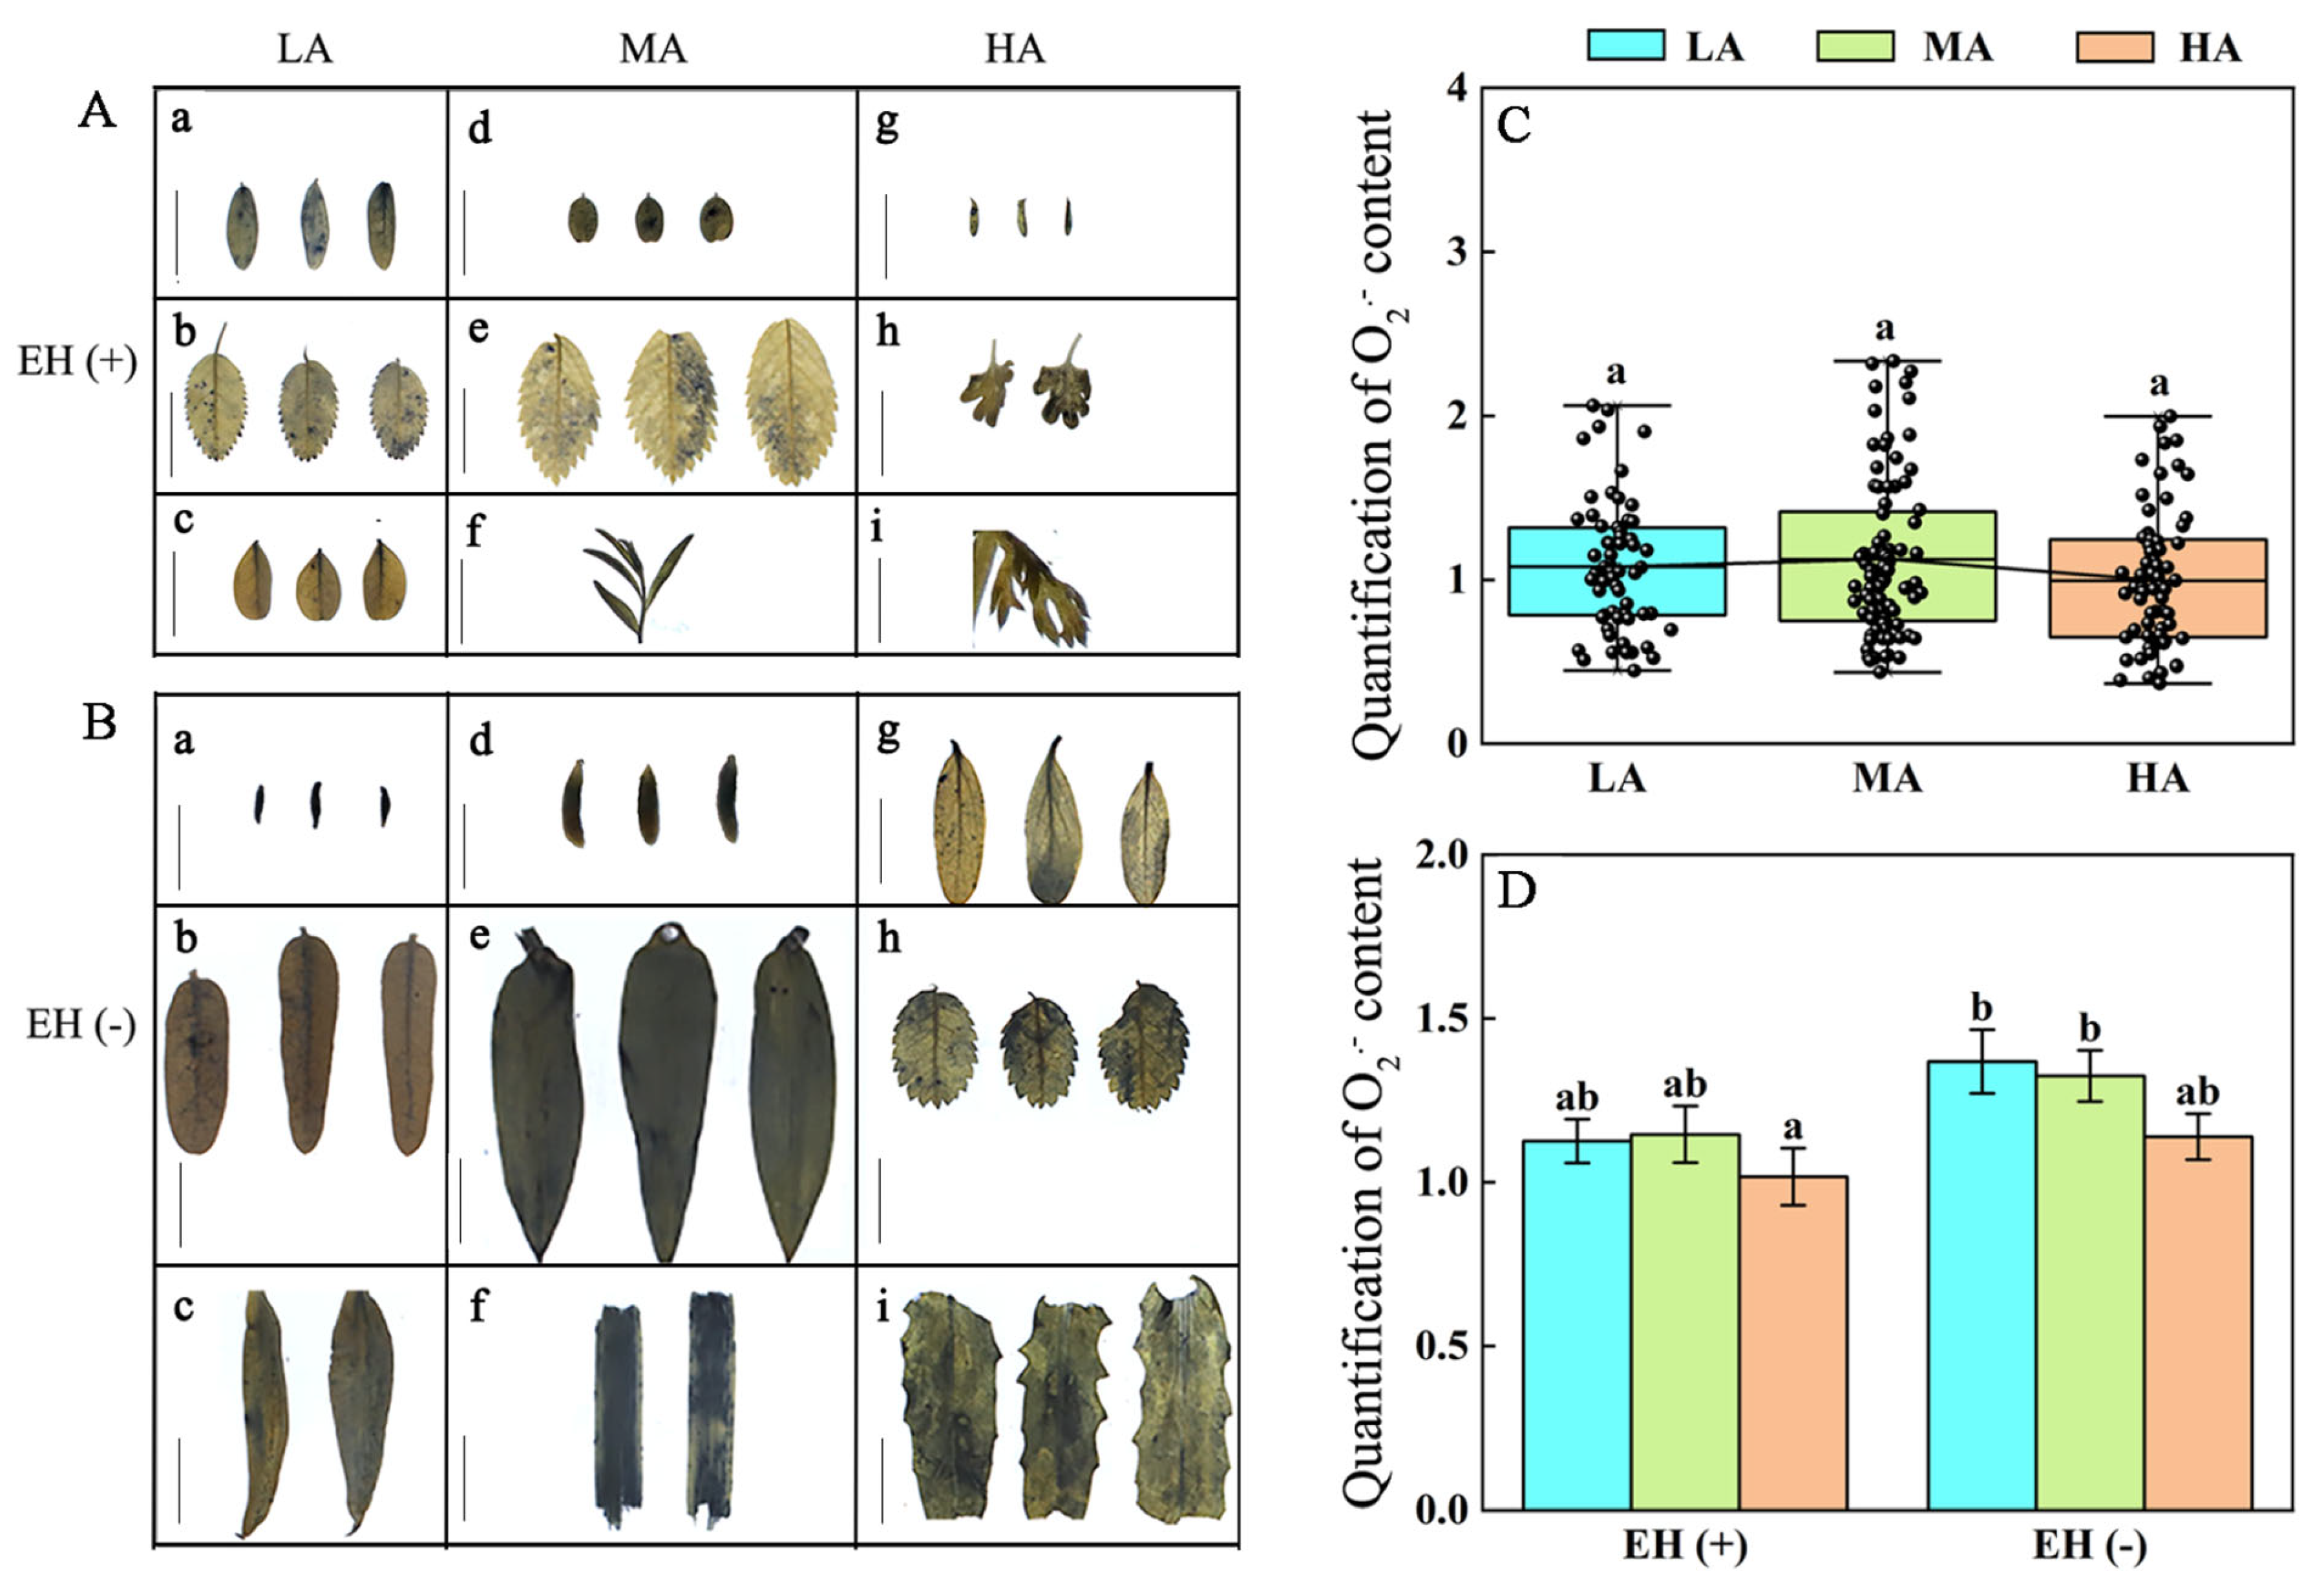
There were no significant variations in the O2 levels in leaves across low-, middle-, and high-altitude regions (Figure 7A–C). Plants with or without epidermal hairs exhibited no significant differences in the O2 content under different altitudes (Figure 7D). These findings demonstrate that H2O2 was significantly induced with increased altitude and UV-B radiation intensity in leaves of plants in the Tuha Basin, whereas O2 accumulation showed no significant correlation with the altitude.

3.7. Changes in C, N, H, and S Contents in Leaves of Plants from Different Altitudes

The organic element composition in plants reflects resource allocation strategies and responses to environmental changes [52,53,54]. Therefore, we analyzed the contents of four macroelements, i.e., C, N, H, and S in leaves of plants from different altitudes in the Tuha Basin and their variation trends with increased altitudes. The results showed that there were no significant changes in C, N, or H contents from low- to middle-altitude regions. However, from middle- to high-altitude regions, their contents increased significantly by 11.95%, 48.53%, and 8.41%, respectively (Figure 8A–C). In contrast, the S content was the highest in LA plants. Compared with LA plants, the S contents in MA and HA plants were significantly reduced by 50.15% and 80.66%, respectively (Figure 8D).
We further investigated the variation patterns of C/N and C/H ratios in plant leaves from different altitudes. The results showed that the C/N ratio remained stable from low- to middle-altitude regions but decreased significantly by 18.92% under high-altitude regions (Figure 8E). The C/H ratio was significantly reduced by 4.21% from low- to middle-altitude regions; and there was no significant difference from middle- and high-altitude regions (Figure 8F). These results indicate that the contents and the ratios of organic elements in plant leaves undergo significant changes with increased altitudes, which may reflect the responsive mechanism in Tuha pants adaptation to the strong UV-B radiation and high-altitude environments.

4. Discussion

As typical sessile organisms, plants have developed complex responsive mechanisms during the long-term evolution to cope with dynamic environmental conditions [55]. Among these, UV-B radiation, one of the key stress factors in the high-altitude regions, can significantly affect plant growth and development by inducing photic damages of DNA, membrane lipid peroxidation, and photosystem inactivation [11,14]. Compared with inland areas in China, the Tuha Basin has longer solar radiation and higher UV-B intensity, especially in mountainous, desert, and Gobi regions [54]. During the long-term evolutionary adaptation, plants in the Tuha Basin have developed a serious of UV-B tolerance mechanisms, forming unique UV-tolerant plant communities. To elucidate the altitude-dependent UV-B adaptation strategies, the UV-B adaptation mechanism of 78 plant species was systematically analyzed through detecting the physiological and morphological indicators under different altitudes in the Tuha Basin, i.e., the levels of UV-B absorbing substances (Fla, Ant), photosynthetic pigments (Chl a, Chl b, Car) and ROS (H2O2, O2), the changes in morphological indicators (epidermal hairs, cuticle, stomata), and organic element (C, N, H, S) contents. We have established a comprehensive evaluation system for UV-B tolerance of plants in the Tuha Basin and evaluated their UV-B tolerance ability. This study aims to systematically reveal the longitudinal adaptation strategies and mechanisms in plant adaptation to changes in altitude and UV-B radiation through investigating and comparing the differences in the microstructure and physiological and biochemical responses of plants at different altitudes in the Tuha Basin.

4.1. Plants Adapt to the Altitude-Dependent UV-B Radiation Through Differentially Regulating the Levels of Photo-Protective and UV-B Absorbing Substances in the Tuha Basin

Plant survival under UV-B radiation is achieved through comprehensive mechanisms of exposure limitation, protection, and repair [5]. Phenylpropanoid compounds, serving as “UV-B absorbing sunscreens”, include Fla and polyphenols [20]. They accumulated in the epidermal cells to protect plants from UV-B damage [56,57]. Meanwhile, Ants and Car function as natural antioxidants that play a crucial role in scavenging free radicals and protecting plant tissues from excessive UV-B radiation [19,21,58]. The H2O2 contents in leaves of various plant species were significantly increased with increased altitude in the Tuha Basin (Figure 6C); whereas the O2 content exhibited no significant changes (Figure 7C). These results suggest that high altitudes in the Tuha Basin may cause strong environmental stresses such as enhanced UV-B radiation, low temperature, and hypoxia, which further induce high ROS levels. As a core member of ROS, H2O2 can cause oxidative damage and disrupt cellular structures [59], while also functions as a signaling molecule involved in plant defensive responses [60]. Thus, the changing H2O2 level could be one of the essential mechanisms in plant adaptation to high altitude and UV-B radiation in the Tuha Basin.
A total of 78 plant species were investigated in different altitude areas of the Tuha Basin, belonging to 19 families and 42 genera (Tables S1 and S2). The intensity of UV-B radiation is significantly positively correlated with altitudes. Among various plant species in the Tuha Basin, the Fla content was highest in LA plants and lowest in MA plants; comparatively, Ant was highest in HA plants (Figure 1A,B and Table S3). Meanwhile, the contents of Car and Chl (Chl a, Chl b, Chl t) were significantly accumulated with increased altitude in various plant species in the Tuha Basin (Figure 1C–F and Table S3). PCA results further showed that the chlorophyll content (Chl a, Chl b, Chl t), Chl a/Chl b ratio, and the Fla content in low-, middle-, and high-altitude regions of the Tuha Basin cover the majority of information on eight physiological indicators and are important indicators for evaluating UV-B tolerance of plants. Noticeably, with the increased altitude, Chl b, Chl a/Chl b, and Fla play increasingly important roles.
Noticeably, plants in LA regions primarily rely on accumulating Fla and Ant to absorb UV-B radiation (Figure 1A,B and Table S3). The dominant species include Sophora alopecuroides, Phragmites australis, Populus euphratica, Apocynum venetum, Tamarix chinensis, and Capparis spinosa (Table 2). In MA regions, the Fla content in leaves decreased significantly, while Car and Chl contents increased (Figure 1 and Table S3). Car can markedly scavenge free radicals and reduce photo-oxidative damage. The high Chl levels can maintain the photosynthetic performance. Dominant species mainly include Phragmites australis, Pennisetum alopecuroides, Carex ovatispioulata, Oxytropis glabra, Caragana sinica, Kali collinum, Sophora alopecuroides, Lepidium latifolium, Krascheninnikovia ceratoides, Takhtajaniantha austriaca, and Apocynum pictum Schrenk (Table 2). In HA regions, Fla, Ant, and Chl contents in leaves further increased (Figure 1 and Table S3). Dominant species include Oxytropis glabra, Potentilla chinensis, Neotrinia splendens, Medicago sativa, Agropyron cristatum, Chenopodium album, Astragalus scaberrimus, Iris tectorum, Oxytropis aciphylla, and Echinops sphaerocephalus.
Based on these results, we propose that in LA regions, plants mainly accumulate Fla to absorb UV-B radiation, thereby protecting photosynthetic performance and reducing UV-B damage; and Ant may also participate in this process. In MA regions, Car and Chl play an essential role in scavenging UV-B-induced free radicals and reducing photooxidative damage. The elevated chloroplast pigment content facilitates to maintain plant photomorphogenesis and developmental status. In HA regions, further accumulation of Fla, Ant, and chloroplast pigments indicate that plants require high levels of UV-B absorbing compounds/free radical scavengers and photosynthetic pigment levels to maintain their photosynthetic performance and normal development processes. Significantly, the highest content of Fla in LA plants but Chl and Ant in HA plants indicate that the changes in the contents of photo-protective and UV-B absorbing substances induced by altitude-dependent UV-B radiation may be determined by species and comprehensive environmental factors.

4.2. The Epidermal Structure and Stomatal Characteristics Coordinately Regulate Plants in Adaptation to the High-Altitude Environments in the Tuha Basin

Epidermal hairs may play important roles in protecting plants from environmental stresses such as heat, low temperature, high UV-B radiation, and insect herbivory [61,62]. The cuticle also plays key roles in drought stress, pathogen resistance, and limiting the cuticle-dependent water loss from leaf surface [63,64]. However, the epidermal hair density in plant leaves of the Tuha Basin decreases with increased altitudes (Figure 2I and Table S4). Moreover, for the same species, the number of epidermal hairs significantly decreases with increased altitudes, for example, Oxytropis glabra, Alhagi sparsifolia, and Ephedra sinica (Figure 2A–H,J). The cuticle thickness also shows a similar trend, and this change is independent of epidermal hair number at the same altitude (Figure 3B,C). Meanwhile, in low-, middle- and high-altitude regions, epidermal hair density does not significantly affect H2O2 and O2 levels in plant leaves (Figure 6 and Figure 7). Due to high consumption of carbon skeletons in the synthesis of wax layers and epidermal hairs, plants in the high-altitude environment of the Tuha Basin tend to prioritize the allocation of limited resources to secondary metabolites rather than structural defense, as evidenced by higher Chl and Ant contents (Figure 1A–F).
UV-B can be perceived by the UV-B photoreceptor UVR8 in plant epidermis, which further triggers UV-B signaling and induces stomatal closure [65]. Thus, the regulation of stomatal characteristics also plays a significant role in plant adaptation to UV-B stress. Our results showed that as altitude increased, the length, width, and area of stomata were significantly increased (Figure 4A,B,D). The enlargement of stomatal aperture helps maintain the diffusion efficiency of O2 and CO2, to meet the needs of photosynthetic C assimilation and respiratory rate in HA environments. However, the stomatal density exhibited an opposite trend (Figure 4E); and the stomatal length-to-width ratio and SLA were the lowest in MA plants compared with LA and HA plants (Figure 4C). These results indicated that the increase in altitude will induce stomatal enlargement and enhancethe stomatal density and SLA. Plants might reduce the damage induced by a combination of UV-B radiation and high-altitude factors through reducing the stomatal density and SLA to compensate for the changes in epidermal structures in HA environments.
In LA regions, the presence or absence of epidermal hairs had no significant effect on stomatal area, stomatal density, or SLA (Figure 5). However, in MA and HA regions, plants without epidermal hairs had significantly larger areas of stomatal apparatus compared with plants with epidermal hairs (Figure 5B). The decrease in stomatal density or SLA is not related to the epidermal hair number in HA regions (Figure 5C,D). These results indicate that in middle- and high-altitude regions, plants without epidermal hairs tend to develop larger stomata compared to plants with epidermal hairs. The increased stomatal apparatus area, along with decreased density and SLA may contribute to reduced transpiration rate of plants in HA environments.

4.3. Plants in the Tuha Basin Reconfigure Element Allocation to Cope with HA Environments

The content of organic elements (C, N) and the C/N ratio in plants can explain the allocation strategy of photosynthetic compounds towards defensive secondary metabolites, i.e., Fla and Ant, under stress conditions. They also reflect the coordinated mechanisms between the antioxidant system and energy metabolism [4,5]. S, an essential macronutrient for plant growth and development, participates in the biosynthesis of cysteine (Cys) and GSH. Cys can be further converted into GSH, a crucial antioxidant involved in ROS scavenging [65]. The results showed that there are no significant changes in C, N, or H contents in plant leaves from low- to middle-altitude regions (Figure 8A–C). However, from middle- to high-altitude regions, their contents increase significantly. In contrast, S content is the highest in LA plants. The C content is closely related to photosynthetic assimilation efficiency [66]. The N content indicates the balance between protein synthesis (growth) and secondary metabolism (defense, [67,68]). These results indicate that plants in the Tuha Basin may synergistically regulate the balance between defense metabolism and growth by optimizing element ratios in their adaptation to different altitudes. Meanwhile, S is also a component of proteins and glucosinolates. In plants grown at high altitudes, allocation of S in different metabolic pathways may shift towards the priority synthesis of specific sulfur-containing compounds, which are crucial for adapting to environmental stressors such as low temperatures, high UV-B radiation, and limited nutrient availability. The decrease in S content may reflect a re-allocation of S resources toward structural components (i.e., proteins). Such re-allocation can enhance the stability of cellular structures, which is crucial for plants to withstand changing environmental conditions across different altitudes in the Tuha Basin.
The balance of C/N metabolism is important for plant growth, development, and the adaptation to the variable environments [69,70]. Our results showed that the C/N ratio remains stable from low- to middle-altitude regions but decreases significantly in HA regions (Figure 8E). A low C/N ratio in plants from HA regions indicates that N might be preferentially allocated to N-containing defensive compounds (such as alkaloids) or key enzymes (i.e., PAL, CHS) to balance growth and stress tolerance [71]. Comparatively, the C/H ratio is significantly reduced from low- to middle-altitude regions; but there is no significant difference between middle- and high-altitudes (Figure 8F). These results indicate that the contents and the ratios of organic elements in plant leaves undergo significant changes with increased altitude, which may reflect the responsive mechanism in the adaptation of Tuha plants to high UV-B radiation and high-altitude conditions. It is well known that a high N metabolism rate is beneficial for reducing photooxidative damage and maintaining optimal photosynthetic performance [43,72]. The significant decrease in C/N ratio in high-altitude areas indicates a shift in plant metabolic patterns. The synergistic regulation of C and N metabolic homeostasis should be an effective strategy for plants to adapt to high-altitude environments in Tuha basin.

5. Conclusions

Overall, the contents of Chl t, Chl a, Chl b, and Fla, as well as Chl a/Chl b, are important indicators for evaluating plant tolerance to UV-B at different altitudes of the Tuha Basin. Moreover, with increased altitudes, the roles of Chl b, Chl a/Chl b, and Fla become markedly significant. The epidermal hair density and cuticle thickness in plant leaves decrease with increased altitudes in the Tuha basin; comparatively, H2O2 is significantly accumulated, but O2 content remains unchanged. High altitude significantly increases stomatal apparatus area, density, and SLA. Plants without epidermal hairs have a larger stomatal apparatus area compared with plants with epidermal hairs in both middle- and high-altitude regions. However, the presence or absence of epidermal hairs has no effect on cuticle thickness, H2O2 and O2 levels. The C, N, and H contents are the highest in plant leaves at high altitudes, but the S content and the C/N ratio are the lowest. Taken together, plants can cope with UV-B radiation by synergistically regulating epidermal structures (epidermal hairs, cuticle, and stomatal characteristics), synthesis of secondary metabolites (chloroplast pigments and Fla), and allocation and reconstruction of organic elements (C, N, S) under different altitudes in the Tuha Basin. Further research should separate the altitude-related factors from other environmental variables by controlling UVB intensity to more accurately clarify the mechanisms and strategies of plant adaptation to the increased UV-B radiation with altitude in Tuha Basin.

Supplementary Materials

The following supporting information can be downloaded at: https://www.mdpi.com/article/10.3390/life15091375/s1, Figure S1: Principal component analysis (PCA) of UV-B tolerance related indices in different plant species at different altitudes in the Tuha Basin; Figure S2: Correlation analysis between D value and fuzzy membership function values; Table S1: The information of samples collected in 2023; Table S2: The information of samples collected in 2024; Table S3: Analysis of UV-B tolerance related indices in different plants at different altitudes; Table S4: Analysis of epidermal hair density of plants at different altitudes; Table S5: Analysis of cuticle thickness in plant leaves at different altitudes in the Tuha Basin.

Author Contributions

W.-L.H., S.-J.X. and X.-M.W. conceived the project and designed this work; J.C., W.-L.H. and X.-M.W. searched the material and write the manuscript; G.-Q.Z., F.-Z.J., L.L., Y.-Y.W., P.M. and Y.-H.W. participated in the experiments. All authors have read and agreed to the published version of the manuscript.

Funding

This work was supported by the Third Xinjiang Scientific Expedition Program [2022xjkk1200]; the Open Project of State Key Laboratory of Plateau Ecology and Agriculture, Qinghai University [2022-KF-01]; and Innovation driven assistance for engineering projects [GXH20250325-1]; Fundamental Research Funds for the Central Universities [lzujbky-2024-jdzx05].

Institutional Review Board Statement

Not applicable.

Informed Consent Statement

Not applicable.

Data Availability Statement

The original contributions presented in this study are included in the article. Further inquiries can be directed to the corresponding author.

Conflicts of Interest

The authors declare that they have no conflict of interest.

Abbreviations

AntAnthocyanin
CCarbon
CarCarotenoid
ChlChlorophyll
FlaFlavonoid
HAHigh altitude
H2O2Hydrogen oxide
LALow altitude
MAMiddle altitude
NNitrogen
O2Superoxide anion
PCAPrincipal component analysis
ROSReactive oxygen species
SSulfur
TuhaTurpan-Hami
UV-BUltraviolet B

References

  1. Domros, M.; Peng, G.; Zhang, S. The characteristics of the desert climate at Turpan, China. Erdkunde 1992, 119, 217–233. [Google Scholar] [CrossRef]
  2. Zhang, Q.; Yan, M.; Zhang, L.; Shao, W.; Chen, Y.; Dong, Y. Three decades of oasis transition and its driving factors in Turpan–Hami Basin in Xinjiang, China: A complex network approach. Remote Sens. 2024, 16, 465. [Google Scholar] [CrossRef]
  3. Zhang, S.Q.; Pu, Z.C.; Li, J.L. The spatial-temporal variation of sunshine duration in Xinjiang during 1961–2010. Acta Geogr. Sin. 2013, 68, 1481–1492. [Google Scholar]
  4. Kirschner, G.K.; Xiao, T.T.; Blilou, I. Rooting in the desert: A developmental overview on desert plants. Genes 2021, 12, 709. [Google Scholar] [CrossRef] [PubMed]
  5. Chen, Z.; Dong, Y.; Huang, X. Plant responses to UV-B radiation: Signaling, acclimation and stress tolerance. Stress Biol. 2022, 2, 51. [Google Scholar] [CrossRef]
  6. Fu, W.D. The spatiotemporal distribution patterns of infrared and ultraviolet radiation in Xinjiang. Arid Land Geogr. 2000, 23, 116–121. [Google Scholar]
  7. Podolec, R.; Demarsy, E.; Ulm, R. Perception and signaling of ultraviolet-B radiation in plants. Annu Rev. Plant Biol. 2021, 72, 793–822. [Google Scholar] [CrossRef]
  8. Yao, J.W.; Ma, Z.; Ma, Y.Q.; Zhu, Y.; Lei, M.Q.; Hao, C.Y.; Chen, L.Y.; Xu, Z.Q.; Huang, X. Role of melatonin in UV-B signaling pathway and UV-B stress resistance in Arabidopsis thaliana. Plant Cell Environ. 2021, 44, 114–129. [Google Scholar] [CrossRef]
  9. Jansen, M.A.K.; Gaba, V.; Greenberg, B.M. Higher plants and UV-B radiation: Balancing damage, repair and acclimation. Trends Plant Sci. 1998, 3, 131–135. [Google Scholar] [CrossRef]
  10. Christopher, L.G.; Keara, A.F. UV RESISTANCE LOCUS 8 signalling enhances photosynthetic resilience to herbicide-induced damage in Arabidopsis thaliana. New Phytol. 2025, 247, 1763–1776. [Google Scholar]
  11. León-Chan, R.G.; López-Meyer, M.; Osuna-Enciso, T.; Sañudo-Barajas, J.A.; Heredia, J.B.; León-Félix, J. Low temperature and ultraviolet-B radiation affect chlorophyll content and induce the accumulation of UV-B-absorbing and antioxidant compounds in bell pepper (Capsicum annuum) plants. Environ. Exp. Bot. 2017, 139, 143–151. [Google Scholar] [CrossRef]
  12. Sztatelman, O.; Grzyb, J.; Gabrys, H.; Banaś, A.K. The effect of UV-B on Arabidopsis leaves depends on light conditions after treatment. BMC Plant Biol. 2015, 15, 281. [Google Scholar] [CrossRef] [PubMed]
  13. Laakso, K.; Sullivan, J.; Huttunen, S. The effects of UV-B radiation on epidermal anatomy in loblolly pine (Pinus taeda L.) and Scots pine (Pinus sylvestris L.). Plant Cell Environ. 2000, 23, 461–472. [Google Scholar] [CrossRef]
  14. Müller-Xing, R.; Xing, Q. Goodrich J Footprints of the sun: Memory of UV and light stress in plants. Front. Plant Sci. 2014, 5, 474. [Google Scholar]
  15. Britt, A.B. Repair of DNA damage induced by ultraviolet radiation. Plant Physiol. 1995, 108, 891–896. [Google Scholar] [CrossRef]
  16. Li, N.; Teranishi, M.; Yamaguchi, H.; Matsushita, T.; Watahiki, M.K.; Tsuge, T.; Li, S.S.; Hidema, J. UV-B-induced CPD photolyase gene expression is regulated by UVR8-dependent and -independent pathways in Arabidopsis. Plant Cell Physiol. 2015, 56, 2014–2023. [Google Scholar] [CrossRef]
  17. Wada, M.; Kagawa, T.; Sato, Y. Chloroplast movement. Annu. Rev. Plant Biol. 2003, 54, 455–468. [Google Scholar] [CrossRef]
  18. Takahashi, S.; Badger, M.R. Photoprotection in plants: A new light on photosystem II damage. Trends Plant Sci. 2011, 16, 53–60. [Google Scholar] [CrossRef]
  19. Kalidhasan, N.; Bhagavan, N.B.; Kannan, N.D. Ultraviolet B (280-320 nm) enhanced radiation induced changes in secondary metabolites and photosystem-II of medicinal plant Withania somnifera Dunal. Acad. J. 2013, 7, 3112–3120. [Google Scholar]
  20. Tsurunaga, Y.; Takahashi, T.; Katsube, T.; Kudo, A.; Kuramitsu, O.; Ishiwata, M.; Matsumoto, S. Effects of UV-B irradiation on the levels of anthocyanin, rutin and radical scavenging activity of buckwheat sprouts. Food Chem. 2013, 141, 552–556. [Google Scholar] [CrossRef]
  21. Agarwal, S. Increased antioxidant activity in Cassia seedlings under UV-B radiation. Biol. Plantarum 2007, 51, 157–160. [Google Scholar] [CrossRef]
  22. Wang, H.; Gui, M.; Tian, X.; Xin, X.; Wang, T.; Li, J. Effects of UV-B on vitamin C, phenols, flavonoids and their related enzyme activities in mung bean sprouts (Vigna radiata). Int. J. Food Sci. Technol. 2017, 52, 827–833. [Google Scholar] [CrossRef]
  23. Manetas, Y. The importance of being hairy: The adverse effects of hair removal on stem photosynthesis of Verbascum speciosum are due to solar UV-B radiation. New Phytol. 2003, 158, 503–508. [Google Scholar] [CrossRef]
  24. Yeats, H.; Rose, J.K.C. The Formation and Function of Plant Cuticles. Plant Physiol. 2013, 163, 5–20. [Google Scholar] [CrossRef] [PubMed]
  25. Shepherd, T.; Griffiths, D.W. The effects of stress on plant cuticular waxes. New Phytol. 2006, 171, 469–499. [Google Scholar] [CrossRef] [PubMed]
  26. Riederer, M. Biology of the plant cuticle. Ann. Plant Rev. 2007, 23, 1–10. [Google Scholar]
  27. Nawrath, C.; Schreiber, L.; Franke, R.B.; Geldner, N.; Reina-Pinto, J.J.; Kunst, L. Apoplastic diffusion barriers in Arabidopsis. Arab. Book 2013, 11, e0167. [Google Scholar] [CrossRef]
  28. González Moreno, A.; de Cózar, A.; Prieto, P.; Domínguez, E.; Heredia, A. Radiationless mechanism of UV deactivation by cuticle phenolics in plants. Nat. Commun. 2022, 13, 1786. [Google Scholar] [CrossRef]
  29. Zhou, X.; Gong, F.; Cao, K.; Xu, H.; Zhou, X. Calcium signaling regulates the accumulation of phenolic acids in response to UV-B stress in Rhododendron chrysanthum Pall. Plant Cell Rep. 2024, 43, 224. [Google Scholar] [CrossRef]
  30. Jiang, N.; García Navarrete, T.; Lee, Y.S.; Pawlowski, E.G.; Park, S.; Grotewold, E. Flavonoid pathway intermediates implicate UVR8 in functions beyond canonical UV-B signaling. Nat. Commun. 2025, 16, 7810. [Google Scholar] [CrossRef]
  31. Zeng, H.; Li, S.; Wang, K.; Dai, Y.; Sun, L.; Gao, Y.; Yi, S.; Li, J.; Xu, S.; Xie, G.; et al. BvCGT1-mediated differential distribution of flavonoid C-glycosides contributes to plant’s response to UV-B stress. Plant J. 2024, 120, 354–369. [Google Scholar] [CrossRef]
  32. Wen, J.W.; Chen, H.X.; Teng, Y.P.; Zhang, S.X.; Wang, R.L. Variation of leaf stomatal traits in Quercus species along the altitudinal gradient in Taibai Mountain, China. Acta Ecol. Sin. 2018, 38, 6712–6721. [Google Scholar]
  33. Dai, L.; Li, J.; Harmens, H.; Zhang, C. Melatonin enhances drought resistance by regulating leaf stomatal behaviour, root growth and catalase activity in two contrasting rapeseed (Brassica napus L.) genotypes. Plant Physiol. Biochem. 2020, 149, 86–95. [Google Scholar] [CrossRef]
  34. Rasouli, F.; Kiani-Pouya, A.; Li, L.; Zhang, H.; Chen, Z.; Hedrich, R.; Wilson, R.; Shabala, S. Sugar beet (Beta vulgaris) guard cells responses to salinity stress: A Proteomic Analysis. Int. J. Mol. Sci. 2020, 21, 2331. [Google Scholar] [CrossRef] [PubMed]
  35. Wang, R.; Yu, G.; He, N.; Wang, Q.; Xia, F.; Zhao, N.; Xu, Z.; Ge, J. Elevation-related variation in leaf stomatal traits as a function of plant functional type: Evidence from Changbai Mountain, China. PLoS ONE 2014, 9, e115395. [Google Scholar] [CrossRef] [PubMed]
  36. Yang, X.X.; Yang, Y.; Ji, C.J.; Feng, T.; Shi, Y.; Lin, L.; Ma, J.J.; He, J.S. Large-scale patterns of stomatal traits in Tibetan and Mongolian grassland species. Basic Appl. Ecol. 2014, 15, 122–132. [Google Scholar] [CrossRef]
  37. Sun, H.T.; Jiang, S.; Liu, J.M.; Guo, Y.J.; Shen, G.S.; Gu, S. Structure and ecological adaptability of the leaves of three Asteraceae species at different altitudes on the Qinghai-Tibet Plateau. Acta Ecol. Sin. 2016, 36, 1559–1570. [Google Scholar]
  38. Korner, C.; Bannister, P.; Mark, A. Altitudinal variation in stomatal conductance, nitrogen content and leaf anatomy in different plant life forms in New Zealand. Oecologia 1986, 69, 577–588. [Google Scholar] [CrossRef]
  39. Kessler, M.; Siorak, Y.; Wunderlich, M.; Wegner, C. Patterns of morphological leaf traits among pteridophytes along humidity and temperature gradients in the Bolivian Andes. Funct. Plant Biol. 2007, 34, 963–971. [Google Scholar] [CrossRef]
  40. Sartory, D.P.; Grobbelaar, J.U. Extraction of chlorophyll a from freshwater phytoplankton for spectrophotometric analysis. Hydrobiologia 1984, 114, 177–187. [Google Scholar] [CrossRef]
  41. Vandenbussche, F.; Habricot, Y.; Condiff, A.S. HY5 is a point of convergence between cryptochrome and cytokinin signalling path-ways in Arabidopsis thaliana. Plant J. 2007, 49, 428–441. [Google Scholar] [CrossRef]
  42. Tanaka, T.; Tanaka, H.; Machida, C.; Watanabe, M.; Machida, Y. A new method for rapid visualization of defects in leaf cuticle reveals five intrinsic patterns of surface defects in Arabidopsis. Plant J. 2004, 37, 139–146. [Google Scholar] [CrossRef]
  43. Yang, S.; Bai, L.; Guo, H.C.; Miu, Y.S.; Li, J. Morphological Characteristics, Types, and Developmental Process of Leaf Trichomes in Potato (Solanum tuberosum). Acta Agron. Sin. 2025, 51, 1582–1598. [Google Scholar]
  44. Han, C.; Liu, Y.; Shi, W.; Qiao, Y.; Wang, L.; Tian, Y.; Fan, M.; Deng, Z.; Lau, O.S.; De Jaeger, G.; et al. KIN10 promotes stomatal development through stabilization of the SPEECHLESS transcription factor. Nat. Commun. 2020, 11, 4214. [Google Scholar] [CrossRef]
  45. Wang, H.; Hou, J.; Li, Y.; Zhang, Y.; Huang, J.; Liang, W. Nitric oxide-mediated cytosolic glucose-6-phosphate dehydrogenase is involved in aluminum toxicity of soybean under high aluminum concentration. Plant Soil. 2017, 416, 39–52. [Google Scholar] [CrossRef]
  46. Jha, R.K.; Mishra, A. Introgression of SbERD4 gene encodes an early-responsive dehydration-stress protein that confers tolerance against different types of abiotic stresses in transgenic tobacco. Cells 2022, 11, 62. [Google Scholar] [CrossRef]
  47. Zhao, L.Q.; Zhang, F.; Guo, J.k.; Yang, Y.L.; Li, B.B.; Zhang, L.X. Nitric oxide functions as a signal in salt resistance in the calli from two ecotypes of reed. Plant Physiol. 2004, 134, 849–857. [Google Scholar] [CrossRef] [PubMed]
  48. Cao, X.; Jiang, F.; Wang, X.; Zang, Y.; Wu, Z. Comprehensive evaluation and screening for chilling-tolerance in tomato lines at the seedling stage. Euphytica 2015, 205, 569–584. [Google Scholar] [CrossRef]
  49. Long, L.M.; Patel, H.P.; Cory, W.C.; Stapleton, A.E. The maize epicuticular wax layer provides UV protection. Funct. Plant Biol. 2003, 30, 75–81. [Google Scholar] [CrossRef] [PubMed]
  50. Wang, S.; Zhou, Z.; Rahiman, R.; Lee, G.S.Y.; Yeo, Y.K.; Yang, X.; Lau, O.S. Light regulates stomatal development by modulating paracrine signaling from inner tissues. Nat. Commun. 2021, 12, 3403. [Google Scholar] [CrossRef]
  51. Tan, Y.; Duan, Y.; Chi, Q.; Wang, R.; Yin, Y.; Cui, D.; Li, S.; Wang, A.; Ma, R.; Li, B. The Role of Reactive Oxygen Species in Plant Response to Radiation. Int. J. Mol. Sci. 2023, 24, 3346. [Google Scholar] [CrossRef]
  52. Kopriva, S.; Malagoli, M.; Takahashi, H. Sulfur nutrition: Impacts on plant development, metabolism.; and stress responses. J. Exp. Bot. 2019, 70, 4069–4073. [Google Scholar] [CrossRef] [PubMed]
  53. Cheng, X.; Ma, T.; Wang, P.; Liang, Y.; Zhang, J.; Zhang, A.; Chen, Q.; Li, W.; Ge, Q.; Sun, X.; et al. Foliar nitrogen application from veraison to preharvest improved flavonoids, fatty acids and aliphatic volatiles composition in grapes and wines. Food Res. Int. 2020, 137, 109566. [Google Scholar] [CrossRef] [PubMed]
  54. Li, Z.; Jiang, H.; Yan, H.; Jiang, X.; Ma, Y.; Qin, Y. Carbon and nitrogen metabolism under nitrogen variation affects flavonoid accumulation in the leaves of Coreopsis tinctoria. Peer J. 2021, 9, e12152. [Google Scholar] [CrossRef]
  55. Cha, O.K.; Yang, S.; Lee, H. Transcriptomics using the enriched Arabidopsis shoot apex reveals developmental priming genes Involved in plastic plant growth under salt stress conditions. Plants 2022, 11, 2546. [Google Scholar] [CrossRef] [PubMed]
  56. Stracke, R.; Favory, J.J.; Gruber, H.; Bartelniewoehner, L.; Bartels, S.; Binkert, M.; Funk, M.; Weisshaar, B.; Ulm, R. The Arabidopsis bZIP transcription factor HY5 regulates expression of the PFG1/MYB12 gene in response to light and ultraviolet-B radiation. Plant Cell Environ. 2010, 33, 88–103. [Google Scholar]
  57. Tissot, N.; Ulm, R. Cryptochrome-mediated blue-light signalling modulates UVR8 photoreceptor activity and contributes to UV-B tolerance in Arabidopsis. Nat. Commun. 2020, 11, 1323. [Google Scholar] [CrossRef]
  58. Ueda, T.; Nakamura, C. Ultraviolet-defense mechanisms in higher plants. Biotechnol. Biotec. Eq. 2011, 25, 2177–2182. [Google Scholar] [CrossRef]
  59. Noctor, G.; Veljovic-Jovanovic, S.; Driscoll, S.; Novitskaya, L.; Foyer, C.H. Drought and oxidative load in the leaves of C3 plants: A predominant role for photorespiration. Ann. Bot. 2002, 89, 841–850. [Google Scholar] [CrossRef]
  60. Mittler, R.; Zandalinas, S.I.; Fichman, Y.; Van Breusegem, F. Reactive oxygen species signalling in plant stress responses. Nat. Rev. Mol. Cell Bio. 2022, 23, 663–679. [Google Scholar] [CrossRef]
  61. Karaourniotis, G.; Liakopoulos, G.; Nikolopoulos, D.; Bresta, P. Protective and defensive roles of non-glandular trichomes against multiple stresses: Structure–function coordination. J. For. Res. 2020, 31, 1–12. [Google Scholar] [CrossRef]
  62. Schuurink, R.; Tissier, A. Glandular trichomes: Micro-organs with model status? New. Phytol. 2020, 225, 2251–2266. [Google Scholar] [CrossRef] [PubMed]
  63. Schonherr, J. Water permeability of isolated cuticular membranes: The effect of cuticular waxes on diffusion of water. Planta 1976, 131, 159–164. [Google Scholar] [CrossRef]
  64. Seo, P.J.; Park, C.M. Cuticular wax biosynthesis as a way of inducing drought resistance. Plant Signal. Behav. 2011, 6, 1043–1045. [Google Scholar] [CrossRef]
  65. Liu, Y.; Wang, J.; Liu, X.T.; Liao, T.; Ren, H.; Liu, L.; Huang, X. The UV-B photoreceptor UVR8 interacts with the LOX1 enzyme to promote stomatal closure through the LOX-derived oxylipin pathway. Plant Cell 2025, 37, koaf060. [Google Scholar] [CrossRef]
  66. Nolke, G.; Barsoum, M.; Houdelet, M.; Arcalís, E.; Kreuzaler, F.; Fischer, R.; Schillberg, S. The integration of algal carbon concentration mechanism components into tobacco chloroplasts increases photosynthetic efficiency and biomass. Biotechnol. J. 2018, 14, 1800170. [Google Scholar] [CrossRef]
  67. Larbat, R.; Robin, C.; Lillo, C.; Drengstig, T.; Ruoff, P. Modeling the diversion of primary carbon flux into secondary metabolism under variable nitrate and light/dark conditions. J. Theor. Biol. 2016, 402, 144–157. [Google Scholar] [CrossRef]
  68. Liu, M.; Gong, J.; Li, Y.; Li, X.; Yang, B.; Zhang, Z.; Yang, L.; Hou, X. Growth–defense trade-off regulated by hormones in grass plants growing under different grazing intensities. Physiol. Plantarum 2018, 166, 553–569. [Google Scholar] [CrossRef]
  69. Nunes-Nesi, A.; Fernie, A.R.; Stitt, M. Metabolic and signaling aspects underpinning the regulation of plant carbon nitrogen interactions. Mol. Plant 2010, 3, 973–996. [Google Scholar] [CrossRef]
  70. Delgado, E.; Mitchell, R.A.C.; Parry, M.A.; Driscoll, S.P.; Mitchell, V.J.; Lawlor, D.W. Interacting effects of CO2 concentration, temperature and nitrogen supply on the photosynthesis and composition of winter wheat leaves. Plant Cell Environ. 1994, 17, 1205–1213. [Google Scholar] [CrossRef]
  71. Gong, J.; Zhang, Z.; Wang, B.; Shi, J.; Zhang, W.; Dong, Q.; Song, L.; Li, Y.; Liu, Y. N addition rebalances the carbon and nitrogen metabolisms of Leymus chinensis through leaf N investment. Plant Physiol. Biochem. 2022, 185, 221–232. [Google Scholar] [CrossRef]
  72. Sweetlove, L.J.; Lytovchenko, A.; Morgan, M. Mitochondrial uncoupling protein is required for efficient photosynthesis. Proc. Natl. Acad. Sci. USA 2006, 103, 19587–19592. [Google Scholar] [CrossRef] [PubMed]
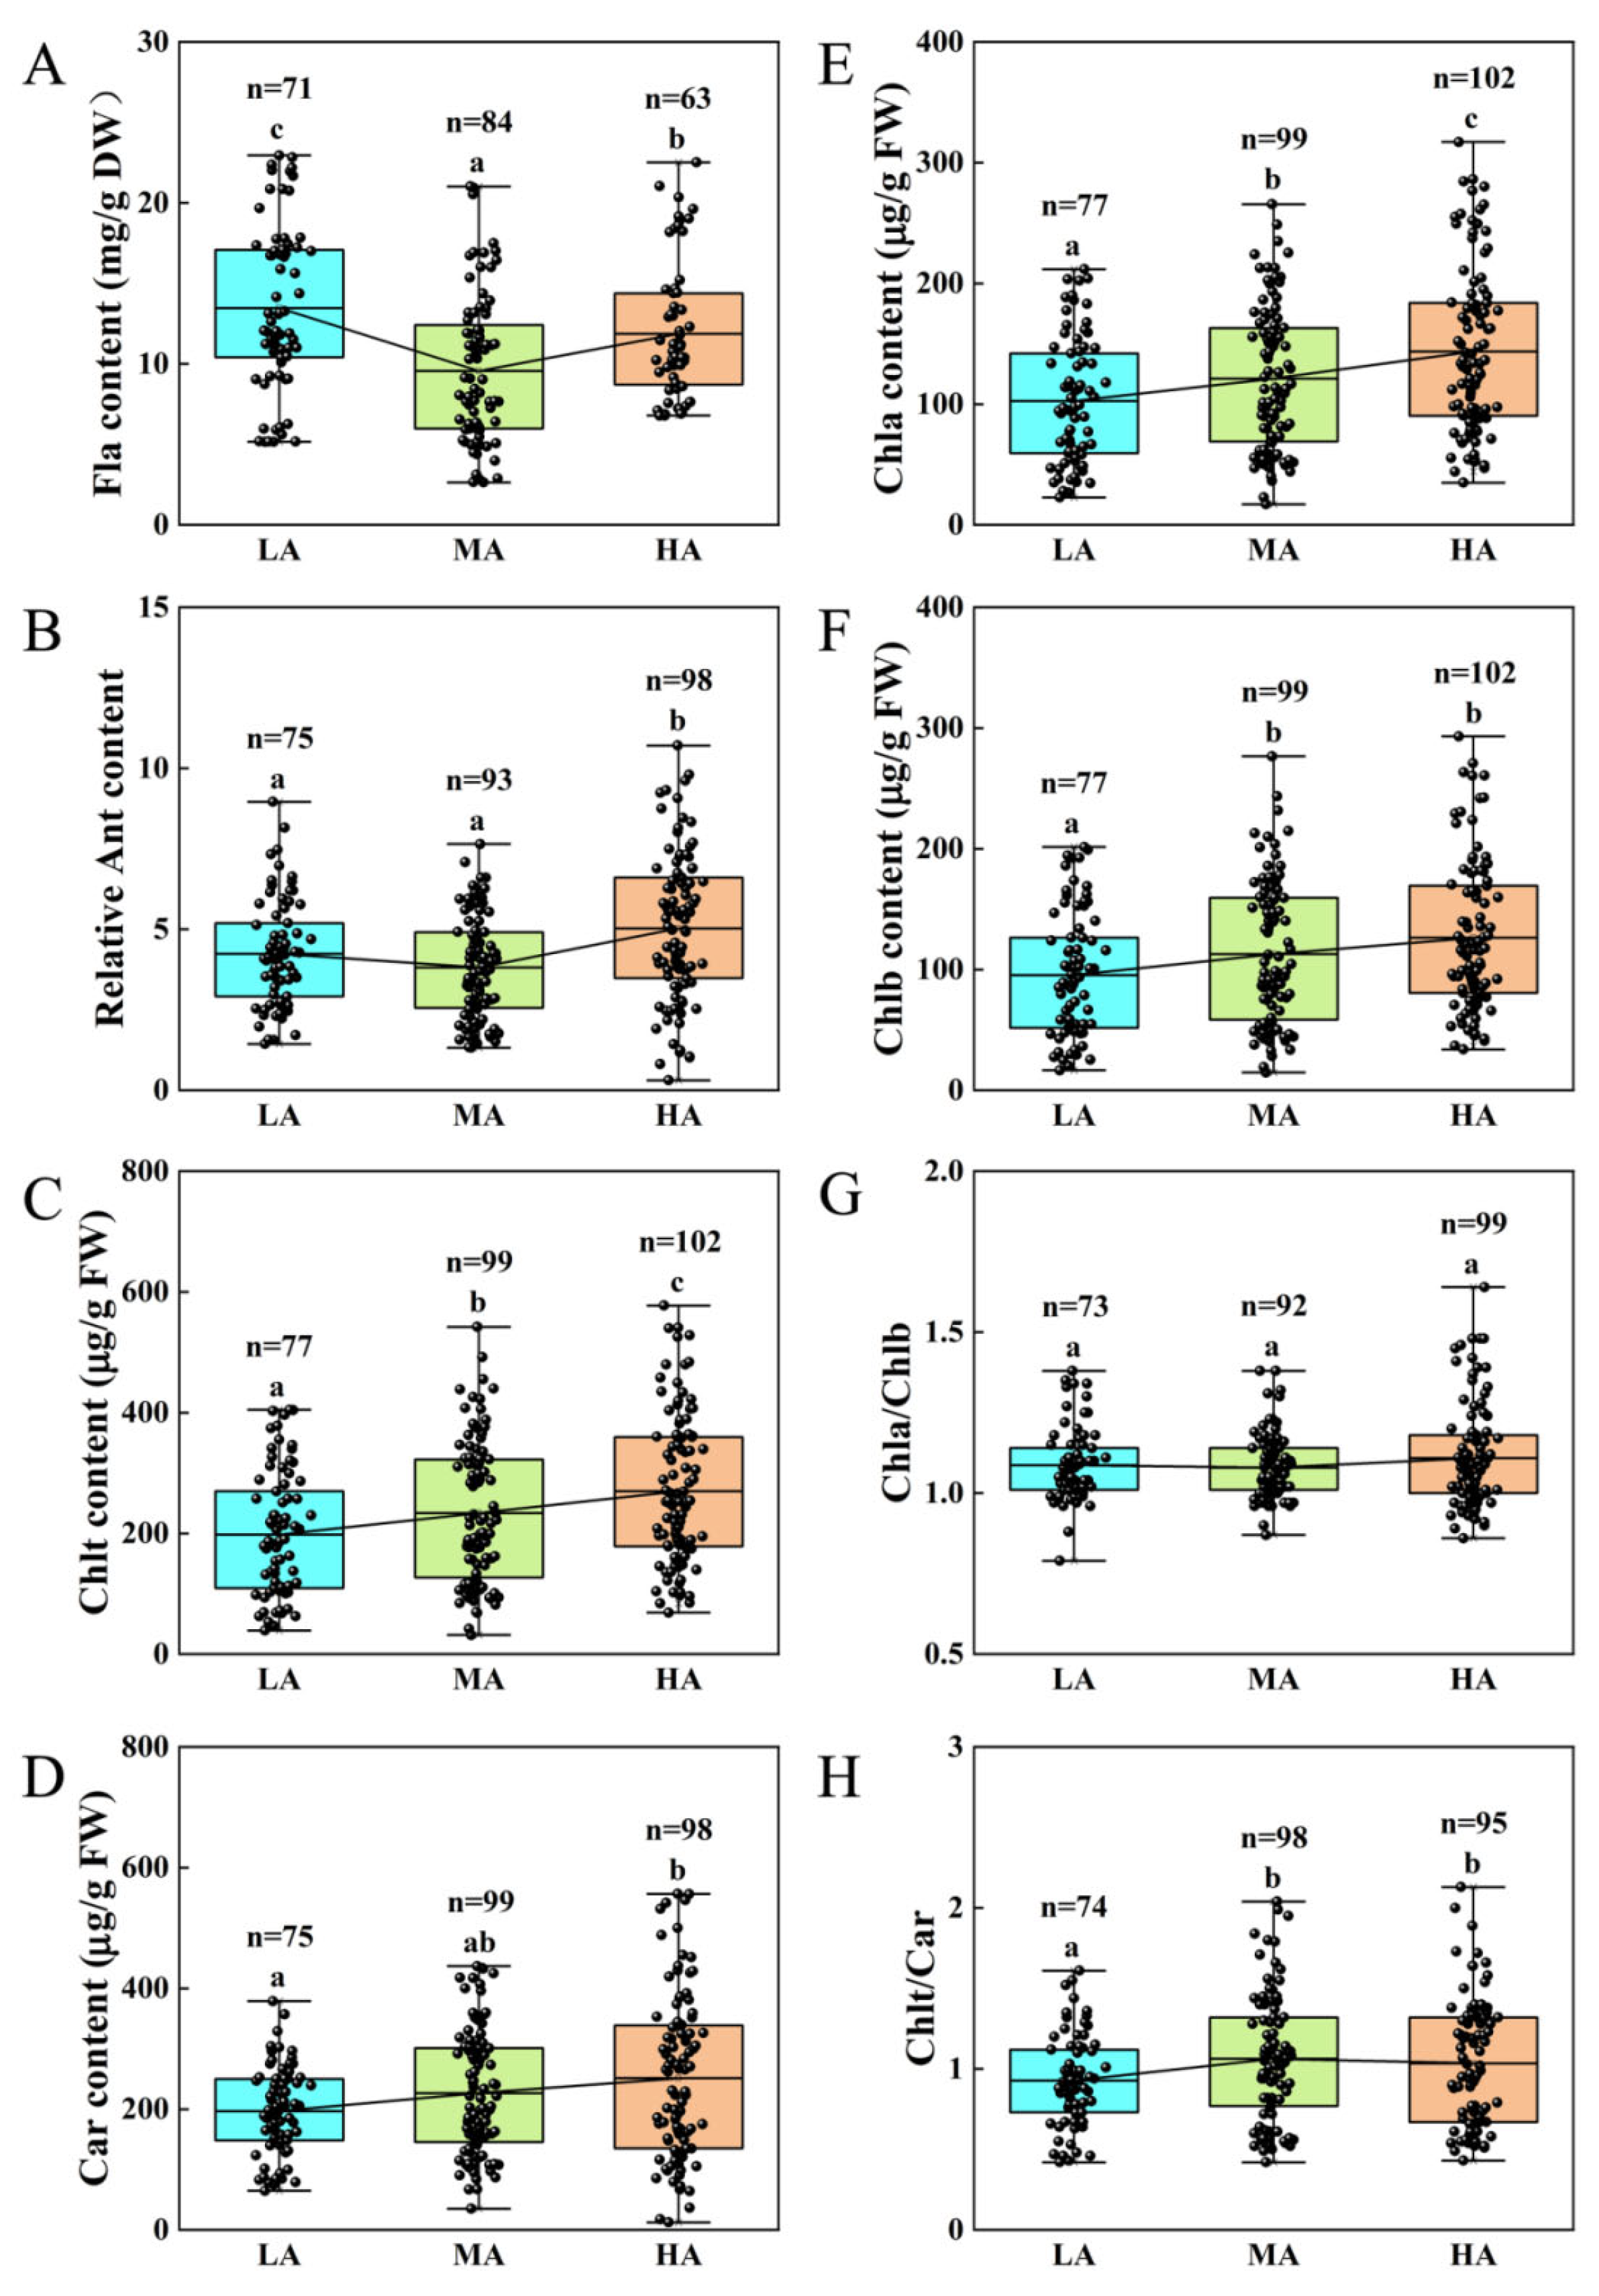
Figure 1. Analysis of chlorophyll pigment and flavonoid (Fla) contents in leaves of plants at different altitudes in the Tuha Basin. (A) Fla; (B) Ant; (C) Chl t; (D) Car; (E) Chl a; (F) Chl b; (G) Chl a/Chl b; (H) Chl t/Car. Different letters on the error bar indicate significant difference at p < 0.05. LA, low altitude; MA, middle altitude; HA, high altitude.
Life 15 01375 g001
Figure 2. Analysis of epidermal hair density in plants at different altitudes in the Tuha Basin. (AF) The morphology of epidermal hair of Oxytropis glabra from S7 (A) and S61 (B); Alhagi camelorum from S7 (C) and S56 (D); Ephedra sinica from S7 (E) and S54 (F). Bar = 200 μm. Quantification of epidermal hair density of Oxytropis glabra (G) in A and B, Alhagi camelorum (H) in C and D, Ephedra sinica (J) in E and F. (I) The variation trend of epidermal hair density at different altitudes. Different letters on the error bar indicate significant difference at p < 0.05. LA, low altitude; MA, middle altitude; HA, high altitude.
Life 15 01375 g002
Figure 3. Analysis of cuticle thickness in plant leaves at different altitudes in the Tuha Basin. (A,B) TB-stained leaves of plants with (A, EH+) or without (B, EH−) epidermal hair at different altitudes. Bar = 1 cm. (C) Quantification of relative cuticle thickness at different altitudes. (D) Quantification of relative cuticle thickness in plants with (EH+) or without (EH−) epidermal hair at different altitudes. In A, a: Alhagi camelorum from S7 (461 m); b: Oxytropis glabra from S9 (651 m); c: Alhagi camelorum from S56 (1004 m); d: Glycyrrhiza uralensis from S58 (1139 m); e: Nitraria sphaerocarpa from S58 (1139 m); f: Sphaerophysa salsula from S58 (1139 m); g: Silene gallica from S60 (2093 m); h: Cirsium arvense from S61 (2459 m); i: Artemisia from S61 (2459 m). In B, a: Karelinia caspia from S9 (651 m); b: Apocynum venetum from S9 (651 m); c: Phragmites australis from S7 (461 m); d: Peganum harmala from S59 (1785 m); e: Ephedra sinica from S43 (1492 m); f: Haloxylon ammodendron from S7 (461 m); g: Artemisia dracunculus from S36 (2300 m); h: Lactuca tatarica from S61 (2459 m); i: Galium spurium from S61 (2459 m). Different letters on the error bar indicate significant difference at p < 0.05. LA, low altitude; MA, middle altitude; HA, high altitude.
Life 15 01375 g003
Figure 4. Analysis of stomatal characteristics in plant leaves at different altitudes in the Tuha Basin. (A) The length of stomata. (B) The width of stomata. (C) The length/width ratio of stomata. (D) The area of stomata. (E) The stomatal density. (F) The stomatal specific leaf area (SLA). Different letters on the error bar indicate significant difference at p < 0.05. LA, low altitude; MA, middle altitude; HA, high altitude.
Life 15 01375 g004
Figure 5. Effects of epidermal hairs on stomatal characteristics in plants at different altitudes in the Tuha Basin. (A) Phenotypes of stomata in plants with (EH+) or without (EH−) epidermal hairs at different altitudes. Bar = 25 µm. (BD) Quantification of the stomatal area (D), stomatal density (C), and stomatal SLA (D) in plants with (EH+) or without (EH−) epidermal hairs at different altitudes. Different letters on the error bar indicate significant difference at p < 0.05. LA, low altitude; MA, middle altitude; HA, high altitude.
Life 15 01375 g005
Figure 6. Analysis of hydrogen peroxide (H2O2) in plant leaves at different altitudes in the Tuha Basin. (A,B) DAB staining of H2O2 in leaves of plants with (A, EH+) or without (B, EH−) epidermal hairs at different altitudes. Bar = 1 cm. (C) Quantification of H2O2 in plant leaves at different altitudes. (D) Quantification of H2O2 in plants with (EH+) or without (EH−) epidermal hairs at different altitudes. In A, a: Caragana halodendron from S7 (461 m); b: Alhagi camelorum from S7 (461 m); c: Sophora alopecuroides from S9 (651 m); d: Sphaerophysa salsula from S58 (1139 m); e: Nitraria sphaerocarpa from S58 (1139 m); f: Rosa laxa from S58 (1139 m); g: Silene gallica from S60 (2093 m); h: Hedysarum from S60 (2093 m); i: Argentina anserina from S61 (2459 m). In B, a: Rhaponticum repens from S7 (461 m); b: Karelinia caspia from S9 (651 m); c: Zygophyllum pterocarpum from S7 (461 m); d: Salsola collina from S54 (1813 m); e: Halogeton glomeratus from S59 (1785 m); f: Apocynum venetum from S58 (1139 m); g: Thlaspi arvense from S60 (2093 m); h: Artemisia dracunculus from S60 (2093 m); i: Thalictrum aquilegiifolium from S60 (2093 m). Different letters on the error bar indicate significant difference at p < 0.05. LA, low altitude; MA, middle altitude; HA, high altitude.
Life 15 01375 g006
Figure 7. Analysis of superoxide anion (O2) in plant leaves at different altitudes in the Tuha Basin. (A,B) NBT staining of O2 content in leaves of plants with (A, EH+) or without (B, EH−) epidermal hairs at different altitudes. Bar = 1 cm. (C) Quantification of O2 in plant leaves under different altitudes. (D) Quantification of H2O2 in plants with (EH+) or without (EH−) epidermal hairs at different altitudes. In A, a: Oxytropis glabra from S9 (651 m); b: Rosa multiflora from S9 (651 m); c: Alhagi camelorum from S56 (1004 m); d: Sphaerophysa salsula from S58 (1139 m); e: Rosa laxa from S58 (1139 m); f: Braya humilis from S59 (1785 m); g: Descurainia Sophia from S60 (2093 m); h: Artemisia frigida from S61 (2459 m); i: Achillea millefolium from S61 (2459 m). In B, a: Lycium ruthenicum from S7 (461 m); b: Karelinia caspia from S9 (651 m); c: Takhtajaniantha austriaca from S9 (651 m); d: Salsola collina from S54 (1813 m); e: Phragmites australis from S58 (1139 m); f: Iris tectorum from S58 (1139 m); g: Polygonum aviculare from S60 (2093 m); h: Rosa laxa from S60 (2093 m); i: Thlaspi arvense from S60 (2093 m). Different letters on the error bar indicate significant difference at p < 0.05. LA, low altitude; MA, middle altitude; HA, high altitude.
Life 15 01375 g007
Figure 8. Analysis of organic elements in plant leaves at different altitudes in the Tuha Basin. (A) Carbon; (B) Nitrogen; (C) Hydrogen; (D) Sulfur; (E) C/N ratio; (F) C/H ratio. Different letters on the error bar indicate significant difference at p < 0.05. LA, low altitude; MA, middle altitude; HA, high altitude.
Life 15 01375 g008
Table 1. Principal component analysis of plant UV-B related traits at different altitudes.
Altitude TypePrincipal ComponentsPC1PC2PC3
Low altitude Fla (n = 71) 0.306 0.227 0.695
Ant (n = 75) 0.357 0.419 0.581
Chl a (n = 77) 0.977 0.116 −0.170
Chl b (n = 77) 0.991 −0.016 −0.116
Car (n = 75) 0.732 0.610 −0.217
Chl a/Chl b (n = 73) 0.483 0.714 −0.348
Chl t/Car (n = 74) 0.696 −0.673 −0.008
Chl t (n = 77) 0.987 0.050 −0.144
Characteristic root (λ) 4.385 1.579 1.052
Contribution rate (%) 54.807 19.732 13.145
Cumulative rate of contribution (%) 54.807 74.540 87.685
Middle altitude Fla (n = 84) −0.486 −0.190 0.744
Ant (n = 93) 0.539 0.260 0.522
Chl a (n = 99) 0.975 0.138 0.025
Chl b (n = 99) 0.985 −0.039 0.030
Car (n = 99) 0.575 0.772 0.005
Chl a/Chl b (n = 92) −0.476 0.828 −0.057
Chl t/Car (n = 98) 0.539 −0.791 −0.057
Chl t (n = 99) 0.985 0.049 0.028
Characteristic root (λ) 4.265 2.034 0.834
Contribution rate (%) 53.314 25.421 10.430
Cumulative rate of contribution (%) 53.314 78.735 89.165
High altitude Fla (n = 63) 0.207 −0.428 0.806
Ant (n = 98) 0.749 −0.160 0.126
Chl a (n = 102) 0.877 0.467 −0.014
Chl b (n = 102) 0.905 −0.110 −0.266
Car (n = 98) 0.749 −0.338 0.177
Chl a/Chl b (n = 99) −0.003 0.929 0.309
Chl t/Car (n = 95) −0.042 0.981 0.147
Chl t (n = 102) 0.946 0.206 −0.142
Characteristic root (λ) 3.651 2.420 0.906
Contribution rate (%) 45.635 30.247 11.321
Cumulative rate of contribution (%) 45.635 75.882 87.203
Table 2. Comprehensive evaluation D value and ranking of different species at different altitudes.
Altitude TypeSpeciesAltitude (m)D ValueThe Resistance to UV
High altitude Oxytropis glabra 2212 0.947 I
Potentilla chinensis 2212 0.933 I
Neotrinia splendens 1907 0.870 II
Medicago sativa 1907 0.859 II
Agropyron cristatum 2212 0.730 II
Chenopodium album 1907 0.670 II
Astragalus scaberrimus 2212 0.597 II
Iris tectorum 2212 0.555 II
Oxytropis aciphylla 2212 0.547 II
Echinops sphaerocephalus 2212 0.501 II
Takhtajaniantha austriaca 2212 0.492 III
Halogeton glomeratus 1907 0.484 III
Glaucium squamigerum 1907 0.460 III
Braya humilis 1907 0.293 IV
Middle altitude Phragmites australis 1144 0.973 I
Pennisetum alopecuroides 1473 0.959 I
Carex ovatispioulata 1473 0.951 I
Oxytropis glabra 1500 0.782 II
Caragana sinica 1500 0.771 II
Kali collinum 1473 0.704 II
Sophora alopecuroides 1144 0.665 II
Lepidium latifolium 1473 0.643 II
Krascheninnikovia ceratoides 1473 0.638 II
Takhtajaniantha austriaca 1473 0.629 II
Apocynum pictum 1144 0.501 II
Sympegma regelii 1473 0.472 III
Krascheninnikovia ceratoides 1500 0.454 III
Braya humilis 1473 0.424 III
Ephedra sinica 1473 0.400 III
Halogeton glomeratus 1473 0.386 III
Peganum harmala 1500 0.364 III
Zygophyllum fabago 1473 0.332 III
Zygophyllum xanthoxylum 1473 0.322 III
Neotrinia splendens 1500 0.279 IV
Anabasis brevifolia 1473 0.253 IV
Lycium ruthenicum 1114 0.224 IV
Anabasis aphylla 1500 0.152 IV
Low altitude Sophora alopecuroides 615 0.913 I
Phragmites australis 461 0.839 II
Populus euphratica 615 0.645 II
Apocynum venetum 510 0.622 II
Tamarix chinensis 510 0.525 II
Capparis spinosa 510 0.503 II
Alhagi camelorum 980 0.467 III
Cynanchum acutum subsp 510 0.368 III
Peganum harmala 980 0.303 III
Lycium ruthenicum 461 0.283 IV
Haloxylon ammodendron 626 0.243 IV
Karelinia caspia 510 0.217 IV
Disclaimer/Publisher’s Note: The statements, opinions and data contained in all publications are solely those of the individual author(s) and contributor(s) and not of MDPI and/or the editor(s). MDPI and/or the editor(s) disclaim responsibility for any injury to people or property resulting from any ideas, methods, instructions or products referred to in the content.