Article

Effects of Endophytic Fungus Setophoma terrestris on Growth of Panax notoginseng and Its Rhizosphere Soil Microorganisms

1
College of Landscape Architecture and Horticulture Sciences, Southwest Forestry University Sciences, Kunming 650224, China
2
Yunnan Key Laboratory of Forest Disaster Warning and Control, Southwest Forestry University, Kunming 650224, China
3
Yunnan Provincial Key Laboratory for Conservation and Utilization of In-forest Resource, Southwest Forestry University, Kunming 650224, China
*
Author to whom correspondence should be addressed.
Life 2025, 15(9), 1353; https://doi.org/10.3390/life15091353
Submission received: 27 July 2025 / Revised: 9 August 2025 / Accepted: 25 August 2025 / Published: 27 August 2025
(This article belongs to the Section Microbiology)

Abstract

To investigate the effects of the endophytic fungus Setophoma terrestris (isolated from Panax notoginseng roots) on the growth and rhizosphere microbiota of understory-cultivated P. notoginseng, we prepared liquid and solid fermentates of the fungus and applied them separately via irrigation. Rhizosphere soil of P. notoginseng was subjected to non-targeted metabolomics and microbiome sequencing for detection and analysis. Relative to the control, P. notoginseng treated with liquid and solid fermentates exhibited increases in plant height (3.5% and 0.7%), chlorophyll content (23.4% and 20.4%), and total saponin content (14.6% and 17.0%), respectively. Non-targeted metabolomics identified 3855 metabolites across 23 classes, with amino acids and their derivatives (21.54%) and benzene derivatives (14.21%) as the primary components. The significantly altered metabolic pathways shared by the two treatment groups included ABC transporters, purine metabolism, and the biosynthesis of various other secondary metabolites. Exogenous addition of S. terrestris significantly affected the composition of the rhizosphere soil microbial community of P. notoginseng and increased the relative abundance of genera such as Bradyrhizobium. In conclusion, the endophytic fungus S. terrestris enhances P. notoginseng growth and modulates both rhizosphere soil metabolites and microbial abundance. This study can provide certain data support for research on endophytic fungi of P. notoginseng.

1. Introduction

Panax notoginseng (Burk.) F. H. Chen, a perennial root herb in the genus Panax (Araliaceae), is a valuable traditional Chinese medicinal plant with therapeutic properties primarily derived from secondary metabolites, including saponins and flavonoids [1,2]. Current P. notoginseng cultivation is plagued by continuous cropping barriers induced by autotoxicity and pathogen accumulation [3], which impair both yield and quality of medicinal materials and restrict large-scale cultivation; notably, endophytic bacterial biofertilizers have been shown to mitigate such obstacles. Endophytic fungi further alleviate these barriers by modifying soil physicochemical properties, enhancing microbial diversity, and suppressing pathogen proliferation via secondary metabolite secretion and nutrient competition [4,5]. Plant endophytic fungi, symbiotic microorganisms colonizing host tissues, are pivotal for host adaptation to environmental stresses, as they modulate plant metabolic networks through secretion of secondary metabolites (e.g., terpenoids, alkaloids) [6,7,8]. Recent studies on P. notoginseng endophytes have yielded notable findings: Liu et al. (2016) isolated 11 endophytes strains from seeds and roots, including one saponin-producing isolate [9]. Huang et al. (2022) identified 17 endophytic bacteria and 45 fungi from across 42 genera from P. notoginseng tissues [10]; and Zhang et al. recovered 22 endophytic actinomycetes (encompassing Streptomyces, Flavihumibacter, Actinomycetospora and Nocardiopsis) from whole plants across two regions using three isolation techniques [11].
Several studies have shown that endophytes exhibit a positive promoting effect on plant growth and development [12]. Huang reported that P. notoginseng endophytes synthesize growth regulators (e.g., indole-3-acetic acid (IAA), gibberellins) to promote host growth [10], while Linfeng et al. [13] isolated the endophytic fungus Phoma medicaginis from Lycium chinense, whose fermentation broth increased leaf number, root length, and stem length in tissue-cultured seedlings to varying degrees. Aspergillus oryzae AVNF4, isolated from the rhizomes of Curcuma longa by Sanneboyina and Audipudi, not only inhibits Fusarium oxysporum (the causal agent of tomato wilt) but also promotes the growth of tomato seedlings by secreting IAA, solubilizing inorganic phosphorus, and producing volatile organic compounds (e.g., 1,3-dioxolane, oleic acid). After treatment with its liquid microbial agent, the germination rate, plant height, and root biomass of tomatoes were significantly increased [14].
The rhizosphere microbial community is a critical driver of plant health, as it inhibits pathogen invasion and proliferation, sustains host fitness, and stabilize the microecosystem [15,16]. Endophyte inoculation directly or indirectly modulates soil microbial community structure, diversity, and functional composition, thereby affecting plant growth [17,18]; for example, the cotton stems endophyte F. equiseti reshapes soil microbial communities, enriches beneficial bacteria taxa, and reduce verticillium wilt incidence in cotton [19]. Endophytic fungi can also affect soil chemical properties. Research has revealed that endophyte inoculation significantly changes soil pH, electrical conductivity (EC), and nutrient availability. Under drought stress, endophytic fungi ameliorate the soil chemical environment via reduced EC, elevated nitrate and ammonium nitrogen contents, and enhanced the release of phosphorus and potassium, thereby boosting sunflower drought tolerance. Endophytic fungi may also regulate soil nutrient cycling via secretion of organic acids and enzymes [20].
Microbial fertilizers produced using plant growth-promoting endophytes can improve the soil environment and promote crop growth through metabolic activities. Within microbial communities, phosphorus-solubilizing, potassium-solubilizing, and nitrogen-fixing bacteria decompose soil-insoluble phosphorus and potassium, fix atmospheric nitrogen, transform recalcitrant nutrients into plant-available forms, promote plant growth, and reduce dependence on chemical fertilizers.
Using healthy P. notoginseng plants as test materials, we isolated and identified culturable endophytic fungi via tissue isolation, then assessed their growth-promoting activity and inhibitory effects against 5 pathogenic fungi, ultimately screening a strain with superior growth-promoting and disease-resistant traits. Two biofertilizer formulations of this strain were prepared, administered to understory vegetative-stage P. notoginseng, and followed by harvesting of plants and rhizosphere soil to assess the strain’s impacts on host growth, rhizosphere metabolites, and soil microorganisms.

2. Materials and Methods

2.1. Test Materials

Test strain: Endophytic fungi were isolated from the roots of P. notoginseng using the tissue isolation method, and screening for growth-promoting functions (such as siderophore production, and IAA production) was conducted. A strain with excellent growth-promoting capabilities was selected for this experiment. It was identified as S. terrestris through molecular biological identification combined with morphological characteristics, and its accession number in the NCBI database is PV992114.
Test plants: Three-year-old understory P. notoginseng plants from an understory planting base of P. notoginseng in Xundian County, Yunnan Province (22°37′20.93″ N).

2.2. Experimental Design

A completely randomized design included three groups: solid fermentate inoculation (SF, 10 g/plant, uniformly applied to 3–4 cm root-zone soil, 10 replicates), fermentation broth (LF, 20 mL/plant, syringe-irrigated at roots, 10 replicates), and clear water treatment (CK, 20 mL/plant via syringe, 10 replicates).
The control group received 20 mL of water via syringe per plant (10 replicates), with all treatments initiated on 10 April 2023, and repeated every 15 days for a total of 6 applications, concluding on 9 June 2023. During non-treatment periods, all P. notoginseng plant sreceived uniform management with adequate irrigation and were harvested along with rhizosphere soil 15 days after the final treatment for the determination of various indicators.

2.3. Strain Fermentation Treatment

2.3.1. Preparation of Fermentates

Liquid fermentation: A 6-mm mycelial disc of S. terrestris was inoculated into Sabouraud Dextrose Agar with Yeast Extract liquid medium, shaken at 121 r/min for 10 days at room temperature, centrifuged to harvest the supernatant, and adjusted to a concentration of 1 × 10⁸ CFU·mL−1 for the fungal suspension. SF: Components for SFs were thoroughly mixed, aliquoted, sterilized, inoculated with cultured seed liquid, and incubated in a constant-temperature incubator until the mycelia fully colonized the tissue culture flask [21].

2.3.2. Sample Collection and Pretreatment

Plants: First, aboveground height of P. notoginseng plants was measured, followed by root system collection with preservation of plant integrity for subsequent analyses.
Soil: Rhizosphere soil adhering to P. notoginseng roots was collected using the shaking-off method, sieved through a 2-mm mesh, and aliquoted into fractions: one stored at −20 °C for immediate root metabolite analysis, another at −20 °C for soil chemical property assessment, and the final fraction at low temperature for subsequent supplementary assays.

2.4. Determination of Plant Biomass

2.4.1. Fresh and Dry Weights

Collected P. notoginseng plants were cleaned to remove dust, air-dried briefly, and then weighed for fresh weight; subsequent drying at 80 °C was followed by dry weight determination.

2.4.2. Determination of Chlorophyll Content

A 0.1-g sample of P. notoginseng leaves was placed in a mortar, and a small amount of quartz sand, calcium carbonate powder, and 1 mL of 80% acetone was added. The mixture was ground to a homogenate in the dark. The homogenate was transferred to a 25-mL brown volumetric flask, with residual homogenate on the mortar and pestle rinsed into the flask using 80% acetone; the mixture was then brought to 25 mL with 80% acetone, vortexed thoroughly, and centrifugation at 8000 rpm for 5 min. The extract was poured into a cuvette, with 80% acetone as the blank for zeroing, and absorbance was measured at 663 nm and 645 nm [22].

2.4.3. Determination of Total Saponins

The main roots of P. notoginseng were dried, ground, and passed through a 100-mesh sieve. A 1-g sample was weighed into an Erlenmeyer flask, supplemented with 50 mL of 80% methanol, vortex-mixed, and subjected to ultrasonic extractor at 60 °C (465 W) for 40 min. A 40-µL aliquot of the sample solution was transferred to a 96-well microplate, evaporated to dryness in an 80 °C constant-temperature water bath, then supplemented with 20 µL of 5% vanillin-glacial acetic acid solution (5 g vanillin dissolved in 100 mL glacial acetic acid) and 80 µL of perchloric acid. The mixture was heated in a 60 °C water bath for 15 min, cooled in an ice bath for 5 min, then supplemented with 40-µL glacial acetic acid to terminate the reaction, and its absorbance was measured at 540 nm [23]. Meanwhile, the absorbance values of P. notoginseng total saponin solutions (0, 50, 100, 150, 200, 250 µg/mL) were determined under identical conditions, and a standard curve (X: concentration; Y: absorbance) was generated to quantify PNLS (P. notoginseng total saponins) content in the samples.

2.5. Determination of Metabolites in Rhizosphere Soil

Panax notoginseng rhizosphere soil samples were stored on dry ice and shipped to Wuhan MetWare Biotechnology Co., Ltd. (Wuhan, China) for LC-MS metabolomics analysis (3 replicates per treatment). Briefly, 250 mg (±1 mg) aliquots were weighed into a 2 mL centrifuge tube, supplemented with 500 μL of pre-cooled (−20 °C) 70% methanol–water internal standard extraction solution, and vortexed for 3 min (steel balls were added for re-vortexing 3 min if samples remained undispersed). After ultrasonic treatment in an ice-water bath for 10 min, the mixture was vortexed for 1 min and then allowed to stand at −20 °C for 30 min. Centrifugation was performed at 12,000 r/min at 4 °C for 10 min, and the supernatant was passed through a 0.22-μm PTFE filter membrane into the liner of a brown sample vial. Equal volumes of supernatant from all samples were mixed to form a quality control (QC) sample before instrumental analysis [24,25].
Chromatographic separation was performed using an ultra-high-performance liquid chromatograph (LC-30A) fitted with a Waters ACQUITY Premier HSS T3 Column. The mobile phase consisted of 0.1% formic acid/water (A) and formic acid/acetonitrile (B), with elution via a defined gradient. The column initial temperature was 40 °C, the flow rate was 4 mL/min, and the injection volume was 4 μL. Mass spectrometry employed a TripleTOF 6600+ for primary and secondary mass spectral data collection, with dynamic exclusion of redundant MS/MS information.
Data processing: After converting raw data to mzXML format, peak detection, alignment, and retention time correction were performed using the XCMS program. Peak areas were corrected using the “SVR” algorithm, and peaks with a detection rate lower than 50% were excluded. Metabolite annotations were retrieved via searches of relevant databases. Principal component analysis (PCA) was performed using Principal Component Analysis (PCA) was performed using the prcomp function in R (version 4.1.2) (with data normalization). Hierarchical cluster analysis (HCA) was conducted using the cor function in R (version 4.1.2) based on the Euclidean distance matrix (Ward.D2 method). Differential metabolites were screened based on VIP > 1 (from PLS-DA) and p < 0.05 (from Student’s t-test).

2.6. Determination of Soil Physicochemical Indicators

2.6.1. Determination of Soil Total Nitrogen (TN) and Total Phosphorus (TP) Contents

Rhizosphere soil of P. notoginseng was air-dried, ground, and passed through a 100-mesh sieve. A 0.5-g sample was weighed into a digestion tube, and 5 mL of H2SO4 was added. The digestion tube was placed in a graphite furnace, heated slowly to 280 °C, held for 5 min, removed to cool, then returned, heated to 370 °C, held for 5 min, and cooled again. The cap was opened, and 10 drops of H2O2 added, and the tube digested at 370 °C for 12 min before removal and cooling. Digestion continued at 370 °C with sequential H2O2 additions (8, 6, 4, 2 drops) until the solution was colorless and transparent. Post-digestion, the mixture was cooled. The digestion tube was rinsed 3 times with deionized water, and the contents were filtered and transferred to a 100-mL volumetric flask for volume adjustment [26]. A sample-free blank control was included. The contents of total nitrogen and total phosphorus were determined using a flow analyzer (SEAL Analypay AA3) and calculated accordingly.

2.6.2. Determination of Total Potassium (TK) Content in Soil

Panax notoginseng rhizosphere soil was air-dried, ground, and sieved through a 100-mesh sieve. A 0.5 g soil sample was weighed into a digestion tube, with a small volume of deionized water rinsing wall-adhered soil particles to the tube bottom. In a fume hood, 6 mL of HCl and 4 mL of HNO3 were added to the tube. After capping tightly, it was placed in a graphite furnace and heated at 105 °C for 60 min. Once cooled to near room temperature, 2 mL of HClO4 and 1 mL of hydrofluoric acid were added. The mixture was heated at 170 °C for 150 min until the acid emitted white fumes and the sample became colorless/viscous, indicating digestion completion. The digested sample was cooled to room temperature, and the digestion tube was rinsed 3× with deionized water, and the rinsate transferred to a 50-mL volumetric flask and brought to volume with deionized water. A blank control (without soil sample) was set simultaneously. The total potassium content was determined using the AA-6300C flame photometer by atomic emission spectrometry [27].

2.6.3. Determination of Soil Nitrate Nitrogen (NO3-N) and Ammonium Nitrogen (NH4+-N) Contents

Panax notoginseng rhizosphere soil was air-dried, ground, and sieved through a 20-mesh sieve. A 10-g aliquot was weighed into a 300-mL Erlenmeyer flask and supplemented with 100 mL of 1 mol/L potassium chloride solution. The mixture was shaken on a shaker for 60 min and then allowed to stand for 30 min. The sample solution was filter-paper filtered, and the filtrate was stored in a 50-mL centrifuge tube. A blank control was set simultaneously. Determination was performed using an automatic continuous flow analyzer (Seal AutoAnalyzer AA3) [27], following the procedure: preparation of standard samples and cleaning solution → instrument startup → program selection → determination of standard sample concentration → determination of sample concentration. Finally, the soil organic matter content was calculated using the formula.

2.6.4. Determination of Soil Organic Matter (SOM) Content

Rhizosphere soil of P. notoginseng was air-dried, ground, and sieved through a 100-mesh screen. A 1-g aliquot was transferred to a 10-mL hard test tube, supplemented with 0.8 mol/L potassium dichromate solution to half-volume, and then brought to the 10-mL mark with concentrated sulfuric acid, capped tightly, and vortexed thoroughly. The test tubes were batch-placed on a test tube rack, heated to boiling (180–195 °C) for 5 min, and then removed and cooled. The entire sample solution was transferred to a 250-mL Erlenmeyer flask, with residual test tube liquid rinsed into the flask using deionized water. Upon reaching ~70 mL, 2–4 drops of o-phenanthroline indicator were added. The solution was titrated with a standard ferrous sulfate solution until it turned brick-red [28]. The volume used (V) was recorded, and the organic carbon content was calculated using the formula.

2.6.5. Determination of Soil pH Value

Soil pH was determined with a pH meter with a soil-to-water mass ratio of 2.5:1 [29]. Each treatment included three replicates. For each replicate, 5 g of fresh P. notoginseng rhizosphere soil was weighed, 25 mL distilled water added, and the mixture shaken for ~5 min on a shaker before standing to allow phases separated. After filtration with filter paper, the pH meter was calibrated with acidic and alkaline standards prior to measurement. Finally, the soil pH value was determined and recorded.

2.7. Determination of Rhizosphere Soil Microbial Diversity

Rhizosphere soil samples of P. notoginseng were stored in dry ice and then shipped to Wuhan MetWare Biotechnology Co., Ltd. for analysis (3 replicates per treatment). DNA was extracted using the OMEGA kit (per manufacturer’s protocol), followed by PCR amplification, product purification, library preparation and quality inspection, and paired-end high-throughput sequencing on the Illumina PE150 platform (NovaSeq) to generate raw data [30].
The sequencing data underwent quality control and assembly to generate Clean Tags, with valid data obtained post-chimera filtering. Denoising valid data yielded Amplicon Sequence Variants (ASVs), which informed species annotation and abundance distribution analysis. Meanwhile, ASV abundance and Alpha diversity were calculated, and Venn diagram analysis clarified the species richness and evenness within samples, as well as the shared and unique ASVs among samples [31]. Shannon index, Simpson index, Chao1 index, and ACE index are important indicators for describing the α-diversity of a community, each with distinct focuses. The Shannon index takes both species richness and evenness into account, with higher values indicating greater community diversity. The Simpson index reflects the dominance of the community; values closer to 1 suggest a more even distribution of species and less prominent dominant species. Both Chao1 and ACE indices are used to estimate the actual species richness of the community. Chao1 is calculated based on the number of rare species that appear 1–2 times, while ACE is more sensitive to rare species that appear ≤10 times. Both indices can correct for species omission caused by insufficient sample size, and their values are generally greater than the number of actually observed species. A larger difference between these values and the observed number indicates a higher possibility of undetected rare species.)
A phylogenetic tree was constructed by multiple sequence alignment of ASVs. Combined with dimensionality reduction analyses (e.g., Principal Coordinates Analysis [PCoA], sample clustering trees), community structure differences among samples or groups were explored. Statistical methods such as T-test assessed the significance of in species composition and community structure among grouped samples.

2.8. Data Analysis

The data were analyzed using statistical software Excel 2016 and SPSS 22.0. One-way ANOVA was applied to assess the statistical significance of differences among samples (p < 0.05), followed by Duncan’s multi-range test for multiple comparisons. Data visualization was performed using Adobe Photoshop 2023, Adobe Illustrator 2020, and GraphPad Prism 9.5.

3. Results and Analysis

3.1. Biomass

3.1.1. Plant Height

Panax notoginseng plant heights in both treatment groups exceeded that in CK: 38.94 cm), with LF and SF groups reaching 45.23 cm and 46.01 cm, respectively (Figure 1a); the rank order was SF > LF > CK.

3.1.2. Fresh and Dry Weights

Fresh and dry weights of P. notoginseng in SF and LF groups exceeded those in CK (Figure 1b,c), with both parameters showing the same rank order: SF > LF > CK.

3.1.3. Chlorophyll Content

Chlorophyll contents in SF and LF groups were significantly higher than in CK (Figure 1d), with the highest level in SF.

3.1.4. Total Saponin Content

Total saponin contents in SF and LF groups were significantly higher than in the control (Figure 1e), with no significant difference between SF and LF.

3.2. Annotation and Evaluation of Metabolites in Panax notoginseng Rhizosphere Soil

3.2.1. Qualitative and Quantitative Analysis of Metabolites

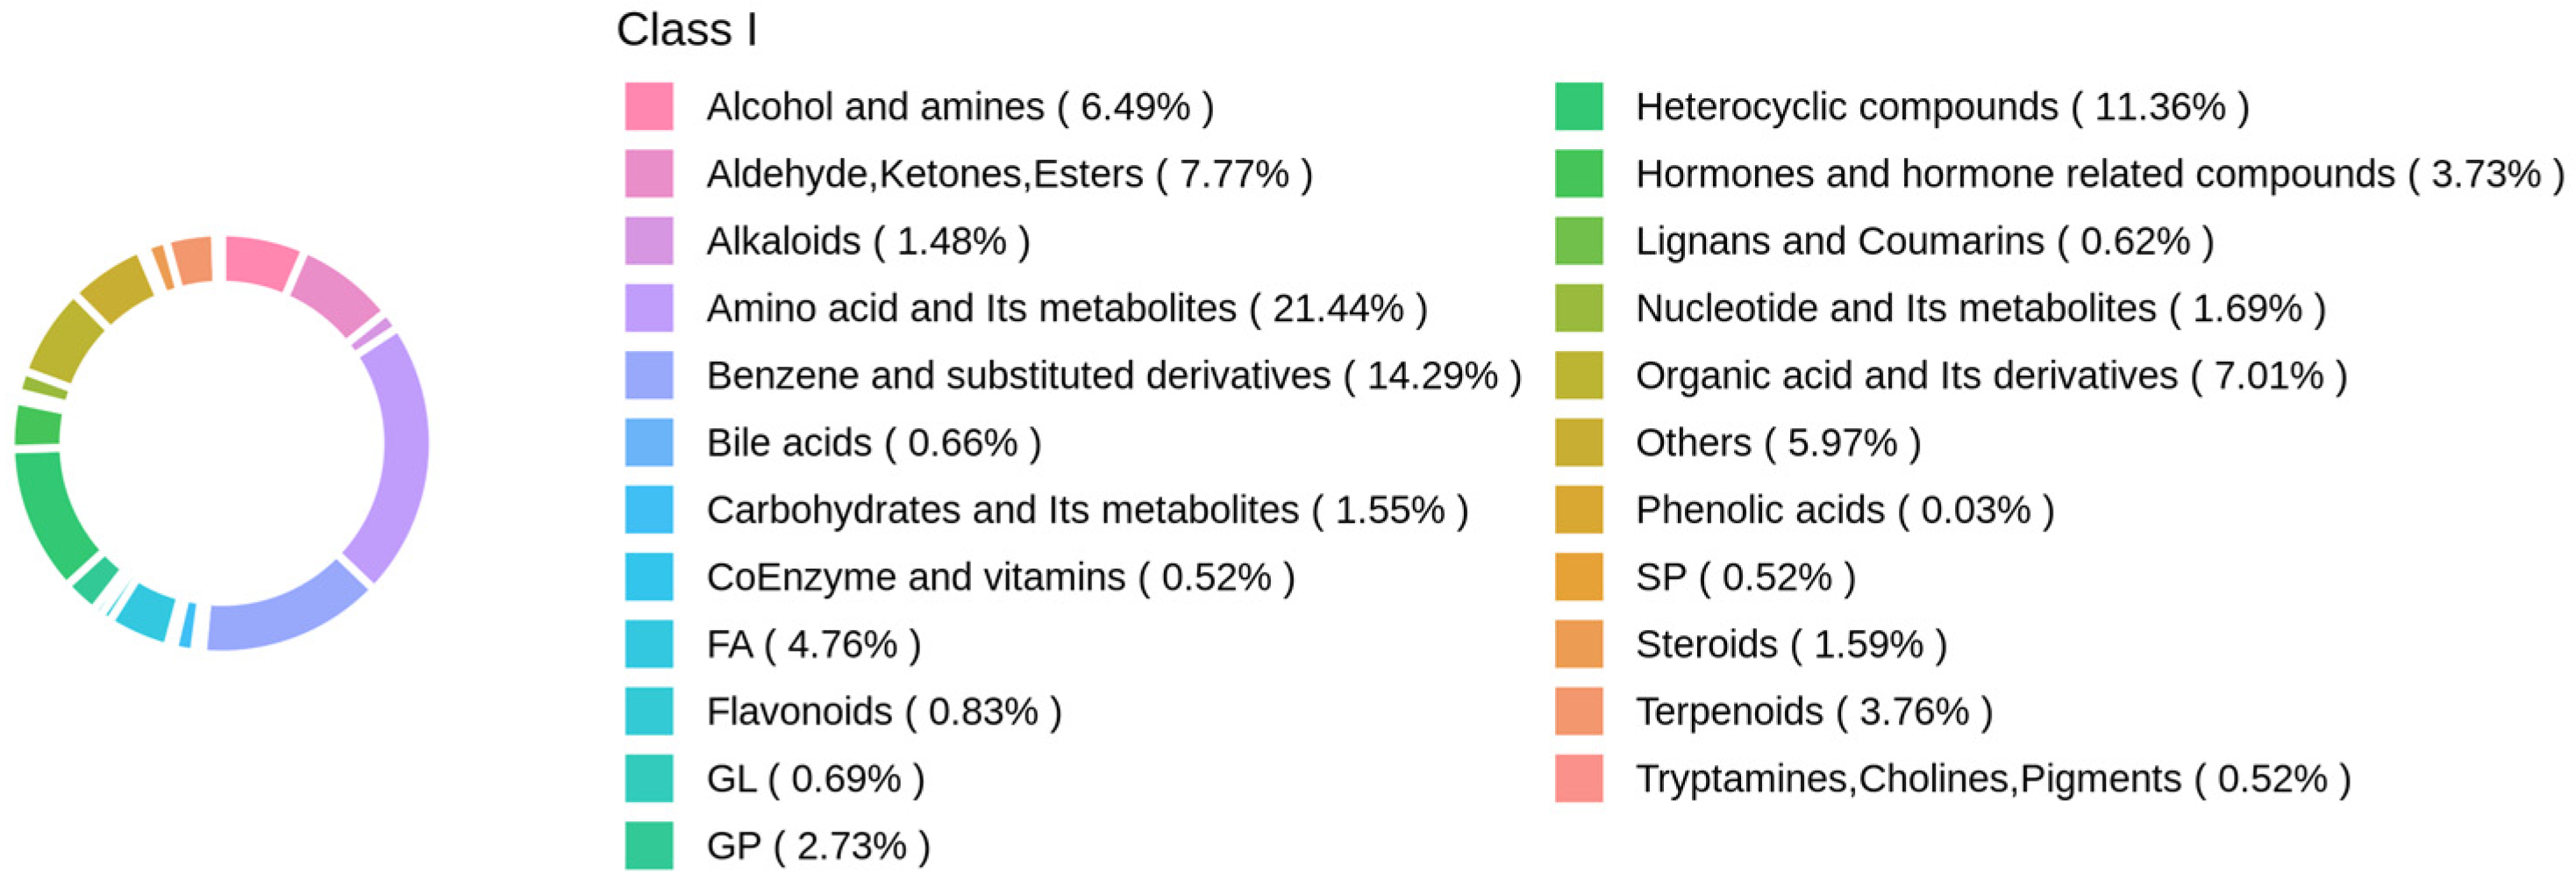
To characterize metabolite variation across SF, LF, and CK groups, non-targeted metabolomics analysis identified 3855 metabolites spanning 23 categories (Figure 2). Dominant categories and their proportions included: amino acids and their metabolites (21.44%), benzene and its derivatives (14.29%), heterocyclic compounds (11.36%), aldehydes, ketones, and esters (7.77%), organic acids and their derivatives (7.01%), and alcohols and amines (6.49%). 5.97% others, 4.76% fatty acyls, 3.76% terpenoids, 3.73% hormones and hormone-related substances, 1.69% nucleotides and their metabolites, 1.59% steroids, 1.55% carbohydrates and their metabolites, 1.48% alkaloids, 0.83% flavonoids, 0.73% glycerophospholipids, 0.69% glycerolipids, 0.66% bile acids, 0.62% lignans and coumarins, 0.52% coenzymes and vitamins, 0.52% sphingolipids, 0.52% tryptamines, cholines and pigments, 0.03% phenolic acids.

3.2.2. Principal Component Analysis (PCA) and OPLS-DA of Metabolites

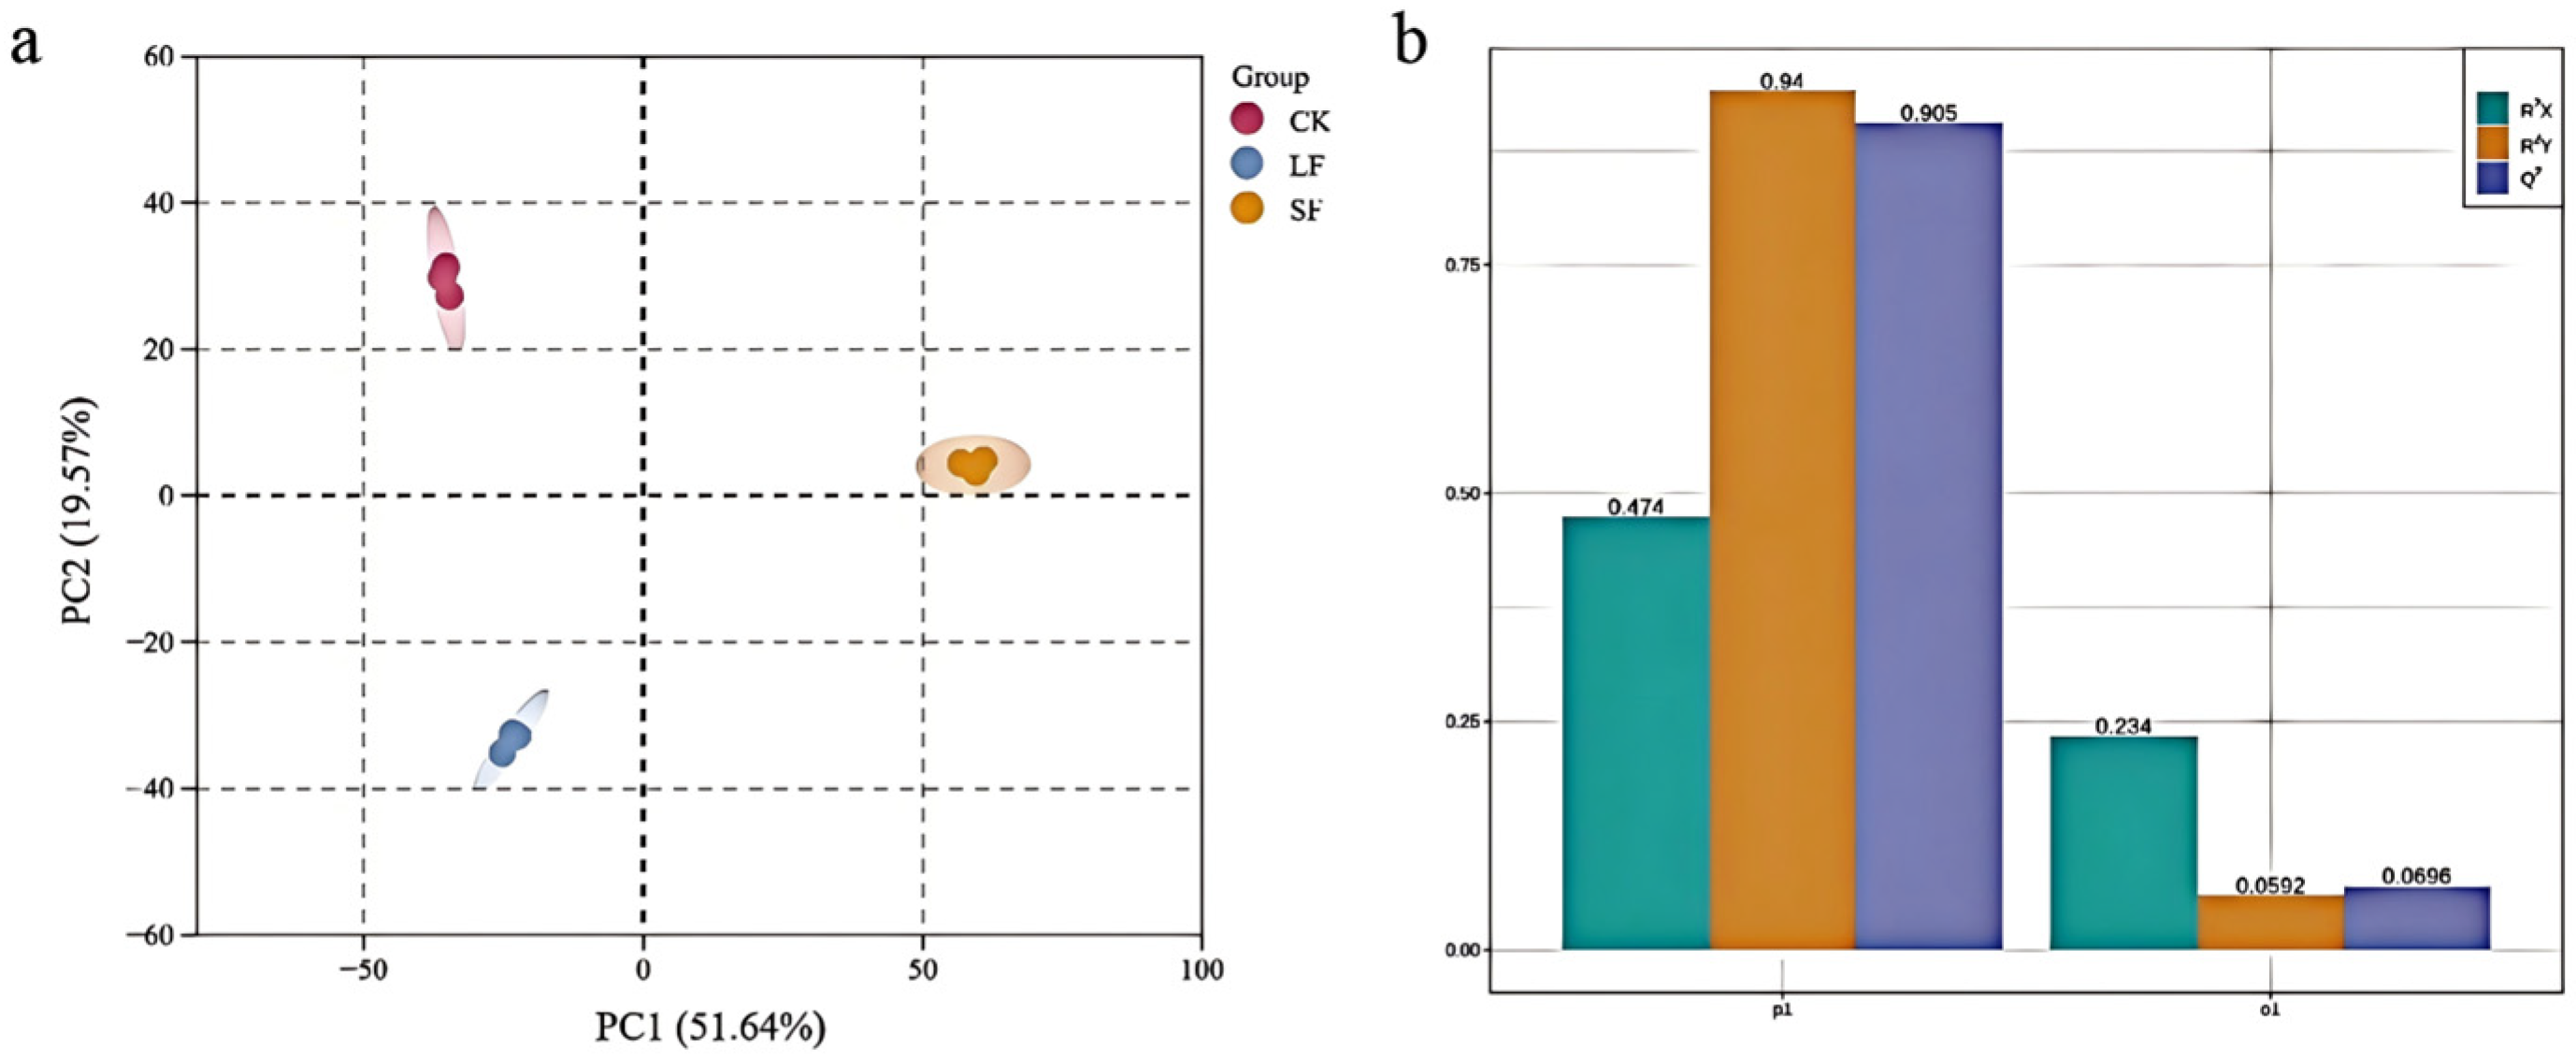
Principal component analysis was performed on rhizosphere soil metabolites across soil samples (Figure 3), showed nearly all samples within the 95% confidence interval. The first principal component accounted for approximately 51.64% of the metabolite variation, while the second principal component explained approximately 19.57%. LF and SF samples were distinctly separated from CK samples and clustered independently, suggesting endophytic fungi significantly altered rhizosphere soil metabolites.
Orthogonal partial least squares-discriminant analysis (OPLS-DA) with Euclidean distance fitting yielded Q2 > 0.50 and p < 0.05, confirming good model fitness and robustness for subsequent metabolite analysis.

3.2.3. Cluster Heatmap Analysis of Metabolites

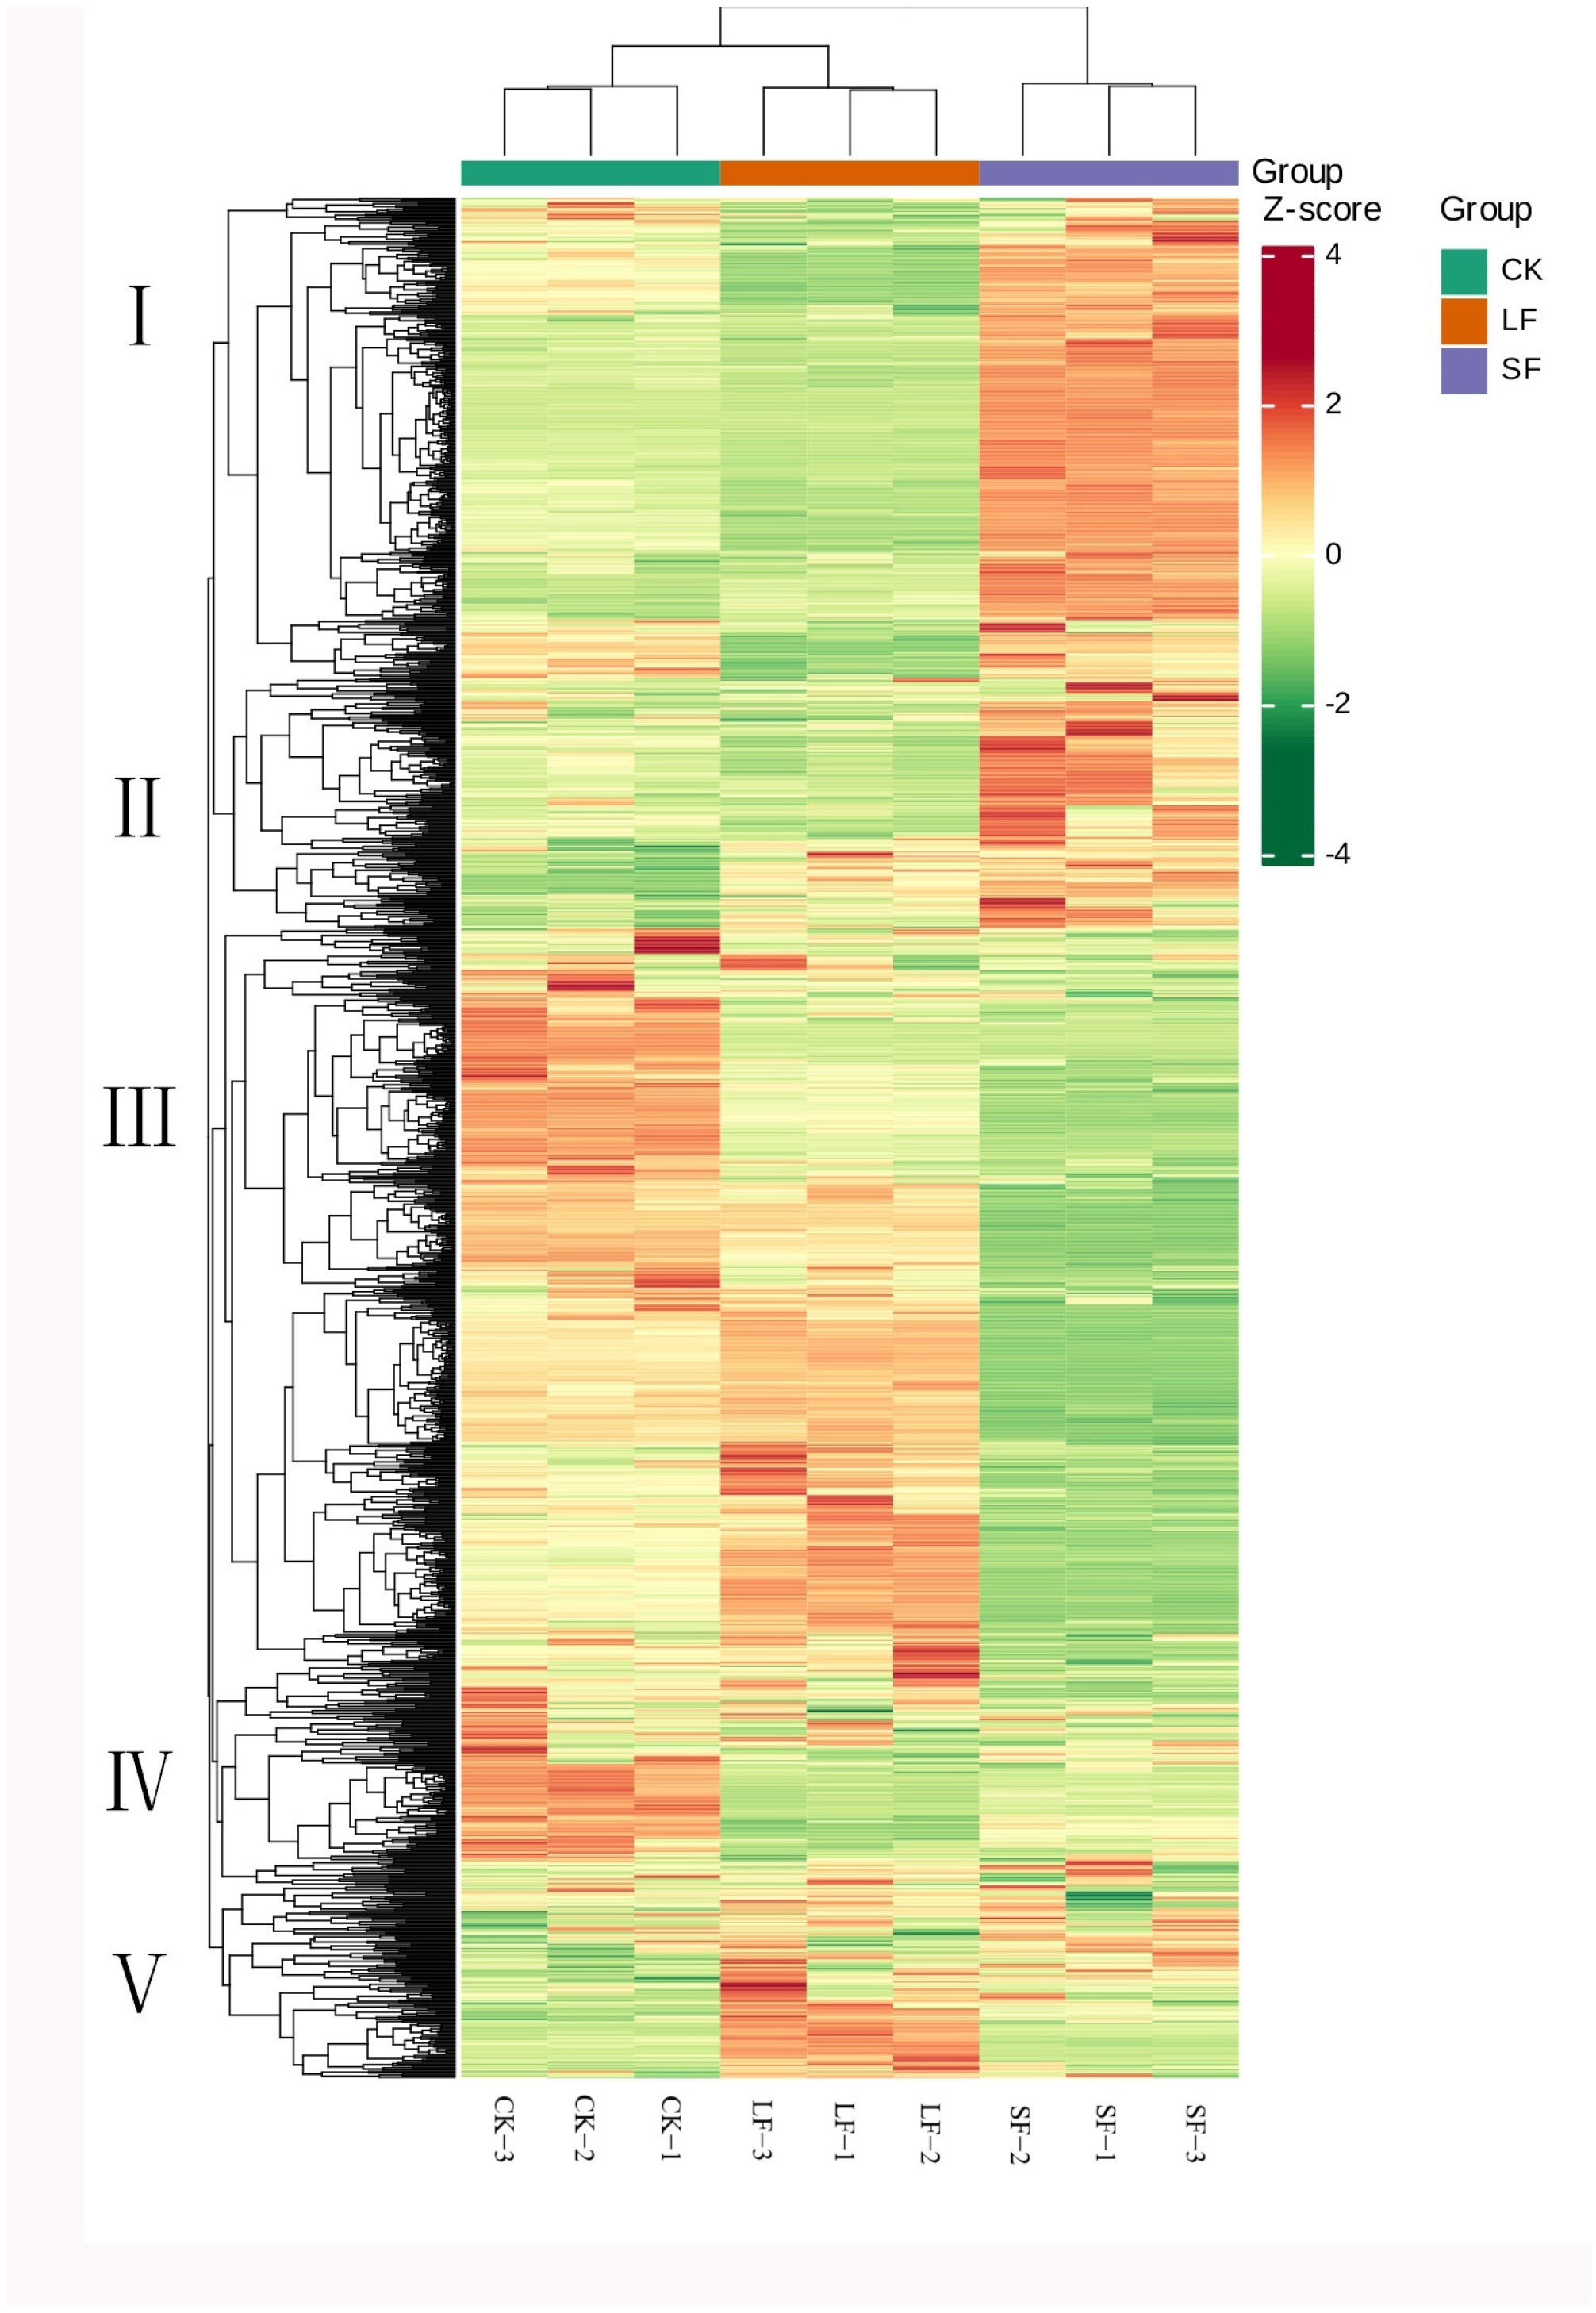
HCA was used to characterize differences in metabolite accumulation patterns across LF, SF, and CK samples. Based on this, metabolites were divided into four clusters:
Cluster I: Metabolites accumulated to the highest levels in CK, with only a small distribution in LF and SF.
Cluster II: Metabolites were most abundant in LF, moderately abundant in CK, and least abundant in SF.
Cluster III and IV: Metabolites displayed the highest content in SF, moderate levels in LF, and the lowest levels in CK (Figure 4).

3.2.4. Volcano Plot Analysis of Differential Metabolites

Differential metabolites were filtered based on fold change (FC) ≥ 2, VIP > 1, and p < 0.05 (Figure 5). Results revealed 1635 differential metabolites in SF vs. CK (892 upregulated, 743 downregulated) and 553 in LF vs. CK (171 upregulated, 382 downregulated).
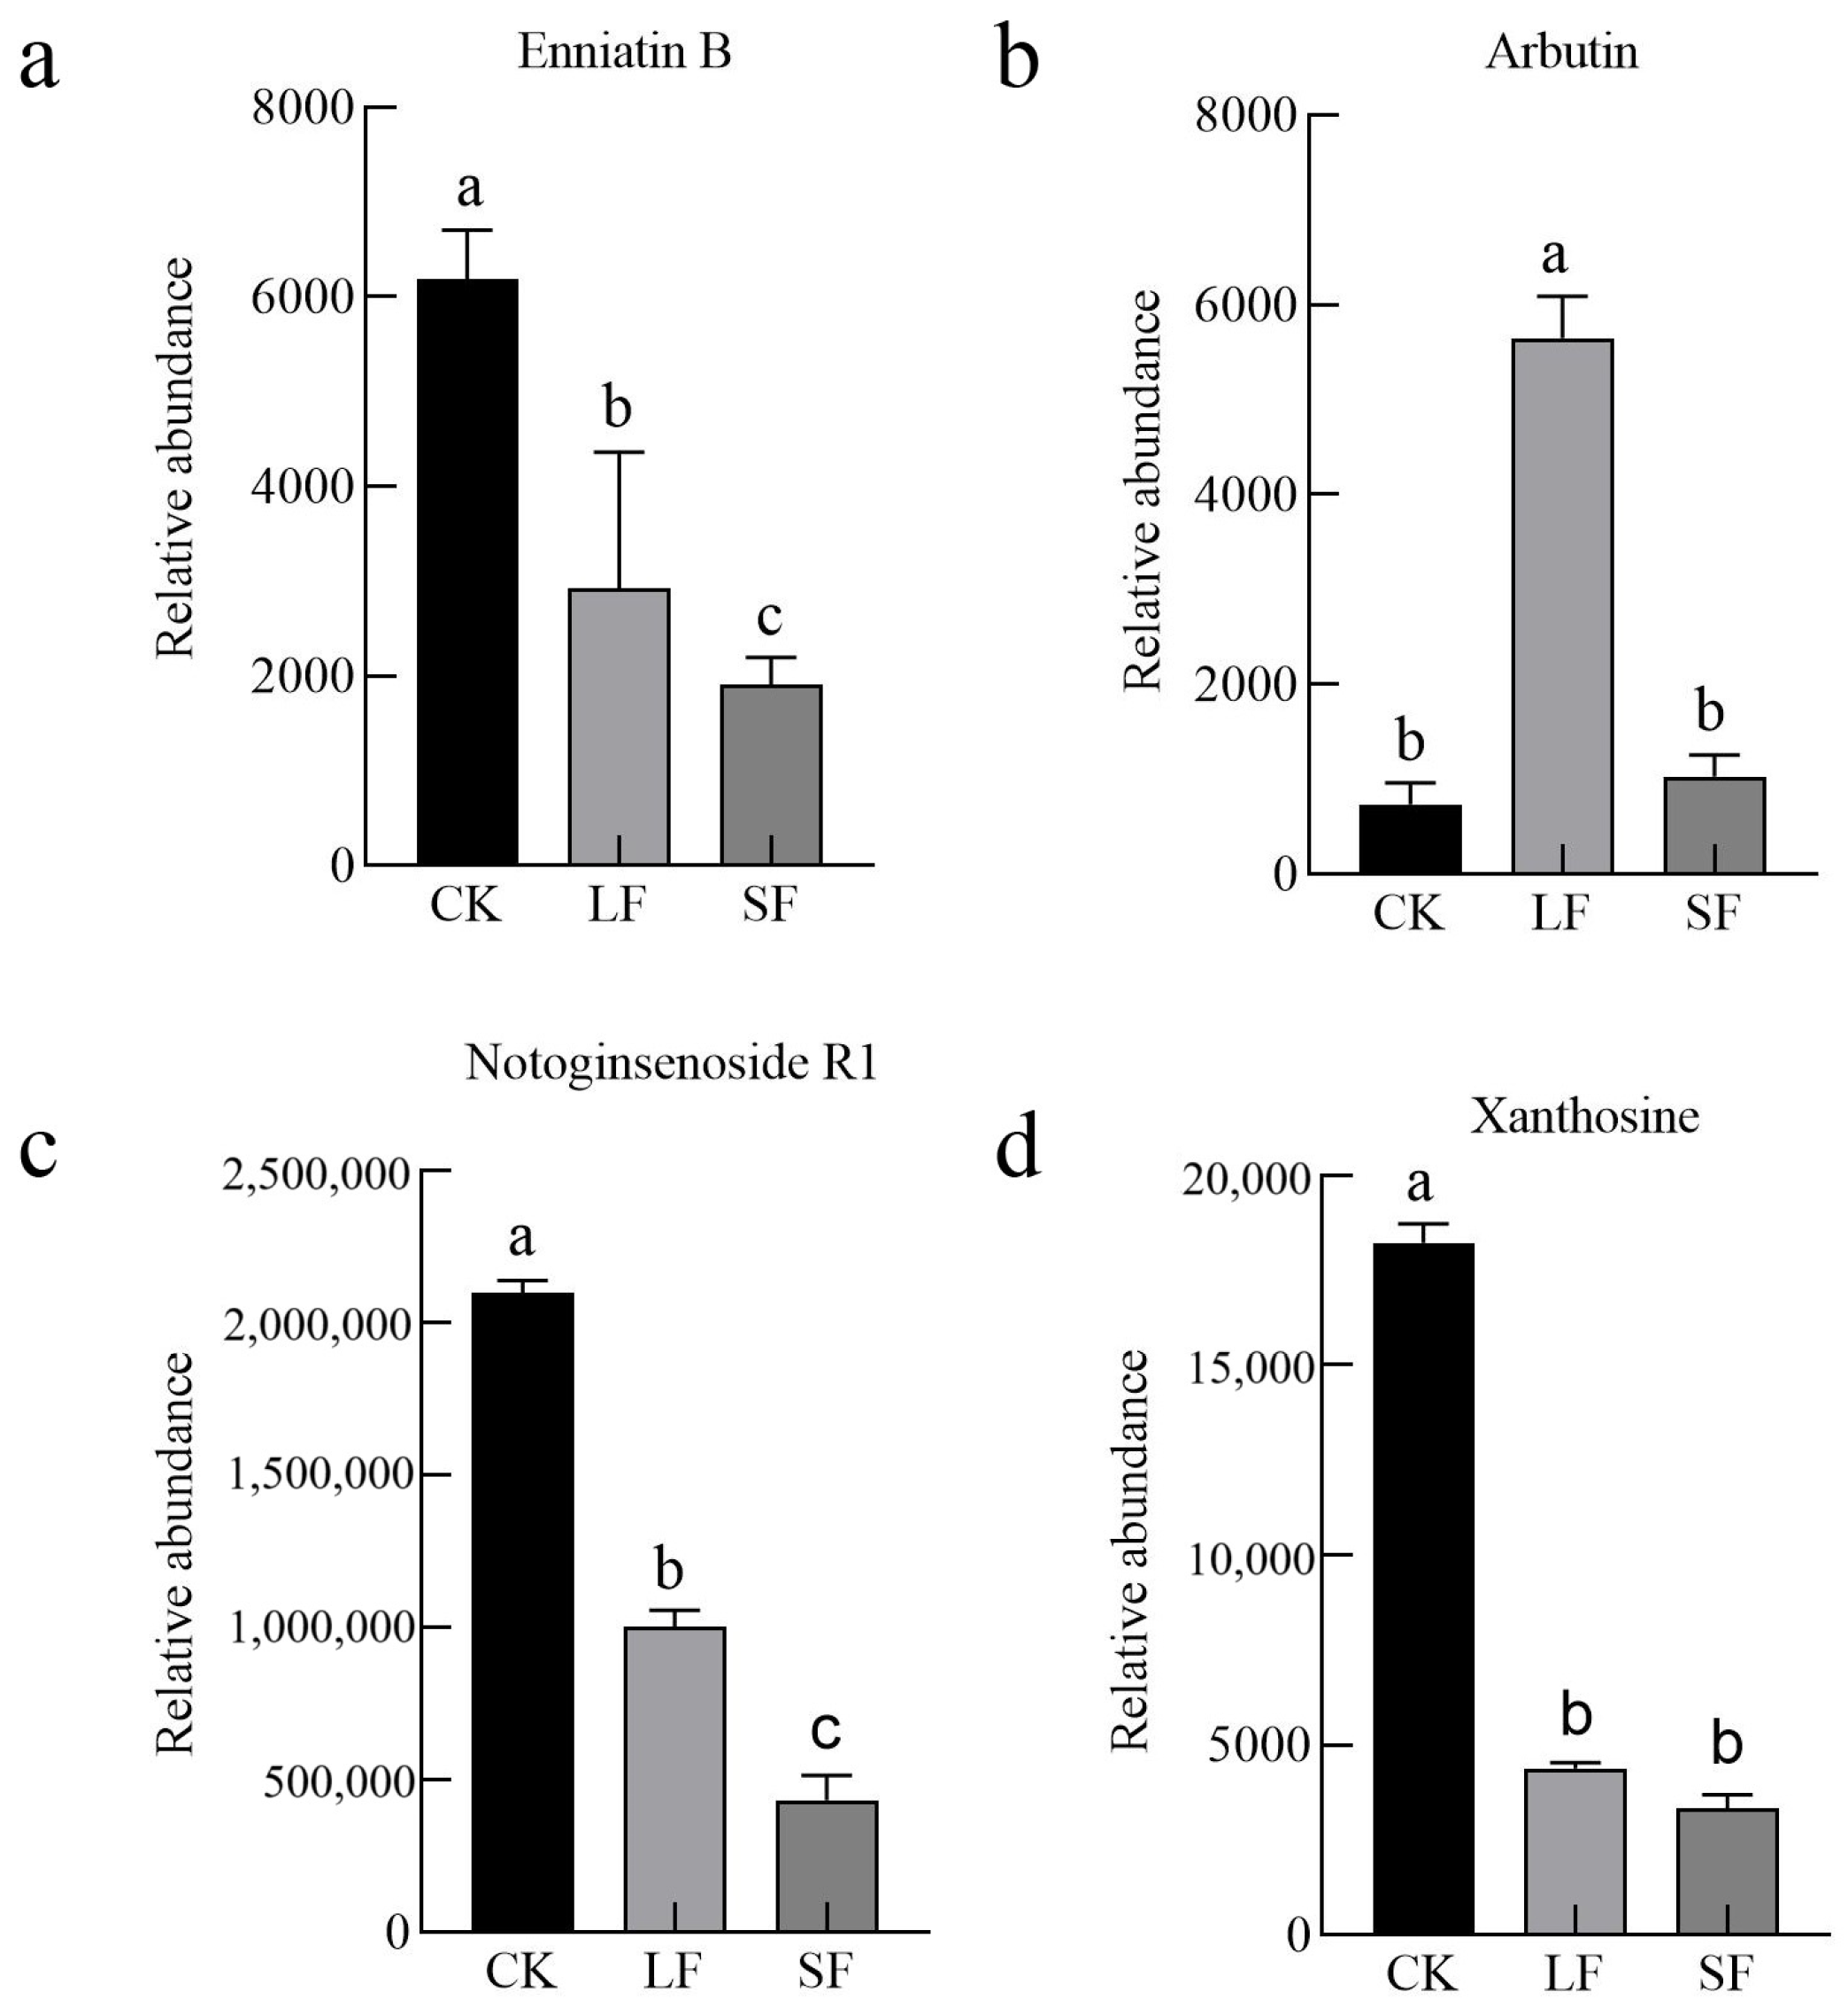
Four metabolites overlapping and highly differential were screened across both comparisons (Figure 6), namely enniatin B1, arbutin, notoginsenoside R1, and xanthosine. Among them: Enniatin B1 is a toxic metabolite produced by Fusarium spp. Its content was reduced by both treatments, which may be attributed to the inhibition of Fusarium spp. by S. terrestris. Arbutin exhibits various pharmacological activities. LF treatment significantly increased its content, but its physiological effects on P. notoginseng require further research. Notoginsenoside R1, a key allelochemical in P. notoginseng, was downregulated by both treatments, potentially mitigating the species’ allelopathic autotoxicity. Xanthosine, which correlates negatively with P. notoginseng growth, was also reduced by both treatments.

3.2.5. KEGG Functional Annotation

Differential metabolites were mapped to the KEGG database followed by enrichment analysis (Figure 7). The results showed that: in the comparison between LF and CK, differential metabolites were primarily enriched in ABC transporters, nucleotide metabolism and synthesis, purine metabolism, miscellaneous secondary metabolite synthesis, and indole diterpenoid alkaloid biosynthesis; in the comparison between SF and CK, differential metabolites were predominantly enriched in metabolic pathways, synthesis of secondary metabolites, ABC transporters, purine metabolism, and synthesis of various other secondary metabolites. Notably, the overlapping metabolic pathways with significant differences between SF and LF treatments encompassed ABC transporters, purine metabolism, and the synthesis of miscellaneous secondary metabolites.

3.2.6. Analysis of Key KEGG Metabolic Pathways

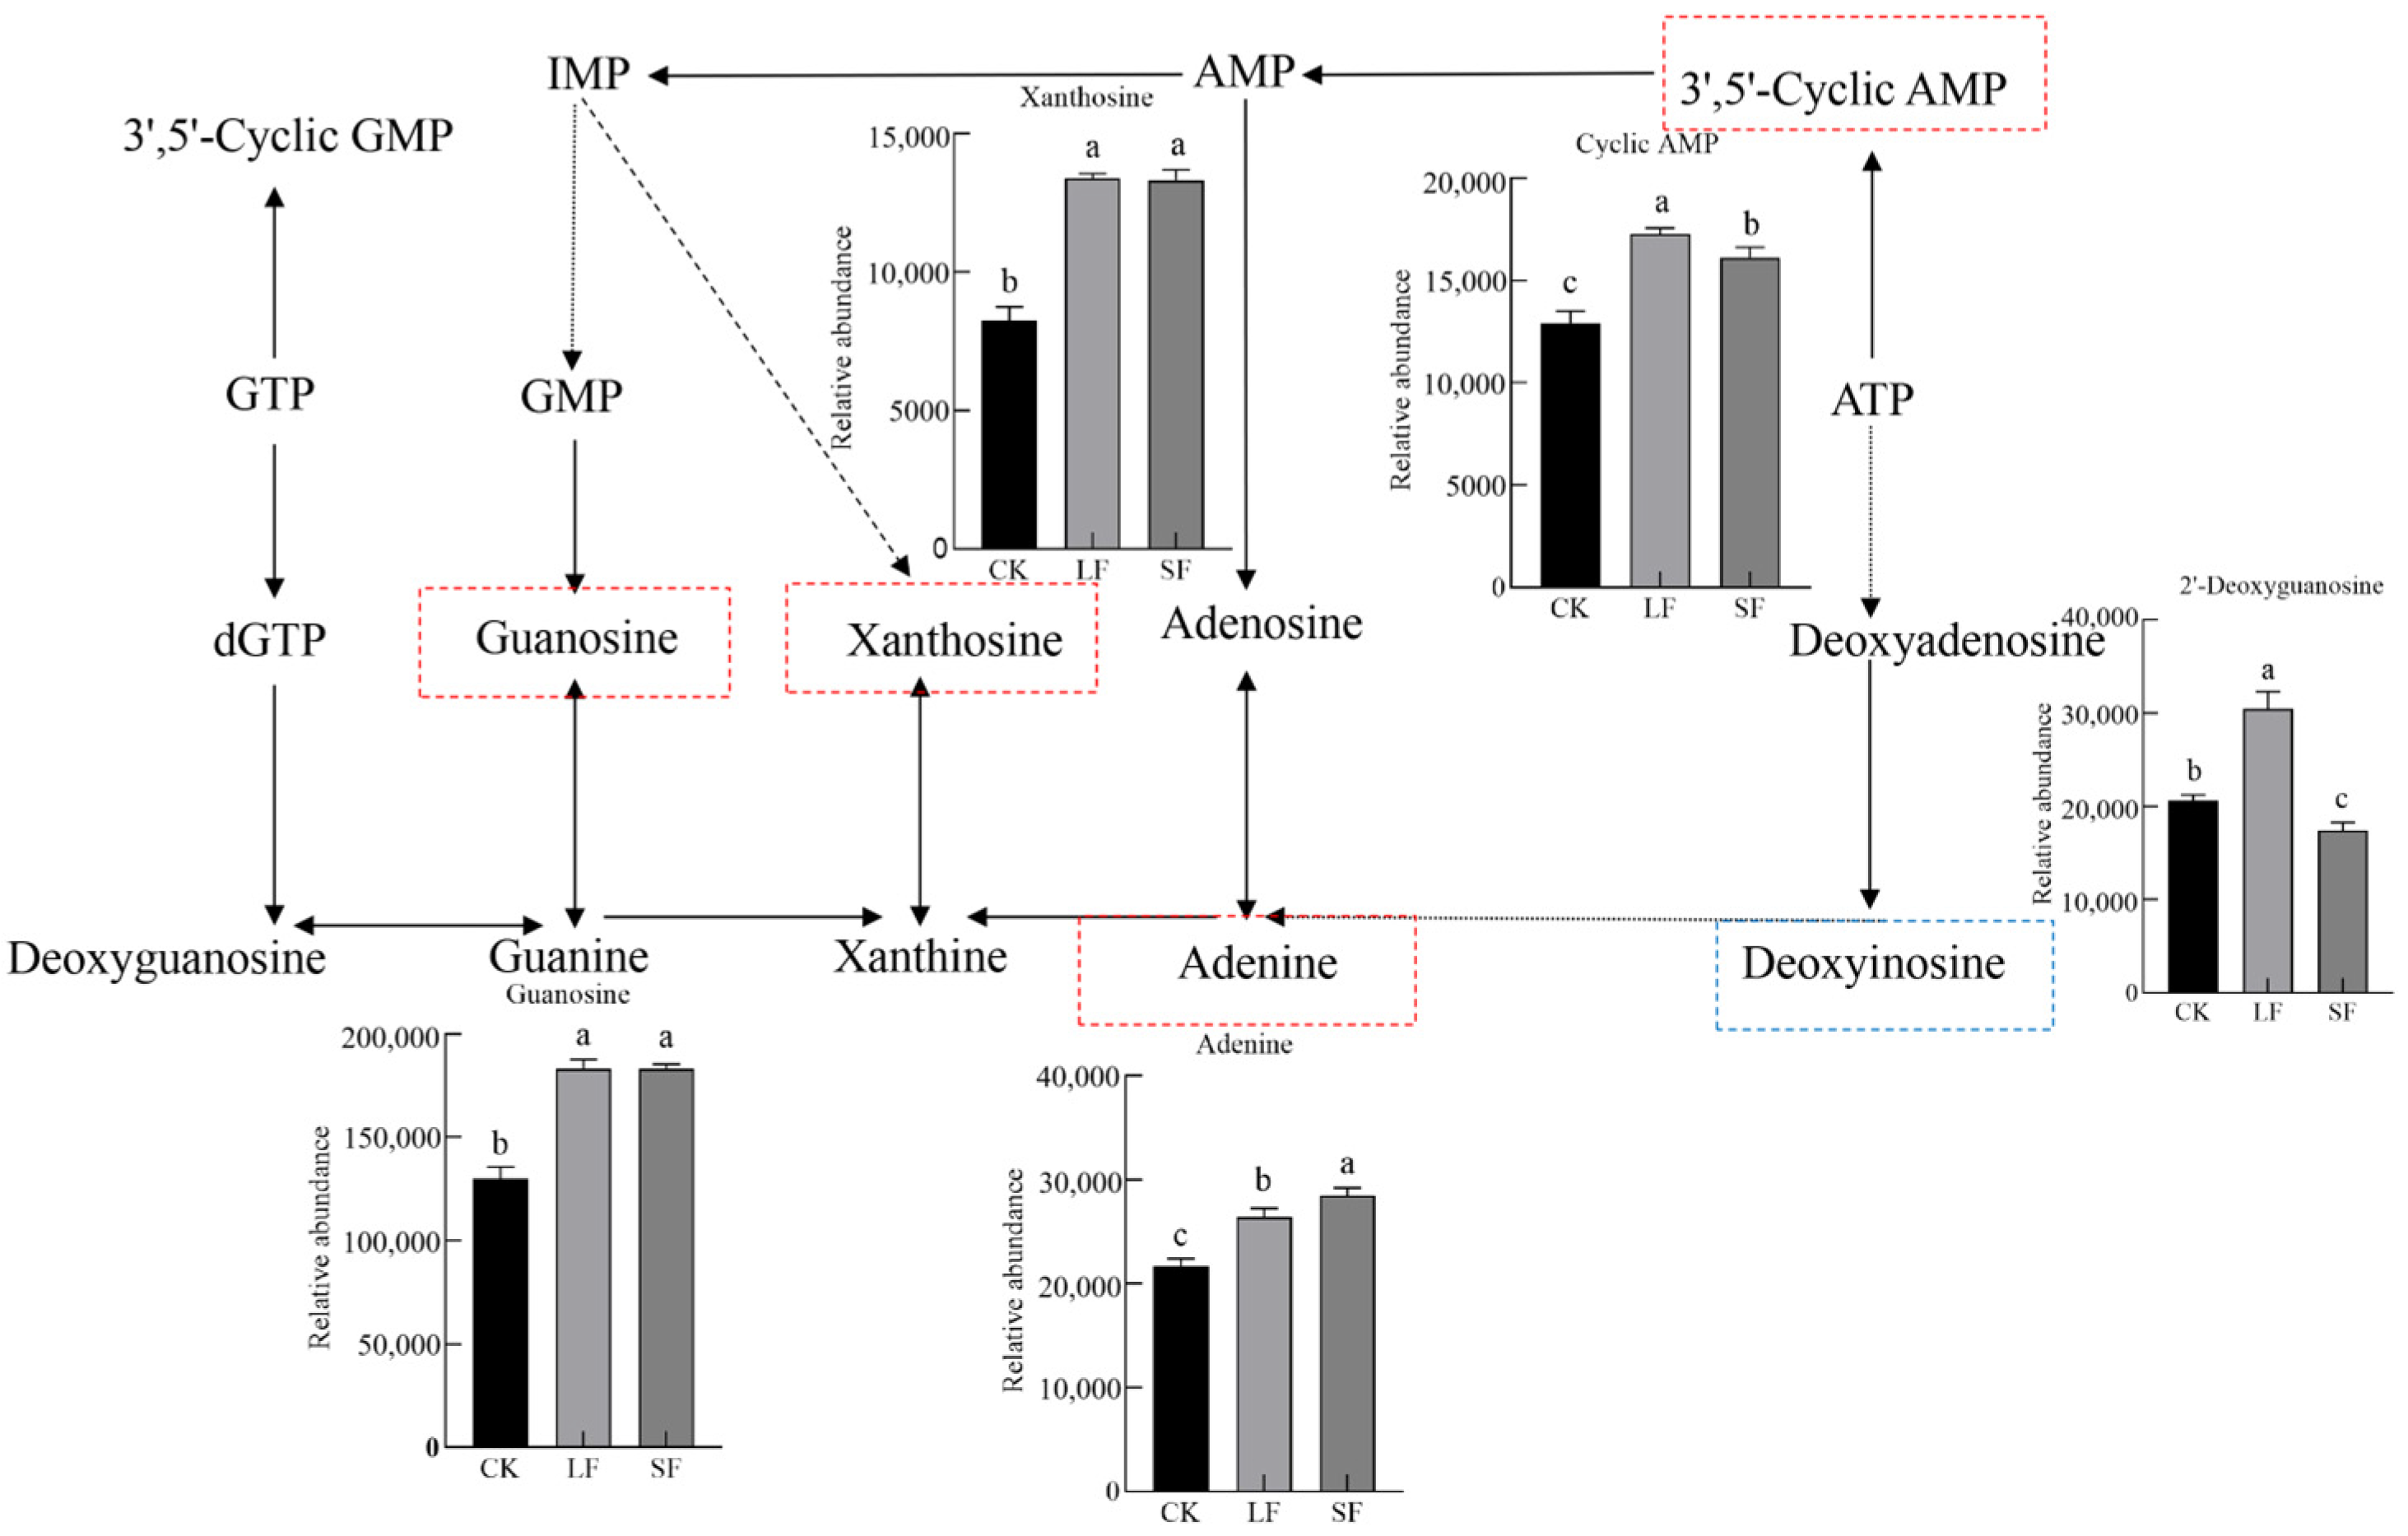
A purine metabolic pathway, linked to both treatments, was selected for mapping (Figure 8). Results demonstrated that both LF and SF treatments increased the expression abundances of adenine, adenosine-3′-5′-cyclic monophosphate hydrate, xanthosine, guanosine, and other products in purine metabolism (acting as plant energy carriers and nitrogen sources), with LF treatment exhibiting higher abundances than SF treatment. Additionally, the abundance of 2′-deoxyinosine in the LF treatment was significantly greater than in the CK and SF treatments.

3.3. Annotation and Evaluation of Rhizosphere Soil Microorganisms of Panax notoginseng

3.3.1. Effects of Growth-Promoting Fungi on Soil Nutrients and pH

Soil total nutrients reflect potential fertility, with total nitrogen content being intimately linked to plant growth. Relative to the control, the soil total nitrogen content in P. notoginseng increased following S. terrestris inoculation (across treatments), potentially due to the fungus-mediated enrichment of nitrogen-fixing bacteria. Total phosphorus and total potassium contents showed no significant changes: total phosphorus remained stable owing to the slow migration and transformation rates of phosphorus and the lack of exogenous supplementation, whereas total potassium maintained dynamic balance due to the absence of exogenous addition.
Soil nitrogen is crucial for plant growth. The SF treatment significantly increased ammonium nitrogen (NH4+-N) content (p < 0.05), whereas the LF treatment exhibited an increasing trend without statistical significance. Nitrate nitrogen (NO3-N) content increased in all treatments, but no significant differences were detected.
The total phosphorus content in the rhizosphere soil of P. notoginseng did not show significant changes, which may be attributed to the slow migration rate of phosphorus in the soil environment and its relatively sluggish chemical transformation process. Additionally, no exogenous phosphorus supplementation measures were adopted throughout the experimental period; thus, different treatments with endophytes did not exert a significant impact on the total phosphorus content in the soil. Similarly, under the same experimental conditions, the total potassium content in the rhizosphere soil of P. notoginseng was not significantly affected by the exogenous addition of S. terrestris. This is because no exogenous potassium was added during the experiment, resulting in the soil potassium content maintaining a relatively stable dynamic equilibrium.
Soil organic matter serves as a key indicator of soil fertility. The LF treatment significantly increased organic matter content (p < 0.05), whereas the SF treatment showed an increasing trend without statistical significance. This could be attributed to the fungus’s capacity to modify microbial communities, thereby enhancing carbon input (Table 1).
Soil pH affects microbial activity and plant growth. Both LF and SF treatments significantly increased soil pH, indicating that this fungus might mitigate soil acidification.
In summary, exogenous addition of S. terrestris can promote soil nutrient cycling, increase nutrient contents, and improve soil fertility.

3.3.2. Effects of Growth-Promoting Fungi on Taxonomic Composition of Rhizosphere Soil Microorganisms at the Phylum Level in Understory Panax notoginseng

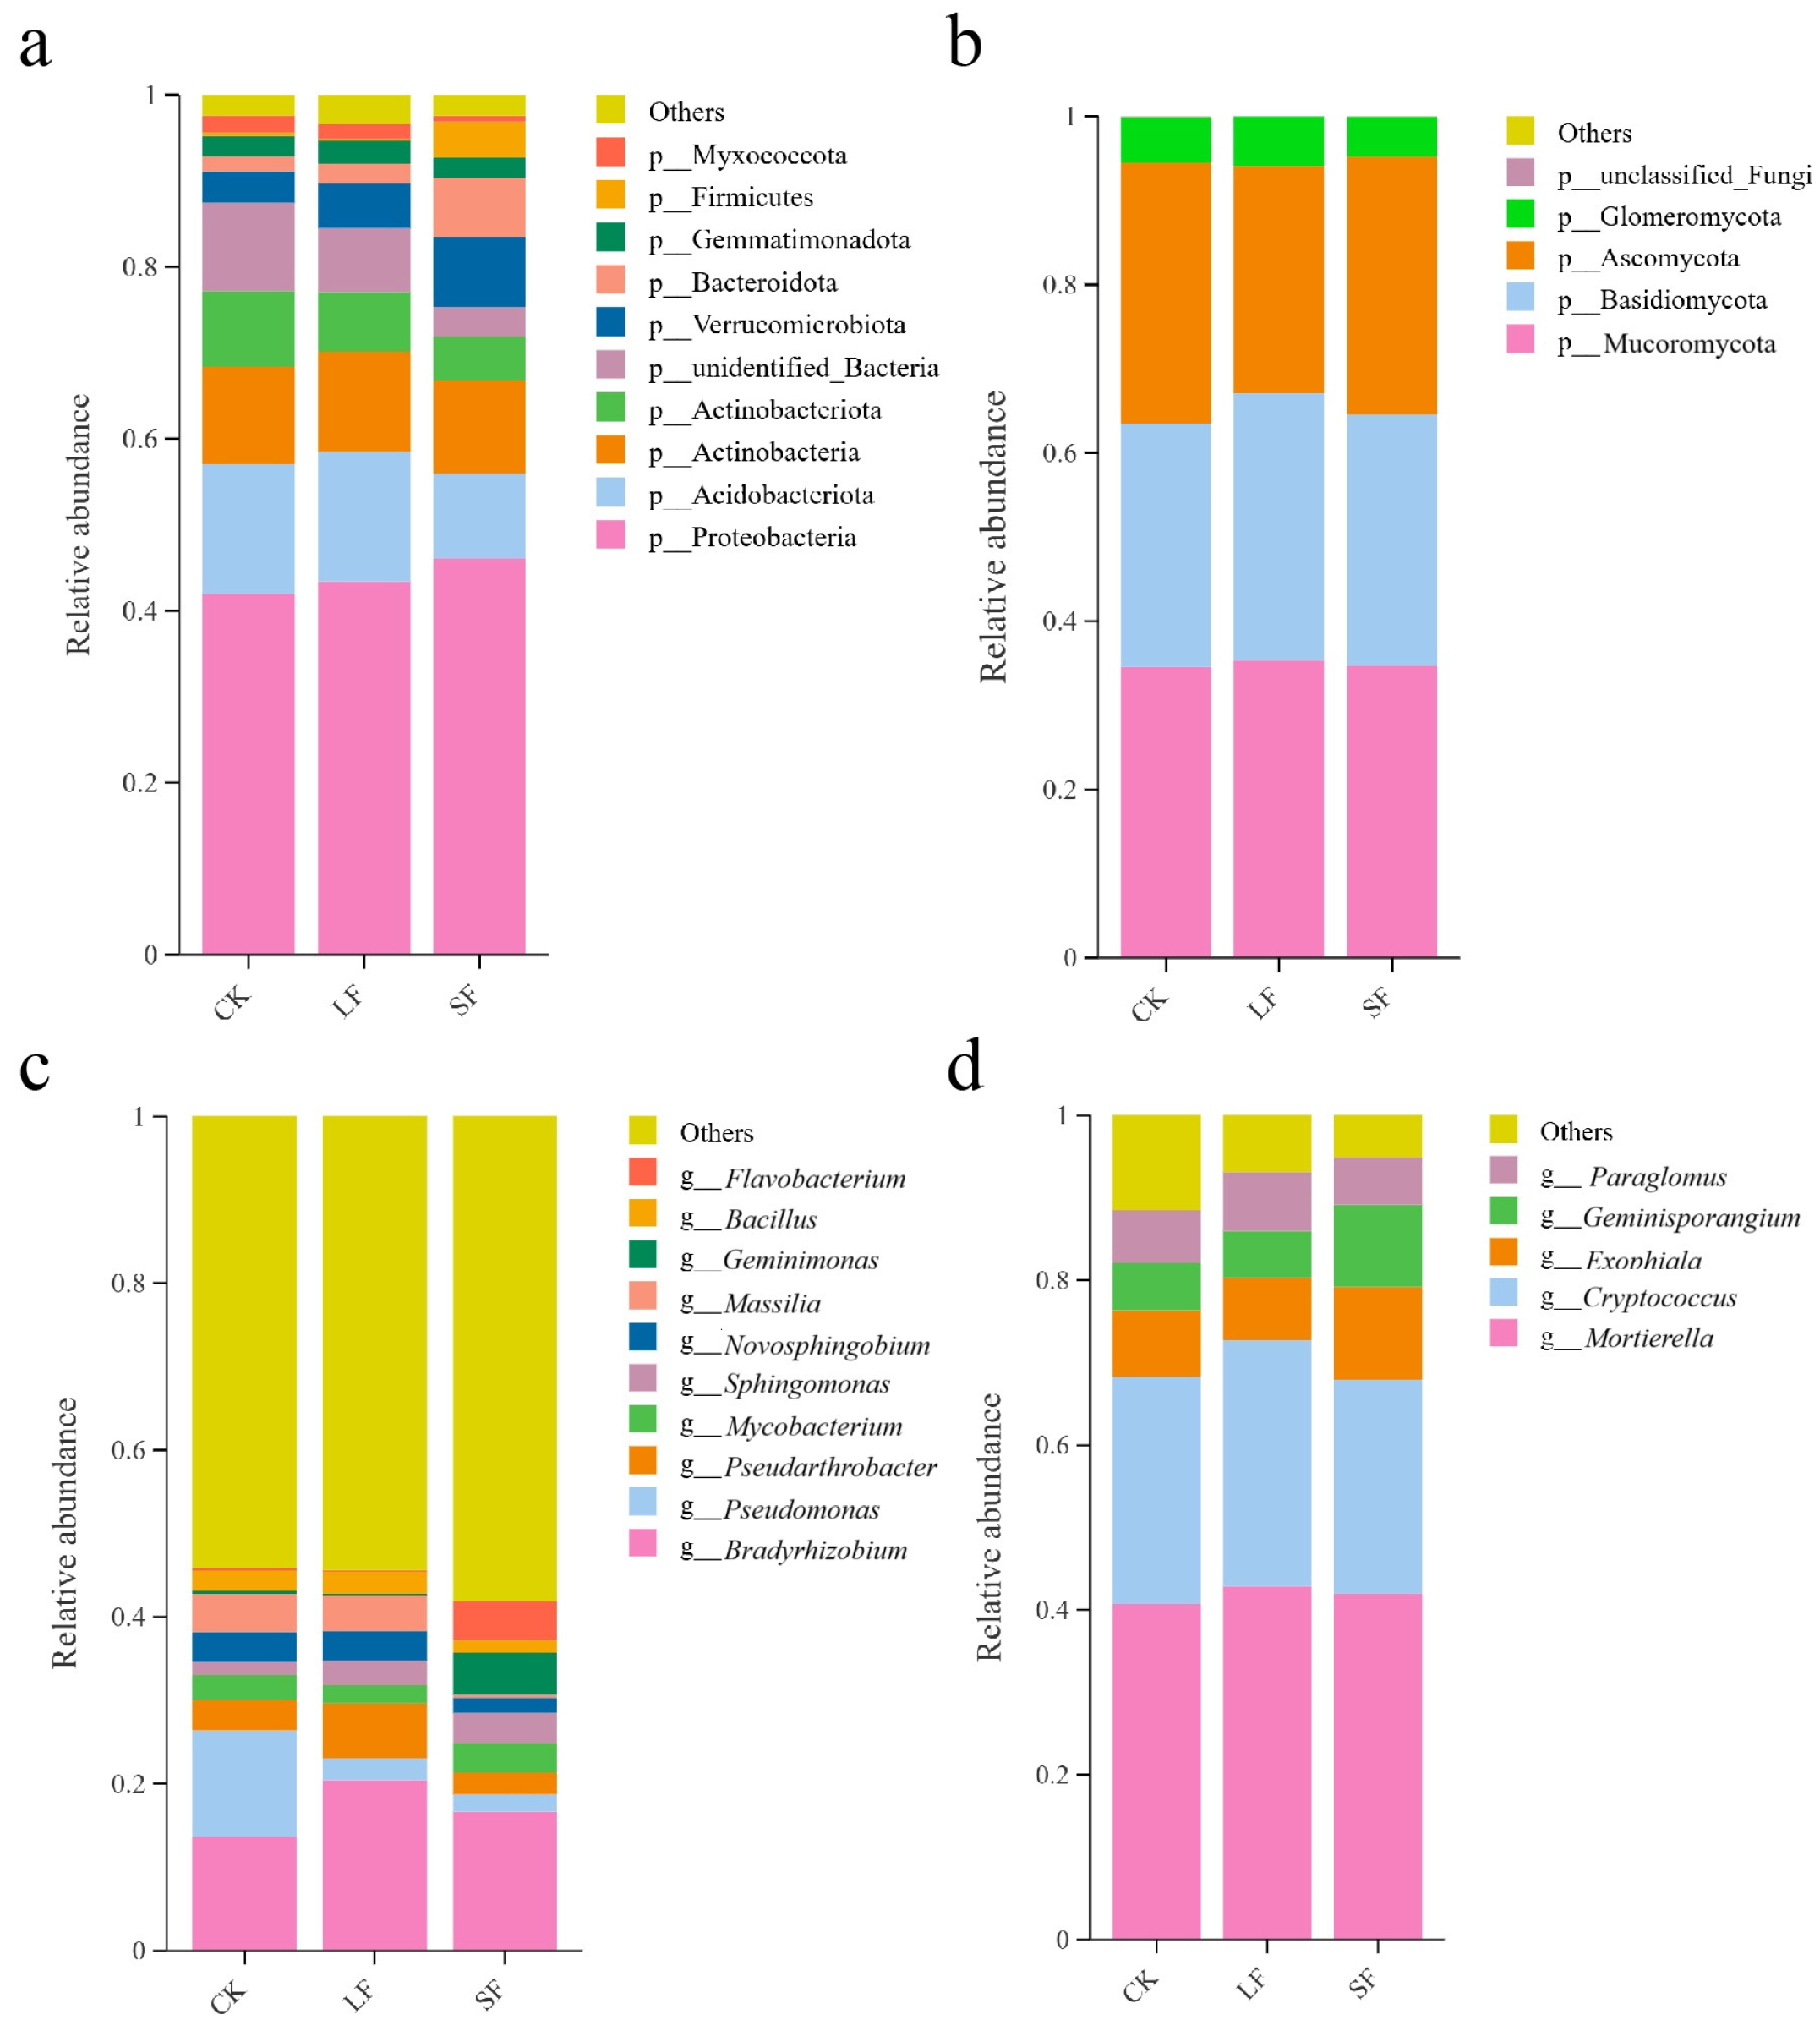
As shown in Figure 9, among the top 10 bacterial phyla by relative abundance in rhizosphere soil, the dominant phyla were Proteobacteria (42–46.1%), Acidobacteria (9.8–15.1%), and Actinobacteria (10.8–11.7%). Collectively, these three phyla contributed over 66% of the total bacterial community, thus dominating the assemblage. Other bacterial phyla included Myxomycota (0.6–1.9%) and Gemmatimonadetes (2.4–2.7%).
Compared with the control, all S. terrestris treatments increased the relative abundance of Proteobacteria, with a more pronounced elevation in the SF treatment than in the LF treatment. Additionally, the SF treatment decreased the relative abundances of Acidobacteria and Actinobacteria, while increasing those of Firmicutes and Verrucomicrobia.
Among the top 5 fungal phyla by relative abundance in rhizosphere soil, the dominant phyla were Basidiomycota (29–31.7%), Zygomycota (34.6–35.4%) (Note: The traditionally classified ‘Zygomycota’ has been revised due to its non-monophyletic nature. The taxa involved in this study are classified into Mucoromycota based on phylogenetic research (Spatafora et al.) [32], and will be referred to as Mucoromycota hereafter), and Ascomycota (27–30.9%). Together, these three phyla constituted over 90% of the total fungal community, thus dominating the assemblage. Another fungal phylum of note was Glomeromycota (0.1–0.3%).
Compared with the control, all S. terrestris treatments elevated the relative abundances of Mucoromycota and Basidiomycota, while the LF treatment decreased the relative abundance of Ascomycota.

3.3.3. Effects of Growth-Promoting Fungi on Taxonomic Composition of Rhizosphere Soil Microorganisms at the Genus Level in Understory Panax notoginseng

As shown in Figure 9, genus-level bacteria comprised 11 major groups. Identifiable genera and their relative abundances were as follows: Bradyrhizobium (13.7–20.4%), Pseudomonas (2.1–12.7%), Pseudarthrobacter (2.6–6.6%), Mycobacterium (2.2–3.5%), Sphingomonas (1.6–3.7%), Novosphingobium (1.8–3.6%), Massilia (0.4–4.5%), Bacillus (0.2–5.1%), Gemmatimonas (1.5–2.7%), and Flavobacterium (0.3–4.7%).
Compared with the control, all S. terrestris treatments elevated the relative abundances of Bradyrhizobium and Sphingomonas; the LF treatment increased those of Pseudomonas and Gemmatimonas; the SF treatment increased the relative abundances of Bacillus and Flavobacterium, while decreasing those of Novosphingobium and Gemmatimonas. Fungi at the genus level mainly included 6 groups.
Identifiable genera and their relative abundances were: Mortierella (40.7–42.8%), Cryptococcus (26–29.9%), Exophiala (7.6–11.3%), Bifidobacterium (5.7–9.9%), and Paraglomus (5.8–6.4%).
Compared with the control, different treatments with S. terrestris both increased the relative abundance of Mortierella; the LF treatment increased the relative abundances of Cryptococcus and Paraglomus; the SF treatment increased the relative abundances of Exophiala and Bifidobacterium (Figure 9).

3.3.4. α Diversity Analysis of Bacteria and Fungi

The OTU coverage rates of bacteria and fungal communities were over 99.6% and 100%, respectively. For bacteria, the Shannon, Simpson, Chao1, and ACE index in the LF and SF groups were significantly higher than those in the CK group. The Shannon index, Chao1 index, and ACE index in the SF group were slightly higher than those in the LF group, with no significant difference between the two groups. In the case of fungi, the Shannon and Simpson index in the LF group were significantly reduced compared to the CK group, whereas the Shannon index in the SF group showed a marginal increase relative to the CK group, with no significant variation in the Simpson index between the SF group and the CK group. Both the Chao1 index and ACE index in the LF and SF groups were significantly higher than those in the CK group, with the SF group exhibiting significantly higher values for these two indices than the LF group (Table 2).
In summary, the application of different fermentates of S. terrestris can alter the α diversity of the rhizosphere microbiota of understory P. notoginseng.

3.3.5. β Diversity Analysis of Rhizosphere Soil Microorganisms

Weighted UniFrac-based PCoA (Figure 10) revealed that distinct S. terrestris treatments markedly reshaped the rhizosphere microbial community structure of understory P. notoginseng: For the soil bacterial community, PC1 and PC2 accounted for 61.25% and 13.38% of variance, respectively. LF and CK groups were clearly segregated from the SF group along PC1 with a large dissimilarity, and all treatments were separated along the second coordinate axis. For the soil fungal community, PC1 explained 61.65% of variance and PC2 20.79%. The treatment groups were widely dispersed across axes, indicating marked dissimilarity of community composition.
In summary, distinct S. terrestris treatments exerted a significant impact on the rhizosphere community, modifying the proportion of dominant microorganisms in understory P. notoginseng rhizosphere.
The Simpson index can serve as an important indicator reflecting community evenness (the closer the value is to 1, the higher the community evenness). The results show that: For the bacterial community: The Simpson index of the SF group (0.9933) was significantly higher than that of the CK group (0.9910, p < 0.05), indicating that SF treatment significantly improved the evenness of the bacterial community, which is consistent with the speculation that “SF promotes a more balanced microbial community structure”. For the fungal community: There was no significant difference between the Simpson index of the SF group (0.9560) and that of the CK group (0.9583). However, the Chao1 and ACE indices (richness indicators) of the SF group were significantly higher than those of the CK group (p < 0.05), suggesting that SF increased the species richness of fungi without significantly reducing community evenness. In contrast, the slightly higher evenness in the CK group might be attributed to the high abundance of a few dominant taxa (such as specific pathogenic fungi).

3.3.6. Network Stability Analysis

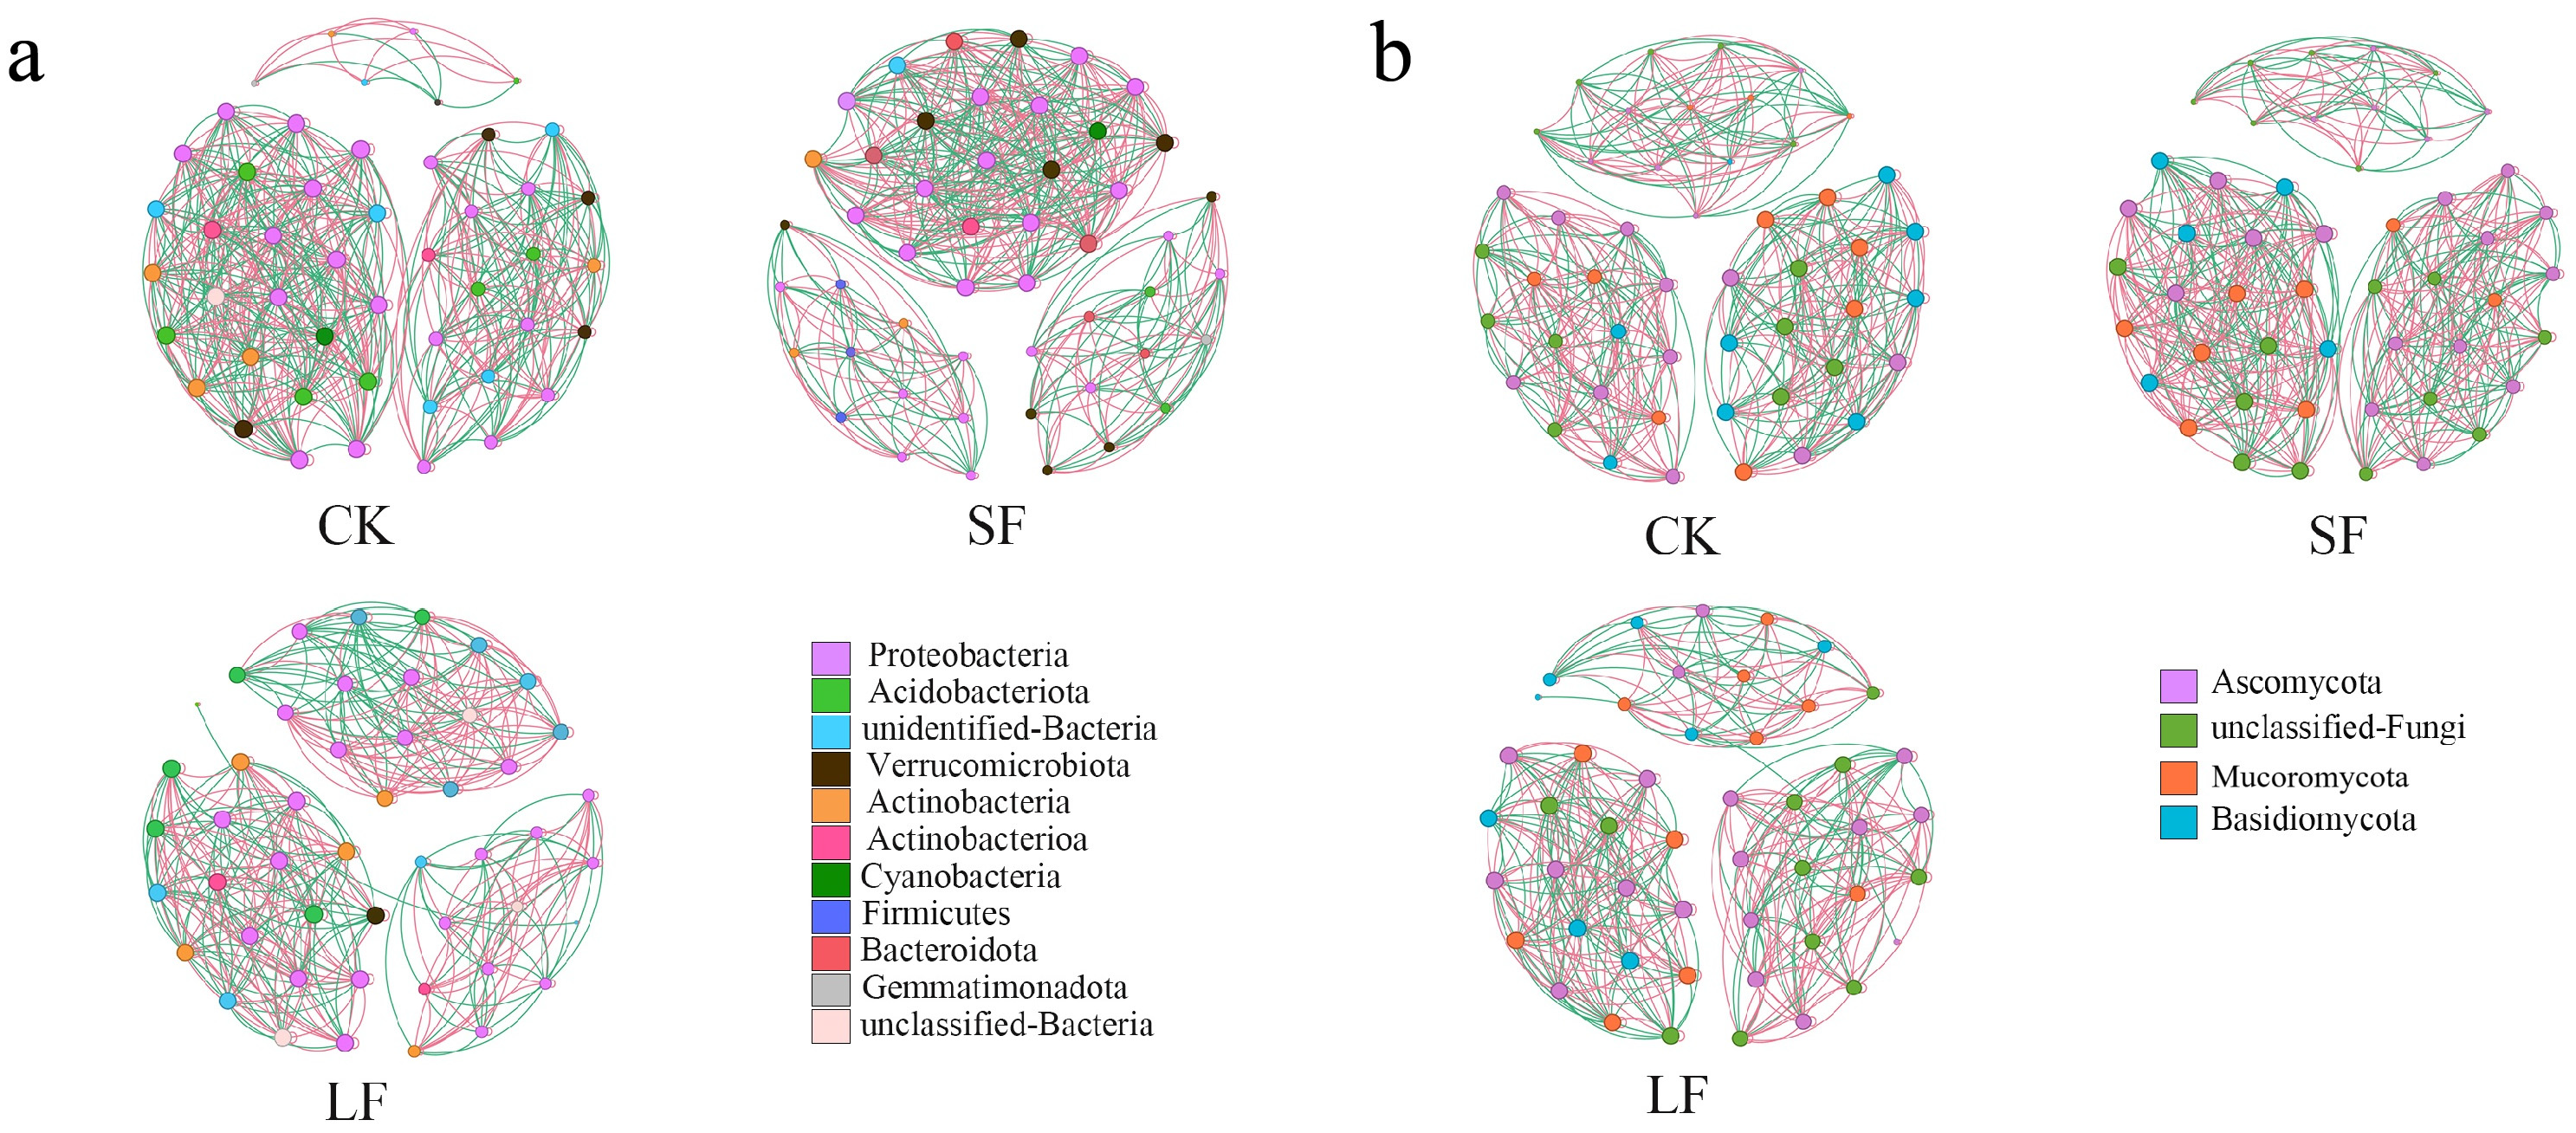
Soil microbial interactions underpin biological activities such as “linguistic” communication and signal transduction, which are pivotal for sustaining soil microecological equilibrium. The top 50 ASVs (Amplicon Sequence Variants) by relative abundance, encompassing bacteria and fungi, were selected for network construction (Figure 11). Network analysis showed that distinct treatments with the endophytic fungus S. terrestris increased node count, edge number, graph density, and average clustering coefficient of the soil bacterial–fungal network, with a trend of SF > LF > CK. This indicates that distinct S. terrestris treatments augmented the network complexity of rhizosphere microorganisms in understory P. notoginseng (Table 3 and Table 4).

3.3.7. Analysis of Environmental Factors Affecting Microbial Communities

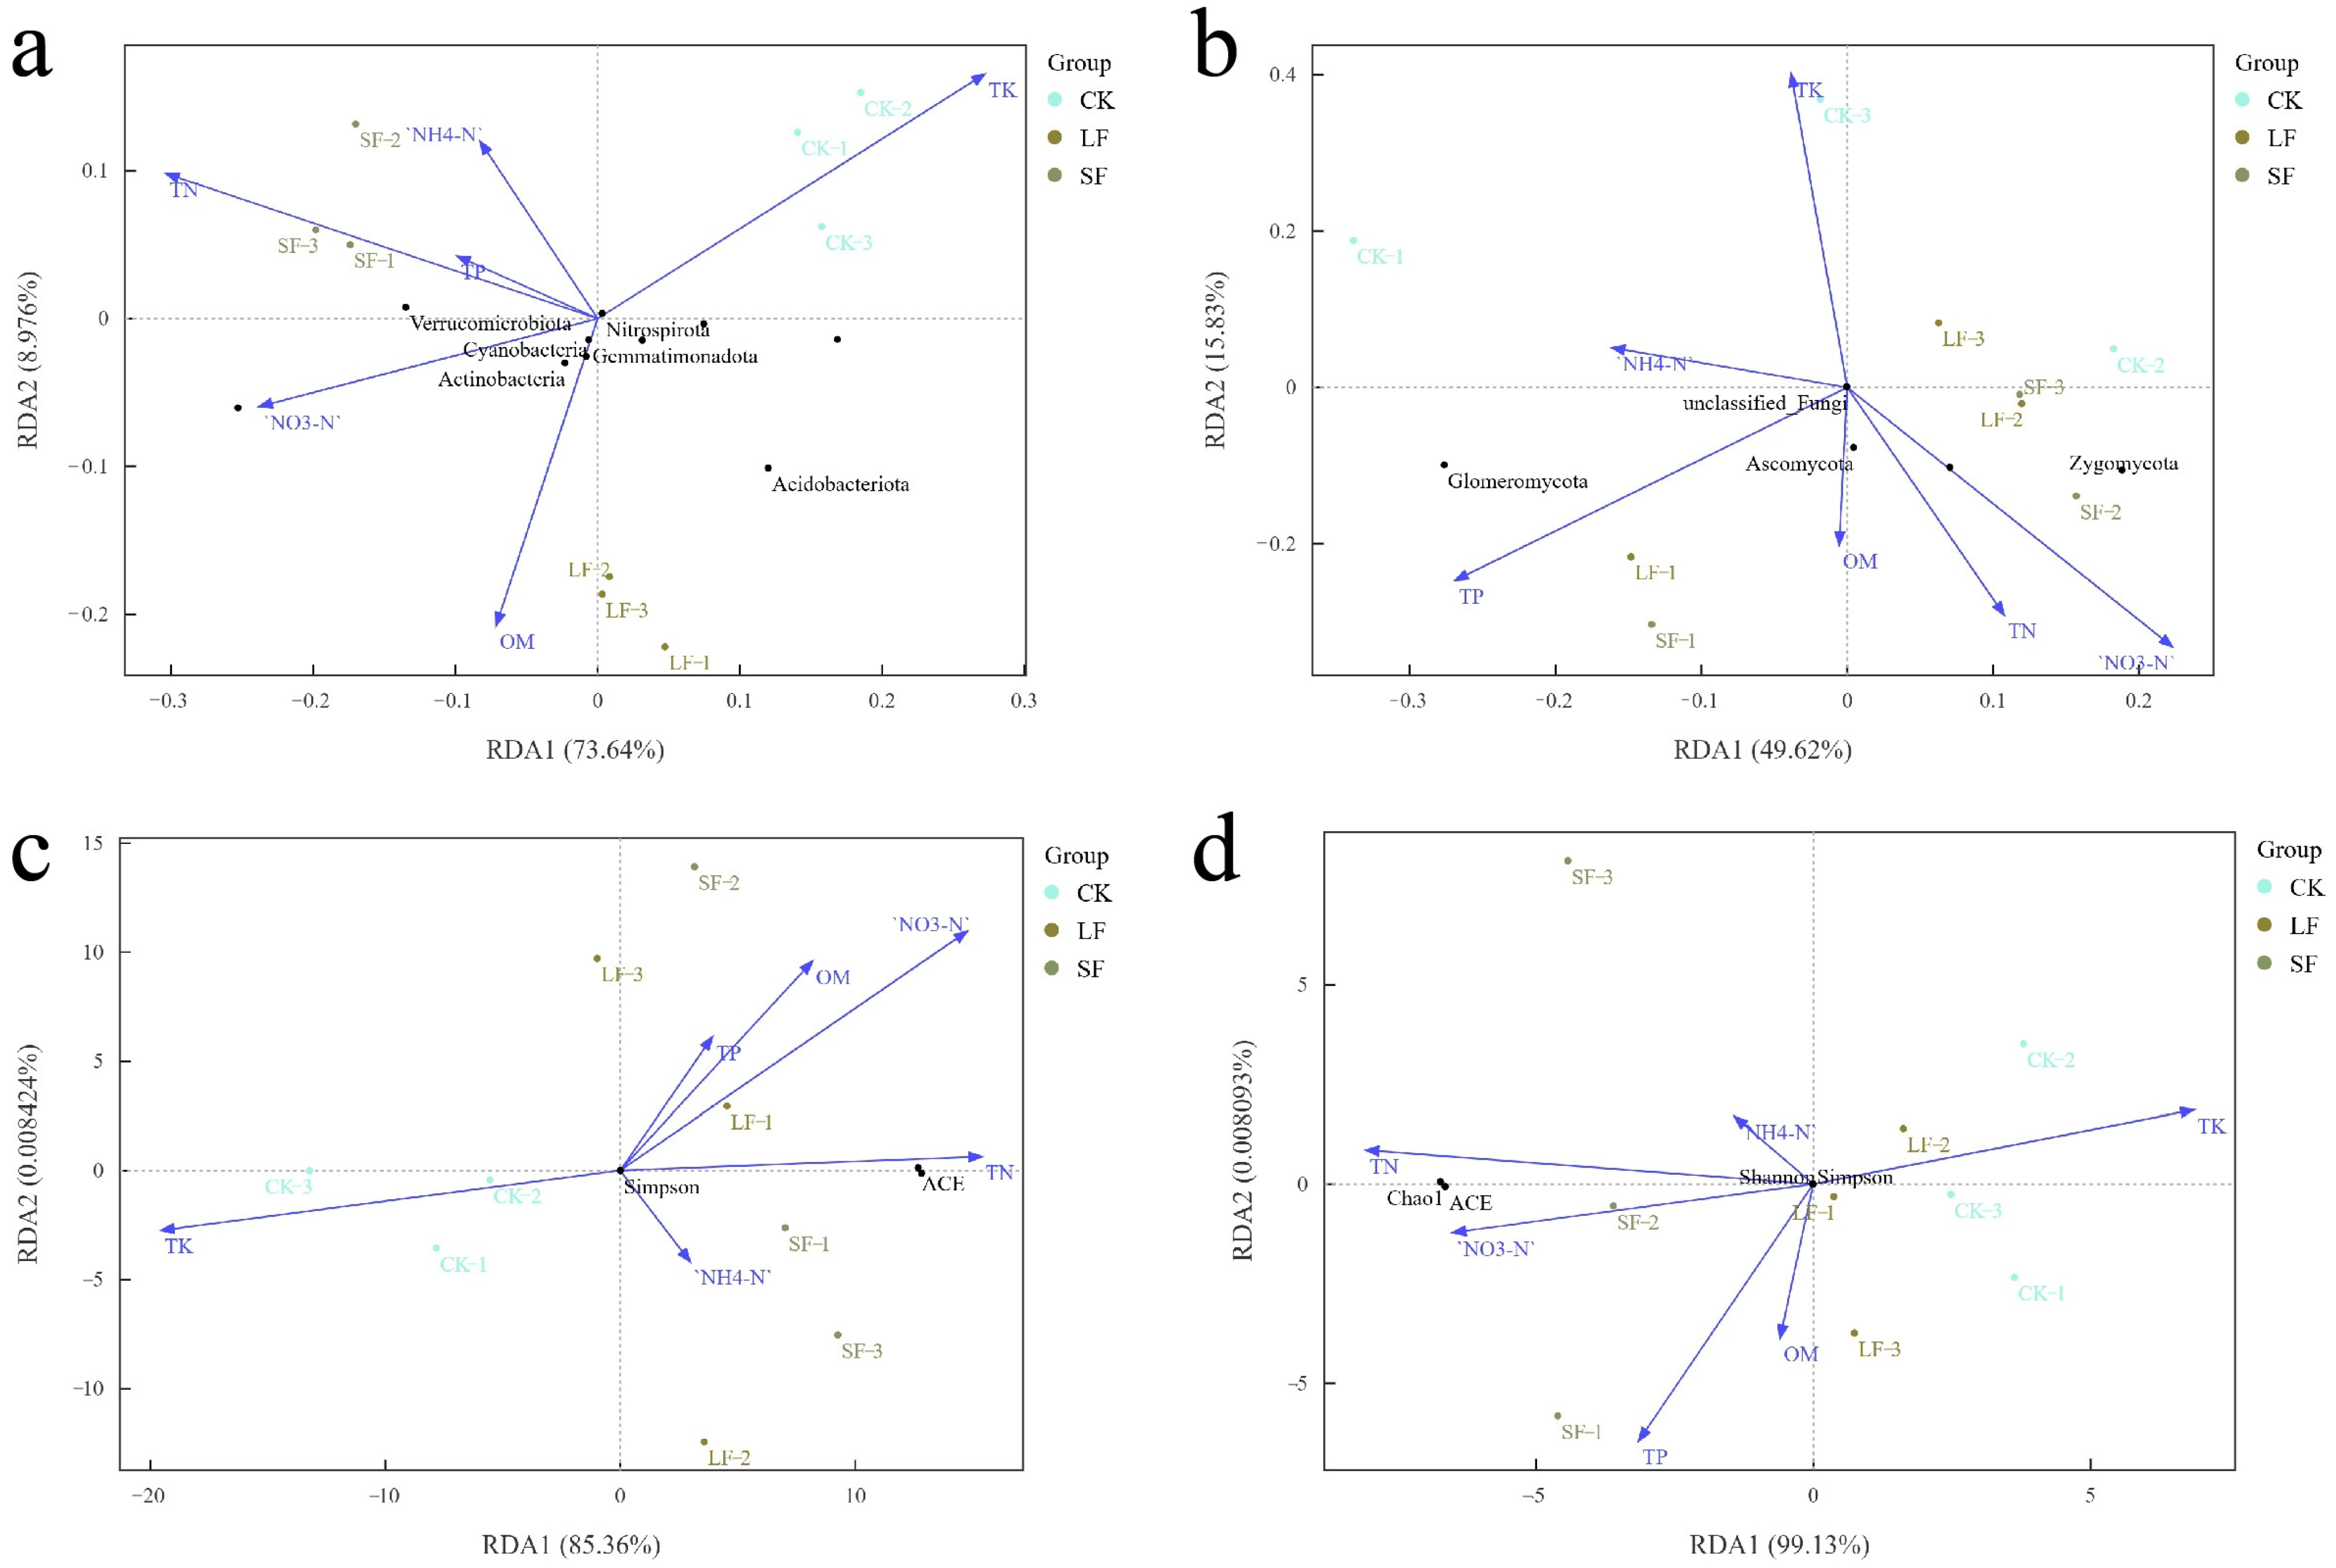
Redundancy analysis (RDA) was conducted to dissect associations between soil physicochemical properties (total N, total P, total K, NH4+-N, NO3-N, organic matter, pH) and P. notoginseng rhizosphere microorganisms, with results presented in Figure 12. Vector arrow length and direction in the RDA ordination plot indicate the correlation between microbial communities and soil chemical properties. For bacterial phyla, soil factors collectively explained 82.61% of variance: total N, total P, and NH4+-N were positively correlated with Verrucomicrobia; organic matter correlated positively with Actinobacteria and Gemmatimonadetes. Among these, total nitrogen and organic matter emerged as core drivers of bacterial phylum communities, with the broadest influence. For fungal phyla, the total explanatory power was 65.45%: total nitrogen showed a positive correlation with Glomeromycota; nitrate nitrogen was positively correlated with Mucoromycota; organic matter was positively correlated with Ascomycota. Total nitrogen and nitrate nitrogen were the core drivers shaping fungal phylum community structure, exerting the most extensive influence. For bacterial diversity (ACE, Chao1, Shannon, and Simpson indices), soil factors collectively explained 85.37% of variance; total nitrogen and ammonium nitrogen correlated positively with ACE and Simpson indices, with total N as the dominant factor exhibiting the broadest influence. For fungal diversity (involving ACE, Chao1, Shannon, and Simpson indices), the total explanatory rate was as high as 99.13%; total nitrogen and nitrate nitrogen were positively correlated with ACE and Chao1 indices, both exerting considerable influences. In summary, soil total nitrogen exerted the strongest overall influence on P. notoginseng rhizosphere microorganisms, encompassing bacterial phyla, fungal phyla, and their diversity.

4. Discussion

4.1. Effects of Growth-Promoting Fungi on Root Exudates

Rhizosphere soil metabolites, pivotal mediators of material exchange between plant roots and the external environment, directly mirror rhizosphere microecological equilibrium through their composition and dynamic fluctuations [33]. Root-released organic compounds (carbohydrates, organic acids, amino acids [34]) not only provide energy and nutrients for rhizosphere microbial survival but also modulate microbial community structure and function through signal transmission, thereby influencing soil nutrient transformation efficiency and plant growth [35,36]. Ecologically, they function as “regulators” of the rhizosphere microenvironment: by altering microbial activity and facilitating material cycling, they indirectly boost plant nutrient uptake capacity and stress tolerance [24]. In this study, the changes in chlorophyll content and other biomass-related traits of the plants may be associated with the growth-promoting functions of the fungus. Endophytic fungi with growth-promoting capabilities, such as phosphate-solubilizing and IAA-producing activities, can promote plant growth, thereby altering plant biomass [37,38].
Exogenous microbial introduction typically disturbs the inherent balance of rhizosphere metabolism. Prior studies have verified that microbial inoculation can markedly alter the types and contents of rhizosphere metabolites via their own metabolism or by inducing plant root secretion [39]. These changes are non-random, reflecting synergistic environmental adaptation by microorganisms and plants. For example, endophytic fungi enhance host resistance to adverse conditions by regulating metabolite synthesis [40,41]. In this study, distinct S. terrestris treatments differentially affected P. notoginseng rhizosphere metabolism, implying that SF may have stimulated the activity of rhizosphere microorganisms through more efficient metabolite release or signal transmission, thereby improving the overall metabolic level. The differential effects of SF and LF treatments of S. terrestris on rhizosphere metabolism may be attributed to the regulatory differences in microbial colonization, metabolite release, and microenvironmental interactions caused by formulation characteristics. The solid matrix of SF (e.g., rice husk) provides physical protection and attachment surfaces for fungi; its porous structure simulates the soil microenvironment, reduces interference, and improves colonization stability. In contrast, the free spores or hyphae in LF are susceptible to adsorption by soil particles and dilution by water, resulting in lower colonization efficiency. Meanwhile, SF achieves the sustained release of metabolites (such as enzymes and organic acids) through the slow degradation of the matrix, forming a stable rhizosphere metabolic gradient, whereas the metabolites in LF sharply decrease in concentration due to rapid diffusion, making it difficult to exert continuous effects. This difference enables SF to more effectively stimulate microbial activity: the complex organic matter in the solid matrix induces fungi to preferentially synthesize extracellular enzymes, enhancing the coupling with soil nutrient cycles. Previous studies support this pattern. Recent research findings have shown that solid fermentation (SF) enhances microbial colonization ability, enzyme activity, and long-term biological functions through structural stability, sustained release of metabolites, and compatibility with the microenvironment of rhizosphere ecology. In contrast, although liquid fermentation (LF) can rapidly produce metabolites, its efficacy is limited due to environmental sensitivity and transient interactions [42,43,44].
Metabolic pathway shifts are pivotal for deciphering rhizosphere metabolic regulation. As ubiquitous “material transporters”, ABC transporters mediate secondary metabolite transport, potentially accelerating the transfer and utilization of beneficial rhizosphere substances [45]. Meanwhile, purine metabolism activation supports the rhizosphere microecology in two aspects: energy supply and nitrogen source utilization. Purine substances ensure energy supply by participating in ATP synthesis, with their degradation products serving as nitrogen sources by plants [46,47]. Setophoma terrestris-mediated regulation of these pathways essentially entails optimizing rhizosphere material and energy metabolism to construct a more favorable microenvironment for P. notoginseng growth. This also provides a metabolic-level theoretical basis for using microorganisms to regulate plant growth. The identification of metabolites in this study focuses on the overall trends of major categories. The structural confirmation of individual compounds requires further experimental support; however, the functions of these categories (such as purines and saponins) are consistent with those reported in existing studies, which does not affect the overall conclusion. Furthermore, structurally related compounds may exhibit similar biological activities. For instance, homologs of notoginsenoside R1 may be synchronously reduced to alleviate autotoxicity, and analogs of purine metabolites may synergistically participate in energy and nitrogen metabolism. This hypothesis requires verification through subsequent in vitro activity assays.

4.2. Effects of Growth-Promoting Fungi on Soil Chemical Properties

Soil chemical properties are core indicators of soil fertility, with microorganisms driving their improvement [48]. In natural ecosystems, microorganisms decompose organic matter and transform nutrient forms, converting unavailable substances into plant-absorbable forms. Meanwhile, they contribute to humus formation, boosting soil water- and nutrient-retention capacities [49,50]. This role is not isolated but interfaces with soil physical structure and biological communities to collectively maintain soil health.
Soil chemical property improvement by growth-promoting fungi stems fundamentally from the interaction between their metabolic activities and the soil environment [51]. They secrete enzymes to decompose organic substances, releasing elements (e.g., nitrogen, carbon) to elevate soil nutrient levels. Additionally, their metabolites may regulate soil colloid structure, affect physicochemical parameters such as pH, and indirectly improve soil aeration and nutrient retention [52]. From an agricultural application standpoint, such microorganism-mediated soil improvement is sustainable. Relative to chemical fertilizers, microorganisms modulate soil properties via natural metabolic processes, avoiding nutrient loss and environmental pollution while sustaining soil fertility balance through long-term effects [53].
Setophoma terrestris-mediated improvement of P. notoginseng rhizosphere soil aligns with the functional pattern of most growth-promoting fungi. Its processes of increasing soil nitrogen content and organic matter, as well as regulating pH, reflect the dynamic coupling between microorganisms and the soil nutrient pool: organic nitrogen is decomposed into available forms, while soil organic matter is supplemented via its residues and metabolites, forming a closed “microorganism-soil-plant” nutrient cycle. This improvement entails not the enhancement of a single indicator but the synergistic optimization of overall soil fertility, furnishing a stable nutrient supply for plant growth.

4.3. Effects of Growth-Promoting Fungi on Rhizosphere Soil Microbial Community Structure

Soil microbial communities are core components of the rhizosphere microecology, and their structural diversity and functional stability directly determine the service capacity of soil ecosystems [54]. Exogenous microbial introduction functions as a “regulator” in the community, reshaping the original community structure through resource competition, signal crosstalk, or microenvironment modification [55]. This reshaping entails not simple species replacement but community function optimization via enriching beneficial microorganisms and inhibiting harmful populations. For example, increased abundance of nutrient-transforming bacterial genera may improve soil nutrient use efficiency, while elevated disease-resistant microbial abundance can enhance plant resistance to diseases [56].
Growth-promoting fungal regulation of microbial communities adheres to clear ecological logic: they may inhibit pathogens via antimicrobial secretion or expand ecological niches by forming symbiotic relationships with beneficial microorganisms, ultimately establishing a more stable community structure [57]. In terms of diversity, increased community richness and evenness denote stronger environmental adaptability. Diverse microbial groups can perform different ecological functions, circumventing functional imbalance arising from environmental fluctuations affecting a single species [58]. Meanwhile, shifts in microbial communities and improvements in soil physicochemical properties often form a positive feedback loop: optimized community structure promotes nutrient transformation, and elevated nutrient content provides more abundant resources for microorganisms, further reinforcing community stability. In this study, Glomeromycota, a phylum encompassing typical arbuscular mycorrhizal fungi (AMF), was detected at the fungal phylum level. At the genus level, AMF-related taxa such as Paraglomus were also observed. Among the treatment groups, the liquid fermentate (LF) significantly increased the relative abundance of Paraglomus, suggesting that S. terrestris may indirectly affect nutrient uptake in P. notoginseng by regulating AMF communities. It should be noted that this study did not determine the colonization rate of AMF in roots (e.g., hyphal infection rate). Subsequent studies could supplement this data through microscopic observation to more accurately clarify the role of AMF in the growth-promoting process of S. terrestris.
Setophoma terrestris-mediated regulation of P. notoginseng rhizosphere microorganisms reflects the synergistic adaptation between endophytic fungi and the host rhizosphere. Enriched phyla (e.g., Proteobacteria, Basidiomycota) are pivotal for nutrient uptake and organic matter decomposition, whereas reduced Acidobacteria abundance may correlate with elevated soil pH, indicative of microbial community adaptation to environmental shifts. This microbial-mediated community optimization ultimately provides ecological support for P. notoginseng growth by improving soil nutrient cycling efficiency and microenvironment stability, while offering practical insights into plant–microbe interaction mechanisms.
Since this experiment was conducted in a field, the results of this study are highly reproducible in the main production areas of Panax notoginseng (with similar soil and climate conditions). In the future, multi-location verification can be carried out to test the stability under different environments.

5. Conclusions

Exogenous application of S. terrestris markedly enhanced the growth of P. notoginseng, as evidenced by increased chlorophyll and total saponin contents, and improved plant height and fresh/dry weights.
It profoundly affected P. notoginseng rhizosphere soil metabolism: SF treatment exhibited a higher metabolic level relative to LF treatment.
In total, 1635 differential metabolites (892 upregulated) were identified in SF vs. CK, whereas 553 (171 upregulated) were detected in LF vs. CK. This fungus reduced pathogenic toxic metabolites (e.g., enniatin) and harmful components (e.g., notoginsenoside R), while increasing the abundance of key purine pathway products (e.g., adenine).
In terms of soil improvement, S. terrestris augmented soil fertility: both treatments increased total nitrogen content and soil pH, with the SF treatment significantly elevating ammonium nitrogen and the LF treatment markedly increasing organic matter.
Notable soil microbial community regulatory effects were observed: it increased the abundance of dominant groups (e.g., bacterial Proteobacteria, fungal Mucoromycota) and elevated the proportions of nitrogen-fixing bacteria (e.g., Bradyrhizobium) and Mortierella. Additionally, it significantly altered microbial richness and enhanced bacterial–fungal network complexity (evidenced by increased node and edge counts).
Soil total nitrogen, ammonium nitrogen, and organic matter were recognized as key drivers shaping microbial communities, thereby substantiating the mechanism underpinning S. terrestris-mediated growth promotion in P. notoginseng.

Author Contributions

Funding acquisition, Y.M. and J.L. (Junjia Lu); Investigation, Y.S. and S.L.; Methodology, H.L. and J.L. (Jian Liu); Resources, M.W.; Validation, J.L. (Jian Liu); Writing—original draft, H.L.; Writing—review and editing, H.L. All authors have read and agreed to the published version of the manuscript.

Funding

This research was funded by the Yunnan Provincial National Natural Science Foundation Project (32060695), the Young Talent Projet of the “Xingdian Talents Support Plant” in Yunnan Province and the Yunnan Agricultural Joint Special Project (202301BD070001—091), the China Agriculture Research System (CARS-21), This work was supported by National Natural Science Foundation of China (32260720).

Institutional Review Board Statement

Not applicable.

Informed Consent Statement

Not applicable.

Data Availability Statement

The data from this trial can be found in the document. Reagents, microbial materials, and datasets used, created, and analyzed in the study are available upon request to the corresponding author. The genomic sequencing data mentioned in this study are stored in the Sequence Read Archive (SRA) database of the National Center for Biotechnology Information (NCBI) and can be accessed via the NCBI database. The source data are presented in the form of additional source datasets.

Acknowledgments

The authors thank J.L. (Jian Liu), Y.S., M.W., S.L., Y.M. and J.L. (Junjia Lu) for their critical reading of the manuscript.

Conflicts of Interest

The authors declare that the research was conducted in the absence of any commercial or financial relationships that could be construed as a potential conflict of interest.

References

  1. Mancuso, C. Panax notoginseng: Pharmacological Aspects and Toxicological Issues. Nutrients 2024, 16, 2120. [Google Scholar] [CrossRef]
  2. Pu, R.; Cheng, Y.; Zeng, J.; Wang, H.; Li, N.; Gao, M.; Ma, J.; Cui, X. Metabolomic and transcriptomic analysis of Panax Notoginseng root: Mechanistic insights into the effects of flower bud removal on yield and phytochemical composition. Ind. Crops Prod. 2025, 223, 120138. [Google Scholar] [CrossRef]
  3. Li, Y.; Dai, S.; Wang, B.; Jiang, Y.; Ma, Y.; Pan, L.; Wu, K.; Huang, X.; Zhang, J.; Cai, Z.; et al. Autotoxic Ginsenoside Disrupts Soil Fungal Microbiomes by Stimulating Potentially Pathogenic Microbes. Appl. Environ. Microbiol. 2020, 86, e00130-20. [Google Scholar] [CrossRef]
  4. Salvi, P.; Mahawar, H.; Agarrwal, R.; Kajal; Gautam, V.; Deshmukh, R. Advancement in the molecular perspective of plant-endophytic interaction to mitigate drought stress in plants. Front. Microbiol. 2022, 13, 981355. [Google Scholar] [CrossRef] [PubMed]
  5. Xie, X.-G.; Zhang, F.-M.; Yang, T.; Chen, Y.; Li, X.-G.; Dai, C.-C. Endophytic Fungus Drives Nodulation and N2 Fixation Attributable to Specific Root Exudates. mBio 2019, 10, 1128. [Google Scholar] [CrossRef] [PubMed]
  6. Ancheeva, E.; Daletos, G.; Proksch, P. Bioactive Secondary Metabolites from Endophytic Fungi. Curr. Med. Chem. 2020, 27, 1836–1854. [Google Scholar] [CrossRef]
  7. Jha, P.; Kaur, T.; Chhabra, I.; Panja, A.; Paul, S.; Kumar, V.; Malik, T. Endophytic fungi: Hidden treasure chest of antimicrobial metabolites interrelationship of endophytes and metabolites. Front. Microbiol. 2023, 14, 1227830. [Google Scholar] [CrossRef]
  8. Pellissier, L.; Gaudry, A.; Vilette, S.; Lecoultre, N.; Rutz, A.; Allard, P.-M.; Marcourt, L.; Ferreira Queiroz, E.; Chave, J.; Eparvier, V.; et al. Comparative metabolomic study of fungal foliar endophytes and their long-lived host Astrocaryum sciophilum: A model for exploring the chemodiversity of host-microbe interactions. Front. Plant Sci. 2023, 14, 1278745. [Google Scholar] [CrossRef] [PubMed]
  9. Liu, Y.; Hou, Y.M.; Sun, Y.B.; Zhang, Z.S.; Jin, C.X. Isolation of Endophytic Bacteria from Panax notoginseng and Optimization of Fermentation Conditions for Saponin Production. J. Dalian Polytech. Univ. 2016, 35, 15–18. [Google Scholar]
  10. Huang, Y.; Dong, L.; Wei, G.; Zhang, X. Development and Evaluation of a Biocontrol Agent against Panax Root Rot. Chin. J. Exp. Tradit. Med. Formulae 2022, 28, 182–190. [Google Scholar]
  11. Zhang, J.L.; Mao, C.P. Isolation of Endophytic Actinomycetes from Panax notoginseng and Their Antagonistic Activity against Root Rot Pathogens of Panax notoginseng. J. Microbiol. 2023, 43, 85–91. [Google Scholar]
  12. Xu, Z.X.; Zhu, X.M.; Yin, H.; Li, B.; Chen, X.J.; Fan, X.L.; Li, N.Q.; Selosse, M.A.; Gao, J.Y.; Han, J.J. Symbiosis between Dendrobium catenatum protocorms and Serendipita indica involves the plant hypoxia response pathway. Plant Physiol. 2023, 192, 2554–2568. [Google Scholar] [CrossRef]
  13. Pu, L.F.; Du, W.B.; Wu, L.Y. Preliminary Studies on the Bioprophylactic and Growth-Promoting Effects of an Endophytic Fungus of Lycium barbarum. J. Org. Chem. Res. 2024, 12, 582–588. [Google Scholar] [CrossRef]
  14. Sanneboyina, N.; Audipudi, A.V. Fungal Antagonism and Plant Growth Promoting Efficacy of Aspergillus oryzaeAVNF4 isolated from the Rhizome of Curcuma longa on Lycopersicum esculantum L. (tomato). Curr. Agri. Res. 2024, 12, 1153. [Google Scholar] [CrossRef]
  15. Adeleke, B.S.; Fadiji, A.E.; Ayilara, M.S.; Igiehon, O.N.; Nwachukwu, B.C.; Babalola, O.O. Strategies to Enhance the Use of Endophytes as Bioinoculants in Agriculture. Horticulturae 2022, 8, 498. [Google Scholar] [CrossRef]
  16. Asiloglu, R.; Bodur, S.O.; Samuel, S.O.; Aycan, M.; Murase, J.; Harada, N. Trophic modulation of endophytes by rhizosphere protists. ISME J. 2024, 18, wrae235. [Google Scholar] [CrossRef] [PubMed]
  17. Bhardwaj, M.; Kailoo, S.; Khan, R.T.; Khan, S.S.; Rasool, S. Harnessing fungal endophytes for natural management: A biocontrol perspective. Front. Microbiol. 2023, 14, 1280258. [Google Scholar] [CrossRef]
  18. Jin, Y.; Chen, Z.; White, J.F.; Malik, K.; Li, C. Interactions between Epichloë endophyte and the plant microbiome impact nitrogen responses in host Achnatherum inebrians plants. Microbiol. Spectr. 2024, 12, e0257423. [Google Scholar] [CrossRef]
  19. Zhang, Y.; Xue, C.; Wang, X.; Zhang, J.; Wang, A.; Yang, Y.; Jia, X.; Zhang, W.; Zhao, M. The control effect of endophytic fungus Fusarium equiseti FUS-8 on cotton Verticillium wilt and its effects on soil microbial communities. Plant Soil 2024, 512, 1221–1241. [Google Scholar] [CrossRef]
  20. Seema, N.; Hamayun, M.; Ara, H.; Khan, R.S. Inoculation of Sunflower with Endophytic Fungi Alters Soil Physio-Chemical Properties to Nullify Drought Stress. Sarhad J. Agric. 2019, 35, 109–115. [Google Scholar] [CrossRef]
  21. Lee, S.Y.; Ra, C.H. Comparison of Liquid and Solid-State Fermentation Processes for the Production of Enzymes and Beta-Glucan from Hulled Barley. J. Microbiol. Biotechnol. 2022, 32, 317–323. [Google Scholar] [CrossRef]
  22. Wang, J.Y.; Zhang, M.Z.; Ling, H.R.; Wang, Z.T.; Gai, J.Y. A Hyperspectral Image-Based Method for Estimating Water and Chlorophyll Contents in Maize Leaves Under Drought Stress. Smart Agric. 2023, 5, 142–153. [Google Scholar] [CrossRef]
  23. Ma, D.; Wang, J.; Yin, G.; Wang, L.; Jin, Y.; Huang, Y.; Bi, K.; Lu, Y.; Wang, T. The Study of Steaming Durations and Temperatures on the Chemical Characterization, Neuroprotective, and Antioxidant Activities of Panax notoginseng. Evid.-Based Complement. Altern. Med. 2022, 2022, 3698518. [Google Scholar] [CrossRef]
  24. Baker, N.R.; Zhalnina, K.; Yuan, M.; Herman, D.; Ceja-Navarro, J.A.; Sasse, J.; Jordan, J.S.; Bowen, B.P.; Wu, L.; Fossum, C.; et al. Nutrient and moisture limitations reveal keystone metabolites linking rhizosphere metabolomes and microbiomes. Proc. Natl. Acad. Sci. USA 2024, 121, e2303439121. [Google Scholar] [CrossRef]
  25. Zhang, X.-K.; Wu, Y.; Long, X.-N.; You, X.-X.; Chen, D.; Bi, Y.; He, S.; Cao, G.-H. Widely Targeted Metabolomic Analysis Reveals the Improvement in Panax notoginseng Triterpenoids Triggered by Arbuscular Mycorrhizal Fungi via UPLC–ESI–MS/MS. Molecules 2024, 29, 3235. [Google Scholar] [CrossRef]
  26. Hossen, M.A.; Diwakar, P.K.; Ragi, S. Total nitrogen estimation in agricultural soils via aerial multispectral imaging and LIBS. Sci. Rep. 2021, 11, 12693. [Google Scholar] [CrossRef]
  27. Bao, S.D. Oil Agricultural Chemistry Analysis (M); China Agriculture Press: Beijing, China, 2000; pp. 34–36, 45–50, 55–59, 80–81, 106. [Google Scholar]
  28. Liu, J.; Dong, Z.; Xia, J.; Wang, H.; Meng, T.; Zhang, R.; Han, J.; Wang, N.; Xie, J. Estimation of soil organic matter content based on CARS algorithm coupled with random forest. Spectrochim. Acta A 2021, 258, 119823. [Google Scholar] [CrossRef]
  29. Faria, M.; Bertocco, T.; Barroso, A.; Carvalho, M.; Fonseca, F.; Delerue Matos, C.; Figueiredo, T.; Sequeira Braga, A.; Valente, T.; Jiménez-Ballesta, R. A Comparison of Analytical Methods for the Determination of Soil pH: Case Study on Burned Soils in Northern Portugal. Fire 2023, 6, 227. [Google Scholar] [CrossRef]
  30. Wang, B.; Geng, Y.; Lin, Y.; Xia, Q.; Wei, F.; Yang, S.; Huang, X.; Zhang, J.; Cai, Z.; Zhao, J. Root rot destabilizes the Sanqi rhizosphere core fungal microbiome by reducing the negative connectivity of beneficial microbes. Appl. Environ. Microbiol. 2024, 90, e0223723. [Google Scholar] [CrossRef]
  31. Fu, X.; Fu, Q.; Zhu, X.; Yang, X.; Chen, H.; Li, S. Microdiversity sustains the distribution of rhizosphere-associated bacterial species from the root surface to the bulk soil region in maize crop fields. Front. Plant Sci. 2023, 14, 1266218. [Google Scholar] [CrossRef]
  32. Spatafora, J.W.; Chang, Y.; Benny, G.L.; Lazarus, K.; Smith, M.E.; Berbee, M.L.; Bonito, G.; Corradi, N.; Grigoriev, I.; Gryganskyi, A.; et al. A phylum-level phylogenetic classification of zygomycete fungi based on genome-scale data. Mycologia 2016, 108, 1028–1046. [Google Scholar] [CrossRef] [PubMed]
  33. Keren, G.; Yehezkel, G.; Satish, L.; Adamov, Z.; Barak, Z.; Ben-Shabat, S.; Kagan-Zur, V.; Sitrit, Y. Root-secreted nucleosides: Signaling chemoattractants of rhizosphere bacteria. Front. Plant Sci. 2024, 15, 1388384. [Google Scholar] [CrossRef] [PubMed]
  34. Ma, J.; Liu, D.; Zhao, P.; Dou, M.; Yang, X.; Liu, S.; Nian, F.; Tong, W.; Li, J.; Xu, Z.; et al. Intercropping of tobacco and maize at seedling stage promotes crop growth through manipulating rhizosphere microenvironment. Front. Plant Sci. 2024, 15, 1470229. [Google Scholar] [CrossRef]
  35. Chen, Q.; Song, Y.; An, Y.; Lu, Y.; Zhong, G. Mechanisms and Impact of Rhizosphere Microbial Metabolites on Crop Health, Traits, Functional Components: A Comprehensive Review. Molecules 2024, 29, 5922. [Google Scholar] [CrossRef]
  36. Maitra, P.; Hrynkiewicz, K.; Szuba, A.; Jagodziński, A.M.; Al-Rashid, J.; Mandal, D.; Mucha, J. Metabolic niches in the rhizosphere microbiome: Dependence on soil horizons, root traits and climate variables in forest ecosystems. Front. Plant Sci. 2024, 15, 1344205. [Google Scholar] [CrossRef]
  37. Fite, T.; Kebede, E.; Tefera, T.; Bekeko, Z. Endophytic fungi: Versatile partners for pest biocontrol, growth promotion, and climate change resilience in plants. Front. Sustain. Food Syst. 2023, 7, 1322861. [Google Scholar] [CrossRef]
  38. Waqas, M.; Khan, A.L.; Kamran, M.; Hamayun, M.; Kang, S.M.; Kim, Y.H.; Lee, I.J. Endophytic fungi produce gibberellins and indoleacetic acid and promotes host-plant growth during stress. Molecules 2012, 17, 10754–10773. [Google Scholar] [CrossRef]
  39. Liswadiratanakul, S.; Yamamoto, K.; Matsutani, M.; Wattanadatsaree, V.; Kihara, S.; Shiwa, Y.; Shiwachi, H. Replacement of water yam (Dioscorea alata L.) indigenous root endophytes and rhizosphere bacterial communities via inoculation with a synthetic bacterial community of dominant nitrogen-fixing bacteria. Front. Microbiol. 2023, 14, 1060239. [Google Scholar] [CrossRef]
  40. Li, Z.; Xiong, K.; Wen, W.; Li, L.; Xu, D. Functional Endophytes Regulating Plant Secondary Metabolism: Current Status, Prospects and Applications. Int. J. Mol. Sci. 2023, 24, 1153. [Google Scholar] [CrossRef] [PubMed]
  41. Wang, P.; Yang, L.; Sun, J.; Yang, Y.; Qu, Y.; Wang, C.; Liu, D.; Huang, L.; Cui, X.; Liu, Y. Structure and Function of Rhizosphere Soil and Root Endophytic Microbial Communities Associated with Root Rot of Panax notoginseng. Front. Plant Sci. 2021, 12, 752683. [Google Scholar] [CrossRef]
  42. Souza, A.A.; Leitão, V.O.; Ramada, M.H.; Mehdad, A.; Georg Rde, C.; Ulhôa, C.J.; de Freitas, S.M. Trichoderma harzianum Produces a New Thermally Stable Acid Phosphatase, with Potential for Biotechnological Application. PLoS ONE 2016, 11, e0150455. [Google Scholar] [CrossRef]
  43. Zhang, J.; Song, J.; Wei, J.; Qi, S.; Li, J.; Jin, Y.; Luan, X.; Li, P.; Yan, J. Effect of Purpureocillium lilacinum on inter-root soil microbial community and metabolism of tobacco. Ann. Microbiol. 2023, 73, 30. [Google Scholar] [CrossRef]
  44. Mousumi Das, M.; Haridas, M.; Sabu, A. Process development for the enhanced production of bio-nematicide Purpureocillium lilacinum KU8 under solid-state fermentation. Bioresour. Technol. 2020, 308, 123328. [Google Scholar] [CrossRef]
  45. Liu, H.; Su, Y.; Ye, C.; Zuo, D.; Wang, L.; Mei, X.; Deng, W.; Liu, Y.; Huang, H.; Hao, J.; et al. Nucleotides enriched under heat stress recruit beneficial rhizomicrobes to protect plants from heat and root-rot stresses. Microbiome 2025, 13, 160. [Google Scholar] [CrossRef]
  46. Sun, M.; Dai, P.; Cao, Z.; Dong, J. Purine metabolism in plant pathogenic fungi. Front. Microbiol. 2024, 15, 1352354. [Google Scholar] [CrossRef]
  47. Lee, D.; Park, T.-H.; Lim, K.; Jeong, M.; Nam, G.; Kim, W.-C.; Shin, J.-H. Biofumigation-Derived Soil Microbiome Modification and Its Effects on Tomato (Solanum lycopersicum L.) Health under Drought. Agronomy 2024, 14, 2225. [Google Scholar] [CrossRef]
  48. Wang, S.; Huo, J.; Wu, D.; Li, J.; Chen, X.; Hu, F.; Liu, M. Earthworms increase soil carbon dioxide emissions through changing microbial community structure and activity under high nitrogen addition. Appl. Soil Ecol. 2024, 196, 105297. [Google Scholar] [CrossRef]
  49. Elmaghraby, M.M.K.; Abdellatif, A.A.M.; Amer, M.N.; Sahu, P.K. Enhancing Productivity Through Multiple Microbial Inoculants. In Metabolomics, Proteomes and Gene Editing Approaches in Biofertilizer Industry; Kaur, S., Dwibedi, V., Sahu, P.K., Kocher, G.S., Eds.; Springer Nature: Singapore, 2023; pp. 117–137. [Google Scholar]
  50. Kiprotich, K.; Muoma, J.; Omayio, D.O.; Ndombi, T.S.; Wekesa, C. Molecular Characterization and Mineralizing Potential of Phosphorus Solubilizing Bacteria Colonizing Common Bean (Phaseolus vulgaris L.) Rhizosphere in Western Kenya. Int. J. Microbiol. 2023, 2023, 6668097. [Google Scholar] [CrossRef]
  51. Shi, H.; Lu, L.; Ye, J.; Shi, L. Effects of Two Bacillus Velezensis Microbial Inoculants on the Growth and Rhizosphere Soil Environment of Prunus davidiana. Int. J. Mol. Sci. 2022, 23, 13639. [Google Scholar] [CrossRef]
  52. Gong, Z.; Liu, L.; Chou, Z.; Deng, S.; Tang, J.; Xiang, W.; Chen, X.; Li, Y. Efficient cadmium-resistant plant growth-promoting bacteria loaded on pig bone biochar has higher efficiency in reducing cadmium phytoavailability and improving maize performance than on rice husk biochar. J. Hazard. Mater. 2024, 479, 135609. [Google Scholar] [CrossRef]
  53. Shao, D.; He, Y.; Zhai, Y.; Yang, X.; Guo, Z.; Tan, J.; Wei, M. Mechanisms of tomato growth promotion in three soils after applying Bacillus combinations. Soil Tillage Res. 2025, 249, 106477. [Google Scholar] [CrossRef]
  54. Li, Y.; Wang, J.; Li, E.; Yang, X.; Yang, J. Shifts in Microbial Community Structure and Co-occurrence Network along a Wide Soil Salinity Gradient. Microorganisms 2024, 12, 1268. [Google Scholar] [CrossRef]
  55. Yang, X.; Feng, Q.; Zhu, M.; Zhang, J.; Yang, L.; Li, R. The Impact of Artificial Restoration of Alpine Grasslands in the Qilian Mountains on Vegetation, Soil Bacteria, and Soil Fungal Community Diversity. Microorganisms 2024, 12, 854. [Google Scholar] [CrossRef]
  56. Kong, J.; He, Z.; Chen, L.; Yang, R.; Du, J. Efficiency of biochar, nitrogen addition, and microbial agent amendments in remediation of soil properties and microbial community in Qilian Mountains mine soils. Ecol. Evol. 2021, 11, 9318–9331. [Google Scholar] [CrossRef]
  57. Li, Y.; Liu, X.; Li, Q.; Guo, Y.; Zhang, Y.; Wang, C.; Zhou, Q.; Wu, Z. PGPR Promotes the Recovery of Submerged Macrophytes via Indigenous Microbiome Modulations under Combined Abiotic Stress. Water 2023, 15, 590. [Google Scholar] [CrossRef]
  58. Wang, H.; Liu, R.; You, M.P.; Barbetti, M.J.; Chen, Y. Pathogen Biocontrol Using Plant Growth-Promoting Bacteria (PGPR): Role of Bacterial Diversity. Microorganisms 2021, 9, 1988. [Google Scholar] [CrossRef] [PubMed]
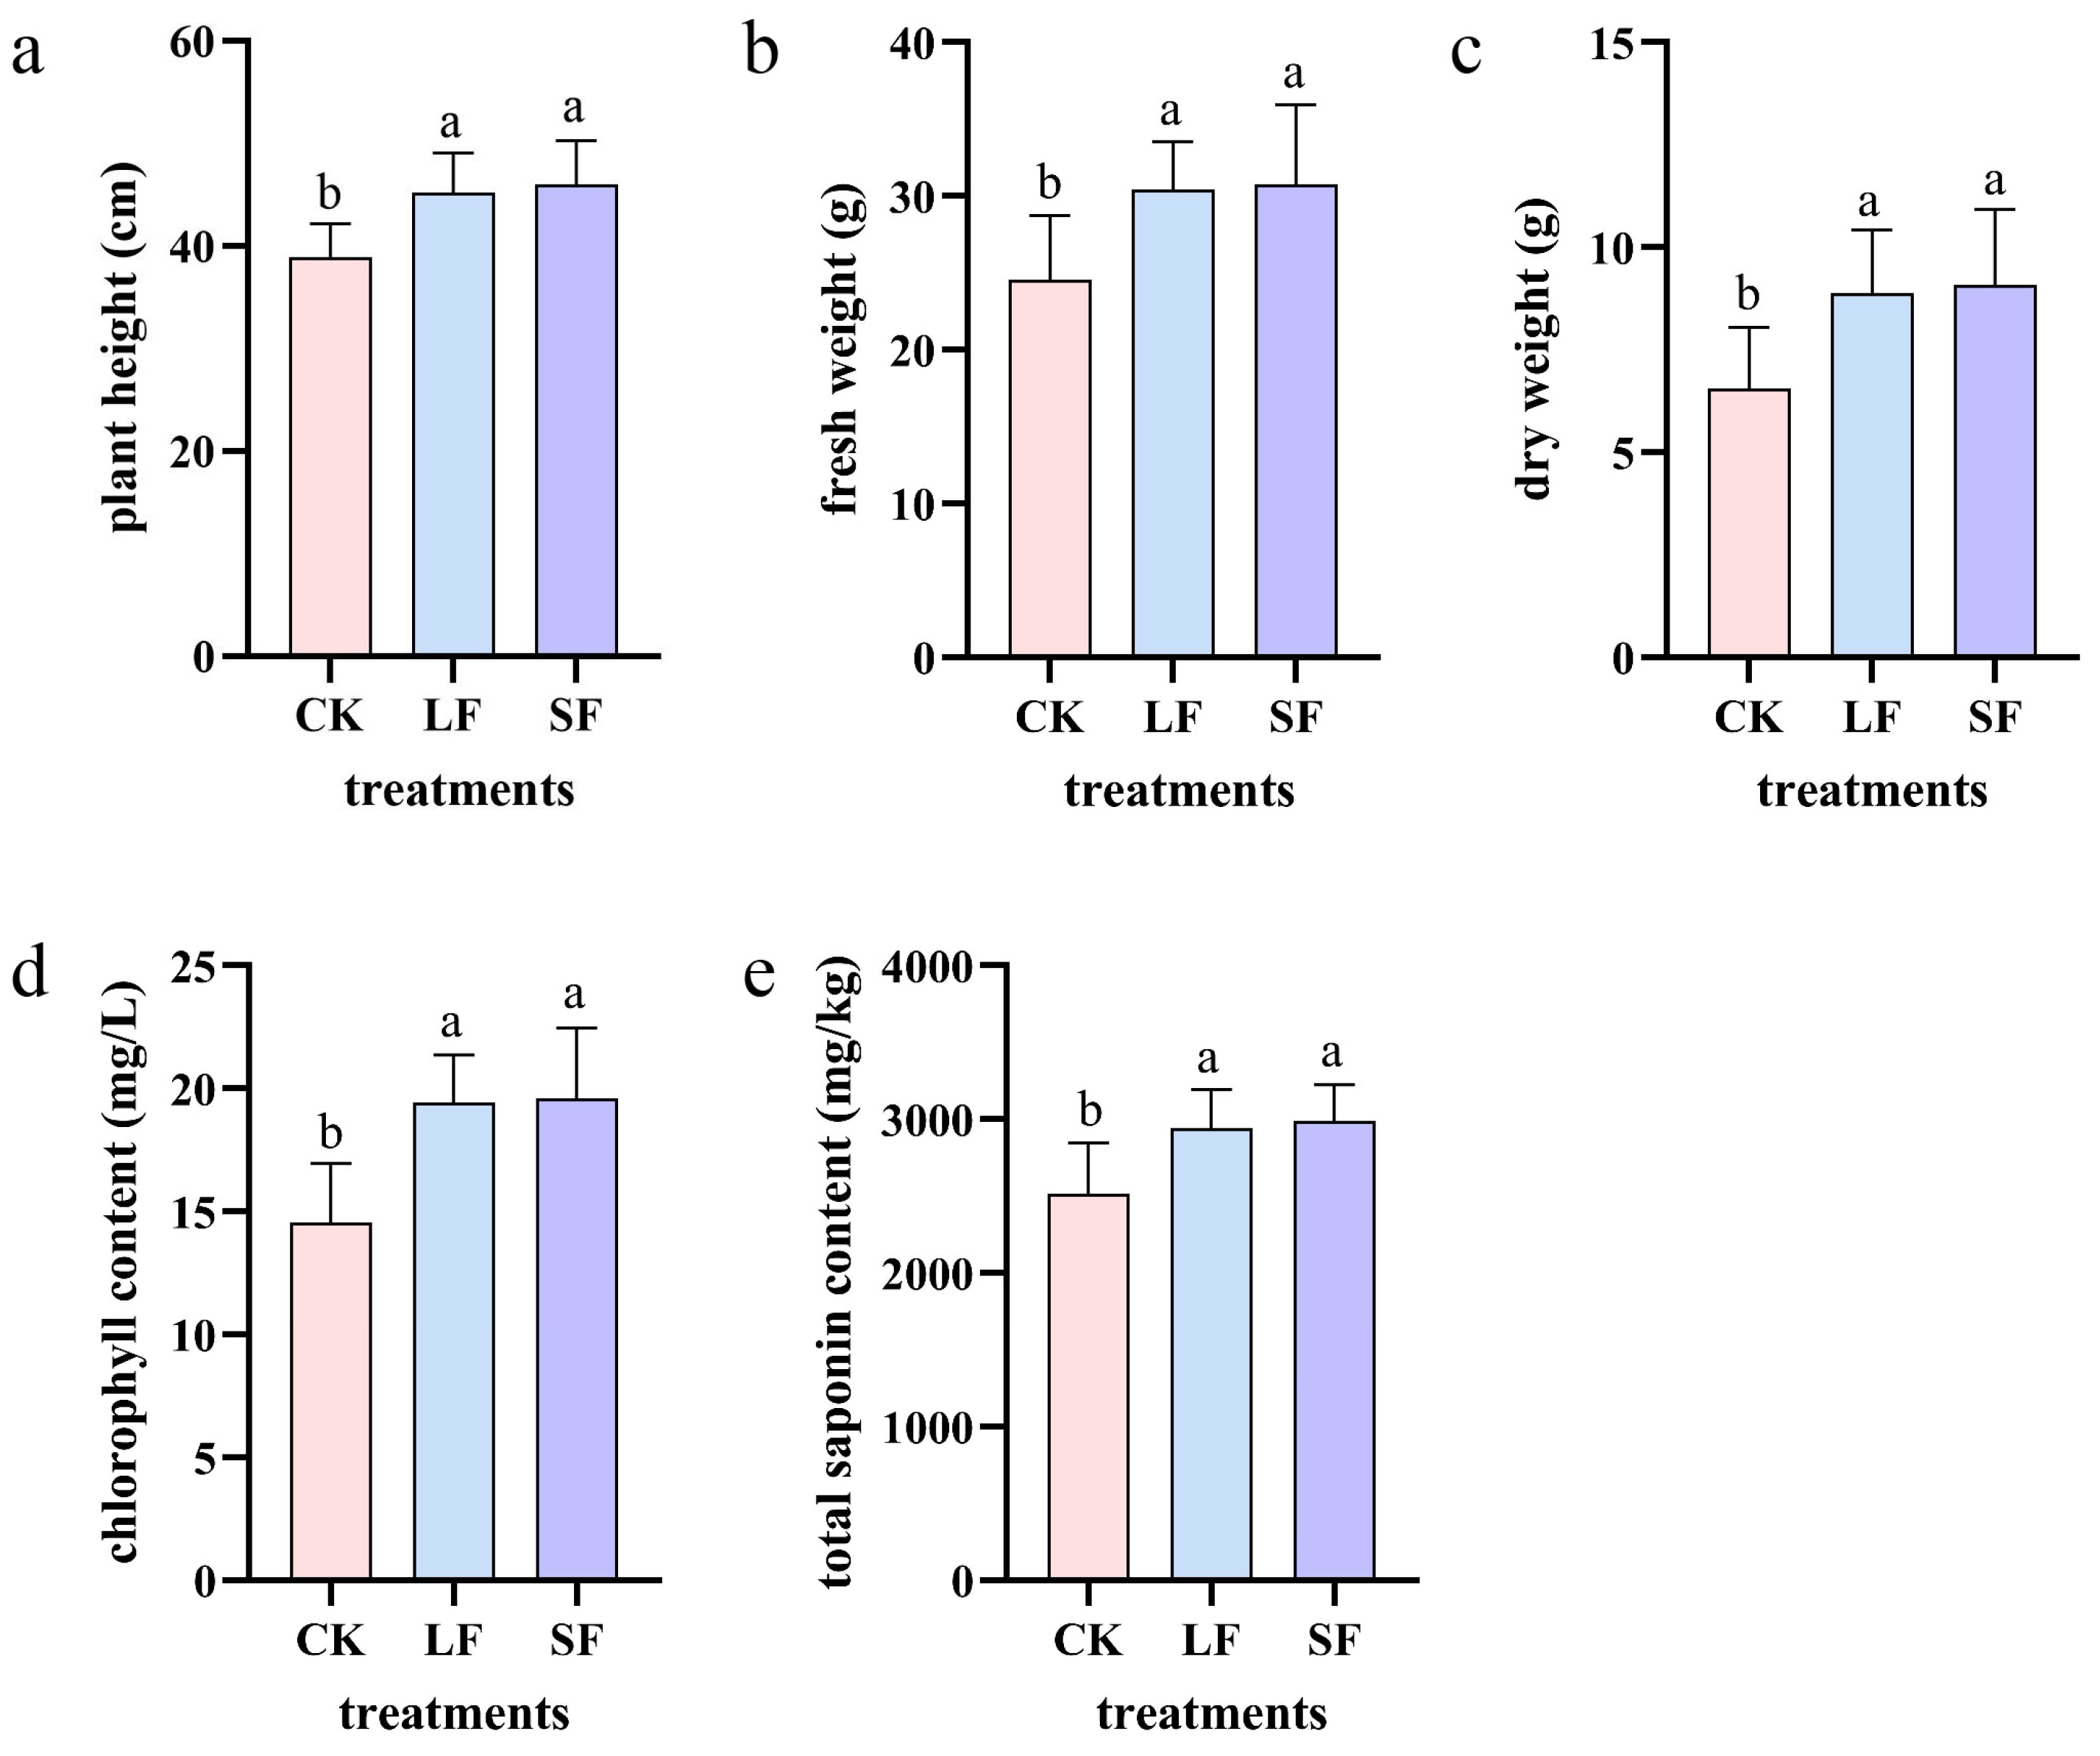
Figure 1. The impact of different treatments on the biomass of Panax notoginseng. (a) Plant height, (b) dry weight, (c) fresh weight, (d) chlorophyll content, and (e) total saponins. SF refers to the solid fermentation product treatment group, LF refers to the fermentation broth treatment group, and CK refers to the clear water treatment control group. The same applies to the figures below.
Life 15 01353 g001
Figure 2. Circular Diagram of Primary Classification Composition of Rhizosphere Metabolites in Panax notoginseng.
Life 15 01353 g002
Figure 3. Principal Component Analysis and OPLS-DA Validation Plot of Total Soil Samples. (a) Principal Component Analysis, (b) OPLS-DA Validation Plot.
Life 15 01353 g003
Figure 4. Clustering Heatmap of Metabolites.
Life 15 01353 g004
Figure 5. Volcano Plot of Up-regulated and Down-regulated Expressions of Differential Metabolites. (a) SF vs. CK, (b) LF vs. CK. Circles represent metabolites, with red and green indicating the increase or decrease of metabolites in the corresponding groups.
Life 15 01353 g005
Figure 6. Analysis of Differential Metabolites in Partial Root Systems. (a) Enniatin B, (b) Arbutin, (c) Notoginsenoside R1, (d) Xanthosine.
Life 15 01353 g006
Figure 7. Enriched bubble plot of different metabolite pathway enrichment in different treatments. (a) Bubble plot of differential metabolite pathway enrichment under LF treatment; (b) Bubble plot of differential metabolite pathway enrichment under SF treatment.
Life 15 01353 g007
Figure 8. Purine metabolism pathway diagram.
Life 15 01353 g008
Figure 9. Community Composition of Soil Microorganisms at Phylum and Genus Levels under Different Treatments. (a) Community Composition of Bacteria at Phylum Level, (b) Community Composition of Fungi at Phylum Level, (c) Community Composition of Bacteria at Genus Level, (d) Community Composition of Fungi at Genus Level.
Life 15 01353 g009
Figure 10. Impact of Different Treatments on β-Diversity of Rhizosphere Microorganisms. (a) Principal Coordinate Analysis of Bacteria, (b) Coordinate Analysis of Fungi, (c) UPGMA Clustering Tree Structure of Bacteria, (d) UPGMA Clustering Tree Structure of Fungi.
Life 15 01353 g010
Figure 11. Microbial correlation analysis network diagram. (a) Correlation Analysis Network Diagram of Bacteria with the Top 50 Relative Abundances, (b) Correlation Analysis Network Diagram of Fungi with the Top 50 Relative Abundances.
Life 15 01353 g011
Figure 12. Effects of environmental factors on microbial composition and diversity. (a) Impact of Environmental Factors on Bacterial Composition, (b) Impact of Environmental Factors on Fungal Composition, (c) Impact of Environmental Factors on Bacterial Diversity, (d) Impact of Environmental Factors on Fungal Diversity.
Life 15 01353 g012
Table 1. Effects of different treatments on soil physicochemical properties.
TreatmentsTotal Nitrogen (g/kg)Total Phosphorus (g/kg)Total Potassium (g/kg)Ammonium Nitrogen (mg/kg)Nitrate Nitrogen (mg/kg)Organic Matter (g/kg)pH
LF1.118 ± 0.05 b1.388 ± 0.01 a12.124 ± 0.03 a8.048 ± 0.34 a57.174 ± 7.8 ab16.09 ± 0.44 a6.647 ± 0.12 a
SF1.32 ± 0.02 a1.395 ± 0.01 a12.104 ± 0.03 a9.102 ± 0.98 a63.9 ± 3.82 a13.702 ± 1.35 ab6.413 ± 0.18 a
CK1.09 ± 0.02 b1.388 ± 0.01 a12.298 ± 0.03 a8.69 ± 2.05 a45.316 ± 9.59 b13.691 ± 0.9 b6.01 ± 0.19 b
Note: Different letters after data indicate significant differences (p < 0.05). SF refers to the solid fermentation product treatment group, LF refers to the fermentation broth treatment group, and CK refers to the clear water treatment control group. The same applies to the tables below.
Table 2. Effects of different treatments on the diversity α rhizosphere microbial.
MicrobeTreatmentRichness IndexDiversity IndexDegree of Coverage
Chao1ACEShannonSimpson
bacterialLF1684.1727 ± 38.7319 a1689.1887 ± 36.5441 a6.2883 ± 0.0015 a0.993 ± 0 a0.9967 ± 0.0006 a
SF1736.6377 ± 40.9896 a1741.3617 ± 37.73 a6.3973 ± 0.087 a0.9933 ± 0.0012 a0.9967 ± 0.0006 a
CK1540.1837 ± 50.6641 b1546.4637 ± 49.9319 b6.1697 ± 0.0424 b0.991 ± 0 b0.9967 ± 0.0006 a
fungiLF340.985 ± 4.2508 b341.9047 ± 4.3635 b3.7527 ± 0.0533 b0.9483 ± 0.0012 b1
SF375.525 ± 3.5996 a375.8447 ± 3.5807 a3.9627 ± 0.0482 a0.956 ± 0.003 a1
CK324.9853 ± 4.7512 c325.9927 ± 4.7811 c3.8853 ± 0.052 a0.9583 ± 0.0025 a1
Note: Different letters after data indicate significant differences (p < 0.05).
Table 3. Topological properties of bacterial community co-occurrence network with different treatments.
Topological PropertiesCKLFSFTopological PropertiesCKLFSF
Node484849Network diameter111
Edge388492469Component653
Negative correlations40.5%45.5%44%Modularity3.0477.2512.853
Average degree15.620.519.14Average clustering coefficient0.9730.9810.979
Graph density0.3180.4360.399Average path111
Table 4. Topological properties of fungi community co-occurrence network with different treatments.
Topological PropertiesCKLFSFTopological PropertiesCKLFSF
Node484950Network diameter111
Edge388429468Component643
Negative correlations40.5%43%40.6%Modularity3.1556.1152.026
Average degree15.617.218.7Average clustering coefficient0.9730.9740.977
Graph density0.3180.3510.382Average path111
Disclaimer/Publisher’s Note: The statements, opinions and data contained in all publications are solely those of the individual author(s) and contributor(s) and not of MDPI and/or the editor(s). MDPI and/or the editor(s) disclaim responsibility for any injury to people or property resulting from any ideas, methods, instructions or products referred to in the content.