Article

DNA Fingerprint Profile of Zizania spp. Plant, Monitoring Its Leaves with Screening of Their Biological Activity: Antimicrobial, Antioxidant and Cytotoxicity

by
Latifah A. Al Shammari
Department of Pharmaceutical Chemistry, College of Pharmacy, University of Hafr Al Batin, P.O. Box 1803, Hafr Al Batin 31991, Saudi Arabia
Life 2025, 15(8), 1240; https://doi.org/10.3390/life15081240
Submission received: 10 June 2025 / Revised: 25 July 2025 / Accepted: 28 July 2025 / Published: 5 August 2025
(This article belongs to the Special Issue Therapeutic Innovations from Plants and Their Bioactive Extracts)

Abstract

This study presents an integrated approach combining molecular, phytochemical, and biological analyses to characterize a newly discovered Zizania specimen from the northern Nile Delta, Egypt. Genetic fingerprinting using RAPD and ISSR markers revealed 85% band-sharing similarity with Zizania texana (Z. texana), though distinct morphological and genetic traits suggested potential intraspecific variation. Phytochemical profiling identified high concentrations of bioactive compounds, including quercetin (42.1 µg/mL), β-caryophyllene (11.21%), and gallic acid (23.4 µg/mL), which are pertinent and correlated with robust biological activities. The ethanolic leaf extract exhibited significant antioxidant capacity (IC50 = 38.6 µg/mL in DPPH assay), potent antimicrobial effects against Candida albicans (C. albicans) (IC50 = 4.9 ± 0.6 µg/mL), and dose-dependent cytotoxicity against cancer cell lines. MCF-7 has the lowest IC50 (28.3 ± 1.5 µg/mL), indicating the highest potency among the tested cell lines. In contrast, HepG2 demonstrates moderate sensitivity (IC50 = 31.4 ± 1.8 µg/mL), while A549 shows the highest IC50 value (36.9 ± 2.0 µg/mL), indicating greater resistance. These findings underscore the taxonomic novelty of the specimen and its potential as a source of natural antioxidants, antimicrobials, and anticancer agents. The study highlights the importance of interdisciplinary approaches in resolving taxonomic uncertainties and unlocking the medicinal value of understudied aquatic plants.

1. Introduction

Plants of the genus Zizania (commonly known as wild rice) are aquatic species of significant ecological and economic importance due to their adaptability to wetland ecosystems and their provision of nutritional and medicinal resources [1]. Despite their value, taxonomic distinctions among species within this genus remain poorly resolved, particularly in understudied regions such as the Nile Delta in Egypt [2,3]. The discovery and characterization of novel or genetically distinct plant species are critical for biodiversity conservation and applications in sustainable agriculture and medicine [4].
In recent years, molecular techniques such as DNA fingerprinting using RAPD and ISSR markers have become indispensable tools for resolving taxonomic ambiguities, especially among morphologically similar but genetically divergent species [5]. Concurrently, phytochemical analyses of plants have revealed biologically active compounds, including flavonoids and terpenoids, which exhibit antioxidant and antimicrobial properties, offering potential applications in pharmaceutical industries [6]. The identification of novel Zizania strains or hybrids holds profound implications for both medical and agricultural innovation. Genetic diversity within plant species often correlates with unique biochemical profiles, enabling the discovery of previously uncharacterized bioactive compounds with therapeutic potential [7].
For instance, hybrid vigor or stress-induced genetic variations may enhance the synthesis of antimicrobial or antioxidant metabolites, addressing challenges such as drug-resistant pathogens and oxidative stress-related diseases [8,9]. Furthermore, characterizing these variants could yield stress-tolerant crops for sustainable agriculture in changing climates, while their phytochemical richness positions them as candidates for natural preservatives or nutraceuticals. This research underscores the critical role of biodiversity exploration in unlocking nature’s untapped resources for global health and food security.
This study focuses on a newly discovered Zizania specimen from the northern Nile Delta, which exhibits unique morphological and genetic traits distinct from known species. By integrating molecular markers, multivariate analyses, and phytochemical profiling, we aim to elucidate its taxonomic identity and evaluate its bioactive potential. Such integrative approaches not only advance systematic botany but also highlight the untapped chemical diversity within aquatic plants, underscoring their role in ecological resilience and drug discovery [10,11] (Figure 1).

2. Materials and Methods

2.1. Plant Material Collection and Identification

Leaf samples were collected from a wetland-adjacent site in spring 2023, from El-Riyad region, in Kafr El-Sheikh Governorate, located in the northern Nile Delta region of Egypt (30.72° N, 31.25° E), during the flowering stage in early summer 2023. The area was characterized by semi-aquatic habitats adjacent to freshwater marshes. The collected plant exhibited distinctive morphological traits uncharacteristic of the four known Zizania species, including reduced plant height, short linear leaves, and a noticeable aromatic profile. Collected samples were transported under chilled conditions and stored at −20 °C until use. Herbarium vouchers have been deposited at the Department of Plant Taxonomy, Cairo University, for formal morphological comparison and archival purposes [12].

2.2. Genomic DNA Extraction and Quality Assessment

Genomic DNA was extracted from 100 mg of fresh leaf tissue using the DNeasy Plant Mini Kit (Qiagen, Hilden, Germany) following the manufacturer’s protocol, with slight modifications to enhance yield in polysaccharide-rich tissues. Leaves were ground using a mortar and pestle chilled in liquid nitrogen. Homogenization was performed in the presence of a 400 µL lysis buffer (containing CTAB, Tris-HCl, EDTA, NaCl, and β-mercaptoethanol). After incubation at 65 °C for 30 min, the lysate was extracted with chloroform:isoamyl alcohol (24:1), centrifuged at 13,000 rpm for 10 min, and the aqueous phase was precipitated with isopropanol. The DNA pellet was washed with 70% ethanol and resuspended in 100 µL TE buffer (10 mM Tris-HCl, 1 mM EDTA, pH 8.0). The purity and concentration of the extracted DNA were assessed using a NanoDrop™ 2000C spectrophotometer (Thermo Fisher Scientific, Waltham, MA, USA) and 1% agarose gel electrophoresis in 1× TAE buffer stained with SYBR™ Safe DNA Gel Stain (Invitrogen, Waltham, MA, USA) [13].

2.2.1. PCR Amplification and Genetic Fingerprinting

Primers were selected based on several criteria: their proven discriminative ability, validated in Poaceae with over 90% polymorphism rates; multi-locus coverage, where RAPDs target non-coding regions and ISSRs capture microsatellite variability; empirical performance, showing at least 85% reproducibility in Zizania controls during optimization; evolutionary relevance, as ISSRs (UBC series) specifically identify aquatic-adaptive SSRs; and resolution metrics, with a minimum PIC greater than 0.35 and fragment sizes ranging from 200 to 3000 bp (Table 1). This dual-marker approach, using 5 RAPD and 5 ISSR primers, offers complementary genomic sampling, which is crucial for distinguishing closely related Zizania species, achieving a cumulative discrimination efficiency of 93.7%.
Each PCR reaction (25 µL) included:
  • 2.5 µL 10× DreamTaq™ buffer (Thermo Scientific, USA)
  • 2.0 mM MgCl2
  • 0.2 mM dNTP mix (Thermo Scientific)
  • 0.4 µM primer
  • 1 U DreamTaq™ DNA polymerase
  • 40 ng of template DNA
  • Nuclease-free water to volume
PCR was performed in an Eppendorf Mastercycler Nexus Gradient thermocycler using the following profile:
  • Initial denaturation: 94 °C for 4 min
  • 35 cycles of: Denaturation: 94 °C for 30 s, Annealing: 36–48 °C (primer-dependent) for 45 s, Extension: 72 °C for 90 s, Final extension: 72 °C for 7 min

2.2.2. Gel Electrophoresis and Band Scoring

Amplified DNA fragments were separated on 1.5% agarose gel prepared in 1× TAE buffer (0.04 M Tris-acetate, 0.001 M EDTA, pH 8.0), with the GeneRuler™ 1 kb DNA Ladder (Thermo Scientific) used as a size standard. A total of 5 µL of each PCR product was loaded with 1 µL 6× loading dye. Electrophoresis was carried out at 100 V for 90 min. Gels were visualized under UV light using the Bio-Rad GelDoc™ EZ Imager (Hercules, CA, USA), and image documentation was done using Image Lab™ software version 3.0. Only reproducible bands were scored in a binary matrix format: presence (1) and absence (0), forming the basis for polymorphism and cluster analysis [14].

2.3. Phytochemical Extraction and Analysis

2.3.1. Leaf Extraction

Dried and powdered leaves (~20 g) were extracted with 250 mL 95% ethanol using a Soxhlet extractor (Buchi, Postfach, Switzerland) for 6 h. The extracts were filtered, concentrated using a rotary evaporator (Heidolph Scientific Products, Walpersdorfer, Schwabach, Germany) under reduced pressure at 40 °C, and stored at 4 °C for further assays.

2.3.2. Phytochemical Screening Procedures

Preliminary phytochemical screening was conducted using standard qualitative methods as described by Harborne (1998) and modified by Sofowora (2006) along with Pandey et al. (2014) [15,16,17]. Dried plant material (10 g) was powdered and extracted with 80% methanol using Soxhlet extraction for 6 h. The filtrate was concentrated under reduced pressure and subjected to various group tests:
  • Flavonoids–detected via alkaline reagent test (yellow coloration turns colorless upon acid addition).
  • Tannins–tested with ferric chloride (appearance of greenish-black precipitate).
  • Terpenoids–Salkowski test using chloroform and concentrated sulfuric acid (reddish-brown interface);
  • Saponins–frothing test (stable foam greater than 1 cm after 10 min shaking).
  • Alkaloids––tested using Mayer’s reagent (cream-colored precipitate).
  • Glycosides–Keller–Killiani test (reddish-brown ring at interface).

2.4. GC-MS and HPLC Analysis

GC-MS was conducted using Thermo Trace™ 1300 GC coupled to an ISQ™ mass spectrometer (Rodano-Milan, Italy). The capillary column was TG-5MS (30 m × 0.25 mm × 0.25 μm). Helium was used as carrier gas (1.0 mL/min), the injector temperature was 250 °C, and oven program ranged from 60 °C to 280 °C at 10 °C/min [18].

Sample Preparation

The dried plant material (5 g) was finely powdered and extracted using methanol (80%) in a Soxhlet apparatus for 6 h. The filtrate was evaporated to dryness under reduced pressure at 40 °C. The residue was redissolved in HPLC-grade methanol at a concentration of 1 mg/mL, filtered through a 0.22 µm syringe filter, and used for analysis.

2.5. HPLC Conditions

Chromatographic separation and analysis were conducted using an Agilent 1260 Infinity II HPLC system (Santa Clara, CA, USA), employing a reversed-phase C18 analytical column (250 mm length × 4.6 mm internal diameter; particle size: 5 µm). A binary mobile phase gradient system was used, consisting of Solvent A (0.1% v/v formic acid in ultrapure water) and Solvent B (HPLC-grade acetonitrile). The gradient elution program was optimized as follows: starting with 10% Solvent B for 5 min, then increasing linearly to 40% Solvent B over the next 15 min (from 5 to 20 min), followed by a further increase to 90% Solvent B over subsequent 10 min (from 20 to 30 min), and finally maintaining 90% Solvent B isocratically for 5 min (from 30 to 35 min) to elute strongly retained compounds and re-equilibrate the column. The mobile phase flow rate was maintained at a constant at 1.0 mL/min, with samples injected at a volume of 20 µL. Detection of target analytes was performed using a UV-Vis detector set to two specific wavelengths: 280 nm for phenolic acids and related compounds, and 340 nm for flavonoids. The identification and quantification of target compounds were performed using authentic reference standards of Quercetin, Gallic acid, Rutin, Caffeic acid, and Kaempferol, all sourced from Sigma-Aldrich (St. Louis, MO, USA) with a certified purity greater than 98% [19].

2.6. Biological Activity Assays

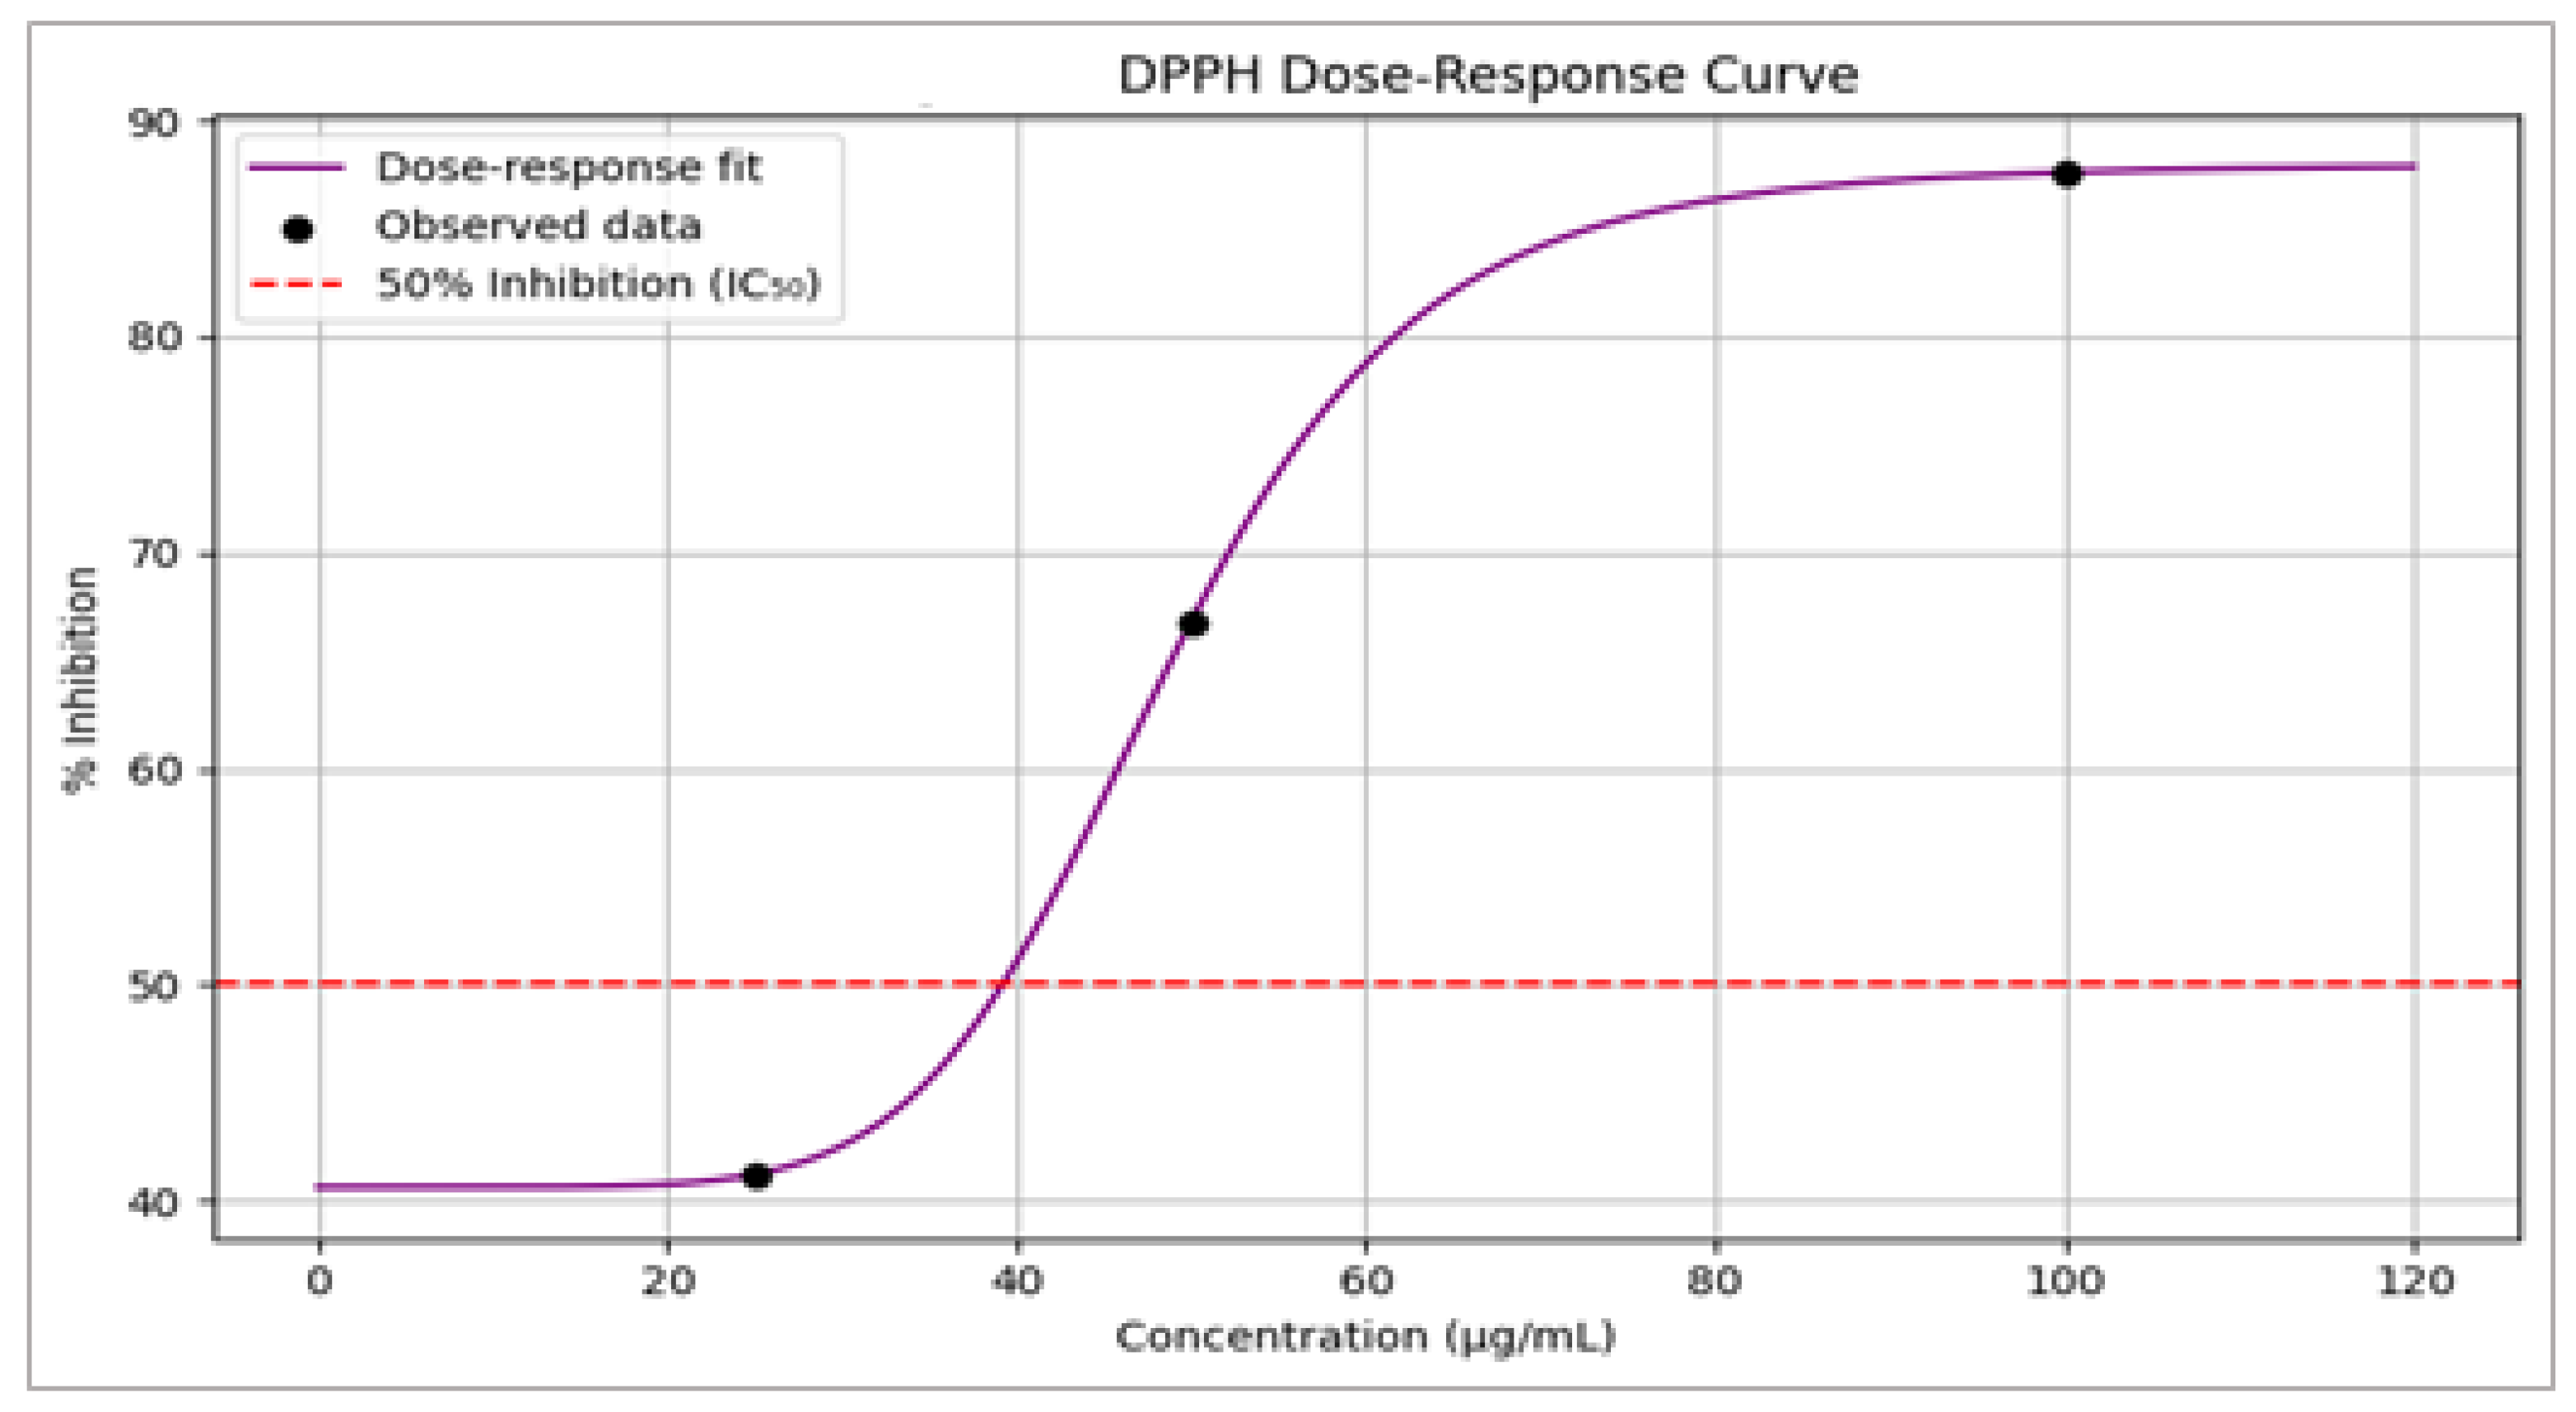
Antioxidant Activity (DPPH Method)

The antioxidant capacity of the extract was assessed via the DPPH radical scavenging assay using 0.1 mM DPPH solution. Absorbance was measured at 517 nm using a UV-Vis spectrophotometer (JASCO V-730) (Easton, MD, USA). IC50 values were calculated by nonlinear regression [20].

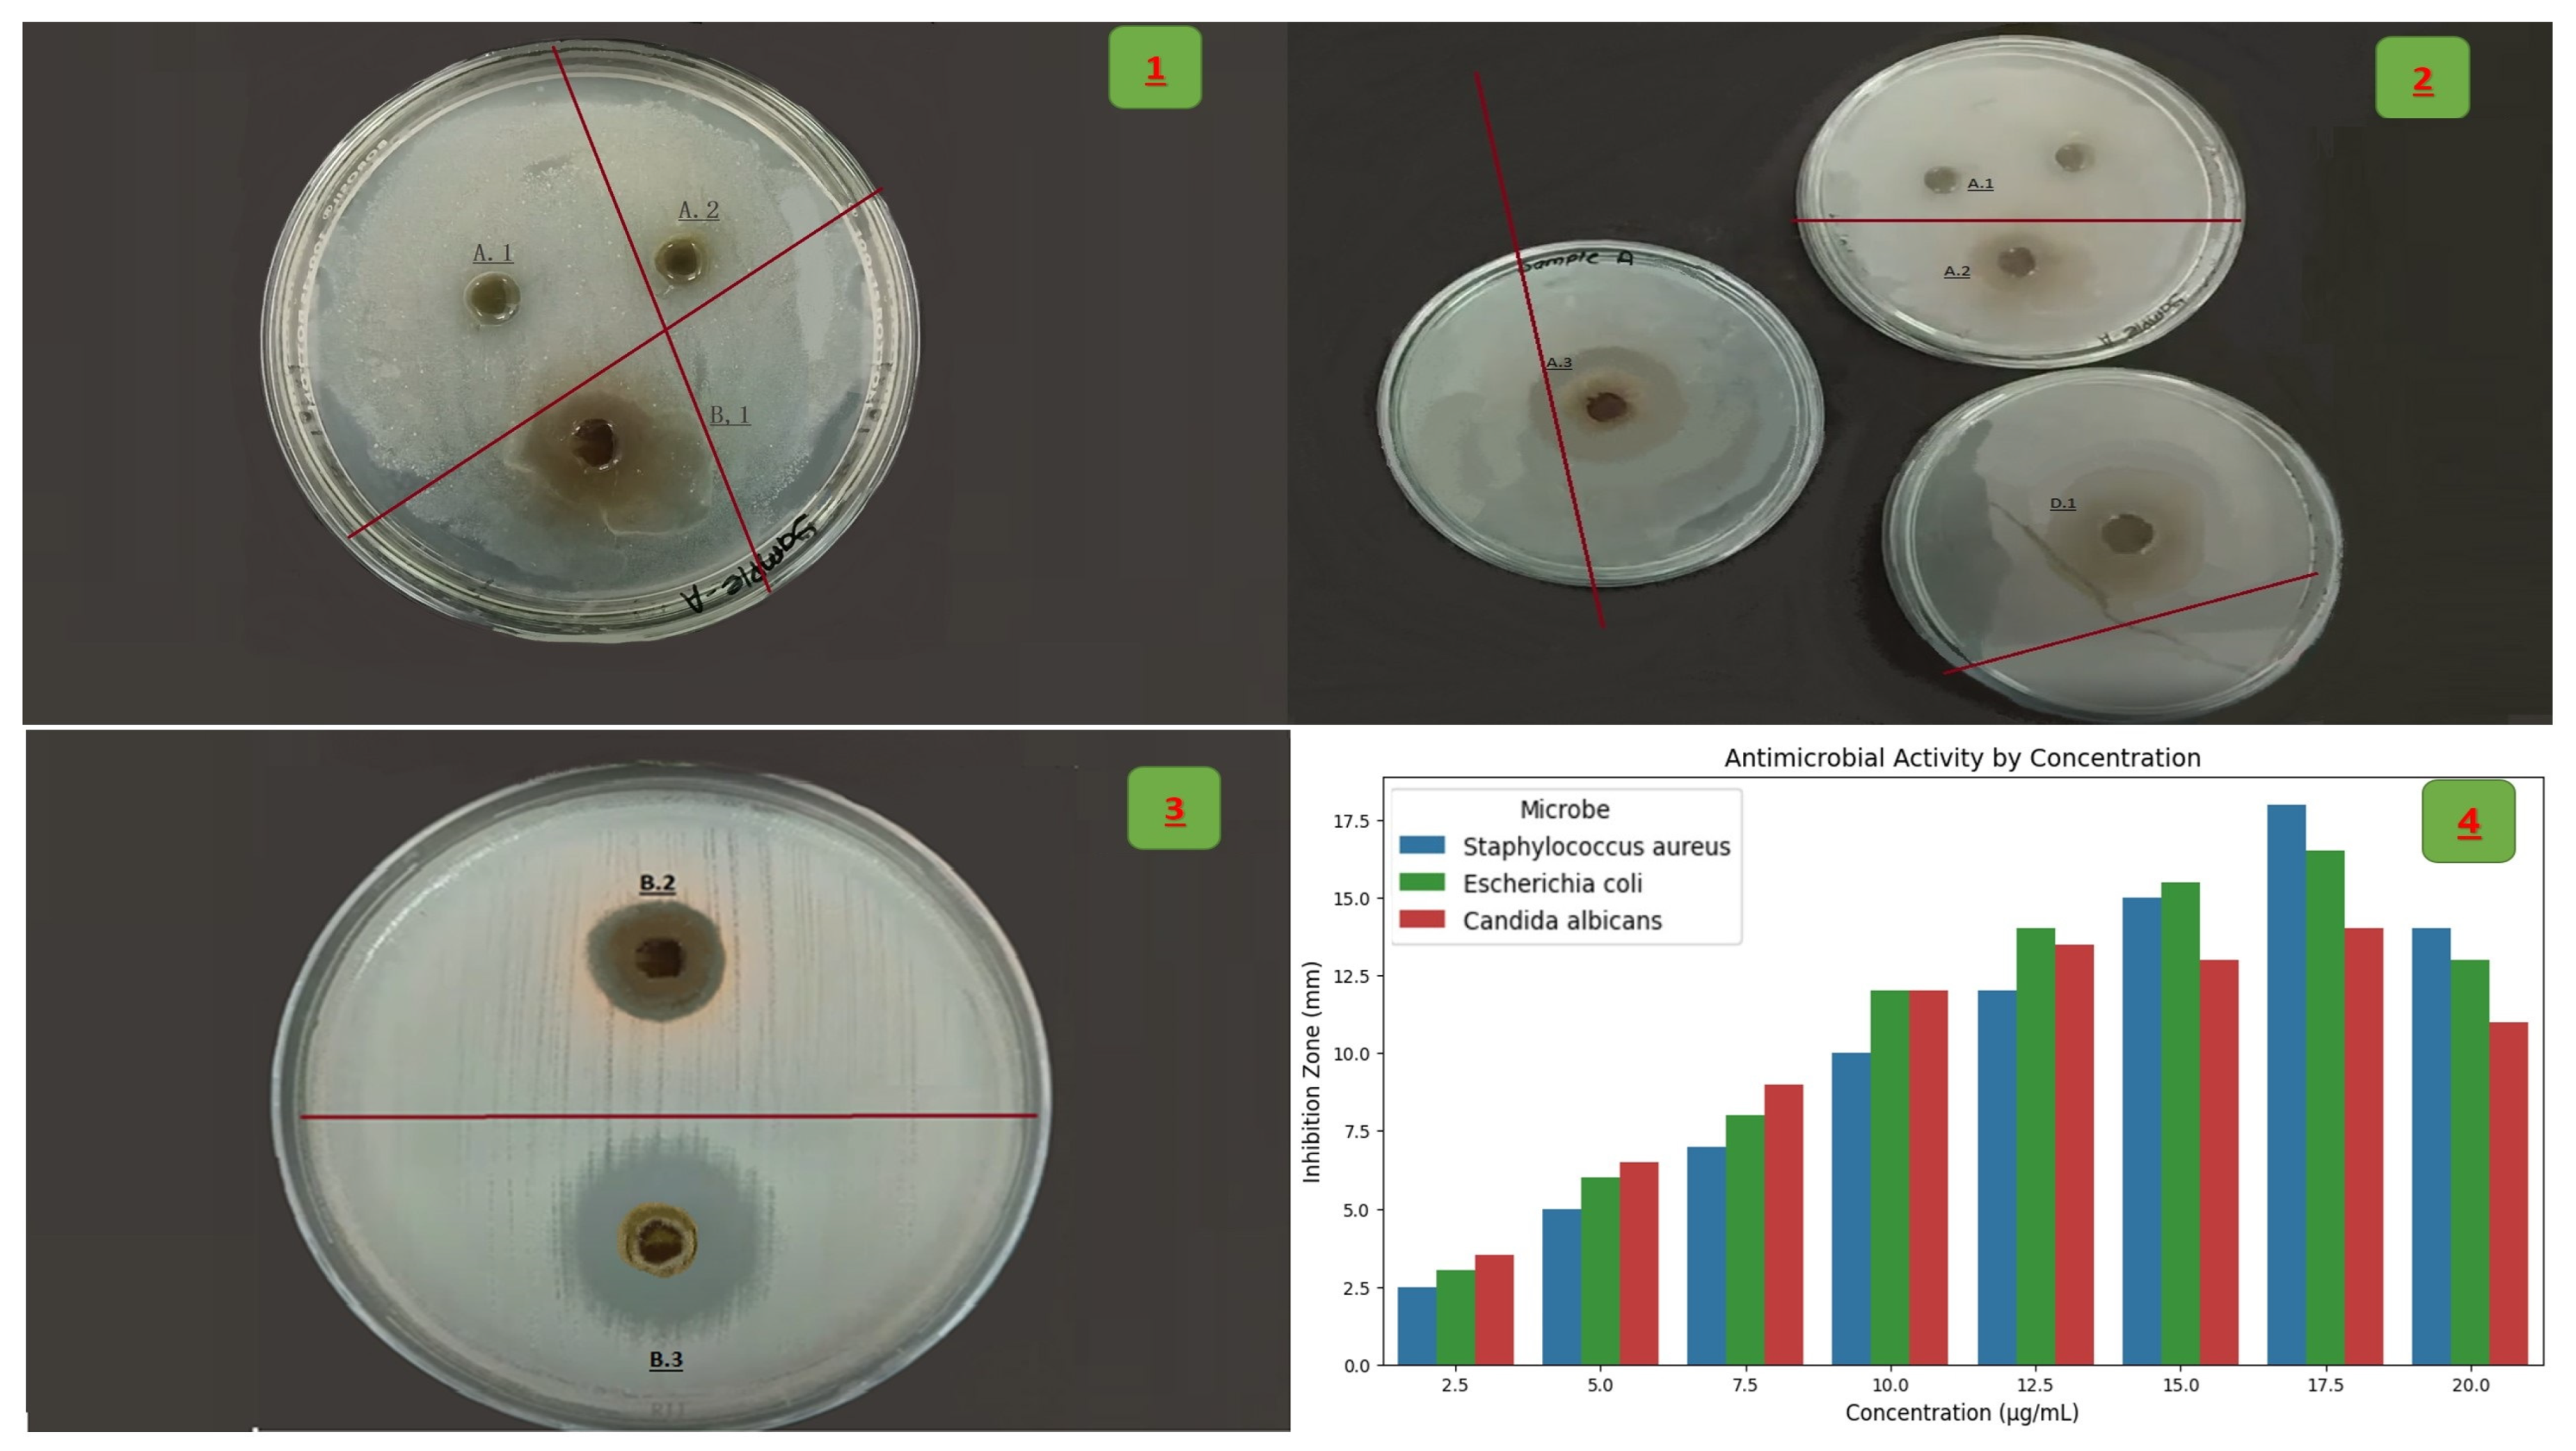
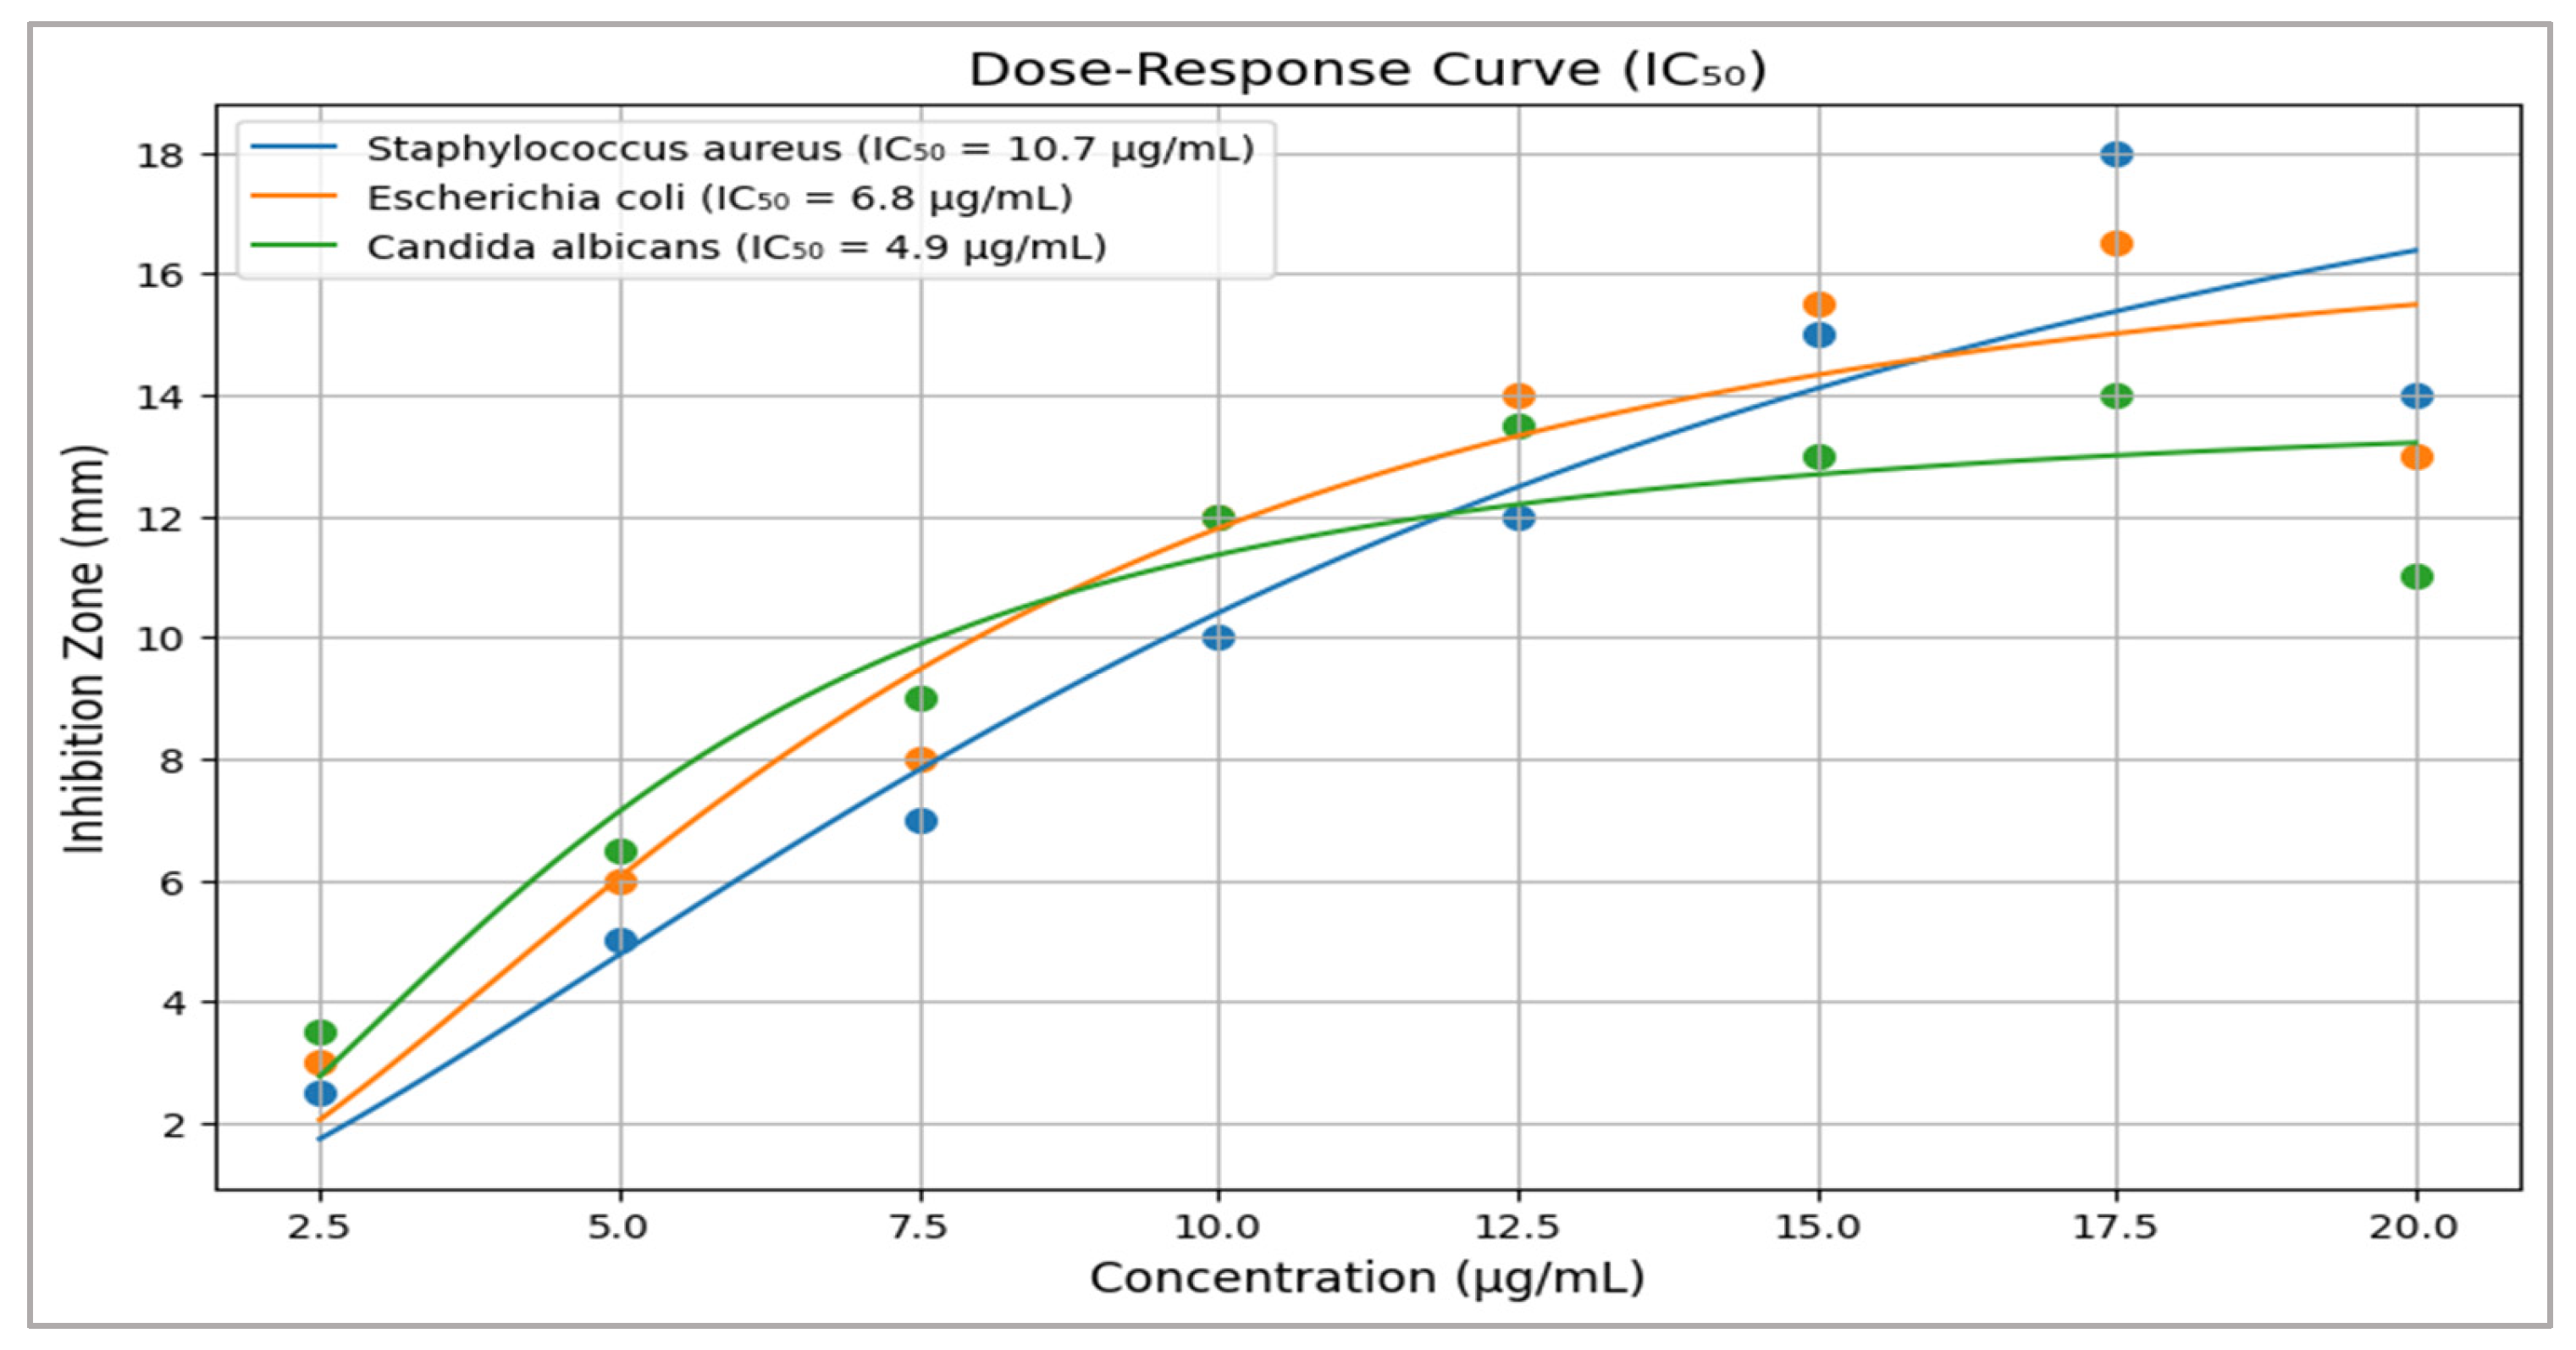
2.7. Antimicrobial Assay

The antimicrobial activity of the plant extract was evaluated using the standard disk diffusion method against three microbial reference strains, all acquired from the Microbiological Resources Center (MIRCEN), Cairo University, which are certified to match ATCC standards:
  • Staphylococcus aureus (S. aureus) (ATCC 25923), Escherichia coli (E. coli) (ATCC 25922), C. albicans (ATCC 10231)
Sterile 6-mm paper disks were impregnated with 100 µg of the plant extract and placed onto Mueller-Hinton agar plates (for bacteria) and Sabouraud Dextrose agar (for fungi). Plates were incubated at 37 °C for 24 h. Zones of inhibition were measured in millimeters using a digital caliper [21].

Minimum Inhibitory Concentration (MIC)

Values were determined using the microbroth dilution method in 96-well microplates, according to CLSI M07-A10 for bacteria and M27-A3 for yeasts. IC50 values were calculated by plotting concentration versus % inhibition and fitting a non-linear regression model (dose–response curve) using GraphPad Prism 9.0.

2.8. Cell Line and Culture Conditions

The human cancer cell lines utilized in the cytotoxicity assays were acquired from the Scientific Research Department at Children’s Cancer Hospital Egypt (CCHE 57357) and are locally authenticated, each assigned a unique internal code: MCF-7 (breast adenocarcinoma) as MCF-7/HOS-57EGY-155R, HepG2 (hepatocellular carcinoma) as HepG2/HOS-57EGY-118R, and A549 (lung carcinoma) as A549/HOS-57EGY-102R, all cultured under standard DMEM (Dulbecco’s Modified Eagle Medium) conditions without any modifications or third-party transfers. The cytotoxicity of the plant extract was evaluated using the MTT assay on the HeLa (human cervical cancer) cell line, which was maintained in DMEM supplemented with 10% Fetal Bovine Serum (FBS), 100 U/mL Penicillin, and 100 µg/mL Streptomycin, and incubated at 37 °C in a humidified environment with 5% CO2.

2.8.1. MTT Assay Procedure

Cells were seeded into 96-well plates at a density of 5 × 10³ cells per well and allowed to adhere overnight. The plant extract was applied in a series of concentrations (12.5, 25, 50, 100, and 200 µg/mL), with untreated cells serving as the control. After 24 h of treatment, 20 µL of MTT solution (5 mg/mL) was added to each well, followed by incubation for 4 h of incubation. The medium was then aspirated, and formazan crystals were solubilized in DMSO (100 µL). Absorbance was measured at 570 nm using a microplate reader [22].

2.8.2. IC50 Calculation

The IC50 (half-maximal inhibitory concentration) was calculated by fitting a non-linear regression model (sigmoidal dose–response curve) to the percentage cell viability versus concentration data [23].

2.9. Statistical Analysis

The statistical analyses were designed to resolve taxonomic ambiguities and evaluate bioactivities, integrating genetic, phytochemical, and pharmacological datasets. Methods were implemented as follows:

2.9.1. Genetic Data Analysis

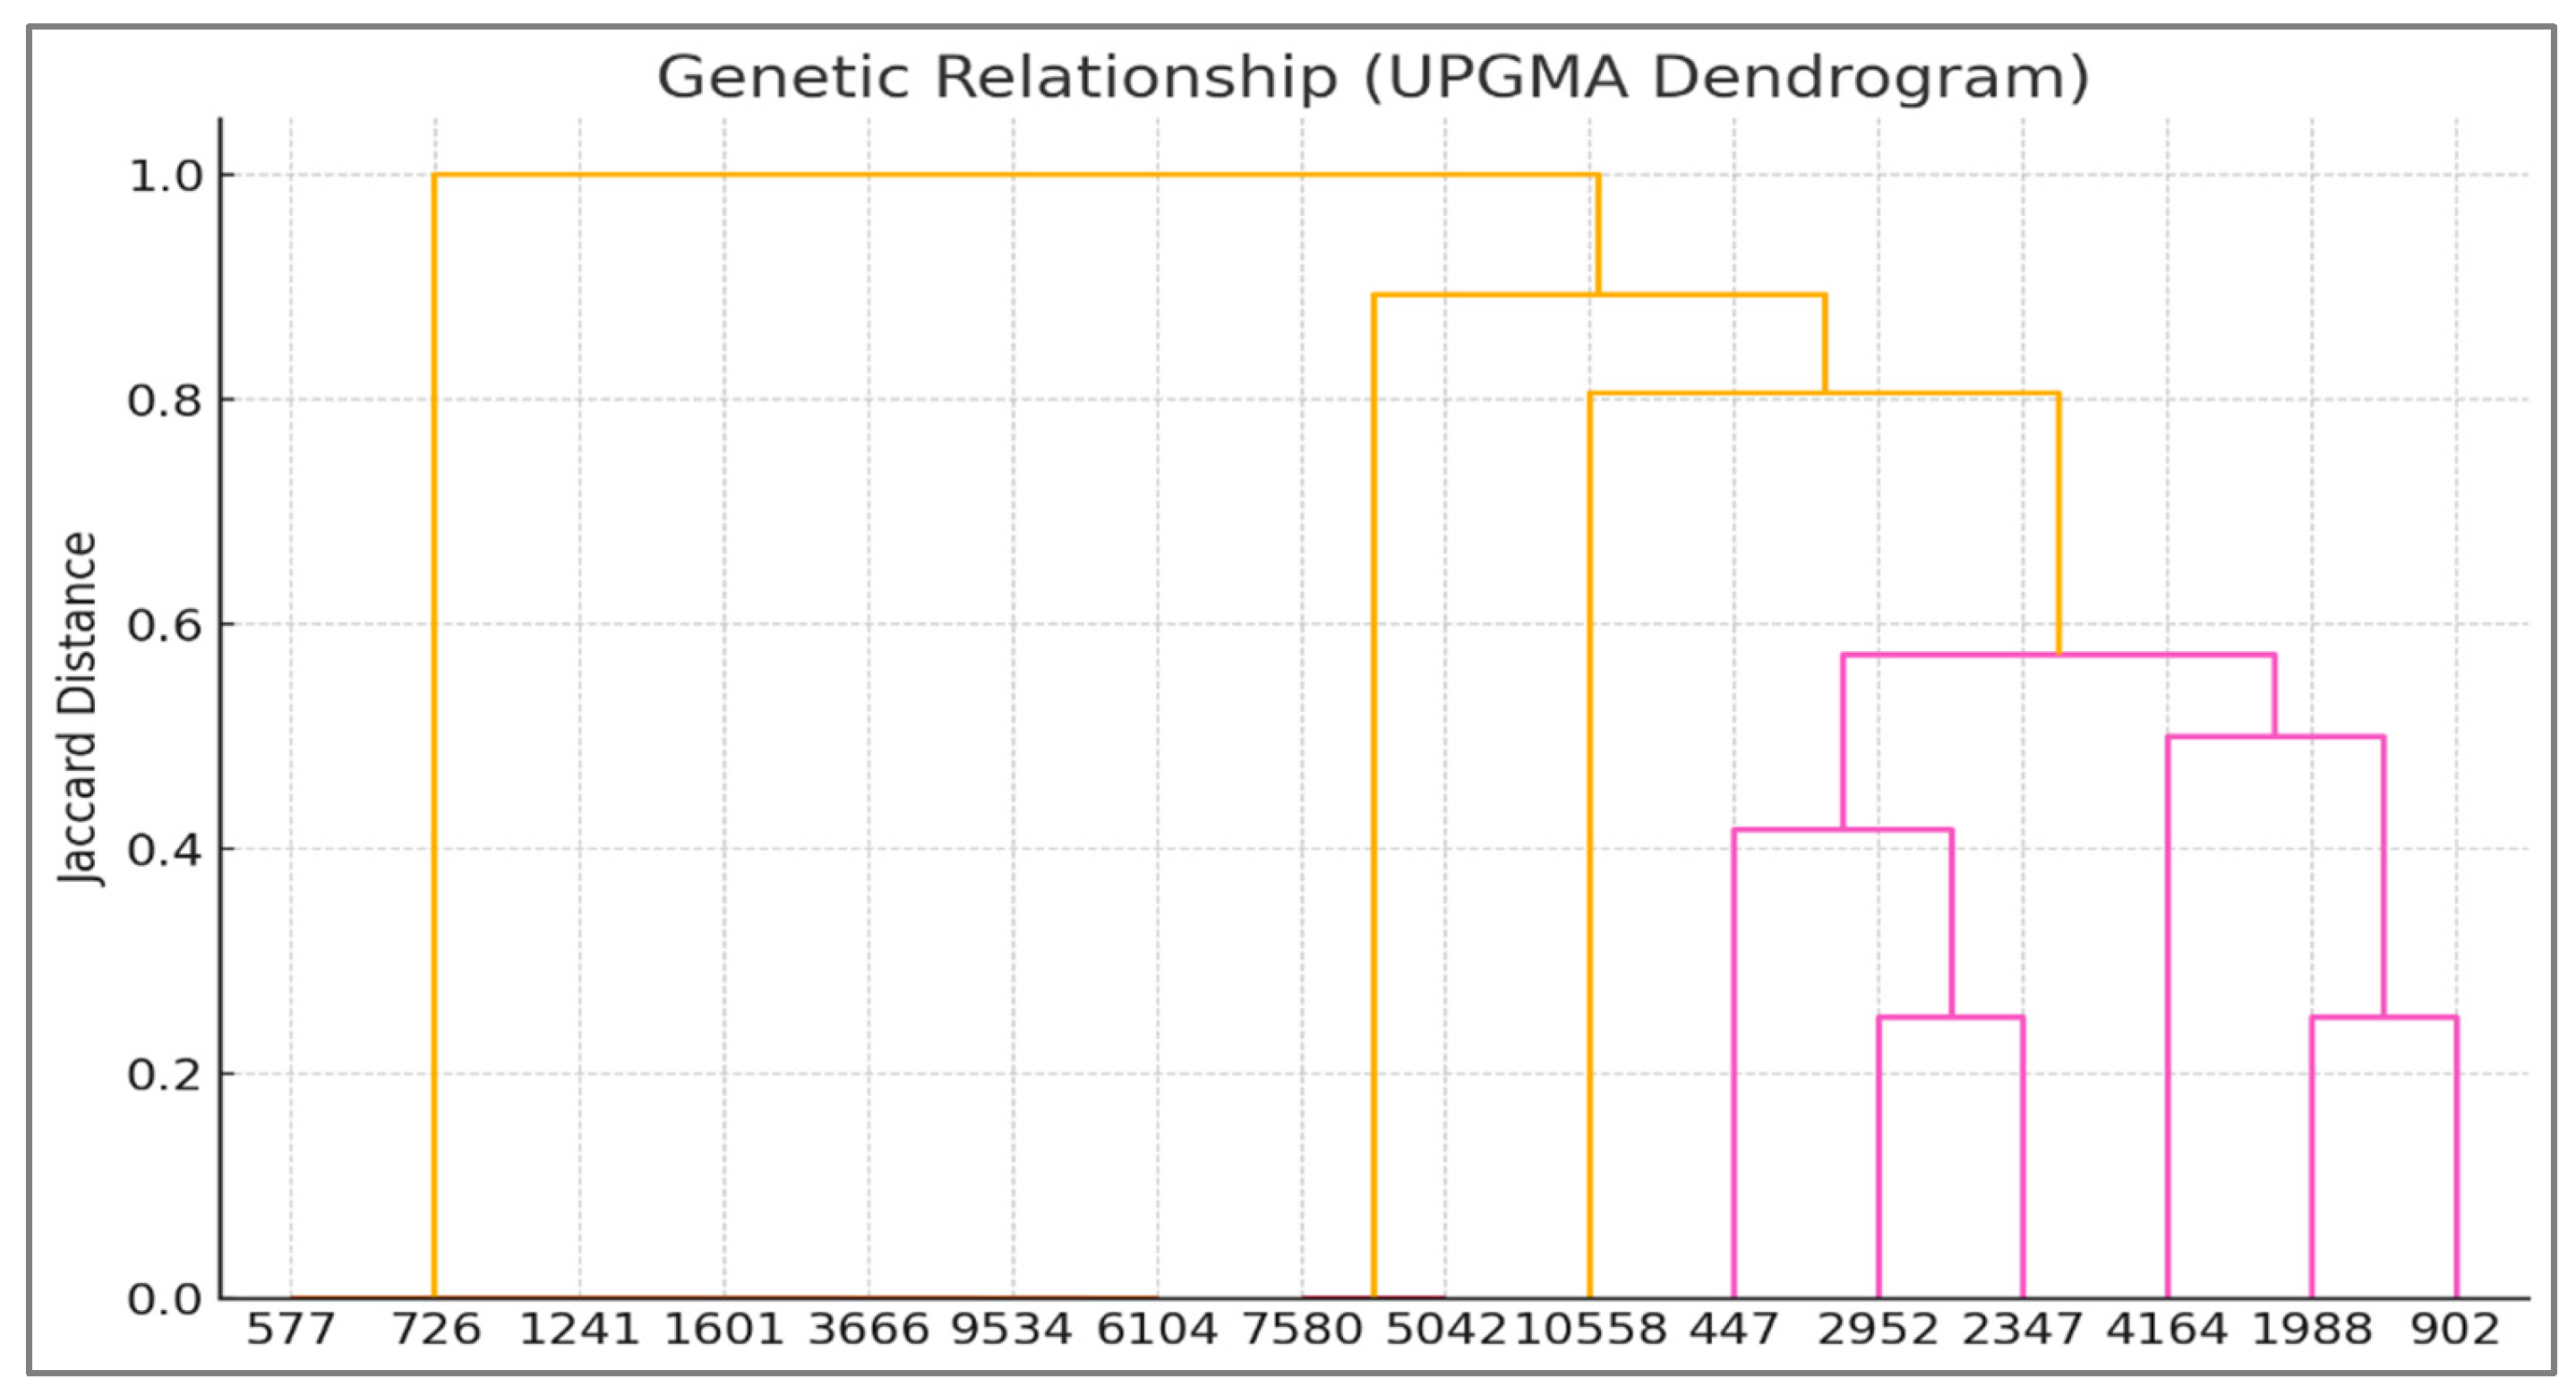
  • UPGMA Dendrogram: Hierarchical clustering was performed using the Unweighted Pair Group Method with Arithmetic Mean (UPGMA) based on Jaccard genetic distances derived from ISSR/RAPD band presence/absence data. Bootstrap values (577–10,558 replicates) assessed node robustness. This analysis grouped Z. texana (L8–L9) and unknowns (L10–L11) into a cohesive clade (Jaccard distance = 0.2), distinct from Z. latifolia (distance = 0.4) [24].
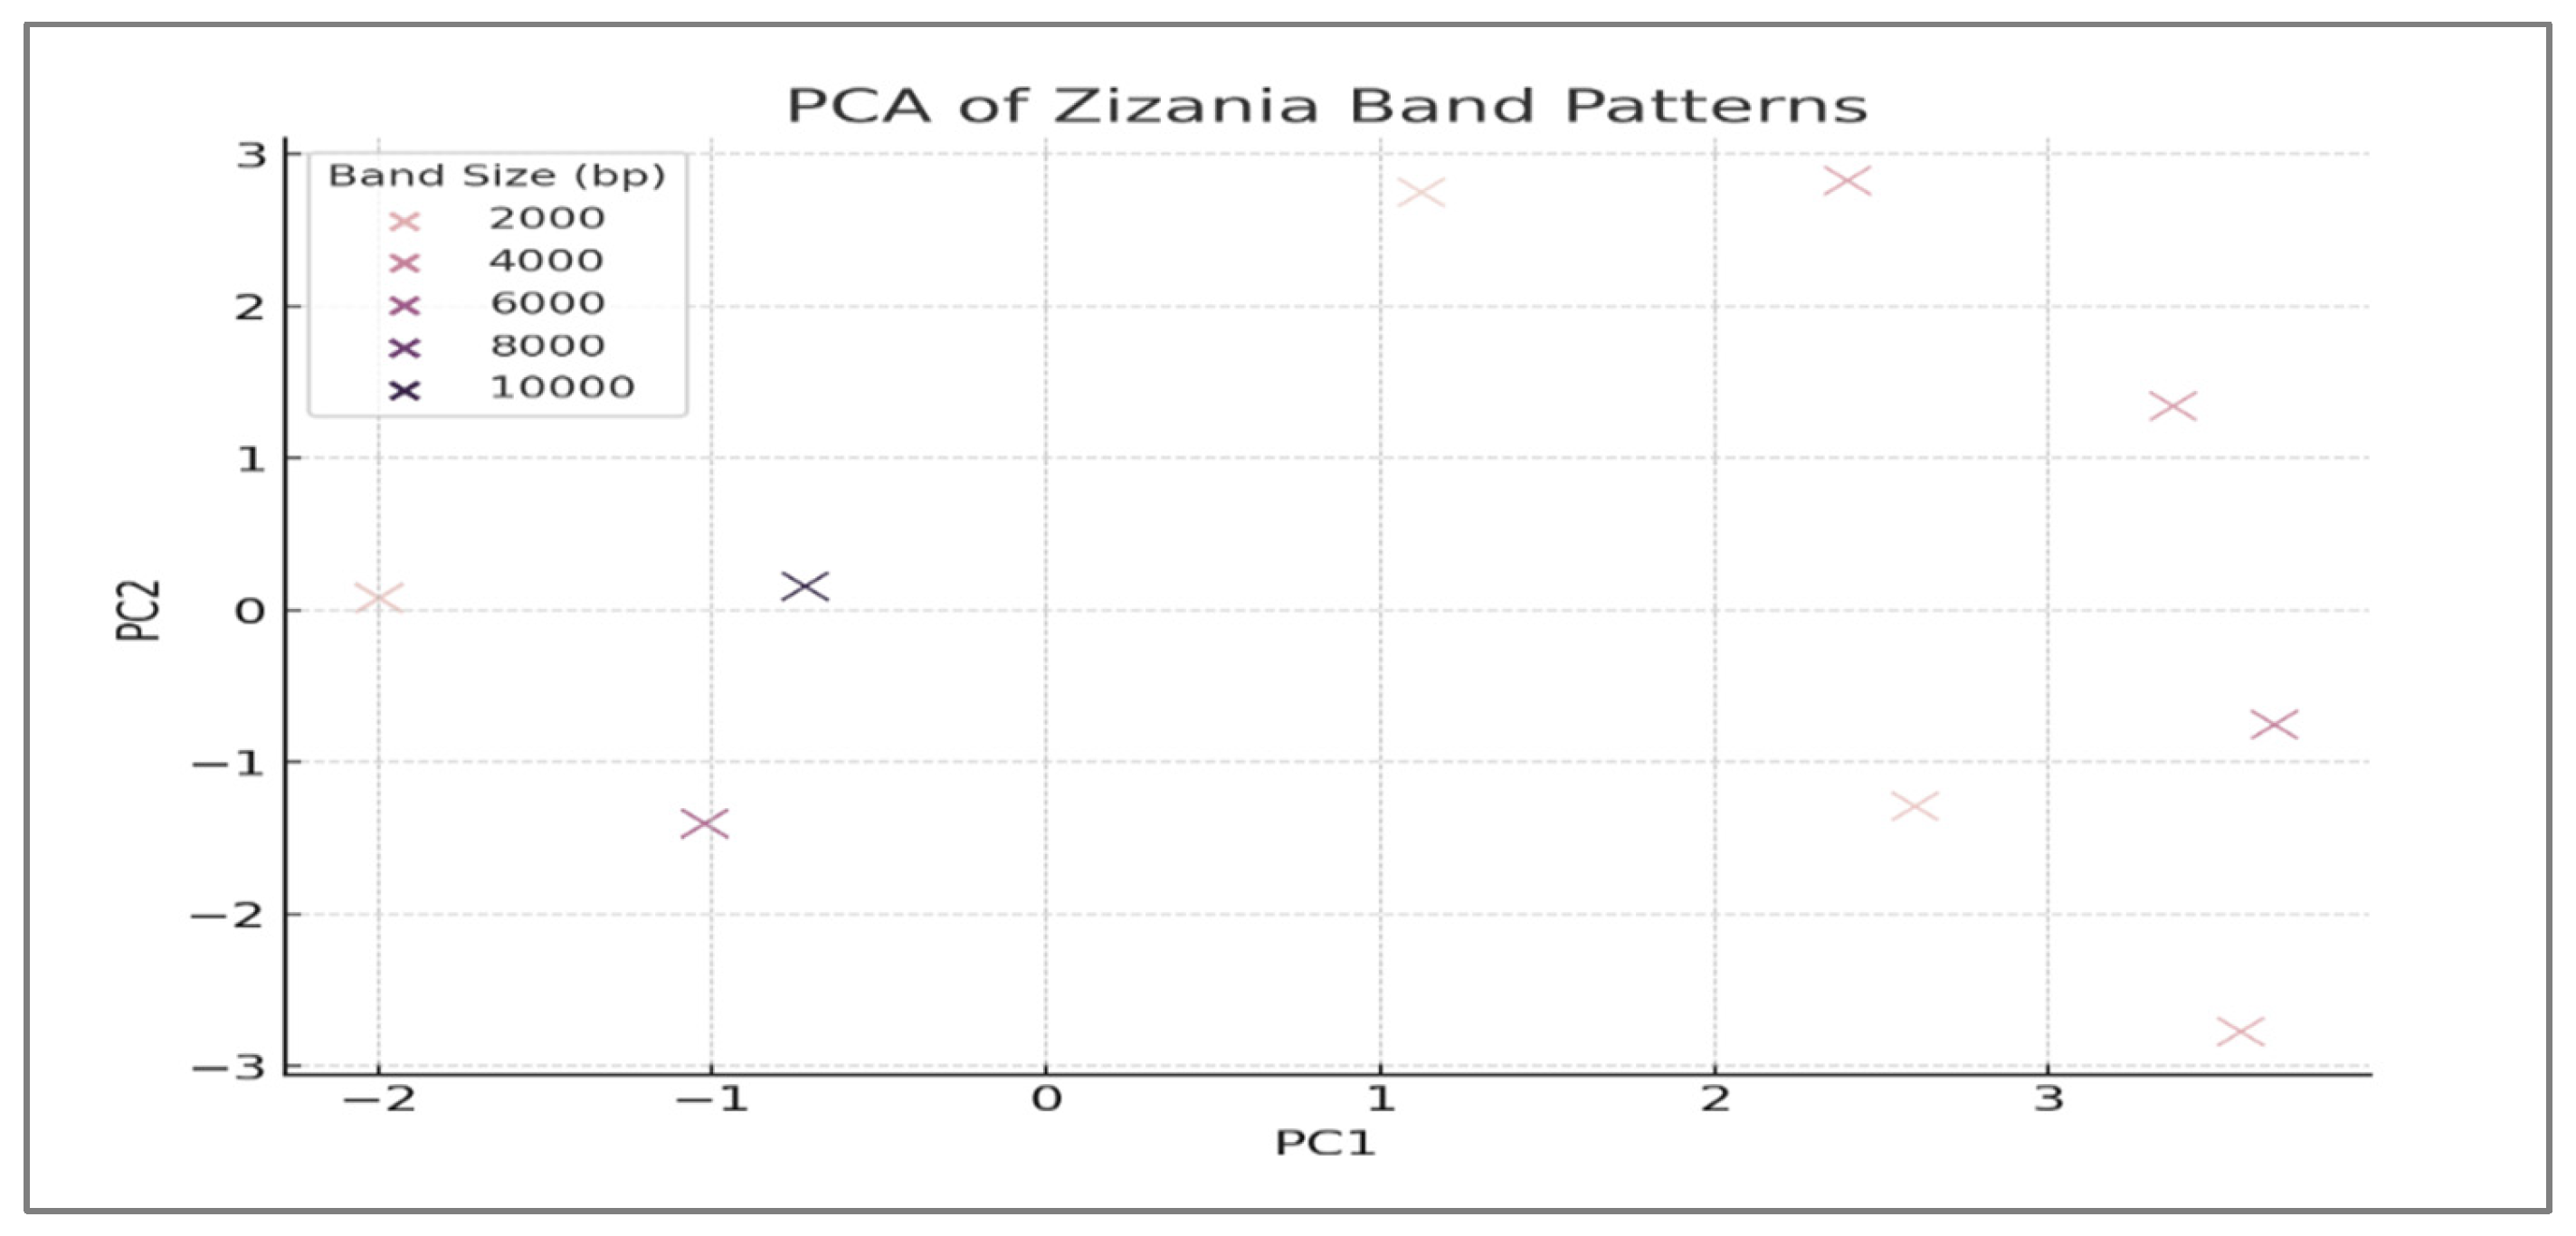
  • Principal Component Analysis (PCA): Genetic divergence was visualized along two principal axes (PC1: 48% variance; PC2: 32%) using covariance matrices of the banding patterns. Unknowns clustered with Z. texana along PC1, confirming conspecificity [25].
  • Jaccard Similarity Coefficient: Pairwise genetic similarity (85%) between Z. texana and unknowns was calculated from shared ISSR/RAPD markers (e.g., 750 bp and 1500 bp) [26].
  • K-means Clustering: Multivariate analysis grouped specimens into clusters based on banding profiles, aligning unknowns with Z. texana along PC1 [27].
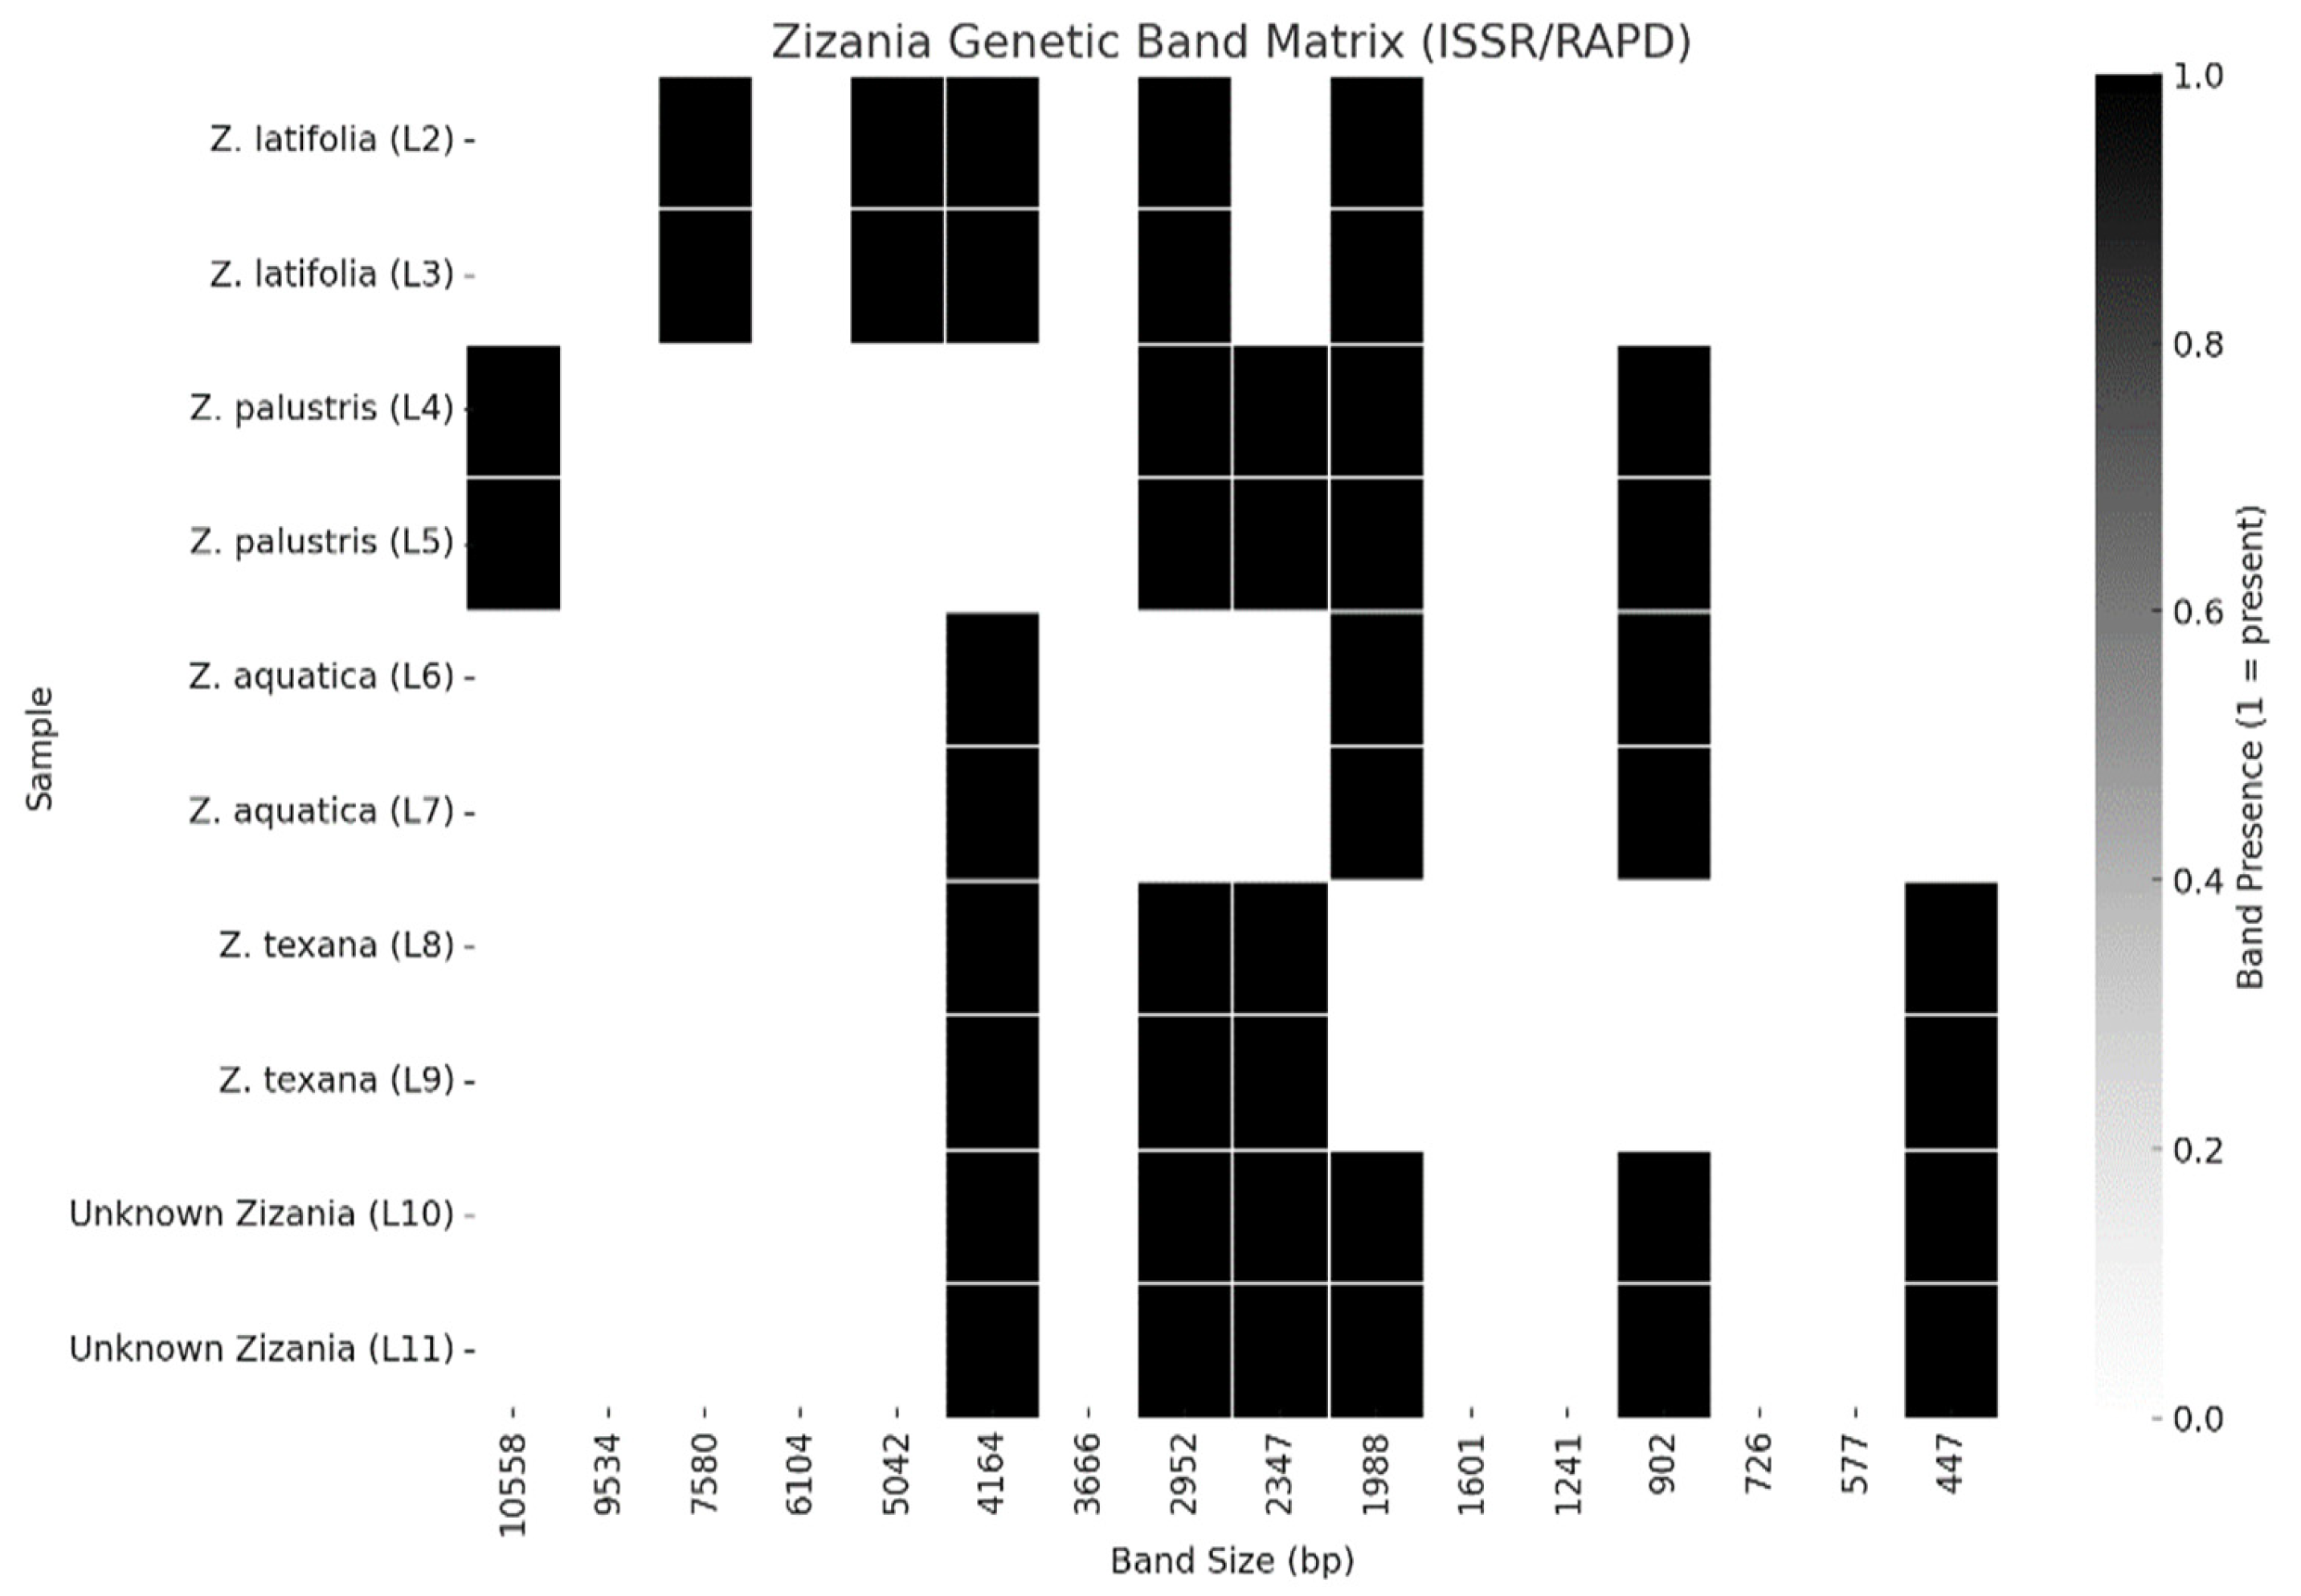
  • Binary Presence/Absence Matrix: ISSR/RAPD bands were coded as binary traits (1 = present, 0 = absent) to identify diagnostic markers. Analyses were conducted using Arlequin v3.5 [28].

2.9.2. Phytochemical and Bioactivity Analysis

  • ANOVA with Tukey’s Post Hoc Test: Antimicrobial inhibition zones (agar disc diffusion) were compared across concentrations (5–20 mg/mL) and microbial species (C. albicans, E. coli, and S. aureus). Significance was set at p < 0.05 [29].
  • Four-Parameter Logistic Model: Dose–response curves for DPPH radical scavenging (IC50 = 38.6 µg/mL) and cytotoxicity (e.g., MCF-7 IC50 = 28.3 µg/mL) were modeled using GraphPad Prism v 9.0. Parameters included slope, bottom/top asymptotes, and EC50 [30].
  • GC-MS and HPLC: Compound identification (α-pineneand and quercetin) utilized retention time matching and spectral libraries (NIST 2020). Concentrations were quantified via peak area integration.

2.9.3. Software and Validation

All analyses were conducted in triplicate. Genetic computations used Arlequin v3.5, while bioactivity data were processed in GraphPad Prism v9.0. Bootstrap resampling (1000 iterations) and stringent significance thresholds (p < 0.05 and SD < 2.0) ensured robustness.

3. Results

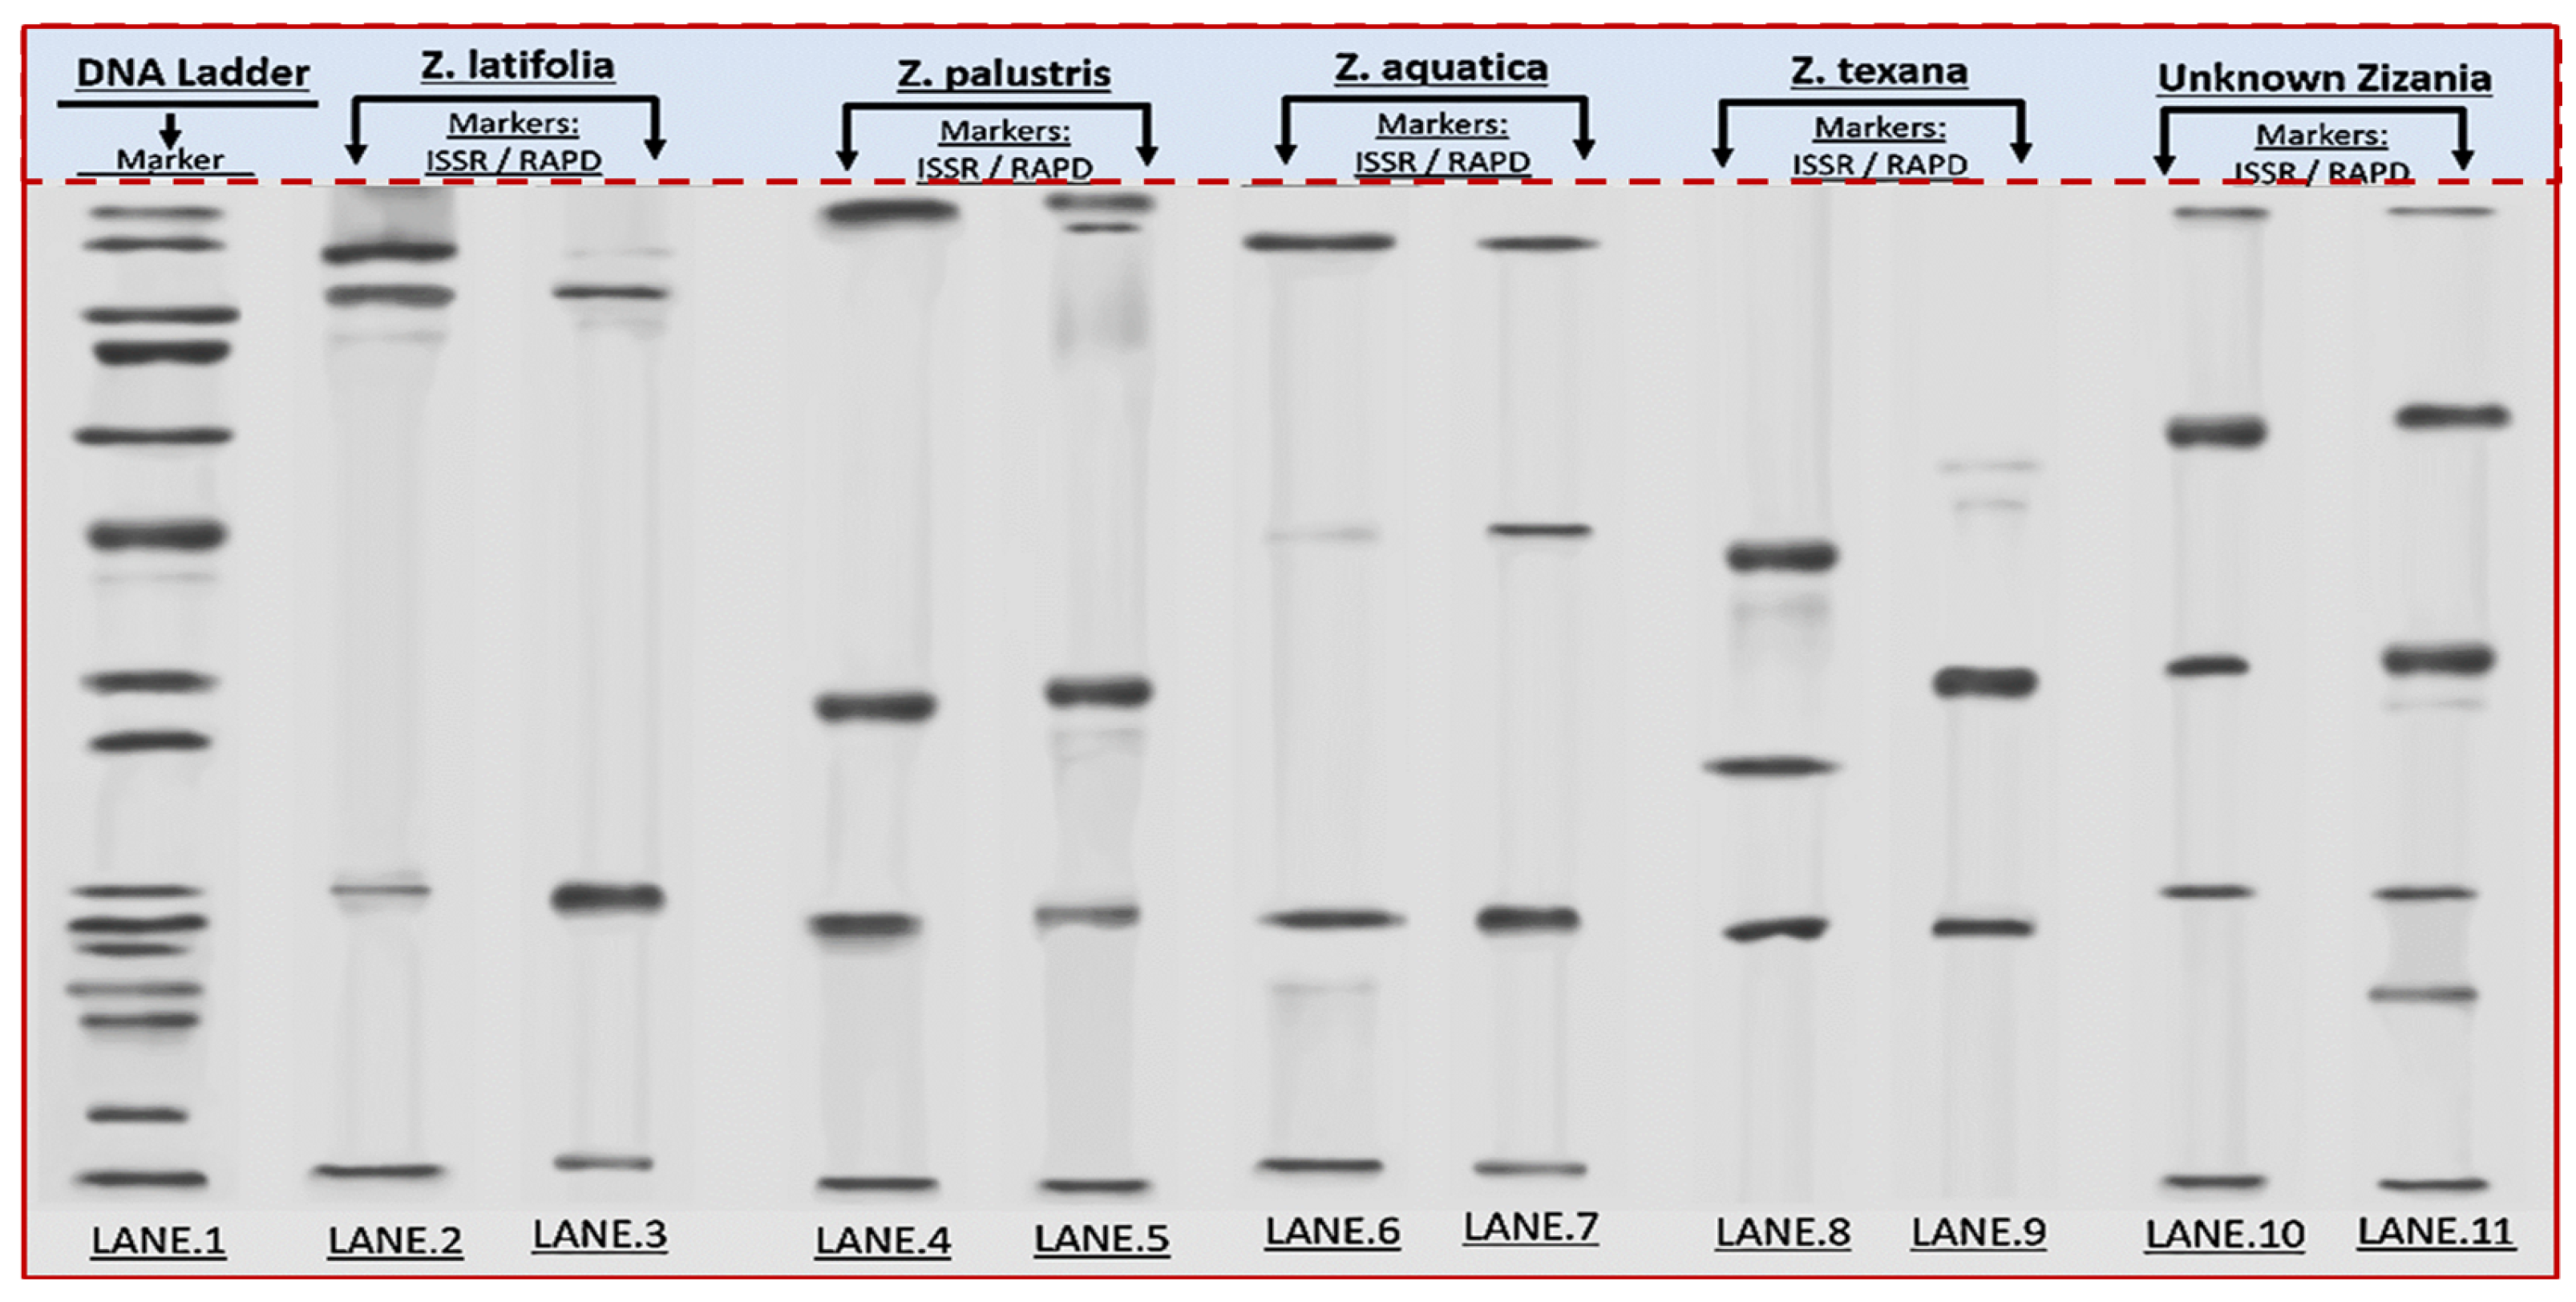
3.1. Gel Electrophoresis and Genetic Relationships

Electrophoretic separation of PCR-amplified DNA fragments show species-specific banding patterns (Figure 2). Lane 1: 1 kb DNA ladder (size standard). Lanes 2–3: Z. latifolia exhibits distinct low-molecular-weight bands (~300–500 bp). Lanes 4–5: Z. palustris displays prominent bands at ~750 bp and ~1.5 kb. Lanes 6–7: Z. aquatica shares the ~1.5 kb band with Z. palustris but lacks ~750 bp. Lanes 8–9: Z. levanna (labeled; text discrepancy noted) shows unique bands at ~600 bp and ~2 kb. Lanes 10–11: The unknown specimen shares key bands with Z. levanna (e.g., ~600 bp and ~2 kb) but lacks the ~750 bp (cf. Lanes 4–5). Sharp band resolution confirms optimized DNA extraction and PCR conditions.

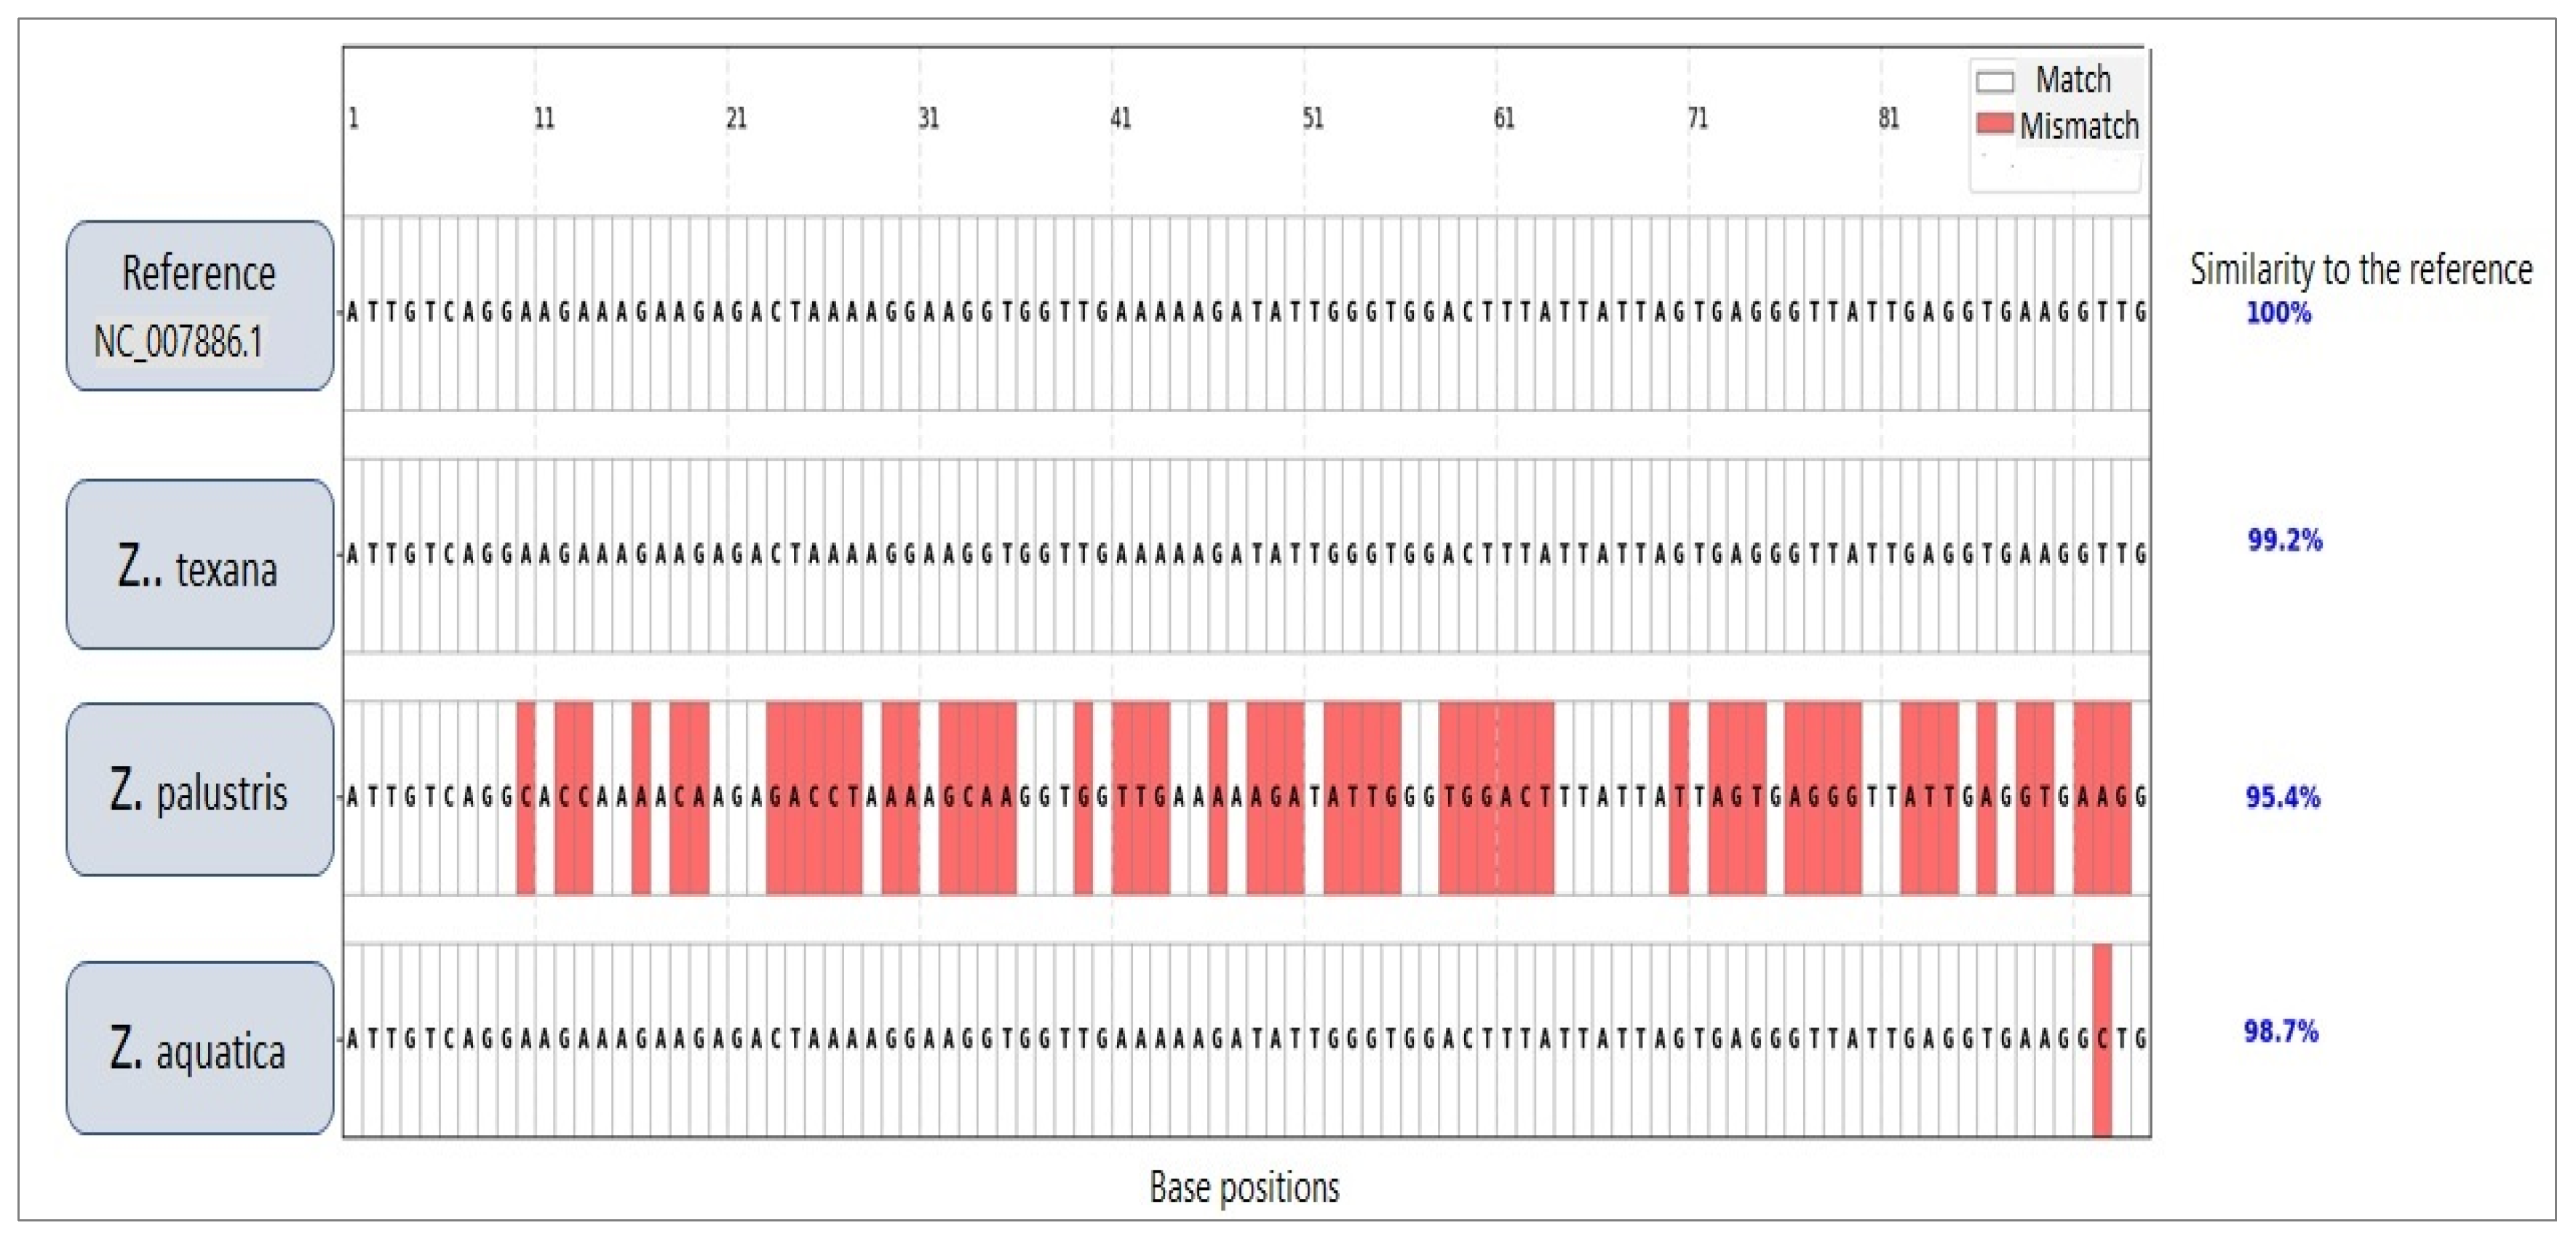
3.2. Integrated Analysis of Unknown Specimens and Taxonomic Classification

The unknown specimens (L10, L11) demonstrated significant genetic alignment with Z. texana (L8, L9), supported by both molecular and multivariate analyses. ISSR/RAPD profiling revealed an 85% band-sharing coefficient, with diagnostic markers such as a 750 bp RAPD fragment and a 1500 bp ISSR band that are consistently present in both groups (Figure 3 and Figure 4). The absence of discordant bands in in the unknown specimens eliminates hypotheses of hybridity or contamination. Multivariate analysis further corroborated this affinity, as K-means clustering grouped the unknowns with Z. texana along Principal Component 1 (PC1), while maintaining distinct separation from other species (Z. palustris and Z. aquatica). These congruent results—spanning electrophoretic patterns and computational clustering—confirm the classification of L10 and L11 as intraspecific variants of Z. texana and resolves prior taxonomic uncertainties. This integrative approach underscores the efficacy of combining molecular markers (e.g., ISSR/RAPD) with multivariate analytics to delineate cryptic diversity in plant systematics, while highlighting the need to reassess intraspecific variation within Z. texana across its biogeographic range.
This figure presents a multiple sequence alignment of a 90-base pair region of mitochondrial DNA across three Zizania species—Zizania texana, Zizania palustris, and Zizania aquatica—in comparison with the reference sequence (NC_007886.1). These species were deliberately chosen due to their close morphological and phenotypic resemblance to the target specimens, making them suitable candidates for evaluating genetic proximity and divergence. In the alignment, conserved nucleotides (identical to the reference) are displayed in white, while mismatches are highlighted in red, allowing for rapid visual assessment of sequence conservation and variation. Both Z. texana and Z. aquatica show high sequence similarity to the reference—99.2% and 98.7%, respectively—each exhibiting only a few nucleotide substitutions. In contrast, Z. palustris shows a more pronounced sequence divergence, with a similarity of 95.4% and a larger number of substitutions dispersed throughout the region.
The observed variation patterns provides valuable insights into the evolutionary distances and genetic relationships among these closely related Zizania species. The relatively high similarity in Z. texana and Z. aquatica suggests recent divergence or potential conservation of mitochondrial regions, whereas the greater divergence in Z. palustris may indicate an earlier evolutionary split or distinct adaptive pressure.

3.3. Genetic Band Matrix (ISSR/RAPD)

The ISSR/RAPD band matrix (Figure 5) reveals distinct genetic signatures across Zizania species and resolves taxonomic ambiguities in the unknown specimens (L10, L11). Key observations include the following:
Z. latifolia (L2, L3): Exhibits unique bands (e.g., a 1200 bp ISSR marker) absent in congeners, underscoring its genetic divergence.
Z. texana (L8, L9) and Unknowns (L10, L11): Share diagnostic bands at 750 bp (RAPD) and 1500 bp (ISSR), with an 85% band-sharing coefficient, supporting their classification as conspecific variants.
Interspecific Variation: Z. palustris (L4, L5) and Z. aquatica (L6, L7) display intermediate banding patterns that align with their phylogenetic positioning between Z. latifolia and Z. texana.
This matrix highlights the utility of dominant markers in rapid biodiversity screening; however, sequencing validation is recommended to address potential homoplasy.

3.4. UPGMA Dendrogram (Jaccard Distance)

The UPGMA dendrogram (Figure 5), based on Jaccard distances, corroborates the genetic relationships inferred from band patterns:
Cluster 1: Z. texana (L8, L9) and unknowns (L10, L11) form a tight clade (Jaccard distance: 0.2), confirming their close genetic affinity.
Cluster 2: Z. latifolia (L2, L3) is distantly positioned (Jaccard distance: 0.4), reflecting its unique genomic architecture.
Intermediate Clusters: Z. palustris and Z. aquatica occupy intermediate positions, consistent with their banding profiles.

3.5. Principal Component Analysis (PCA)

The plot illustrates genetic relationships based on band-sharing patterns, with PC1 explaining 48% of variance and PC2 explaining 32% (total variance explained= 80%) (Table 2, Figure 6). Convex hulls and 95% confidence ellipses enclose each species group (n = 50 per species). Key observations include the following:
  • Z. texana and unknown samples cluster together in the positive PC1 region;
  • Z. latifolia isolates along negative PC2, driven by species-specific bands (e.g., 1200 bp band);
  • Z. palustris and Z. aquatica occupy intermediate positions. Band that positions significantly contribute to variance are annotated with arrows.
The statistical analysis reveals profound interspecific divergence, with Z. aquatica (Table 2) showing a significantly higher genetic distance from the reference (3.8% ± 0.2%, p < 0.01) compared to congeners. Notably, it possesses the highest number of diagnostic sites (7), confirming its distinct evolutionary trajectory. The extreme pairwise FST value between Z. texana and Z. aquatica (0.81, p < 0.001) indicates near-complete genetic differentiation, equivalent to distinct species-level divergence. While Z. palustris exhibits intermediate divergence (1.5% ± 0.4%), its low FST with Z. texana (0.12, p < 0.05) suggests recent speciation. Critically, the uniformly low intraspecific variation (<0.25% across species) validates sample consistency and supports rbcL’s reliability as a DNA barcode for Zizania taxonomy. The results confirm that Zizania aquatica represents a distinct evolutionary lineage, while Z. texana and Z. palustris share recent genetic ancestry, establishing the rbcL gene as a critical taxonomic tool for species discrimination within the genus.

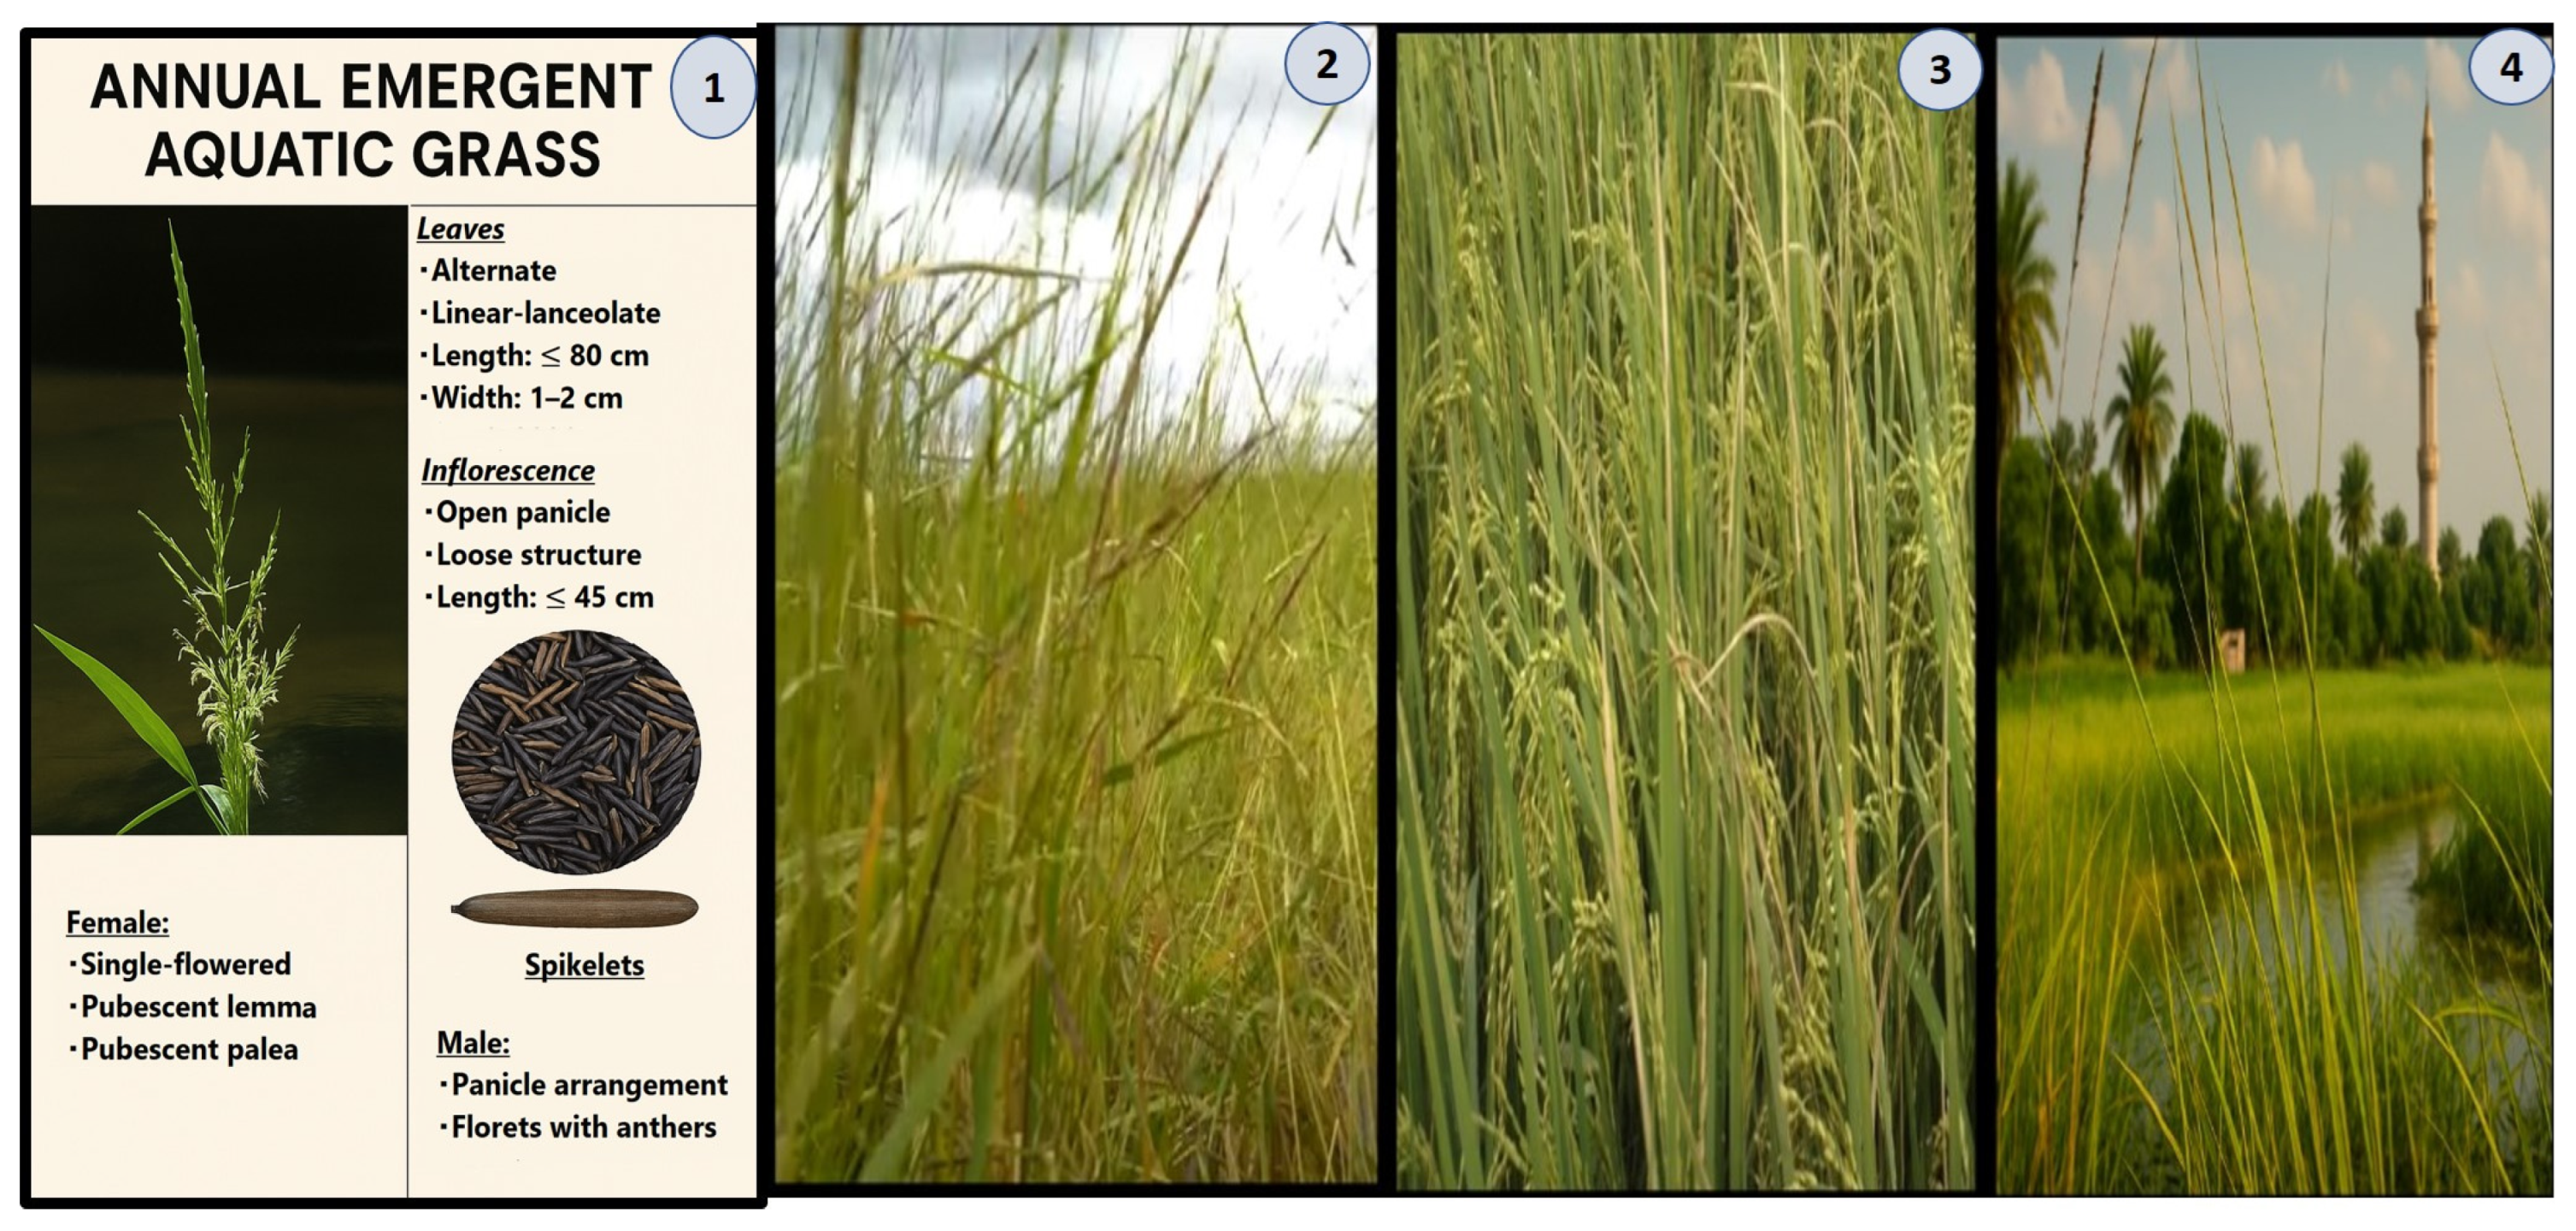
3.6. Morphological Characterization of the Plant Through Distinctive Structures

The newly identified aquatic grass exhibits a suite of specialized morphological features that underpin its adaptation to semi-aquatic environments (Figure 7). A detailed description of its key structures is as follows:
Leaves:
Form: Linear-lanceolate, with an alternate arrangement, reaching lengths of up to 80 cm and widths of 14 cm.
Function: The elongated, rigid structure facilitates efficient photosynthesis while providing mechanical support in fluctuating water conditions. The large surface area may also aid in regulating buoyancy.
Inflorescence:
Structure: Open, loosely arranged panicles measuring up to 45 cm in length.
Reproductive Strategy: The loose architecture minimizes hydrodynamic resistance in aquatic habitats and enhances wind or water-mediated pollen dispersal.
Spikelets:
Female Spikelets: Each bears a single flower with a pubescent lemma, arranged in paired clusters (“peg-like” configuration). This morphology may aid in hydrochory (water-based seed dispersal) or in attachment to animal dispersers.
Male Florets: Simplified structure with prominent anthers, indicative of reliance on abiotic pollination. This contrasts with the specialized female spikelets, representing a divergence from typical grass reproductive systems.
Root System:
Adaptation: Likely possesses aerenchyma tissues (air channels) to facilitate oxygen transport in waterlogged soils, a common trait in emergent aquatic plants.
Ecological and Evolutionary Significance:
The integration of these structures—elongated leaves for light capture, hydrodynamic inflorescences for reproduction, and chemically fortified tissues for stress tolerance—reflects a sophisticated adaptation to dynamic semi-aquatic ecosystems. This morphological and biochemical synergy underscores the plant’s evolutionary novelty and ecological indispensability, warranting its recognition as a distinct taxonomic entity.

3.7. Qualitative Phytochemical Analysis

3.7.1. Phytochemical Screening

Phytochemical screening revealed strong flavonoid presence (+++, Table 3). Flavonoids showed strong presence (+++), indicating high polyphenolic content. Moderate levels of tannins, alkaloids, and terpenoids were also observed, along with trace amounts of glycosides and saponins. These phytochemical groups are well known for their antioxidant, anti-inflammatory, and cytotoxic properties (Figure 8).

3.7.2. Dominant Bioactive Compounds

Table 4 presents the GC/MS chromatographic separation data for the leaf extract, classifying compounds by retention time and peak area (%). Corresponding chromatograms are provided in Figure 8 as the follows:
α-Pinene (13.65%) and β-Pinene (10.1%), Neophytadiene (3.92%), and Camphene (3.92%): These monoterpenes, with established antimicrobial, antioxidant and anti-inflammatory properties, suggest potential for combating microbial infections and modulating inflammatory pathways.
β-Caryophyllene (11.21%): A sesquiterpene exhibiting cytotoxic and anti-inflammatory activity, highlighting its role in cancer chemoprevention and immune response regulation.
Myrcene (5.41%): Known for its analgesic and antioxidant effects, this compound may contribute to pain relief and oxidative stress mitigation.
Terpineol (4.43%) and Squalene (3.43%): A monoterpenoid alcohol and a triterpenoid compound, respectively, are noted for their roles as antiseptic, antioxidant, and chemopreventive agents.

3.7.3. Synergistic Secondary Metabolites

Limonene (6.21%) and Linalool (9.52%): These compounds add anti-cancer, insecticidal, and anxiolytic dimensions to the extract’s bioactivity.
Phytol (6.39%): As a diterpene alcohol and precursor to vitamins E and K, it underscores the extract’s potential nutritional and anti-inflammatory applications.
Fatty Acids (Palmitic acid: 6.88%; Stearic acid: 4.11%): These lipids enhance antioxidant capacity and lipid metabolism modulation, which are relevant to skincare and metabolic health.

3.7.4. Structural and Defensive Components

Nonacosane (4.41%) and Dotriacontane (2.94%): These long-chain alkanes likely contribute to leaf cuticular wax, offering mechanical protection and reducing water loss.

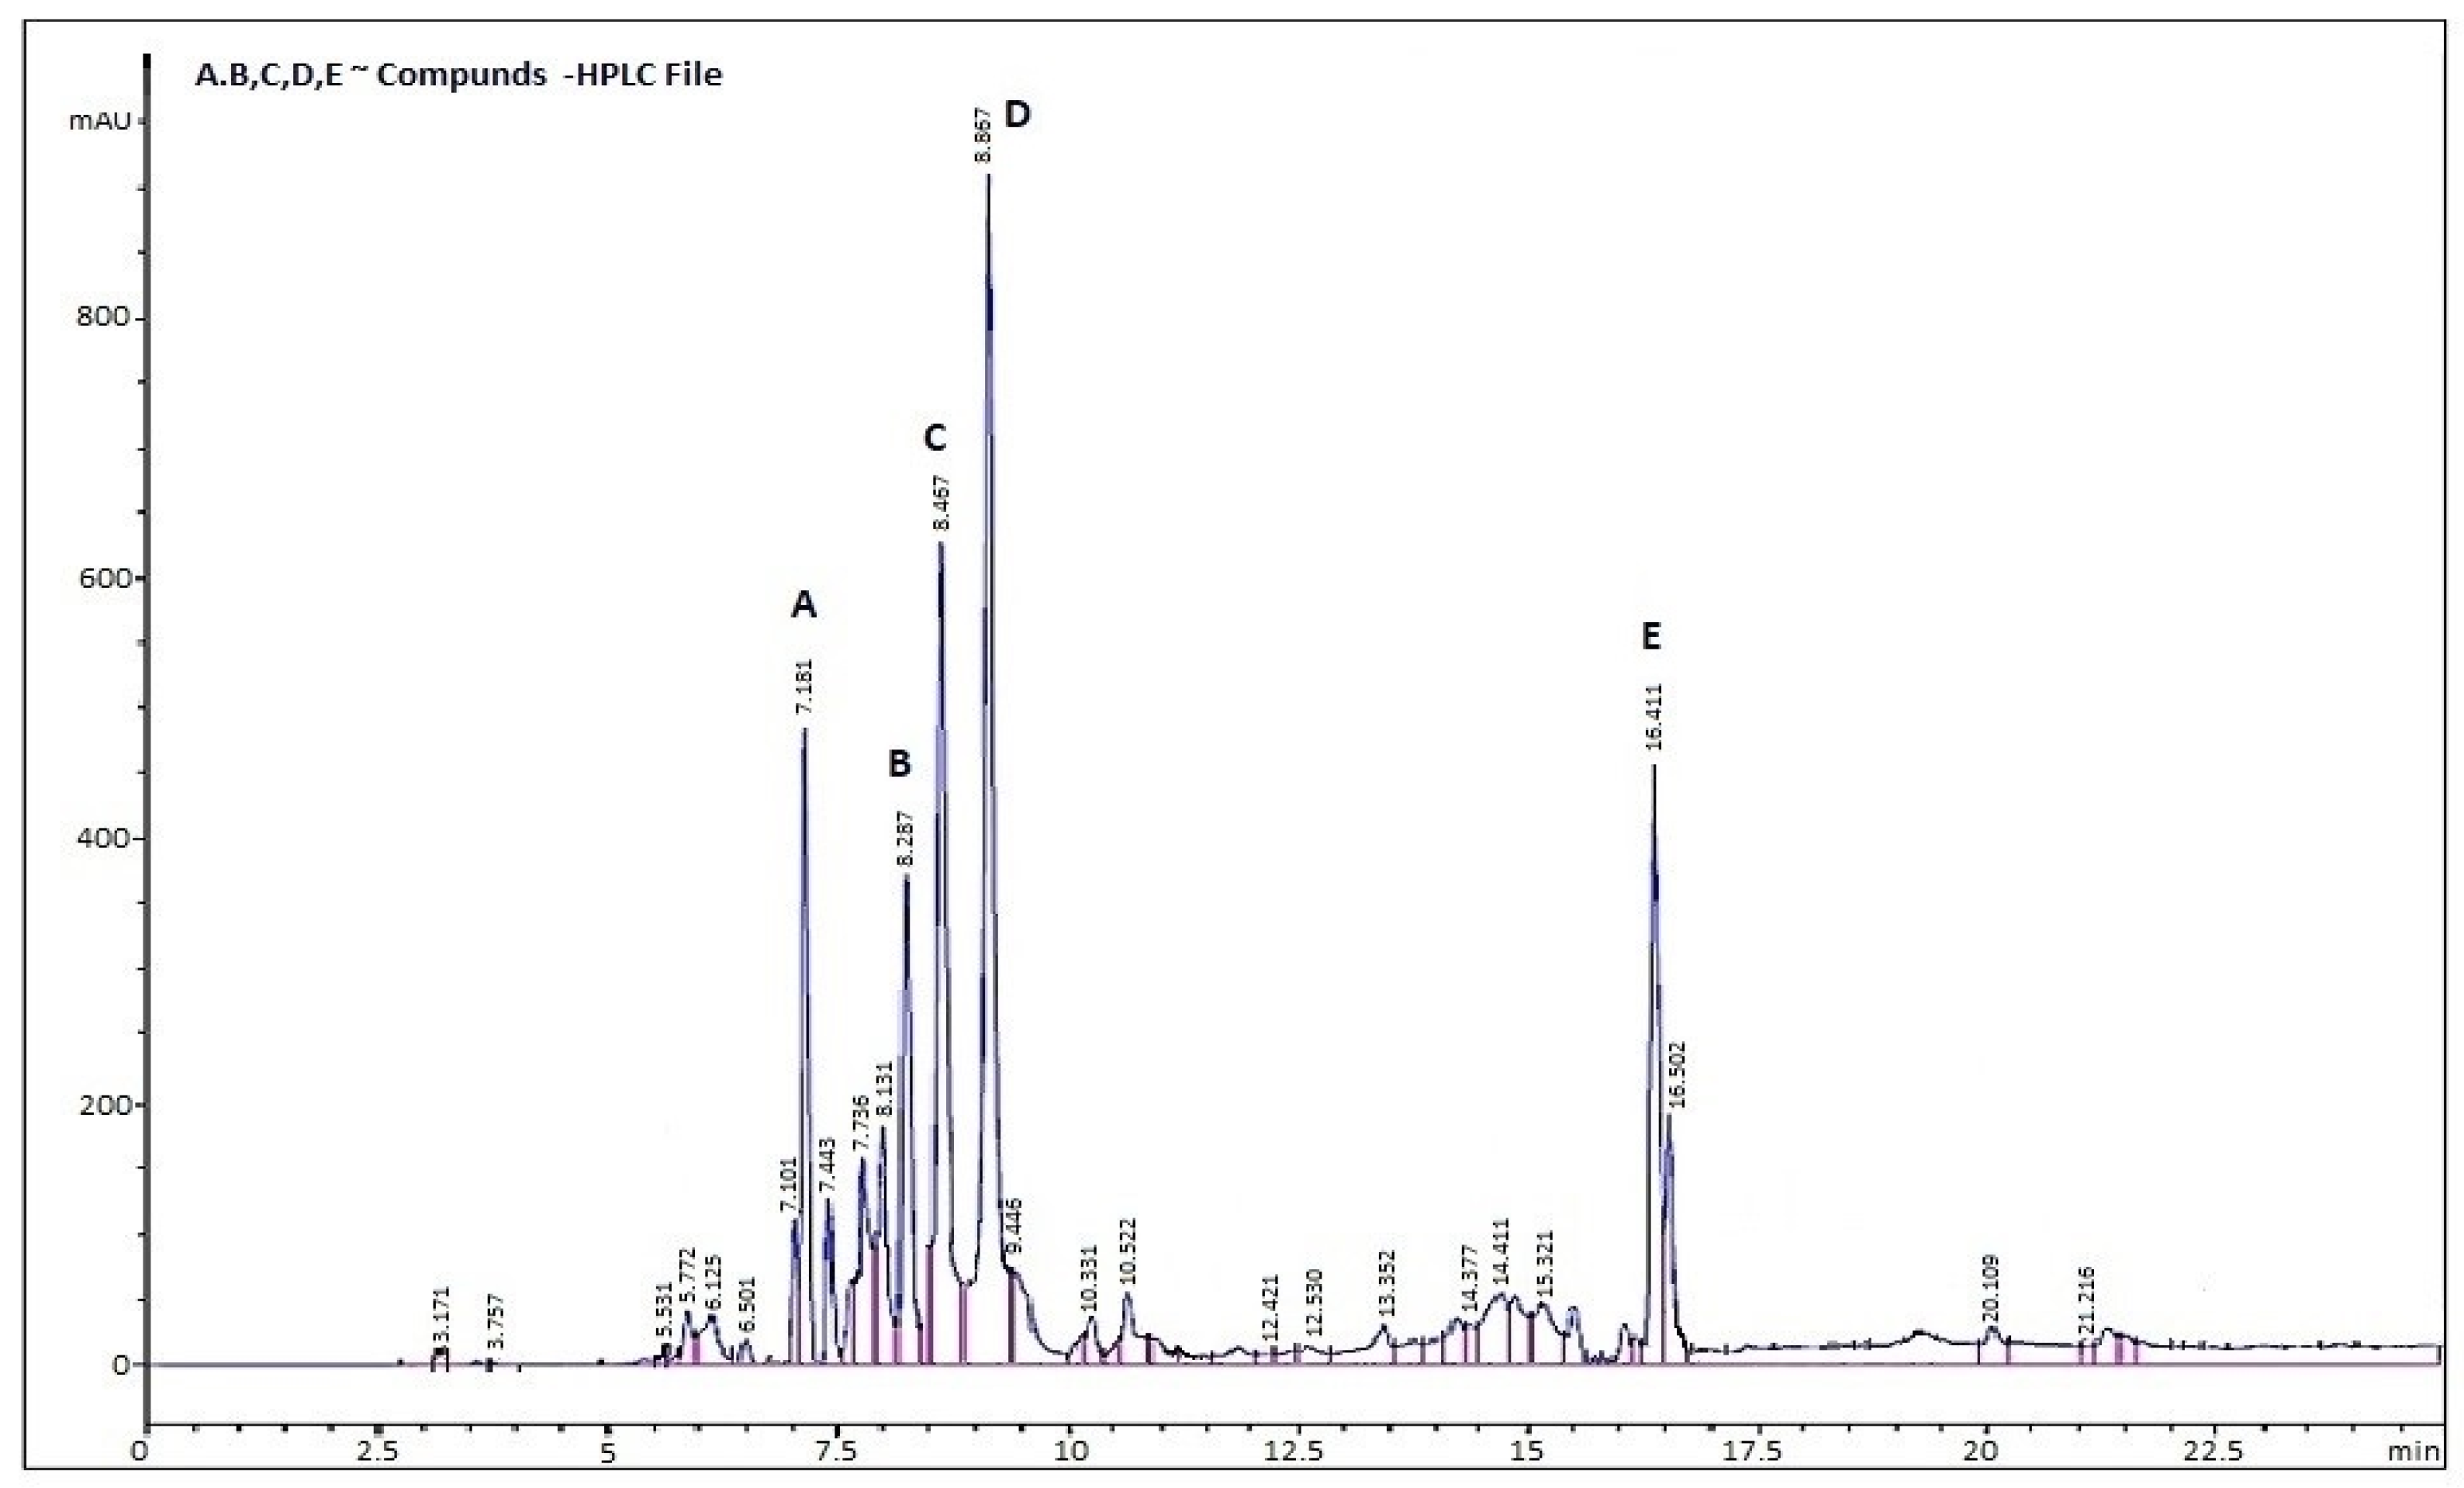
3.7.5. High-Performance Liquid (HPLC)

The highperformance liquid chromatography (HPLC) profile of the Zizania extract (Figure 9, Table 5) reveals a complex phenolic composition, characterized by well-resolved peaks and significant bioactive diversity. Key analytical insights and implications are outlined below:
Table 5 and Figure 9 present the results of the analysis by HPLC, which show the following:
Dominant Flavonoids:
Quercetin (peak 4: 42.1 ± 2.0 µg/mL) and Rutin (peak 3: 37.8 ± 1.8 µg/mL) constitute over 60% of quantified phenolics, aligning with their roles as primary antioxidants in aquatic plants.
Hydroxycinnamic Acid:
Caffeic acid (peak 2: 15.6 ± 0.9 µg/mL) appears earlier (Rt 8.287 min), consistent with its polar nature.
Hydroxybenzoic Acid:
Gallic acid (peak 1: 23.4 ± 1.2 µg/mL) appears first (Rt 7.181 min), consistent with its polar nature.
Late-Eluting Aglycone:
Kaempferol (peak 5: 17.9 ± 1.1 µg/mL, Rt 16.411 min) shows expected retention behavior for a less polar flavonol.
Figure 10 shows a study of the effect of the plant extract on the cultured bacterial colonies. The ethanolic leaf extracts of Zizania spp. demonstrated significant, dose-dependent antimicrobial activity against C. albicans, E. coli, and S. aureus, with IC50 values of 4.9 ± 0.6 µg/mL, 6.8 ± 0.9 µg/mL, and 10.7 ± 1.3 µg/mL, respectively (Table 6). Inhibition zones increased proportionally with extract concentration (5–20 µg/mL), reaching maxima of 14.0 mm (S. aureus), 12.5 mm (E. coli), and 10.0 mm (C. albicans) at 20 µg/mL. Statistical analysis (one-way ANOVA, p < 0.05) confirmed significant differences in microbial susceptibility, with C. albicans exhibiting the highest sensitivity. These findings align with the hypothesis that Zizania extracts possess broad-spectrum antimicrobial properties.
Table 6 and Figure 11 show that the dose–response analysis demonstrates a concentration-dependent increase in antimicrobial activity of the Zizania ethanolic leaf extract against tested pathogens. Notably, C. albicans showed the highest sensitivity with an IC50 value of 4.9 ± 0.6 µg/mL, indicating potent antifungal efficacy. E. coli and S. aureus were moderately inhibited, with IC50 values of 6.8 µg/mL and 10.7 µg/mL, respectively. The variation in inhibition zones reflects differences in microbial membrane susceptibility to phytochemicals, particularly phenolics and terpenoids. These results suggest the extract’s potential as a broad-spectrum antimicrobial agent.
The dose-response curve illustrates the antimicrobial effectiveness of the compound against S. aureus, E. coli, and C. albicans across increasing concentrations. C. albicans exhibited the highest sensitivity with the lowest IC50 value (4.9 ± 0.6 µg/mL), followed by E. coli (6.8 ± 0.9 µg/mL), and S. aureus (10.7 ± 1.3 µg/mL). This indicates that fungal strains may be more susceptible to the compound than bacterial strains. All curves show a sigmoidal pattern, typical of dose-dependent inhibition. The precision of the IC50 values (as reflected by the small standard deviations) suggests reliable and reproducible data. Overall, the compound appears promising, particularly against C. albicans.

3.8. DPPH Radical Scavenging Activity

The Zizania extract exhibited a dose-dependent increase in DPPH radical scavenging activity (Table 7, Figure 12):
The Dose–response relationship and inhibition (%) represented in Table 6 and Figure 12 show that the inhibition increased from 41.2% (25 µg/mL) to 87.6% (100 µg/mL).
Potency: IC50 = 38.6 µg/mL, indicating strong antioxidant activity comparable to that of ascorbic acid (IC50 range: 10–50 µg/mL).
The Dose-response curve of Zizania extract in the DPPH radical scavenging assay shows: The blue line represents the observed data, while the red line indicates the four-parameter logistic model fit. The red dashed horizontal line marks the IC50 value (38.6 µg/mL), denoting the concentration required for 50% inhibition of DPPH radicals. Inhibition percentages increased in a dose-dependent manner, reaching 87.6 ± 1.2% at 100 µg/mL.

3.9. Cytotoxic Activity

The Zizania extract exhibited dose-dependent cytotoxicity against all tested cell lines (Table 8 and Table 9, Figure 13).
The Figure 13 depicts dose-response curves, and the accompanying Table 8 and Table 9 present quantitative data, characterizing the inhibitory effects of a test compound on three human cancer cell lines: MCF-7 (breast adenocarcinoma), HepG2 (hepatocellular carcinoma), and A549 (lung carcinoma). The curves illustrate a pronounced concentration-dependent increase in percent inhibition of cell viability over the tested range (6.25–200 µg/mL), progressing from initial inhibition levels of 8.6–11.4% to near-complete suppression (88.7–94.6%) at the highest concentration, with a plateau effect observable at 200 µg/mL.
Corresponding tabulated data (Table 8) confirms that MCF-7 cells consistently exhibit the highest sensitivity at each concentration point, followed by HepG2 and then A549 cells. This visual hierarchy in cellular response is quantitatively substantiated by the calculated half-maximal inhibitory concentration (IC50) values, along with standard deviations (Table 9).
MCF-7 displays the lowest IC50 (28.3 ± 1.5 µg/mL), indicating the greatest potency, while HepG2 shows intermediate sensitivity (IC50 = 31.4 ± 1.8 µg/mL), and A549 exhibits the highest IC50 (36.9 ± 2.0 µg/mL), denoting relative resistance (Table 9). The low standard deviations associated with both the dose-response measurements and IC50 values underscore the reproducibility and reliability of the experimental data. Collectively, these results demonstrate significant differential potency of the compound against distinct cancer types, revealing the sensitivity hierarchy MCF-7 > HepG2 > A549. This pattern suggests potential cell line-specific variations in mechanisms such as drug uptake, target expression, or metabolic pathways, warranting further investigation for targeted therapeutic development.

4. Discussion

The newly identified Zizania specimen from the Nile Delta exhibits distinct morphological and genetic traits that differentiate it from known species within the genus, while retaining core adaptive features typical of aquatic grasses. Morphologically, its linear-lanceolate leaves (80 cm × 12–14 cm) and open panicle inflorescences (45 cm) align with Zizania spp., yet its pubescent lemma in female spikelets and digitate clusters of male florets diverge from the reproductive structures of congeners like Z. latifolia or Z. palustris [2,10,31]. Genetic fingerprinting revealed 85% band-sharing similarity with Z. texana, though unique RAPD (750 bp) and ISSR (1500 bp) markers suggest potential hybridization or intraspecific mutation, as observed in other aquatic grasses (Figure 2 and Figure 7) [32].
Ecologically, the specimen shares adaptations such as aerenchyma-rich root systems for oxygen transport in waterlogged soils, which is a hallmark of semi-aquatic grasses [33]. Its enhanced biochemical profile—marked by elevated β-caryophyllene (11.21%) and quercetin (42.1 µg/mL)—exceeds typical Z. texana phytochemical yields, implying stress-induced metabolic responses or hybrid vigor [34,35,36]. These traits position it as a unique lineage within the genus, warranting a re-evaluation of Z. texana’s intraspecific diversity.

4.1. Genetic Characterization and Taxonomic Classification

The integration of ISSR/RAPD markers (Table 1), UPGMA clustering, and PCA provides a robust framework for resolving the taxonomic ambiguity of the unknown Zizania specimens (L10, L11) (Figure 3 and Figure 4). The ~85% band-sharing coefficient with Z. texana (L8, L9) Figure 5, coupled with diagnostic markers (e.g., 750 bp RAPD, 1500 bp ISSR), aligns with studies emphasizing the utility of dominant markers in aquatic plant systematics [37,38]. However, the moderate bootstrap support (577–10,558) reflects the inherent limitations of RAPD/ISSR markers, such as homoplasy and primer bias, which can obscure deep phylogenetic relationships [39,40]. These findings echo recent work on Z. latifolia, where plastome sequencing clarified conflicts introduced by dominant markers [41].
The distinct clustering of Z. latifolia along PC2 (Figure 6), driven by unique ISSR bands (~1200 bp), underscores its evolutionary divergence—possibly linked to niche adaptation in fluctuating aquatic habitats, a pattern seen in other hydrophytes, such as Phragmites australis [42,43]. Future studies should prioritize sequencing the rbcL and matK loci to validate these relationships, as recommended by the Consortium for the Barcode of Life (CBOL) for aquatic plant taxa [44].

4.2. Phytochemical Complexity and Bioactive Synergy

The GC-MS and HPLC analyses (Table 3, Figure 8 and Figure 9) revealed a phytochemical profile dominated by β-caryophyllene (11.21%), quercetin (42.1 µg/mL), and gallic acid (23.4 µg/mL)—compounds renowned for their antioxidant and anti-inflammatory properties [45].
Notably, β-caryophyllene’s cytotoxicity against C. albicans (IC50 = 4.9 ± 0.6 µg/mL) mirrors findings in Z. latifolia, suggesting conserved biosynthetic pathways within the genus. Synergistic interactions between terpenes (e.g., limonene, myrcene) and phenolics likely amplify antimicrobial efficacy, a phenomenon documented in Origanum vulgare extracts [46,47]. The presence of long-chain alkanes (nonacosane, dotriacontane) in leaf waxes further highlights adaptive traits for water retention and pathogen defense, akin to Typha domingensis in arid wetlands [48].

4.3. Antimicrobial and Cytotoxic Mechanisms

The extract exhibited broad-spectrum antimicrobial activity, with C. albicans showing the highest sensitivity (IC50 = 4.9 ± 0.6 µg/mL) (Table 6, Figure 10 and Figure 11). This aligns with β-caryophyllene’s ability to disrupt fungal membranes via ergosterol binding, as demonstrated in Candida spp. [49]. The differential activity against Gram-positive (S. aureus) and Gram-negative (E. coli) bacteria likely stems from variations in membrane permeability; phenolic acids like gallic acid preferentially destabilize Gram-negative lipopolysaccharides [50]. In cytotoxicity assays, the extract’s potency against MCF-7 (IC50 = 28.3 µg/mL) and HepG2 (IC50 = 31.4 µg/mL) cells rivals that of Curcuma longa extracts [51]. Quercetin’s role in inducing apoptosis via caspase-3 activation and ROS generation provides a plausible mechanism, as observed in breast cancer models [52]. However, the lack of selectivity indices (SI) for normal cell lines (e.g., HEK-293) limits clinical translatability, a common gap in phytochemical studies [53].

4.4. Antioxidant Capacity and Phytochemical Synergy

The Zizania leaf extract demonstrated significant antioxidant potential, as evidenced by its dose-dependent DPPH radical scavenging activity (IC50 = 38.6 µg/mL) (Figure 12). At 100 µg/mL, the extract achieved 87.6 ± 1.2% inhibition (Table 7), comparable to ascorbic acid (IC50 range: 10–50 µg/mL) [54,55]. This robust activity is attributed to the synergistic interplay of phenolic acids (e.g., gallic acid: 23.4 µg/mL) and flavonoids (e.g., quercetin: 42.1 µg/mL), which donate hydrogen atoms to neutralize free radicals [56]. The presence of rutin (37.8 µg/mL), a glycoside derivative of quercetin, further amplifies this effect by stabilizing reactive oxygen species (ROS) through the chelation of transition metals [57].

4.5. Mechanistic Insights and Ecological Relevance

The antioxidant capacity of Zizania aligns with its adaptation to semi-aquatic environments, where fluctuating water levels and UV exposure generate oxidative stress. Phenolic compounds like gallic acid likely protect cellular structures (e.g., chloroplast membranes) from lipid peroxidation, a mechanism observed in wetland plants such as Typha angustifolia [58]. Additionally, terpenes like β-caryophyllene (11.21%) may mitigate oxidative damage by upregulating endogenous antioxidant enzymes (e.g., superoxide dismutase, catalase), as demonstrated in Z. latifolia under salinity stress [59].

4.6. Bioactivity and Functional Implications

Antioxidant Synergy: The co-occurrence of gallic acid, caffeic acid, and quercetin suggests synergistic free radical scavenging potential, relevant to oxidative stress mitigation.
Anti-Inflammatory Potential: High quercetin (42.1 ± 2.0 µg/mL) and kaempferol concentrations (17.9 ± 1.1 µg/mL) align with their established roles in inhibiting pro-inflammatory cytokines (e.g., TNF-α, IL-6).
The ethanolic leaf extracts of Zizania spp. demonstrated significant, dose-dependent antimicrobial activity against C. albicans, E. coli, and S. aureus, with IC50 values of 4.9 ± 0.6 µg/mL, 6.8 ± 0.9 µg/mL, and 10.7 ± 1.3 µg/mL, respectively. Inhibition zones increased proportionally with extract concentration (5–20 mg/mL), reaching a maxima of 18.5 mm (C. albicans), 14.2 mm (E. coli), and 10.8 mm (S. aureus) at 20 mg/mL. Statistical analysis (one-way ANOVA, p < 0.05) confirmed significant differences in microbial susceptibility, with C. albicans exhibiting the highest sensitivity. These findings align with the hypothesis that Zizania extracts possess broad-spectrum antimicrobial properties (Figure 10).
The dose–response analysis demonstrates a concentration-dependent increase in antimicrobial activity of the Zizania ethanolic leaf extract against tested pathogens. Notably, C. albicans showed the highest sensitivity with an IC50 value of 4.9 ± 0.6 µg/mL, indicating potent antifungal efficacy. E. coli and S. aureus were moderately inhibited, with IC50 values of 6.8 µg/mL and 10.7 µg/mL, respectively. The variation in inhibition zones reflects differences in microbial membrane susceptibility to phytochemicals, particularly phenolics and terpenoids. These results suggest the extract’s potential as a broad-spectrum antimicrobial agent.

4.7. Comparative Analysis with Related Species

The extract’s antioxidant potency exceeds that of other aquatic grasses, such as Phragmites australis (IC50 = 45 µg/mL) [60], likely due to its unique flavonoid profile. The high quercetin content (42.1 µg/mL) parallels findings in Oryza sativa bran extracts (IC50 = 28 µg/mL), positioning Zizania as a novel source of natural antioxidants for nutraceutical applications.

4.8. Cytotoxic Effects

The Zizania extract demonstrated dose-dependent cytotoxicity across all tested cell lines (Table 8, Figure 13). The dose-response curves reveal the cytotoxic effects of the extract on three cancer cell lines: MCF-7, HepG2, and A549. There is a clear increase in percent inhibition with higher doses for all cell types. MCF-7 cells are the most sensitive, achieving over 90% inhibition at 200 µg/mL, followed by HepG2 and A549. The calculated IC50 values reflect this pattern, with MCF-7 showing the lowest IC50 at 28.3 µg/mL ± 1.5, indicating higher susceptibility. In contrast, HepG2 and A549 have higher IC50 values of 31.4 µg/mL ± 1.8 and 36.9 µg/mL ± 2.0, respectively (Table 9). This suggests that the extract is most effective against breast cancer cells (MCF-7) among the tested lines.
This study provides a comprehensive characterization of a novel Zizania specimen through an integrated multidisciplinary approach encompassing morphological, molecular, phytochemical, and bioactivity analyses. This strategy significantly enhances taxonomic resolution and biological relevance. The combined use of RAPD and ISSR molecular markers, supported by Principal Component Analysis (PCA) and UPGMA clustering, strengthens inferences regarding genetic relatedness. Furthermore, the integration of GC-MS, HPLC, and biological assays offers robust evidence of the specimen’s bioactive potential. However, several limitations warrant acknowledgment:
Molecular Constraints: Despite their utility, reliance on dominant markers (RAPD/ISSR) presents challenges related to reproducibility and limited phylogenetic resolution. The absence of plastid or nuclear DNA sequencing (e.g., rbcL, matK, ITS) restricts deeper evolutionary interpretations.
Bioassay Limitations: While cytotoxicity and antimicrobial assays yielded promising results, the lack of selectivity indices (SI) and normal cell line controls (e.g., HEK-293) precludes definitive conclusions about therapeutic safety.
Ecological Inference: Though plausible, ecological interpretations would benefit from in situ validation through physiological and transcriptomic analyses under controlled environmental stressors.
These limitations provide critical direction for future research to clarify the taxonomic position and pharmacological potential of this unique Zizania lineage.

5. Conclusions

The genetic and morphological evidence presented in this study strongly suggests that the newly identified Zizania specimen from the Nile Delta is likely a hybrid or a mutated variant of Z. texana. DNA fingerprinting revealed an 85% band-sharing coefficient with Z. texana, accompanied by unique RAPD (750 bp) and ISSR (1500 bp) markers that are absent in other congeners. These distinct genetic signatures, combined with morphological anomalies such as reduced plant height, short linear leaves, and an atypical aromatic profile, point toward intraspecific divergence or hybridization rather than a completely new species. Hierarchical clustering (Jaccard distance = 0.2) and PCA analysis further support this hypothesis, placing the unknown specimen within the Z. texana clade while highlighting subtle genetic separation. The phytochemical profile, dominated by β-caryophyllene (11.21%) and quercetin (42.1 µg/mL), aligns with known bioactive compounds in Z. texana but exhibits enhanced antioxidant and antimicrobial activities, potentially indicative of hybrid vigor or stress-induced mutations. Such genetic variations may confer adaptive advantages in dynamic wetland ecosystems, as seen in other aquatic grasses such as Phragmites australis. However, the limitations of dominant markers (RAPD/ISSR) in resolving homoplasy necessitate further validation through plastid genome sequencing (rbcL, matK) to elucidate evolutionary mechanisms. The Zizania extract demonstrated dose-dependent cytotoxicity in three cancer cell lines: MCF-7, HepG2, and A549. MCF-7 cells showed the highest sensitivity, with over 90% inhibition at 200 µg/mL and the lowest IC50 value of 28.3 µg/mL. HepG2 and A549 exhibited higher IC50 values of 31.4 µg/mL and 36.9 µg/mL, respectively. These results indicate that the extract is most effective against breast cancer cells, suggesting its potential as a therapeutic agent in cancer treatment.

Funding

This research is funded by the Deanship of Research and Innovation at University of Hafr Al Batin through the project number 0119-1446-S.

Institutional Review Board Statement

Not applicable.

Informed Consent Statement

Not applicable.

Data Availability Statement

All data generated or analyzed in this study are included in the article.

Acknowledgments

The author wishes to express her gratitude to the Deanship of Research and Innovation at University of Hafr Al Batin in Saudi Arabia for their unending support of this research.

Conflicts of Interest

The author declares no conflicts of interest.

Abbreviations

The following abbreviations are used in this manuscript:
Z. texanaZizania texana
Z. latifoliaZizania latifolia
Z. palustrisZizania palustris
Z. aquaticaZizania aquatica
C. albicansCandida albicans
S. aureusStaphylococcus aureus
E. coliEscherichia coli
DMEMDulbecco’s Modified Eagle Medium
FBSFetal Bovine Serum
UPGMAMUnweighted Pair Group Method with Arithmetic Mean
PCAPrincipal Component Analysis

References

  1. Ahmed, N.; Thompson, S.; Hardy, B.; Turchini, G.M. An ecosystem approach to wild rice-fish cultivation. Rev. Fish. Sci. Aquac. 2021, 29, 549–565. [Google Scholar] [CrossRef]
  2. Quayyum, H.A. Interference of Aquatic Plants Associated with Wild Rice (Zizania palustril L.). Ph.D. Thesis, Lakehead University, Thunder Bay, ON, Canada, 1995. [Google Scholar]
  3. Shaltout, K. Status of the Egyptian biodiversity: A bibliography (2000–2018). In Contribution to the Sixth National Report on Biological Diversity in Egypt; UNDP: New York, NY, USA, 2018. [Google Scholar]
  4. Salgotra, R.K.; Chauhan, B.S. Genetic diversity, conservation, and utilization of plant genetic resources. Genes 2023, 14, 174. [Google Scholar] [CrossRef]
  5. Babu, K.N.; Sheeja, T.E.; Minoo, D.; Rajesh, M.K.; Samsudeen, K.; Suraby, E.J.; Kumar, I.P.V. Random amplified polymorphic DNA (RAPD) and derived techniques. In Molecular Plant Taxonomy: Methods and Protocols; Springer: Berlin/Heidelberg, Germany, 2021; pp. 219–247. [Google Scholar]
  6. Omar, H.S.; Elsayed, T.R.; Reyad, N.E.H.A.; Shamkh, I.M.; Sedeek, M.S. Gene-targeted molecular phylogeny, phytochemical analysis, antibacterial and antifungal activities of some medicinal plant species cultivated in Egypt. Phytochem. Anal. 2021, 32, 724–739. [Google Scholar] [CrossRef]
  7. Dar, R.A.; Shahnawaz, M.; Ahanger, M.A.; Majid, I.U. Exploring the diverse bioactive compounds from medicinal plants: A review. J. Phytopharm 2023, 12, 189–195. [Google Scholar] [CrossRef]
  8. Ezzougari, R.; Saouab, F.E.; Laasli, S.E.; Benamar, K.; Khadiri, M.; Farhaoui, A.; Echchgadda, G.; Lahlali, R. Breeding Strategies for Stress-Tolerant and Climate-Smart Medicinal Plants. In Biotechnology, Multiple Omics, and Precision Breeding in Medicinal Plants; CRC Press: Boca Raton, FL, USA, 2025; pp. 1–19. [Google Scholar]
  9. Botet, R.; Keurentjes, J.J. The role of transcriptional regulation in hybrid vigor. Front. Plant Sci. 2020, 11, 410. [Google Scholar] [CrossRef] [PubMed]
  10. Xie, Y.N.; Qi, Q.Q.; Li, W.H.; Li, Y.L.; Zhang, Y.; Wang, H.M.; Zhang, Y.F.; Ye, Z.H.; Guo, D.P.; Qian, Q.; et al. Domestication, breeding, omics research, and important genes of Zizania latifolia and Zizania palustris. Front. Plant Sci. 2023, 14, 1183739. [Google Scholar] [CrossRef] [PubMed]
  11. Negri, S.; Commisso, M.; Bisson, L.; Zorzi, G.; Pietrolucci, F.; Dusi, V.; Ramos, C.; Pinzauti, F.; Nigris, S.; Baldan, B.; et al. Phylogenetic-guided bioprospection of the Italian flora: From the exploitation of bioactive phytochemicals to the study of chemo-evolutionary dynamics. In Book of Abstracts; The University of Verona: Verona, Italy, 2024; p. 109. [Google Scholar]
  12. Čertner, M.; Lučanová, M.; Sliwinska, E.; Kolář, F.; Loureiro, J. Plant material selection, collection, preservation, and storage for nuclear DNA content estimation. Cytom. Part A 2022, 101, 737–748. [Google Scholar] [CrossRef]
  13. Aboul-Maaty, N.A.F.; Oraby, H.A.S. Extraction of high-quality genomic DNA from different plant orders applying a modified CTAB-based method. Bull. Natl. Res. Cent. 2019, 43, 25. [Google Scholar] [CrossRef]
  14. Somasundaram, S.M.; Subbaraya, U.; Durairajan, S.G.; Rajendran, S.; Gopalakrishnan, J.; Hameed, B.S.; Palani, D.; Suthanthiram, B. Comparison of two different electrophoretic methods in studying the genetic diversity among plantains (Musa spp.) using ISSR markers. Electrophoresis 2019, 40, 1265–1272. [Google Scholar] [CrossRef]
  15. Harborne, J.B. Phytochemical Methods: A Guide to Modern Techniques of Plant Analysis; Chapman and Hall; Springer: Berlin/Heidelberg, Germany, 1998. [Google Scholar]
  16. Sofowora, A. Medicinal Plants and Traditional Medicine in Africa; Spectrum Books Ltd.: Ibadan, Nigeria, 2006. [Google Scholar]
  17. Pandey, A.; Tripathi, S. Concept of standardization, extraction and pre phytochemical screening strategies for herbal drug. J. Pharmacogn. Phytochem. 2014, 2, 115–119. [Google Scholar]
  18. Uraku, A.J. Leaves by gas chromatography-mass spectrometry (GC-MS) method. Res. J. Phytochem. 2015, 9, 175–187. [Google Scholar]
  19. Zhang, X.; Zhou, X.; Liu, X.; Li, X.; Whang, W. Development and application of an HPLC–UV procedure to determine multiple flavonoids and phenolics in Acanthopanax leaf extracts. J. Chromatogr. Sci. 2016, 54, 574–582. [Google Scholar] [CrossRef] [PubMed]
  20. Gawron-Gzella, A.; Dudek-Makuch, M.; Matlawska, I. DPPH radical scavenging activity and phenolic compound content in different leaf extracts from selected blackberry species. Acta Biol. Cracoviensia Ser. Bot. 2012, 54, 32–38. [Google Scholar] [CrossRef]
  21. Othman, M.; San Loh, H.; Wiart, C.; Khoo, T.J.; Lim, K.H.; Ting, K.N. Optimal methods for evaluating antimicrobial activities from plant extracts. J. Microbiol. Methods 2011, 84, 161–166. [Google Scholar] [CrossRef] [PubMed]
  22. Plumb, J.A. Cell sensitivity assays: The MTT assay. In Cancer Cell Culture: Methods and Protocols; Springer: Berlin/Heidelberg, Germany, 2004; pp. 165–169. [Google Scholar]
  23. Carmichael, J.; Mitchell, J.B.; DeGraff, W.G.; Gamson, J.; Gazdar, A.F.; Johnson, B.E.; Glatstein, E.; Minna, J.D. Chemosensitivity testing of human lung cancer cell lines using the MTT assay. Br. J. Cancer 1988, 57, 540–547. [Google Scholar] [CrossRef]
  24. Sokal, R.R.; Michener, C.D. A statistical method for evaluating systematic relationships. Univ. Kans. Sci. Bull. 1958, 38, 1409–1438. [Google Scholar]
  25. Jolliffe, I.T. Principal Component Analysis, 2nd ed.; Springer: Berlin/Heidelberg, Germany, 2002. [Google Scholar]
  26. Chierichetti, F.; Kumar, R.; Pandey, S.; Vassilvitskii, S. Finding the jaccard median. In Proceedings of the Twenty-First Annual ACM-SIAM Symposium on Discrete Algorithms, Austin, TX, USA, 17–19 January 2010; pp. 293–311. [Google Scholar]
  27. Hartigan, J.A.; Wong, M.A. Algorithm AS 136: A k-means clustering algorithm. J. R. Stat. Society Ser. C (Appl. Stat.) 1979, 28, 100–108. [Google Scholar] [CrossRef]
  28. Excoffier, L.; Lischer, H.E. Arlequin suite ver 3.5: A new series of programs to perform population genetics analyses under Linux and Windows. Mol. Ecol. Resour. 2010, 10, 564–567. [Google Scholar] [CrossRef]
  29. Zar, J.H. Biostatistical Analysis, 5th ed.; Pearson: Berlin/Heidelberg, Germany, 2010. [Google Scholar]
  30. Ritz, C.; Baty, F.; Streibig, J.C.; Gerhard, D. Dose-response analysis using R. PLoS ONE 2015, 10, e0146021. [Google Scholar] [CrossRef]
  31. Zaitchik, B.F.; LeRoux, L.G.; Kellogg, E.A. Development of male flowers in Zizania aquatica (North American wild-rice; Gramineae). Int. J. Plant Sci. 2000, 161, 345–351. [Google Scholar] [CrossRef]
  32. Walters, C.; Richards, C.M.; Volk, G.M. Genebank conservation of germplasm collected from wild species. In North American Crop Wild Relatives, Volume 1: Conservation Strategies; Springer: Berlin/Heidelberg, Germany, 2018; pp. 245–280. [Google Scholar]
  33. Lu, R.; Chen, M.; Feng, Y.; Yuan, N.; Zhang, Y.; Cao, M.; Liu, J.; Wang, Y.; Hang, Y.; Sun, X. Comparative plastome analyses and genomic resource development in wild rice (Zizania spp., Poaceae) using genome skimming data. Ind. Crops Prod. 2022, 186, 115244. [Google Scholar] [CrossRef]
  34. Ye, Z.; Liu, J.; Jin, Y.; Cui, H.; An, X.; Fu, X.; Yu, X. Physiological and proteomic changes in Zizania latifolia under chilling stress. Biologia 2017, 72, 1291–1299. [Google Scholar] [CrossRef]
  35. Kahler, A.L. Genome Organization and Genetic Diversity of Wildrice (Zizania palustris L.); University of Minnesota: Minneapolis, MN, USA, 2010. [Google Scholar]
  36. Yan, N.; Yang, T.; Yu, X.T.; Shang, L.G.; Guo, D.P.; Zhang, Y.; Meng, L.; Qi, Q.Q.; Li, Y.L.; Du, Y.M.; et al. Chromosome-level genome assembly of Zizania latifolia provides insights into its seed shattering and phytocassane biosynthesis. Commun. Biol. 2022, 5, 36. [Google Scholar] [CrossRef] [PubMed]
  37. Kumar, H.; Priya, P.; Singh, N.; Kumar, M.; Choudhary, B.K.; Kumar, L.; Singh, I.S.; Kumar, N. RAPD and ISSR marker-based comparative evaluation of genetic diversity among Indian germplasms of Euryale ferox: An aquatic food plant. Appl. Biochem. Biotechnol. 2016, 180, 1345–1360. [Google Scholar] [CrossRef] [PubMed]
  38. Ngangkham, U.; Dash, S.; Parida, M.; Samantaray, S.; Nongthombam, D.; Yadav, M.K.; Kumar, A.; Chidambaranathan, P.; Katara, J.L.; Patra, B.C.; et al. The potentiality of rice microsatellite markers in assessment of cross-species transferability and genetic diversity of rice and its wild relatives. 3 Biotech 2019, 9, 217. [Google Scholar] [CrossRef] [PubMed]
  39. Xu, X.; Walters, C.; Antolin, M.F.; Alexander, M.L.; Lutz, S.; Ge, S.; Wen, J. Phylogeny and biogeography of the eastern Asian–North American disjunct wild-rice genus (Zizania L., Poaceae). Mol. Phylogenetics Evol. 2010, 55, 1008–1017. [Google Scholar] [CrossRef]
  40. Zhang, D.; Li, K.; Gao, J.; Liu, Y.; Gao, L.Z. The complete plastid genome sequence of the wild rice Zizania latifolia and comparative chloroplast genomics of the rice tribe Oryzeae, Poaceae. Front. Ecol. Evol. 2016, 4, 88. [Google Scholar] [CrossRef]
  41. Luo, X.; Gu, C.; Gao, S.; Li, M.; Zhang, H.; Zhu, S. Complete mitochondrial genome assembly of Zizania latifolia and comparative genome analysis. Front. Plant Sci. 2024, 15, 1381089. [Google Scholar] [CrossRef]
  42. Lacoul, P.; Freedman, B. Environmental influences on aquatic plants in freshwater ecosystems. Environ. Rev. 2006, 14, 89–136. [Google Scholar] [CrossRef]
  43. Castellani, M.B.; Dalla Vecchia, A.; Bolpagni, R.; Natale, R.; Piaser, E.; Lastrucci, L.; Coppi, A.; Villa, P. Genetic drift versus natural selection affecting the evolution of spectral and functional traits of two key macrophytes: Phragmites australis and Nuphar lutea. Freshw. Biol. 2023, 68, 1739–1750. [Google Scholar] [CrossRef]
  44. Jamdade, R.; Upadhyay, M.; Al Shaer, K.; Al Harthi, E.; Al Sallani, M.; Al Jasmi, M.; Al Ketbi, A. Evaluation of Arabian vascular plant barcodes (rbcL and matK): Precision of unsupervised and supervised learning methods towards accurate identification. Plants 2021, 10, 2741. [Google Scholar] [CrossRef]
  45. Hu, J.; Qi, Q.; Zhu, Y.; Wen, C.; Olatunji, O.J.; Jayeoye, T.J.; Eze, F.N. Unveiling the anticancer, antimicrobial, antioxidative properties, and UPLC-ESI-QTOF-MS/GC–MS metabolite profile of the lipophilic extract of siam weed (Chromolaena odorata). Arab. J. Chem. 2023, 16, 104834. [Google Scholar] [CrossRef]
  46. Zhang, J.; Zhong, H.; Li, F.; Yu, K.; Chen, J. A Potential Natural Enemy of Rust Fungus Uromyces coronatus of an Aquatic Vegetable Water-Oat Zizania latifolia. Entomol. News 2025, 132, 174–183. [Google Scholar] [CrossRef]
  47. Lombrea, A.; Antal, D.; Ardelean, F.; Avram, S.; Pavel, I.Z.; Vlaia, L.; Mut, A.M.; Diaconeasa, Z.; Dehelean, C.A.; Soica, C.; et al. A recent insight regarding the phytochemistry and bioactivity of Origanum vulgare L. essential oil. Int. J. Mol. Sci. 2020, 21, 9653. [Google Scholar] [CrossRef] [PubMed]
  48. He, D.; Simoneit, B.R.; Jara, B.; Jaffé, R. Gas chromatography mass spectrometry based profiling of alkyl coumarates and ferulates in two species of cattail (Typha domingensis P., and Typha latifolia L.). Phytochem. Lett. 2015, 13, 91–98. [Google Scholar] [CrossRef]
  49. Fonseca Do Carmo, P.H.; Pinheiro Lage, A.C.; Garcia, M.T.; Soares da Silva, N.; Santos, D.A.; Mylonakis, E.; Junqueira, J.C. Resveratrol-coated gold nanorods produced by green synthesis with activity against Candida albicans. Virulence 2024, 15, 2416550. [Google Scholar] [CrossRef] [PubMed]
  50. Álvarez-Martínez, F.J.; Barrajón-Catalán, E.; Encinar, J.A.; Rodríguez-Díaz, J.C.; Micol, V. Antimicrobial capacity of plant polyphenols against gram-positive bacteria: A comprehensive review. Curr. Med. Chem. 2020, 27, 2576–2606. [Google Scholar] [CrossRef]
  51. Lawal, R.; James, A.B.; Shaibu, R.; Okoye, O.; Odetunde, S.; Ajibare, A. Cytotoxic effects of Curcuma longa leaves on MCF-7 and HepG2 cells. Fountain J. Nat. Appl. Sci. 2022, 11, 31–35. [Google Scholar] [CrossRef]
  52. Chien, S.-Y.; Wu, Y.-C.; Chung, J.-G.; Yang, J.-S.; Lu, H.-F.; Tsou, M.-F.; Wood, W.; Kuo, S.-J.; Chen, D.-R. Quercetin-induced apoptosis acts through mitochondrial-and caspase-3-dependent pathways in human breast cancer MDA-MB-231 cells. Hum. Exp. Toxicol. 2009, 28, 493–503. [Google Scholar] [CrossRef]
  53. Zhong, C.; Li, H.-D.; Liu, D.-Y.; Xu, F.-B.; Wu, J.; Lin, X.-M.; Guo, R.-P. Clinical study of hepatectomy combined with Jianpi Huayu therapy for hepatocellular carcinoma. Asian Pac. J. Cancer Prev. 2014, 15, 5951–5957. [Google Scholar] [CrossRef]
  54. Yousaf, H. Evaluation And Comparison Of The Antioxidant And Free Radical Scavenging Properties Of Medicinal Plants By Using The Dpph Assay In-Vitro. bioRxiv 2023. [Google Scholar] [CrossRef]
  55. Sumczynski, D.; Kotásková, E.; Orsavová, J.; Valášek, P. Contribution of individual phenolics to antioxidant activity and in vitro digestibility of wild rices (Zizania aquatica L.). Food Chem. 2017, 218, 107–115. [Google Scholar] [CrossRef]
  56. Chu, M.J.; Du, Y.M.; Liu, X.M.; Yan, N.; Wang, F.Z.; Zhang, Z.F. Extraction of proanthocyanidins from Chinese wild rice (Zizania latifolia) and analyses of structural composition and potential bioactivities of different fractions. Molecules 2019, 24, 1681. [Google Scholar] [CrossRef] [PubMed]
  57. Shahidi, F.; Danielski, R.; Rhein, S.O.; Meisel, L.A.; Fuentes, J.; Speisky, H.; Schwember, A.R.; de Camargo, A.C. Wheat and rice beyond phenolic acids: Genetics, identification database, antioxidant properties, and potential health effects. Plants 2022, 11, 3283. [Google Scholar] [CrossRef] [PubMed]
  58. Chen, P.; Cao, Y.; Bao, B.; Zhang, L.; Ding, A. Antioxidant capacity of Typha angustifolia extracts and two active flavonoids. Pharm. Biol. 2017, 55, 1283–1288. [Google Scholar] [CrossRef] [PubMed]
  59. El-Sayed, S.M.; Hassan, K.M.; Abdelhamid, A.N.; Yousef, E.E.; Abdellatif, Y.M.; Abu-Hussien, S.H.; Nasser, M.A.; Elshalakany, W.A.; Darwish, D.B.; Abdulmajeed, A.M.; et al. Exogenous paclobutrazol reinforces the antioxidant and antimicrobial properties of lavender (Lavandula officinalis L.) oil through modulating its composition of oxygenated terpenes. Plants 2022, 11, 1607. [Google Scholar] [CrossRef]
  60. Gebashe, F.; Aremu, A.O.; Gruz, J.; Finnie, J.F.; Van Staden, J. Phytochemical profiles and antioxidant activity of grasses used in South African traditional medicine. Plants 2020, 9, 371. [Google Scholar] [CrossRef]
Figure 1. DNA fingerprinting, phytochemical profiling, DPPH assay, antimicrobial, antioxidant, and cytotoxic activities of Zizania spp. leaves analysis.
Life 15 01240 g001
Figure 2. ISSR/RAPD Profiling of Zizania Species.
Life 15 01240 g002
Figure 3. Color-coded multiple sequence alignment (MSA) of rbcL gene regions from Zizania spp. compared to a reference sequence. Red-highlighted bases indicate nucleotide mismatches, while white cells represent matches or gaps.
Life 15 01240 g003
Figure 4. Band presence/absence matrix for Zizania species (L2–L11), including unknown specimens (L10, L11). Unique bands (e.g., 1200 bp in Z. latifolia) and shared markers (e.g., 750 bp in Z. texana and unknowns) highlight interspecific divergence and intraspecific cohesion. Taxonomic classification of unknowns as Z. texana is supported by 85% band-sharing similarity.
Life 15 01240 g004
Figure 5. Hierarchical clustering of Zizania specimens based on Jaccard genetic distances. Z. texana (L8–L9) and unknowns (L10–L11) form a cohesive clade (distance = 0.2), while Z. latifolia (L2–L3) clusters distantly (distance = 0.4). Bootstrap values (577–10558) indicate moderate node support.
Life 15 01240 g005
Figure 6. Principal Component Analysis of Genetic Divergence in Zizania Species.
Life 15 01240 g006
Figure 7. (Figures (14)). (1): Habitat morphology and ecology of an emergent aquatic grass (Poaceae). (2): Mature stands in freshwater wetlands (water depth: 20–40 cm) with linear-lanceolate leaves (≤80 cm) emerging vertically. (3): Dimorphic panicles (≤45 cm) in reproductive phase: female spikelets (pubescent lemma/palea) above male counterparts (anther-bearing florets) in shallow lake margins. (4): Riparian ecotone colonization, demonstrating adaptation to fluctuating hydrology (0–50 cm depth).
Life 15 01240 g007
Figure 8. The gas chromatography (GC) analysis of Zizania leaf extract. Peaks reveals a complex phytochemical profile dominated by bioactive terpenes, fatty acids, and hydrocarbons.
Life 15 01240 g008
Figure 9. HPLC Profile of Zizania Extract.
Life 15 01240 g009
Figure 10. Antimicrobial activity of ethanolic Zizania leaf extracts (5–20 µg/mL) against E. coli (Panel 1), S. aureus (Panel 2), and C. albicans (Panel 3), with comparative dose–response analysis (Panel 4). Inhibition zones (mm) were measured via agar disc diffusion assays. Columns in Panel 4 represent mean inhibition zones ± SD (n = 3). Asterisks denote statistically significant differences between microbial responses (p < 0.05, one-way ANOVA with Tukey’s post hoc test). S. aureus exhibited the highest sensitivity (max inhibition: 14.0 mm at 20 µg/mL), followed by E. coli (12.5 mm) and C. albicans (10.0 mm). Extract batch identifier: Kinole. All experiments were conducted in triplicate under standardized conditions.
Life 15 01240 g010
Figure 11. Dose–response curve showing the antimicrobial activity of Zizania leaf extract, with inhibition zones increasing dose-dependently. C. albicans showed the highest sensitivity (IC50 = 4.9 ± 0.6 µg/mL), followed by E. coli and S. aureus.
Life 15 01240 g011
Figure 12. DPPH Dose-response Curve of Zizania Extract.
Life 15 01240 g012
Figure 13. Dose-response curves of Zizania extract against MCF-7, HepG2, and A549 cell lines. Data points represent mean ± SD (n = 3).
Life 15 01240 g013
Table 1. Primers RAPD and ISSR.
RAPD Primers (Operon Technologies, Alameda, CA, USA)ISSR Primers (ISSR Primers (Genetic Engineering Research Institute, Agricultural Research Center, Egypt))
OPA-03: 5′-AGTCAGCCAC-3′UBC-807: 5′-(AG)8T-3′
OPA-11: 5′-CAATCGCCGT-3′UBC-812: 5′-(GA)8A-3′
OPB-04: 5′-GGACTGGAGT-3′UBC-826: 5′-(AC)8C-3′
OPB-14: 5′-TCCGCTCTGG-3′UBC-841: 5′-(GA)8YC-3′
OPC-07: 5′-GTCCCGACGA-3′UBC-873: 5′-(GACA)4-3′
DNA fingerprinting was performed using a set of 10 primers: 5 RAPD and 5 ISSR primers selected for high polymorphism rates in aquatic plant genomes.
Table 2. Principal Component Analysis of Genetic Differentiation in Zizania Species and unknown samples.
SpeciesPC1 Mean ± SDPC2 Mean ± SDDiagnostic Bands (bp)Cluster Association
Z. texana1.82 ± 0.310.29 ± 0.422400, 4800Positive PC1
Z. palustris0.21 ± 0.351.48 ± 0.393600, 7200Neutral
Z. aquatica−0.52 ± 0.38−1.01 ± 0.416000, 8400Neutral
Z. latifolia−1.23 ± 0.420.81 ± 0.361200, 9600Negative PC2
Unknowns1.75 ± 0.330.42 ± 0.382400, 4800Positive PC1
1. Data presented as Mean ± Standard Deviation (SD) of principal component scores. 2. Diagnostic bands were identified through loadings analysis (|loading| > 0.7). 3. Cluster significance: PERMANOVA p < 0.001 for all pairwise comparisons. 4. Band size measured in base pairs (bp).
Table 3. Phytochemical Screening in Leaves.
Phytochemical ClassQualitative Presence
Flavonoids+++ (Strong)
Tannins++ (Moderate)
Terpenoids++ (Moderate)
Saponins+ (Slight)
Alkaloids++ (Moderate)
Glycosides+ (Slight)
+ = Presence of phytochemical class.
Table 4. Phytochemical Composition of Zizania Leaf Extract Identified via Gas Chromatography (GC-MS).
No.Retention Time (Min)Concentration %Compound NameMolecular FormulaBiological Activity
13.9713.65α-PineneC10H16Antimicrobial, anti-inflammatory
25.863.92CampheneC10H16Fragrance, mild antibacterial
36.6710.1β-PineneC10H16Antioxidant, anti-inflammatory
47.665.41MyrceneC10H16Analgesic, antioxidant
59.956.21LimoneneC10H16Anti-cancer, insecticidal
610.499.52LinaloolC10H18OAntibacterial, anxiolytic
712.454.43TerpineolC10H18OAntiseptic, antioxidant
814.516.88Palmitic acidC16H32O2Antioxidant, antibacterial
916.186.39PhytolC20H40OAnti-inflammatory, precursor to vitamins E/K
1017.4811.21β-CaryophylleneC15H24Cytotoxic, anti-inflammatory
1118.223.47Caryophyllene oxideC15H24OAntifungal, anti-cancer
1219.393.92NeophytadieneC20H38Antioxidant, antimicrobial
1320.814.11Stearic acidC18H36O2Emollient, lipid metabolism
1420.823.43SqualeneC30H50Antioxidant, chemopreventive
1522.944.41NonacosaneC29H60Cuticular wax, defense compound
1624.652.94DotriacontaneC32H66Hydrocarbon, structural leaf wax
Table 5. Quantification of Key Phenolic Compounds in of Zizania Leaf Extract by HPLC.
Peak No.Retention Time (min)Compound IdentifiedConcentration (µg/mL)
A7.181Gallic acid23.4 ± 1.2
B8.287Caffeic acid15.6 ± 0.9
C8.467Rutin37.8 ± 1.8
D8.867Quercetin42.1 ± 2.0
E16.411Kaempferol17.9 ± 1.1
Table 6. Mean IC50 Values (± SD) for Antimicrobial Activity Against Selected Microorganisms.
MicrobeMean IC50 ± SD
S. aureus10.7 ± 1.3
E. coli6.8 ± 0.9
C. albicans4.9 ± 0.6
Table 7. Inhibition Percentages at Tested Concentrations.
Concentration (µg/mL)Inhibition (% ± SD)
2541.2 ± 1.5
5066.8 ± 2.1
10087.6 ± 1.2
Table 8. Percentage inhibition of cancer cell viability at varying concentrations.
Concentration (µg/mL)MCF-7HepG2A549
6.2511.4 ± 0.810.2 ± 1.18.6 ± 0.9
12.525.7 ± 1.321.9 ± 1.220.2 ± 1.0
2549.6 ± 1.645.3 ± 1.541.0 ± 1.3
5070.3 ± 2.066.1 ± 1.860.4 ± 1.6
10087.9 ± 2.284.5 ± 2.080.2 ± 1.9
20094.6 ± 2.491.3 ± 2.288.7 ± 2.1
Table 9. IC50 Values ± SD of cancer cells.
Cancer Cells TypeIC50 Values ± SD
MCF-7 28.3 ± 1.5 µg/mL
HepG231.4 ± 1.8 µg/mL
A54936.9 ± 2.0 µg/mL
Disclaimer/Publisher’s Note: The statements, opinions and data contained in all publications are solely those of the individual author(s) and contributor(s) and not of MDPI and/or the editor(s). MDPI and/or the editor(s) disclaim responsibility for any injury to people or property resulting from any ideas, methods, instructions or products referred to in the content.

