Super-Resolution Contrast-Enhanced Ultrasound Examination Down to the Microvasculature Enables Quantitative Analysis of Liver Lesions: First Results

 ,
, 
Abstract
1. Introduction
2. Materials and Methods
2.1. Ethical Statement
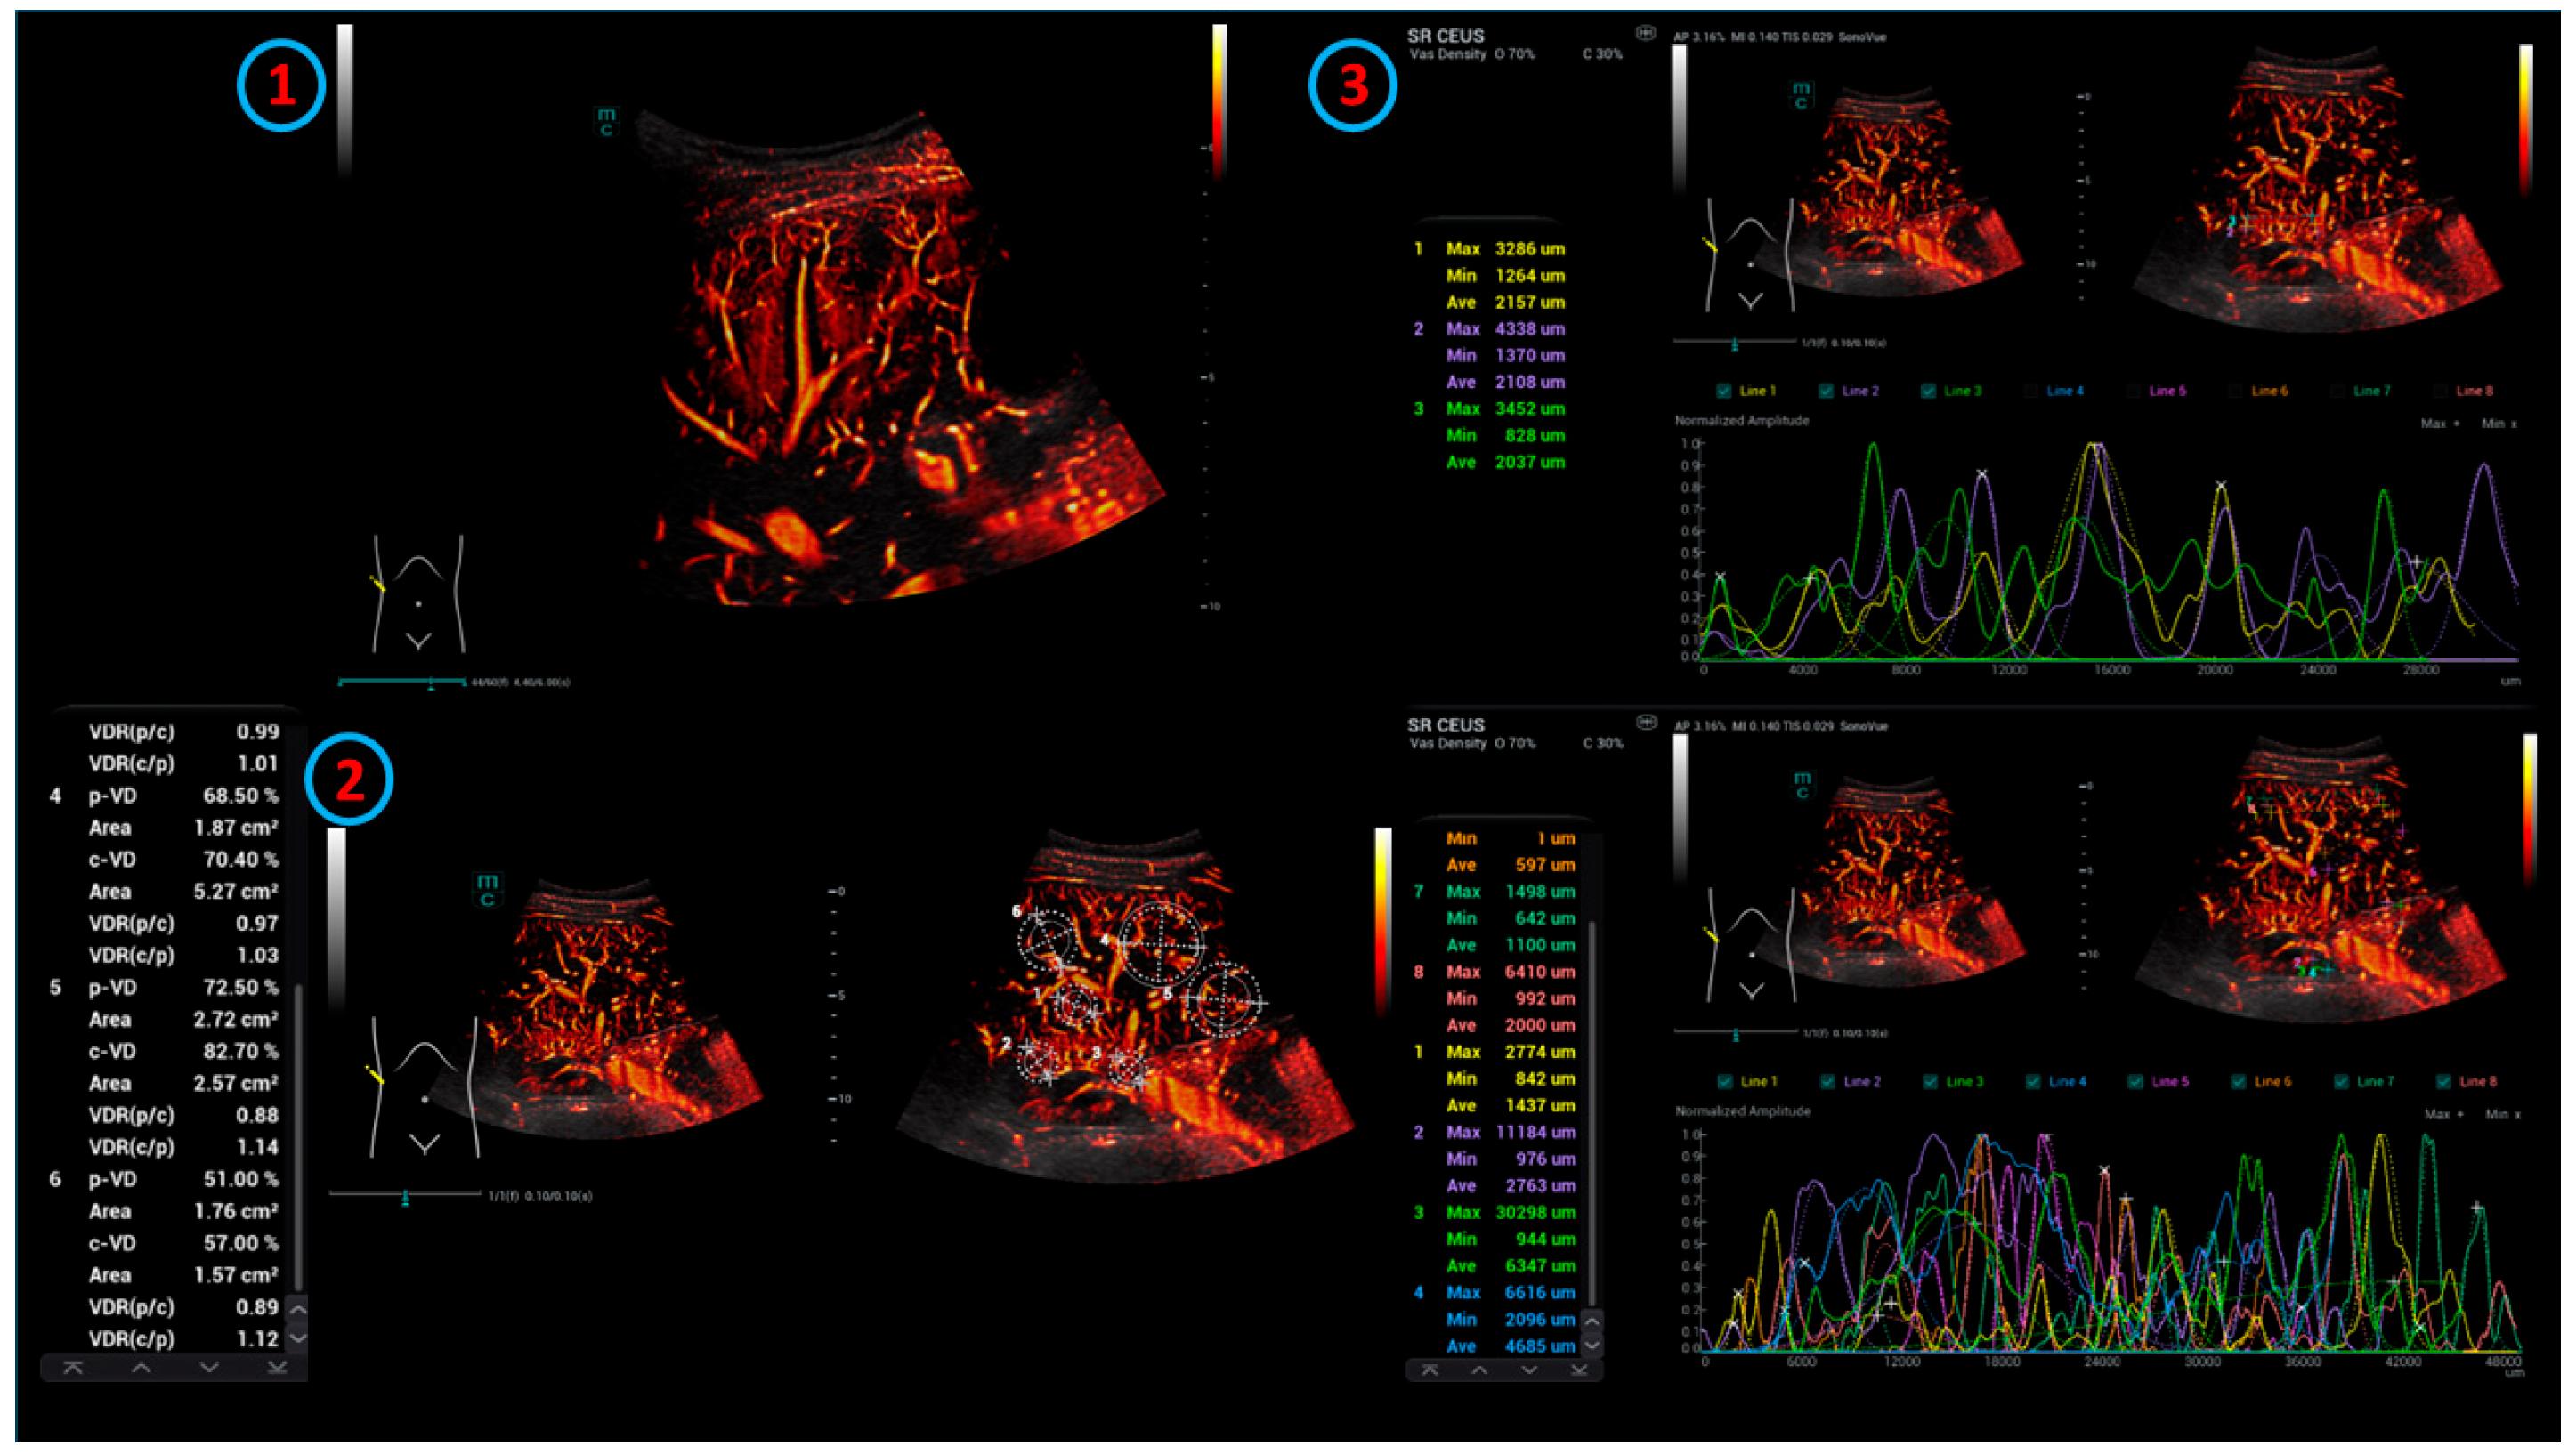
2.2. Technical Aspects
2.3. Ultrasound Performance
2.4. Ultrasound Contrast Agent Performance
2.5. Readings
2.6. Statistical Analysis
3. Results
4. Discussion
5. Limitations
Author Contributions
Funding
Institutional Review Board Statement
Informed Consent Statement
Data Availability Statement
Acknowledgments
Conflicts of Interest
Abbreviations
| SR CEUS | Super-resolution contrast-enhanced ultrasound |
| CEUS | Contrast-enhanced ultrasound |
| FNH | Focal nodular hyperplasia |
| HCC | Hepatocellular carcinoma |
| RI | Resistance index |
| DEGUM | German Society for Ultrasound in Medicine |
| TACE | Transarterial embolization |
| TIC | Time intensity curve |
| HiFR | High frame rate |
| CCDS | Color Doppler sonography |
| UMA | Ultra-micro-angiography |
| ROI | Regions of interests |
| PACS | Picture archiving and communication system |
| MRI | Magnetic resonance imaging |
| AUC | Area under the curve |
| CT | Computed tomography |
| CCC | Cholangiocarcinoma |
Appendix A

| Variable | OR | 95% CI | p-Value |
|---|---|---|---|
| Age | 0.98 | (0.95, 1.01) | 0.123 |
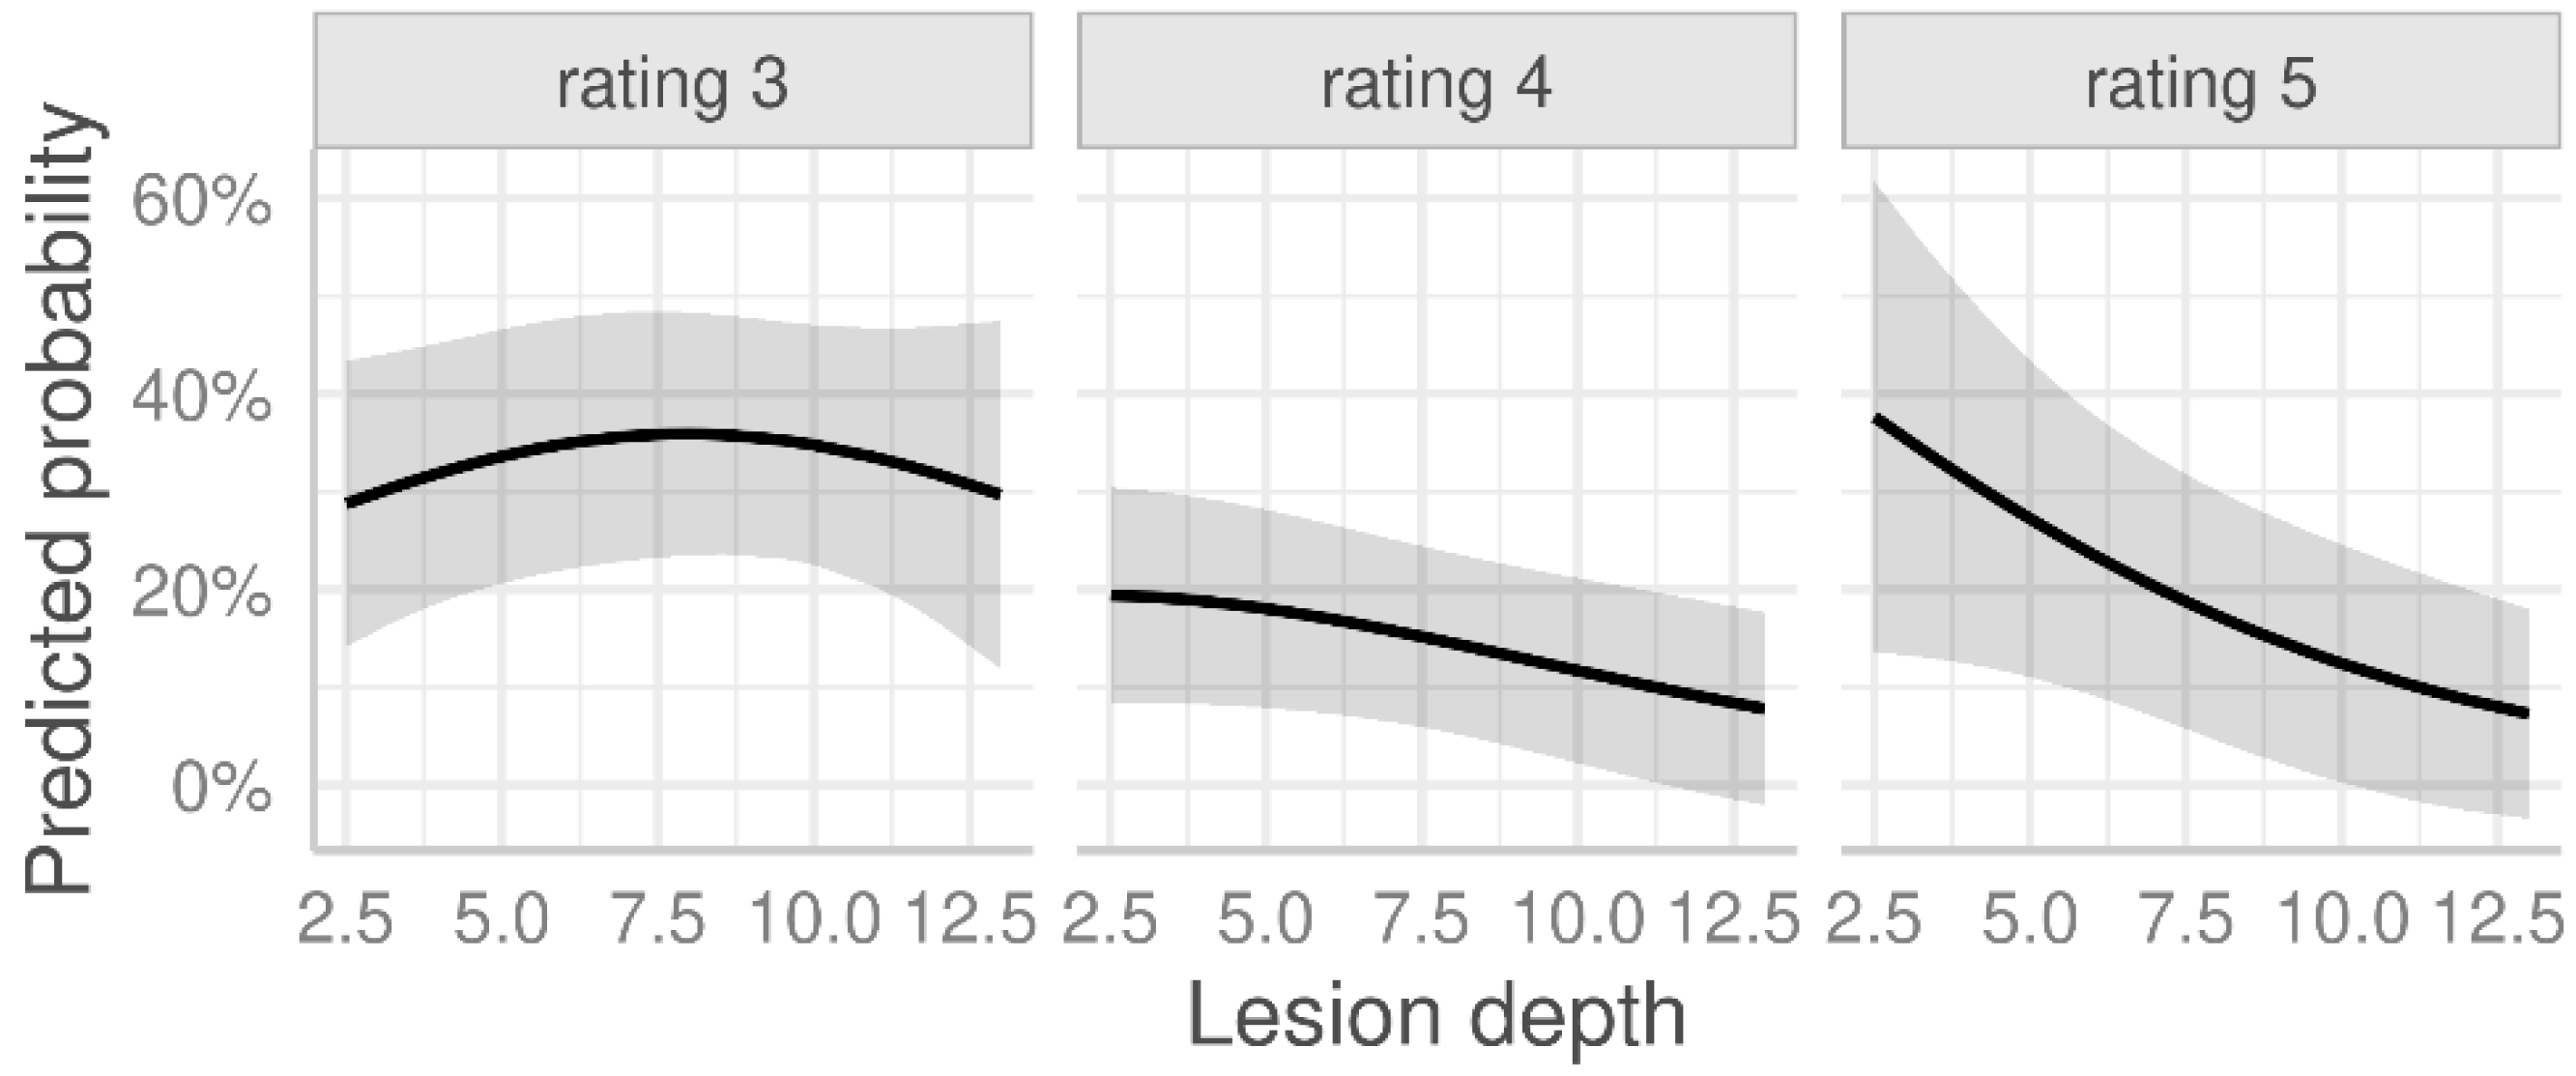
| Lesion depth (cm) | 0.82 | (0.67, 1.00) | 0.047 |
| Fibrosis | |||
| F0 + F1 | 1.00 | Ref. | |
| F2 | 1.73 | (0.46, 6.70) | 0.420 |
| F3 + F4 | 2.54 | (0.52, 13.1) | 0.251 |
| Steatosis | |||
| No steatosis | 1.00 | Ref. | |
| Steatosis | 0.55 | (0.20, 1.50) | 0.245 |
| Group | Pairwise Comparison | Unadjusted p-Value | Adjusted p-Value |
|---|---|---|---|
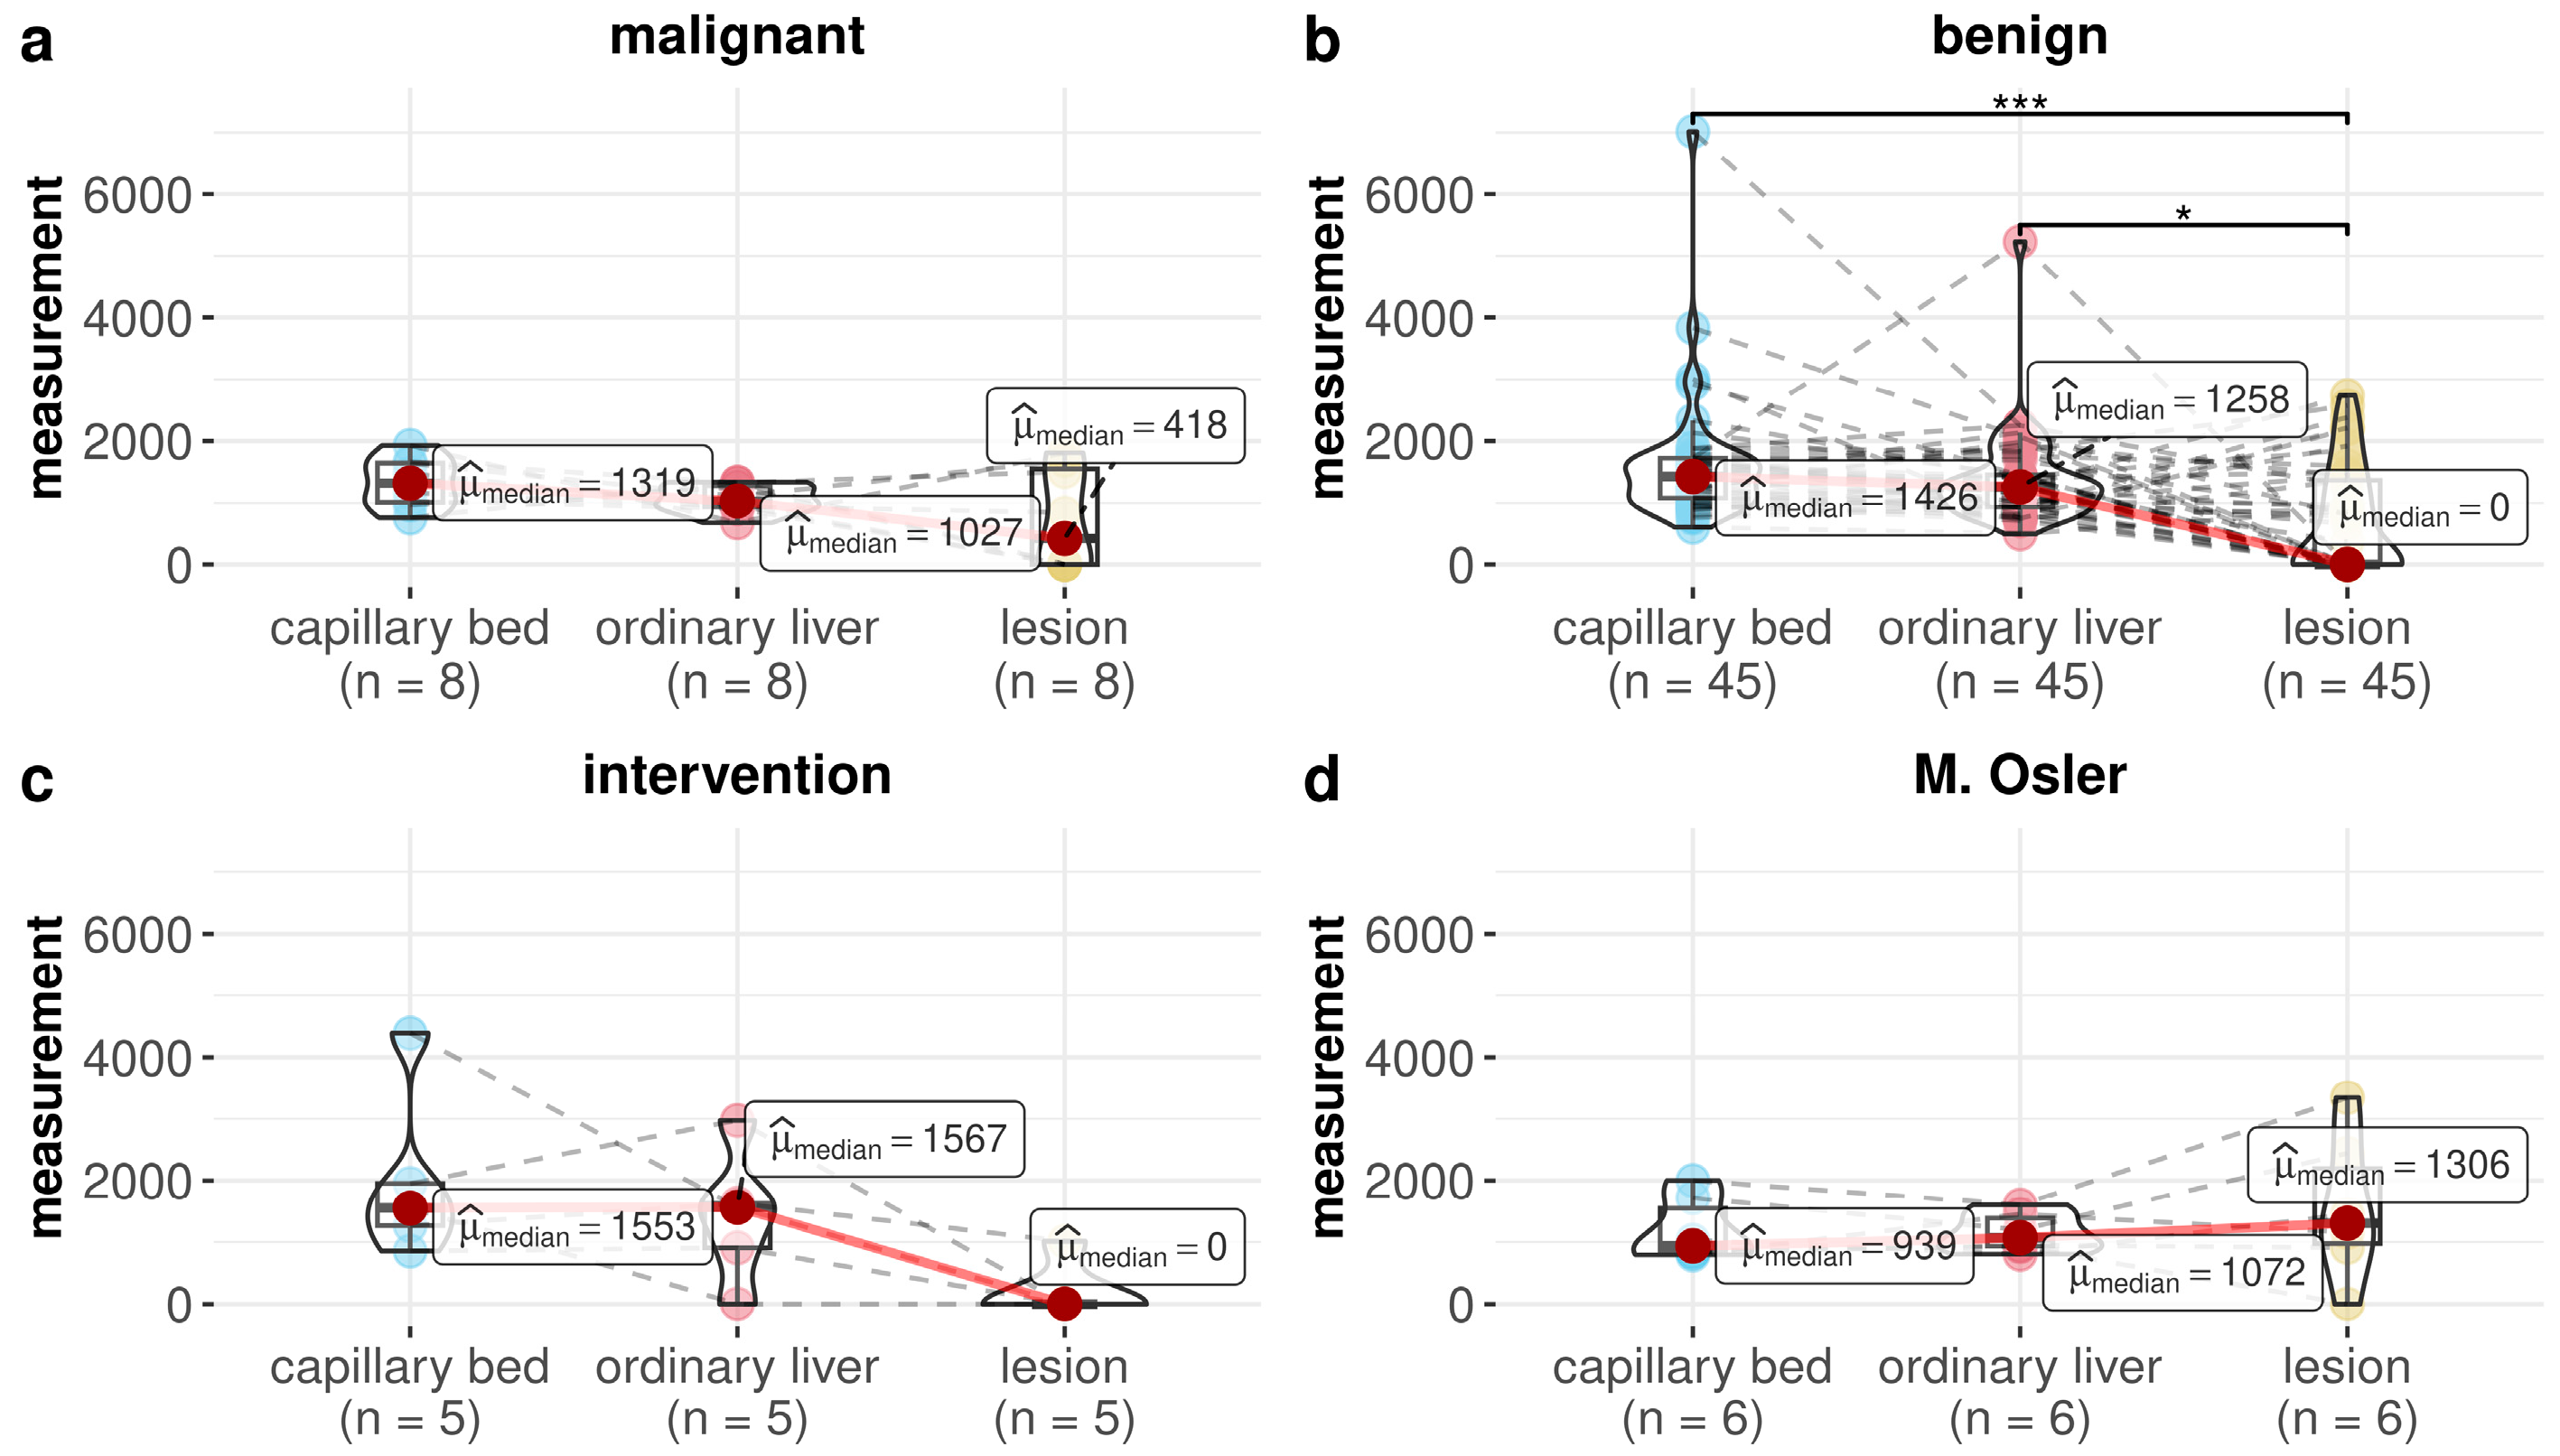
| Malignant | Ordinary liver vs. lesion | 0.727 | 1.000 |
| Malignant | Capillary bed vs. lesion | 0.070 | 0.630 |
| Malignant | Capillary bed vs. ordinary liver | 0.289 | 1.000 |
| Benign | Ordinary liver vs. lesion | 0.002 | 0.022 |
| Benign | Capillary bed vs. lesion | <0.001 | <0.001 |
| Benign | Capillary bed vs. ordinary liver | 0.072 | 0.630 |
| Intervention | Ordinary liver vs. lesion | 0.125 | 0.875 |
| Intervention | Capillary bed vs. lesion | 0.063 | 0.630 |
| Intervention | Capillary bed vs. ordinary liver | 1.000 | 1.000 |
| M. Osler | Ordinary liver vs. lesion | 1.000 | 1.000 |
| M. Osler | Capillary bed vs. lesion | 0.219 | 1.000 |
| M. Osler | Capillary bed vs. ordinary liver | 1.000 | 1.000 |
| Capillary Bed | Ordinary Liver | |||||||
|---|---|---|---|---|---|---|---|---|
| Variable | N | β | 95% CI | Adjusted p-Value | N | β | 95% CI | Adjusted p-Value |
| Group | 0.870 | 0.870 | ||||||
| Malignant | 8 | 0 | Ref. | 8 | 0 | Ref. | ||
| Benign | 46 | 501 | (−248, 1250) | 0.372 | 45 | 293 | (−271, 858) | 0.372 |
| Intervention | 5 | 798 | (−279, 1876) | 0.288 | 5 | 347 | (−466, 1160) | 0.397 |
| M. Osler | 6 | 294 | (−789, 1377) | 1.000 | 6 | 64 | (−755, 883) | 1.000 |
| Age | 65 | 16 | (1, 31) | 0.064 | 65 | −1 | (−13, 10) | 0.825 |
| Variable | N | No. of Events | OR | 95% CI | p-Value |
|---|---|---|---|---|---|
| Group | 0.323 | ||||
| Benign | 46 | 23 | 1.00 | Ref. | |
| Malignant | 8 | 4 | 0.66 | (0.13, 3.33) | 0.608 |
| Intervention | 5 | 4 | 3.34 | (0.44, 68.7) | 0.301 |
| M. Osler | 6 | 1 | 0.26 | (0.01, 1.94) | 0.250 |
| Age | 65 | 32 | 1.03 | (1.00, 1.07) | 0.080 |
| Variable | N | Exp(β) | 95% CI | p-Value |
|---|---|---|---|---|
| Group | 0.691 | |||
| Malignant | 4 | 1.00 | Ref. | |
| Benign | 23 | 0.94 | (0.51, 1.70) | 0.820 |
| Intervention | 1 | 0.73 | (0.23, 2.35) | 0.591 |
| M. Osler | 5 | 1.23 | (0.57, 2.67) | 0.587 |
| Age | 33 | 1.00 | (0.99, 1.01) | 0.824 |
| FNH (n = 6) | Hemangioma (n = 13) | Cyst (n = 11) | |
|---|---|---|---|
| Measurement for capillary bed | |||
| Median [Min, Max] | 1136 [599, 1881] | 1424 [1078, 3831] | 1530 [960, 2133] |
| Measurement for ordinary liver | |||
| Median [Min, Max] | 919 [493, 1841] | 1223 [723, 2135] | 1282 [704, 2251] |
| Missing | 1 (16.7%) | 0 (0%) | 0 (0%) |
| Measurement for lesion | |||
| Median [Min, Max] | 2235 [1042, 4716] | 1308 [0, 7622] | 0 [0, 1200] |
| Capillary Bed | Ordinary Liver | |||||||
|---|---|---|---|---|---|---|---|---|
| Variable | N | β | 95% CI | Adjusted p-Value | N | β | 95% CI | Adjusted p-Value |
| Group | 0.890 | 0.993 | ||||||
| FNH | 6 | 0 | Ref. | 6 | 0 | Ref. | ||
| Hemangioma | 13 | 165 | (−534, 864) | 1.000 | 13 | −22 | (−603, 559) | 1.000 |
| Cyst | 11 | −147 | (−903, 609) | 1.000 | 11 | −35 | (−659, 588) | 1.000 |
| Age | 30 | 17 | (1, 33) | 0.072 | 29 | 11 | (−1, 24) | 0.081 |
| Variable | N | No. of Events | OR | 95% CI | p-Value |
|---|---|---|---|---|---|
| Group | 0.012 | ||||
| FNH | 6 | 0 | 1.00 | Ref. | |
| Hemangioma | 13 | 4 | 2.26 | (0.07, 383) | 0.646 |
| Cyst | 11 | 10 | 30.6 | (1.35, 5.594) | 0.030 |
| Age | 30 | 14 | 1.04 | (0.98, 1.14) | 0.188 |
| Variable | N | Exp(β) | 95% CI | p-Value |
|---|---|---|---|---|
| Group | 0.004 | |||
| FNH | 6 | 1.00 | Ref. | |
| Hemangioma | 9 | 0.43 | (0.26, 0.73) | 0.004 |
| Age | 15 | 1.03 | (1.01, 1.05) | 0.824 |
References
- Bi, D.; Shi, L.; Li, B.; Li, Y.; Liu, C.; Le, L.H.; Luo, J.; Wang, S.; Ta, D. The Protocol of Ultrasonic Backscatter Measurements of Musculoskeletal Properties. Phenomics 2024, 4, 72–80. [Google Scholar] [CrossRef] [PubMed]
- Jung, E.M.; Dong, Y.; Jung, F. Current aspects of multimodal ultrasound liver diagnostics using contrast-enhanced ultrasonography (CEUS), fat evaluation, fibrosis assessment, and perfusion analysis—An update. Clin. Hemorheol. Microcirc. 2023, 83, 181–193. [Google Scholar] [CrossRef] [PubMed]
- Jung, E.M.; Kaiser, U.; Herr, W.; Stroszczynski, C.; Jung, F. Novel high-resolution contrast agent ultrasound techniques HiFR CEUS and SR CEUS in combination with shear wave elastography, fat assessment and viscosity of liver parenchymal changes and tumors. Clin. Hemorheol. Microcirc. 2024, 86, 263–273. [Google Scholar] [CrossRef]
- Pausch, A.M.; Kammerer, S.; Weber, F.; Herr, W.; Stroszczynski, C.; Holler, E.; Edinger, M.; Wolff, D.; Weber, D.; Jung, E.M.; et al. Parametric Imaging of Contrast-Enhanced Ultrasound (CEUS) for the Evaluation of Acute Gastrointestinal Graft-Versus-Host Disease. Cells 2021, 10, 1092. [Google Scholar] [CrossRef]
- Hu, S.; Zhang, X.; Unger, M.; Patties, I.; Melzer, A.; Landgraf, L. Focused Ultrasound-Induced Cavitation Sensitizes Cancer Cells to Radiation Therapy and Hyperthermia. Cells 2020, 9, 2595. [Google Scholar] [CrossRef]
- Landgraf, L.; Kozlowski, A.; Zhang, X.; Fournelle, M.; Becker, F.J.; Tretbar, S.; Melzer, A. Focused Ultrasound Treatment of a Spheroid In Vitro Tumour Model. Cells 2022, 11, 1518. [Google Scholar] [CrossRef] [PubMed]
- Dietrich, C.F.; Nolsøe, C.P.; Barr, R.G.; Berzigotti, A.; Burns, P.N.; Cantisani, V.; Chammas, M.C.; Chaubal, N.; Choi, B.I.; Clevert, D.A.; et al. Guidelines and Good Clinical Practice Recommendations for Contrast-Enhanced Ultrasound (CEUS) in the Liver-Update 2020 WFUMB in Cooperation with EFSUMB, AFSUMB, AIUM, and FLAUS. Ultraschall Med.-Eur. J. Ultrasound 2020, 46, 2579–2604. [Google Scholar] [CrossRef]
- Huang, J.Y.; Li, J.W.; Lu, Q.; Luo, Y.; Lin, L.; Shi, Y.J.; Li, T.; Liu, J.B.; Lyshchik, A. Diagnostic Accuracy of CEUS LI-RADS for the Characterization of Liver Nodules 20 mm or Smaller in Patients at Risk for Hepatocellular Carcinoma. Radiology 2020, 294, 329–339. [Google Scholar] [CrossRef] [PubMed]
- Schellhaas, B.; Bernatik, T.; Bohle, W.; Borowitzka, F.; Chang, J.; Dietrich, C.F.; Dirks, K.; Donoval, R.; Drube, K.; Friedrich-Rust, M.; et al. Contrast-Enhanced Ultrasound Algorithms (CEUS-LIRADS/ESCULAP) for the Noninvasive Diagnosis of Hepatocellular Carcinoma—A Prospective Multicenter DEGUM Study. Ultraschall Med. 2021, 42, 178–186. [Google Scholar]
- Strobel, D.; Jung, E.M.; Ziesch, M.; Praktiknjo, M.; Link, A.; Dietrich, C.F.; Klinger, C.; Schultheiß, M.; Jesper, D.; Schellhaas, B. Real-life assessment of standardized contrast-enhanced ultrasound (CEUS) and CEUS algorithms (CEUS LI-RADS®/ESCULAP) in hepatic nodules in cirrhotic patients—A prospective multicenter study. Eur. Radiol. 2021, 31, 7614–7625. [Google Scholar] [CrossRef]
- Meitner-Schellhaas, B.; Jesper, D.; Goertz, R.S.; Zundler, S.; Strobel, D. Washout appearance of hepatocellular carcinomas using standardized contrast-enhanced ultrasound (CEUS) including an extended late phase observation—Real-world data from the prospective multicentre DEGUM study. Clin. Hemorheol. Microcirc. 2023, 84, 413–424. [Google Scholar] [CrossRef] [PubMed]
- Kallenbach, M.; Qvartskhava, N.; Weigel, C.; Dörffel, Y.; Berger, J.; Kunze, G.; Luedde, T. [Contrast-enhanced ultrasound (CEUS) for characterisation of focal liver lesions]. Z. Fur Gastroenterol. 2024, 62, 952–970. [Google Scholar]
- Piscaglia, F.; Bolondi, L. The safety of Sonovue in abdominal applications: Retrospective analysis of 23188 investigations. Ultrasound Med. Biol. 2006, 32, 1369–1375. [Google Scholar] [CrossRef] [PubMed]
- Tang, C.; Fang, K.; Guo, Y.; Li, R.; Fan, X.; Chen, P.; Chen, Z.; Liu, Q.; Zou, Y. Safety of Sulfur Hexafluoride Microbubbles in Sonography of Abdominal and Superficial Organs: Retrospective Analysis of 30,222 Cases. J. Ultrasound Med. 2017, 36, 531–538. [Google Scholar] [CrossRef] [PubMed]
- Filippone, A.; Kirchin, M.A.; Monteith, J.; Storto, M.L.; Spinazzi, A. Safety of Lumason® (SonoVue®) in special populations and critically ill patients. Front. Cardiovasc. Med. 2023, 10, 1225654. [Google Scholar] [CrossRef]
- Jung, E.M.; Wertheimer, T.; Putz, F.J.; Jung, F.; Kammerer, S.; Pregler, B.; Luerken, L.; Stroszczynski, C.; Beyer, L. Contrast enhanced ultrasound (CEUS) with parametric imaging and time intensity curve analysis (TIC) for evaluation of the success of prostate arterial embolization (PAE) in cases of prostate hyperplasia. Clin. Hemorheol. Microcirc. 2020, 76, 143–153. [Google Scholar] [CrossRef]
- Jung, E.M.; Weber, M.A.; Wiesinger, I. Contrast-enhanced ultrasound perfusion imaging of organs. Radiologe 2021, 61 (Suppl. S1), 19–28. [Google Scholar] [CrossRef]
- Wendl, C.M.; Janke, M.; Jung, W.; Stroszczysnski, C.; Jung, E.M. Contrast-enhanced ultrasound with perfusion analysis for the identification of malignant and benign tumours of the thyroid gland. Clin. Hemorheol. Microcirc. 2015, 63, 113–121. [Google Scholar] [CrossRef]
- Song, P.; Trzasko, J.D.; Manduca, A.; Huang, R.; Kadirvel, R.; Kallmes, D.F.; Chen, S. Improved Super-Resolution Ultrasound Microvessel Imaging with Spatiotemporal Nonlocal Means Filtering and Bipartite Graph-Based Microbubble Tracking. IEEE Trans. Ultrason. Ferroelectr. Freq. Control. 2018, 65, 149–167. [Google Scholar] [CrossRef]
- Errico, C.; Pierre, J.; Pezet, S.; Desailly, Y.; Lenkei, Z.; Couture, O.; Tanter, M. Ultrafast ultrasound localization microscopy for deep super-resolution vascular imaging. Nature 2015, 527, 499–502. [Google Scholar] [CrossRef]
- Christensen-Jeffries, K.; Couture, O.; Dayton, P.A.; Eldar, Y.C.; Hynynen, K.; Kiessling, F.; O`Reilly, M.; Pinton, G.F.; Schmitz, G.; Tang, M.X.; et al. Super-resolution Ultrasound Imaging. Ultrasound Med. Biol. 2020, 46, 865–891. [Google Scholar] [CrossRef] [PubMed]
- Huang, C.; Zhang, W.; Gong, P.; Lok, U.W.; Tang, S.; Yin, T.; Zhang, X.; Zhu, L.; Sang, M.; Song, P.; et al. Super-resolution ultrasound localization microscopy based on a high frame-rate clinical ultrasound scanner: An in-human feasibility study. Phys. Med. Biol. 2021, 66. [Google Scholar] [CrossRef] [PubMed]
- Wiesinger, I.; Wiggermann, P.; Zausig, N.; Beyer, L.P.; Salzberger, B.; Stroszczynski, C.; Jung, E.M. Percutaneous Treatment of Malignant Liver Lesions: Evaluation of Success Using Contrast- Enhanced Ultrasound (CEUS) and Perfusion Software. Ultraschall Med. 2018, 39, 440–447. [Google Scholar] [CrossRef]
- Neubert, K.; Brunner, E. A studentized permutation test for the non-parametric Behrens–Fisher problem. Comput. Stat. Data Anal. 2007, 51, 5192–5204. [Google Scholar] [CrossRef]
- Team RDC. R: A Language and Environment for Statistical Computing; R Foundation for Statistical Computing: Vienna, Austria, 2023; Available online: https://www.r-project.org/ (accessed on 20 April 2025).
- Patil, I. Visualizations with statistical details: The ‘ggstatsplot’ approach. J. Open Source Softw. 2021, 6, 3167. [Google Scholar] [CrossRef]
- Arnholt, A.T.; Evans, B. BSDA: Basic Statistics and Data Analysis. 2023. Available online: https://cran.r-project.org/web/packages/BSDA/index.html (accessed on 20 April 2025).
- Christensen, R.H.B. Ordinal: Regression Models for Ordinal Data. 2024. Available online: https://cran.r-project.org/web/packages/ordinal/index.html (accessed on 20 April 2025).
- Lüdecke, D. ggeffects: Tidy Data Frames of Marginal Effects from Regression Models. J. Open Source Softw. 2018, 3, 772. [Google Scholar] [CrossRef]
- Heinze, G.; Ploner, M.; Jiricka, L.; Steiner, G. logistf: Firth’s Bias-Reduced Logistic Regression. 2025. Available online: https://cran.r-project.org/web/packages/logistf/index.html (accessed on 20 April 2025).
- Dietrich, C.F.; Bamber, J.; Berzigotti, A.; Bota, S.; Cantisani, V.; Castera, L.; Cosgrove, D.; Ferraioli, G.; Friedrich-Rust, M.; Gilja, O.H.; et al. EFSUMB Guidelines and Recommendations on the Clinical Use of Liver Ultrasound Elastography, Update 2017 (Long Version). Ultraschall Med. 2017, 38, e48. [Google Scholar]
- Apfelbeck, M.; Loupas, T.; Chaloupka, M.; Clevert, D.A. Improved diagnostic confidence using Super Resolution CEUS imaging in testicular lesions. Clin. Hemorheol. Microcirc. 2024, 88, S113–S125. [Google Scholar] [CrossRef] [PubMed]
- Putz, F.J.; Verloh, N.; Erlmeier, A.; Schelker, R.C.; Schreyer, A.G.; Hautmann, M.G.; Stroszczynski, C.; Banas, B.; Jung, E.M. Influence of limited examination conditions on contrast-enhanced sonography for characterising liver lesions. Clin. Hemorheol. Microcirc. 2019, 71, 267–276. [Google Scholar] [CrossRef]
- Bastati-Huber, N.; Pötter-Lang, S.; Ba-Ssalamah, A. Focal nodular hyperplasia and hepatocellular adenoma. Radiologist 2015, 55, 18–26. [Google Scholar] [CrossRef]
- Mörk, H.; Andre, I.; Gudrun, S.; Michaela, O.; Dietrich, C.F. Analysis of neuroendocrine tumour metastases in the liver using contrast enhanced ultrasonography. Scand. J. Gastroenterol. 2007, 42, 652–662. [Google Scholar] [CrossRef] [PubMed]
- Fröhlich, E.; Jenssen, C.; Schuler, A.; Dietrich, C.F. Contrast sonography for the characterization of liver tumors: Practical aspects. Z Gastroenterol. 2015, 53, 1099–1107. [Google Scholar]
- Eusebi, L.; Masino, F.; Bertolotto, M.; Montatore, M.; Sortino, G.; Pitoni, L.; Santarelli, S.; Galosi, A.B.; Guglielmi, G. Contrast-enhanced ultrasound in the evaluation and management of solid renal lesions based on EFSUMB guidelines. J. Med. Ultrason. 2025. [Google Scholar] [CrossRef] [PubMed]
- Dietrich, C.F.; Correas, J.M.; Cui, X.W.; Dong, Y.; Havre, R.F.; Jenssen, C.; Jung, E.M.; Krix, M.; Lim, A.; Lassau, N.; et al. EFSUMB Technical Review—Update 2023: Dynamic Contrast-Enhanced Ultrasound (DCE-CEUS) for the Quantification of Tumor Perfusion. Ultraschall Med. 2024, 45, 36–46. [Google Scholar] [CrossRef]
- Lyshchik, A.; Fetzer, D.T.; Kono, Y.; Wilson, S.R.; Dietrich, C.F.; Clevert, D.A.; Meloni, M.F.; Jang, H.J.; Kim, T.K.; Lee, J.M.; et al. Liver Imaging Reporting and Data System Contrast-Enhanced US Nonradiation Treatment Response Assessment Version 2024. Radiology 2024, 311, e232369. [Google Scholar] [CrossRef] [PubMed]
- Barr, R.G.; Huang, P.; Luo, Y.; Xie, X.; Zheng, R.; Yan, K.; Jing, X.; Luo, Y.; Xu, H.; Fei, X.; et al. Contrast-enhanced ultrasound imaging of the liver: A review of the clinical evidence for SonoVue and Sonazoid. Abdom. Radiol. 2020, 45, 3779–3788. [Google Scholar] [CrossRef]
- da Silva, N.P.B.; Beyer, L.P.; Hottenrott, M.C.; Hackl, C.; Schlitt, H.J.; Stroszczynski, C.; Wiggermann, P.; Jung, E.M. Efficiency of contrast enhanced ultrasound for immediate assessment of ablation status after intraoperative radiofrequency ablation of hepatic malignancies. Clin. Hemorheol. Microcirc. 2017, 66, 357–368. [Google Scholar] [CrossRef]
- Dropco, I.; Kaiser, U.; Wagner, L.; Brunner, S.M.; Schlitt, H.J.; Stroszcynski, C.; Jung, F.; Yi, D.; Herr, W.; Jung, E.M. Color Mapping using Ultrasound System-integrated Perfusion Software for Evaluation of Focal Liver Lesions: A Possible First Step for More Independent Reading. J. Gastrointest. Liver Dis. 2023, 32, 479–487. [Google Scholar] [CrossRef]
- Radu, P.; Semmo, N.; Berzigotti, A. Liver cysts: Ultrasound and diagnostics. Swiss Gastroenterol. 2024, 5, 82–93. [Google Scholar]
- Ingangi, V.; De Chiara, A.; Ferrara, G.; Gallo, M.; Catapano, A.; Fazioli, F.; Di Carluccio, G.; Peranzoni, E.; Marigo, I.; Carriero, M.V.; et al. Emerging Treatments Targeting the Tumor Microenvironment for Advanced Chondrosarcoma. Cells 2024, 13, 977. [Google Scholar] [CrossRef]
- Apelt, K.; Bijkerk, R.; Lebrin, F.; Rabelink, T.J. Imaging the Renal Microcirculation in Cell Therapy. Cells 2021, 10, 1087. [Google Scholar] [CrossRef] [PubMed]


| Malignant (n = 8) | Benign (n = 46) | Intervention (n = 5) | Morbus Osler (n = 6) | Overall (n = 65) | |
|---|---|---|---|---|---|
| Age, years | |||||
| Mean (SD) | 70.6 (10.2) | 56.7 (17.6) | 63.2 (7.82) | 45.0 (17.3) | 57.8 (17.2) |
| Median [min, max] | 73.5 [52.0, 84.0] | 57.0 [22.0, 88.0] | 59.0 [55.0, 73.0] | 47.0 [22.0, 64.0] | 59.0 [22.0, 88.0] |
| Sex | |||||
| Male | 6 (75.0%) | 23 (50.0%) | 5 (100%) | 3 (50.0%) | 37 (56.9%) |
| Female | 2 (25.0%) | 23 (50.0%) | 0 (0%) | 3 (50.0%) | 28 (43.1%) |
| Steatosis | |||||
| No steatosis | 6 (75.0%) | 17 (37.0%) | 3 (60.0%) | 4 (66.7%) | 30 (46.2%) |
| Steatosis | 2 (25.0%) | 29 (63.0%) | 2 (40.0%) | 2 (33.3%) | 35 (53.8%) |
| Fibrosis | |||||
| F0 | 1 (12.5%) | 12 (26.1%) | 0 (0%) | 1 (16.7%) | 14 (21.5%) |
| F1 fibrosis | 5 (62.5%) | 24 (52.2%) | 2 (40.0%) | 4 (66.7%) | 35 (53.8%) |
| F2 fibrosis | 0 (0%) | 6 (13.0%) | 2 (40.0%) | 0 (0%) | 8 (12.3%) |
| F3 fibrosis | 1 (12.5%) | 2 (4.3%) | 0 (0%) | 1 (16.7%) | 4 (6.2%) |
| F4 fibrosis | 1 (12.5%) | 2 (4.3%) | 1 (20.0%) | 0 (0%) | 4 (6.2%) |
| Lesion depth (center), cm | |||||
| Mean (SD) | 5.75 (2.13) | 5.87 (2.35) | 8.66 (2.56) | 5.83 (3.07) | 6.07 (2.47) |
| Median [min, max] | 5.00 [3.40, 9.90] | 5.25 [2.50, 13.0] | 8.20 [5.10, 12.0] | 4.25 [3.20, 10.0] | 5.10 [2.50, 13.0] |
| Lesion height, cm | |||||
| Mean (SD) | 2.87 (1.89) | 2.64 (1.73) | 3.01 (0.816) | 3.98 (1.77) | 2.80 (1.71) |
| Median [min, max] | 1.91 [1.36, 7.00] | 2.36 [0.57, 7.40] | 2.88 [2.00, 3.93] | 4.00 [1.50, 6.51] | 2.50 [0.57, 7.40] |
| Missing | 0 (0%) | 0 (0%) | 0 (0%) | 1 (16.7%) | 1 (1.5%) |
| Lesion width, cm | |||||
| Mean (SD) | 2.64 (1.72) | 2.48 (1.58) | 2.80 (0.716) | 2.35 (0.899) | 2.51 (1.48) |
| Median [min, max] | 1.93 [1.15, 6.00] | 2.02 [0.54, 7.07] | 2.50 [2.00, 3.80] | 2.32 [1.50, 3.61] | 2.25 [0.54, 7.07] |
| Missing | 0 (0%) | 0 (0%) | 0 (0%) | 1 (16.7%) | 1 (1.5%) |
Disclaimer/Publisher’s Note: The statements, opinions and data contained in all publications are solely those of the individual author(s) and contributor(s) and not of MDPI and/or the editor(s). MDPI and/or the editor(s) disclaim responsibility for any injury to people or property resulting from any ideas, methods, instructions or products referred to in the content. |
© 2025 by the authors. Licensee MDPI, Basel, Switzerland. This article is an open access article distributed under the terms and conditions of the Creative Commons Attribution (CC BY) license (https://creativecommons.org/licenses/by/4.0/).
Share and Cite
Kaiser, U.; Vehling-Kaiser, U.; Kück, F.; Gilanschah, M.; Jung, F.; Jung, E.M. Super-Resolution Contrast-Enhanced Ultrasound Examination Down to the Microvasculature Enables Quantitative Analysis of Liver Lesions: First Results. Life 2025, 15, 991. https://doi.org/10.3390/life15070991
Kaiser U, Vehling-Kaiser U, Kück F, Gilanschah M, Jung F, Jung EM. Super-Resolution Contrast-Enhanced Ultrasound Examination Down to the Microvasculature Enables Quantitative Analysis of Liver Lesions: First Results. Life. 2025; 15(7):991. https://doi.org/10.3390/life15070991
Chicago/Turabian StyleKaiser, Ulrich, Ursula Vehling-Kaiser, Fabian Kück, Mia Gilanschah, Friedrich Jung, and Ernst Michael Jung. 2025. "Super-Resolution Contrast-Enhanced Ultrasound Examination Down to the Microvasculature Enables Quantitative Analysis of Liver Lesions: First Results" Life 15, no. 7: 991. https://doi.org/10.3390/life15070991
APA StyleKaiser, U., Vehling-Kaiser, U., Kück, F., Gilanschah, M., Jung, F., & Jung, E. M. (2025). Super-Resolution Contrast-Enhanced Ultrasound Examination Down to the Microvasculature Enables Quantitative Analysis of Liver Lesions: First Results. Life, 15(7), 991. https://doi.org/10.3390/life15070991