
Determination of Biochemical and Metabolomic Characteristics of Sheep Blood Serum and Their Application in Clinical Practice


Abstract
1. Introduction
2. Materials and Methods
2.1. Sample Collection
2.2. Blood Sampling and Serum Preparation
2.3. Preparation of Mobile Phase for HPLC Analysis
2.4. Preparation of Stock Standard Solutions
2.5. Preparation of Samples for Biochemical and UHPLC Analysis
2.6. Biochemical Analysis of Blood Serum
2.7. Qualitative and Quantitative UHPLC Analysis of Blood Serum
3. Results
4. Discussion
4.1. Biochemical Parameters and Enzyme Activities in Healthy Sheep
4.2. Inflammatory Markers
4.3. Metabolite Profiling Using UHPLC
4.4. Creatinine as a Marker of Renal and Bone Function
4.5. Amino Acids and Bone Metabolism
4.6. Purine Metabolites and Immune System Activation
5. Conclusions
Author Contributions
Funding
Institutional Review Board Statement
Informed Consent Statement
Data Availability Statement
Conflicts of Interest
References
- Braun, J.P.; Trumel, C.; Bézille, P. Clinical Biochemistry in Sheep: A Selected Review. Small Rumin. Res. 2010, 92, 10–18. [Google Scholar] [CrossRef]
- D’Alessandro, A.; Giardina, B.; Federica, G.; Timperio, A.M.; Zolla, L. Clinical Metabolomics: The next Stage of Clinical Biochemistry. Blood Transfus. 2012, 10, 19–24. [Google Scholar] [CrossRef]
- Vallet-Regi, M.; Salinas, A.J. Mesoporous Bioactive Glasses for Regenerative Medicine. Mater. Today Bio 2021, 11, 100121. [Google Scholar] [CrossRef]
- Hermerén, G. The Ethics of Regenerative Medicine. Biol. Futur. 2021, 72, 113–118. [Google Scholar] [CrossRef]
- Tóthová, C.; Mihajlovičová, X.; Novotný, J.; Nagy, O.; Giretová, M.; Krešáková, L.; Tomco, M.; Zert, Z.; Vilhanova, Z.; Varga, M.; et al. The Serum Protein Profile and Acute Phase Proteins in the Postoperative Period in Sheep after Induced Articular Cartilage Defect. Materials 2019, 12, 142. [Google Scholar] [CrossRef]
- McEwan, J.K.; Tribe, H.C.; Jacobs, N.; Hancock, N.; Qureshi, A.A.; Dunlop, D.G.; Oreffo, R.O.C. Regenerative Medicine in Lower Limb Reconstruction. Regen. Med. 2018, 13, 477–490. [Google Scholar] [CrossRef]
- Johnson, C.; Ivanisevic, J.; Siuzdak, G. Beyond Biomarkers and towards Mechanisms. Nat. Rev. Mol. Cell Biol. 2016, 17, 451–459. [Google Scholar] [CrossRef] [PubMed]
- Christians, U.; Klawitter, J.; Klawitter, J. Biomarkers in Transplantation—Proteomics and Metabolomics. Ther. Drug Monit. 2016, 38, 70–74. [Google Scholar] [CrossRef] [PubMed]
- Bujak, R.; Struck-Lewicka, W.; Markuszewski, M.J.; Kaliszan, R. Metabolomics for Laboratory Diagnostics. J. Pharm. Biomed. Anal. 2014, 113, 108–120. [Google Scholar] [CrossRef] [PubMed]
- Sarmin, S.; Winarsih, S.; Hana, A.; Astuti, P.; Airin, C.M. Parameters of Blood Biochemistry in Different Physiological Status of Fat-Tailed Sheep. AIP Conf. Proc. 2021, 2353, 030070. [Google Scholar] [CrossRef]
- Varanis, L.F.M.; Oliveira, K.A.; Araújo, C.M.; da CRUZ, W.F.G.; Macedo, G.d.L., Jr. Serum Biochemical Reference Ranges for Pregnant Sheep. Biosci. J. 2021, 37, e37036. [Google Scholar] [CrossRef]
- Seixas, L.; Peripolli, V.; Façanha, D.A.E.; Fischer, V.; Poli, C.H.E.C.; Melo, C.B.; Louvandini, H.; McManus, C.M. Physiological and Hematological Parameters of Sheep Reared in the Tropics and Subtropics. Arq. Bras. De Med. Veterinária E Zootec. 2021, 73, 622–630. [Google Scholar] [CrossRef]
- Slater, J.S. Nitrogenous Constituents of Serum and Urine in Normal and Scrapie Sheep. Res. Vet. Sci. 1965, 6, 92. [Google Scholar] [CrossRef] [PubMed]
- Tatara, M.R.; Brodzki, A.; Pasternak, K.; Szpetnar, M.; Rosenbeiger, P.; Tymczyna, B.; Niedziela, D.; Krupski, W. Changes of Amino Acid Concentrations in Polish Merino Sheep between 21 and 150 Days of Life. Vet. Med. (Praha) 2014, 59, 68–75. [Google Scholar] [CrossRef]
- Devignes, C.S.; Carmeliet, G.; Stegen, S. Amino Acid Metabolism in Skeletal Cells. Bone Rep. 2022, 17, 101620. [Google Scholar] [CrossRef]
- Demura, S.; Takahashi, K.; Kawahara, N.; Watanabe, Y.; Tomita, K. Serum Interleukin-6 Response after Spinal Surgery: Estimation of Surgical Magnitude. J. Orthop. Sci. 2006, 11, 241–247. [Google Scholar] [CrossRef]
- Huss, R. Biomarkers. In Translational Regenerative Medicine; Elsevier Inc.: New York, NY, USA, 2015; pp. 235–241. ISBN 9780124104570. [Google Scholar]
- Valko-Rokytovská, M.; Očenáš, P.; Salayová, A.; Kostecká, Z. New Developed UHPLC Method for Selected Urine Metabolites. J. Chromatogr. Sep. Tech. 2018, 9, 2. [Google Scholar] [CrossRef]
- Eschbach, J.W.; Adamson, J.W.; Dennis, M.B. Physiologic Studies in Normal and Uremic Sheep: I. The Experimental Model. Kidney Int. 1980, 18, 725–731. [Google Scholar] [CrossRef]
- Mašek, T.; Konjević, D.; Severin, K.; Janicki, Z.; Grubešić, M.; Krapinec, K.; Bojanc, J.; Mikulec, Ž.; Slavica, A. Hematology and Serum Biochemistry of European Mouflon (Ovis Orientalis Musimon) in Croatia. Eur. J. Wildl. Res. 2009, 55, 561–566. [Google Scholar] [CrossRef]
- Tóthová, C.; Novotný, J.; Nagy, O.; Horňáková, P.; Zert, Z.; Varga, M.; Medvecky, L.; Vdoviaková, K.; Danko, J.; Petrovová, E. Changes in the Acute-Phase Protein Concentrations and Activities of Some Enzymes in Pigs Following the Repair of Experimentally Induced Articular Cartilage Defects Using Two Types of Biocement Powder. Animals 2019, 9, 931. [Google Scholar] [CrossRef]
- Tóthová, C.; Nagy, O.; Novotný, J.; Vdoviaková, K.; Krešáková, L.; Danko, J.; Žert, Z.; Medvecký, L.; Petrovová, E. The Effect of the Repair of Induced Articular Cartilage Defects in Pigs Using Calcium Phosphate Cement with Aminoacids on the Concentrations of Selected Inflammatory Markers and Serum Enzyme Activities. Symmetry 2021, 13, 1720. [Google Scholar] [CrossRef]
- Xue, G.-P.; Fishlock, R.C.; Snoswell, A.M. Determination of Creatinine in Whole Blood, Plasma, and Urine by High-Performance Liquid Chromatography. Anal. Biochem. 1988, 171, 135–140. [Google Scholar] [CrossRef]
- Rosano, T.G.; Ambrose, R.T.; Wu, A.H.B.; Swift, T.A.; Yadegari, P. Candidate Reference Method for Determining Creatinine in Serum: Method Development and Interlaboratory Validation. Clin. Chem. 1990, 36, 1951–1955. [Google Scholar] [CrossRef]
- Nedeva, I.; Slavov, T.; Radev, V.; Panayotov, D.; Varlyakov, I. Blood Biochemical Profile as an Objective Measure of Welfare in Lacaune Sheep. Bulg. J. Agric. Sci. 2022, 28, 324–330. [Google Scholar]
- Trabado, S.; Al-Salameh, A.; Croixmarie, V.; Masson, P.; Corruble, E.; Fève, B.; Colle, R.; Ripoll, L.; Walther, B.; Boursier-Neyret, C.; et al. The Human Plasma-Metabolome: Reference Values in 800 French Healthy Volunteers; Impact of Cholesterol, Gender and Age. PLoS ONE 2017, 12, e0173615. [Google Scholar] [CrossRef] [PubMed]
- Vrabie, R.T.; Baston, C.; Gingu, C.; Guler-Margaritis, S.S.; Manea, I.F.; Tacu, D.; Tincu, C.; Sinescu, I. Correlation between Serum Creatinine and Kidney Transplant Recipient Parameters. Eur. Urol. Suppl. 2018, 17, e2709. [Google Scholar] [CrossRef]
- Lin, C.T.; Chiang, Y.J.; Liu, K.L.; Lin, K.J.; Chu, S.H.; Wang, H.H. Urine Albumin Creatinine Ratio May Predict Graft Function After Kidney Transplant. Transplant. Proc. 2019, 51, 1331–1336. [Google Scholar] [CrossRef]
- Arrabal-Polo, M.A.; Arrabal-Martin, M.; Poyatos-Andujar, A.; Cardenas-Grande, E.; Merino-Salas, S.; Zuluaga-Gomez, A. Is the Fasting Calcium/creatinine a Bone Resorption Marker in Patients with Calcium Renal Stones? Urol. Res. 2012, 40, 243–245. [Google Scholar] [CrossRef]
- Allison, G.G.; Rees Stevens, P.; Jackman, R.; Moorby, J.M. Normal Ranges and Temporal Variation in Plasma Concentrations of L-Lactate and Free Amino Acids in Adult Sheep. Res. Vet. Sci. 2008, 85, 22–25. [Google Scholar] [CrossRef]
- Leeuwenburgh, C.; Wagner, P.; Holloszy, J.O.; Sohal, R.S.; Heinecke, J.W. Caloric Restriction Attenuates Dityrosine Cross-Linking of Cardiac and Skeletal Muscle Proteins in Aging Mice. Arch. Biochem. Biophys. 1997, 346, 74–80. [Google Scholar] [CrossRef]
- Pennathur, S.; Ido, Y.; Heller, J.I.; Byun, J.; Danda, R.; Pergola, P.; Williamson, J.R.; Heinecke, J.W. Reactive Carbonyls and Polyunsaturated Fatty Acids Produce a Hydroxyl Radical-like Species: A Potential Pathway for Oxidative Damage of Retinal Proteins in Diabetes. J. Biol. Chem. 2005, 280, 22706–22714. [Google Scholar] [CrossRef]
- Brasnyó, P.; Molnár, G.A.; Mohás, M.; Markó, L.; Laczy, B.; Cseh, J.; Mikolás, E.; Szijártó, I.A.; Mérei, Á.; Halmai, R.; et al. Resveratrol Improves Insulin Sensitivity, Reduces Oxidative Stress and Activates the Akt Pathway in Type 2 Diabetic Patients. Br. J. Nutr. 2011, 106, 383–389. [Google Scholar] [CrossRef]
- Fu, S.; Dean, R.; Southan, M.; Truscott, R. The Hydroxyl Radical in Lens Nuclear Cataractogenesis. J. Biol. Chem. 1998, 273, 28603–28609. [Google Scholar] [CrossRef] [PubMed]
- Wells-Knecht, M.C.; Huggins, T.G.; Dyer, D.G.; Thorpe, S.R.; Baynes, J.W. Oxidized Amino Acids in Lens Protein with Age: Measurement of O-Tyrosine and Dityrosine in the Aging Human Lens. J. Biol. Chem. 1993, 268, 12348–12352. [Google Scholar] [CrossRef] [PubMed]
- Leeuwenburgh, C.; Rasmussen, J.E.; Hsu, F.F.; Mueller, D.M.; Pennathur, S.; Heinecke, J.W. Mass Spectrometric Quantification of Markers for Protein Oxidation by Tyrosyl Radical, Copper, and Hydroxyl Radical in Low Density Lipoprotein Isolated from Human Atherosclerotic Plaques. J. Biol. Chem. 1997, 272, 3520–3526. [Google Scholar] [CrossRef] [PubMed]
- Fu, S.; Davies, M.J.; Stocker, R.; Dean, R.T. Evidence for Roles of Radicals in Protein Oxidation in Advanced Human Atherosclerotic Plaque. Biochem. J. 1998, 333, 519–525. [Google Scholar] [CrossRef]
- Lubec, G.; Widness, J.A.; Hayde, M.; Menzel, D.; Pollak, A. Hydroxyl Radical Generation in Oxygen-Treated Infants. Pediatrics 1997, 100, 700–704. [Google Scholar] [CrossRef]
- Ipson, B.R.; Fisher, A.L. Roles of the Tyrosine Isomers Meta-Tyrosine and Ortho-Tyrosine in Oxidative Stress. Ageing Res. Rev. 2016, 27, 93–107. [Google Scholar] [CrossRef]
- Molnár, G.A.; Kun, S.; Sélley, E.; Kertész, M.; Szélig, L.; Csontos, C.; Böddi, K.; Bogár, L.; Miseta, A.; Wittmann, I. Role of Tyrosine Isomers in Acute and Chronic Diseases Leading to Oxidative Stress-A Review. Curr. Med. Chem. 2016, 23, 667–685. [Google Scholar] [CrossRef]
- El Refaey, M.; Watkins, C.P.; Kennedy, E.J.; Chang, A.; Zhong, Q.; Ding, K.H.; Shi, X.M.; Xu, J.; Bollag, W.B.; Hill, W.D.; et al. Oxidation of the Aromatic Amino Acids Tryptophan and Tyrosine Disrupts Their Anabolic Effects on Bone Marrow Mesenchymal Stem Cells. Mol. Cell Endocrinol. 2015, 410, 87–96. [Google Scholar] [CrossRef]
- van Gastel, N.; Stegen, S.; Eelen, G.; Schoors, S.; Carlier, A.; Daniëls, V.W.; Baryawno, N.; Przybylski, D.; Depypere, M.; Stiers, P.J.; et al. Lipid Availability Determines Fate of Skeletal Progenitor Cells via SOX9. Nature 2020, 579, 111–117. [Google Scholar] [CrossRef] [PubMed]
- Navik, U.; Sheth, V.G.; Khurana, A.; Jawalekar, S.S.; Allawadhi, P.; Gaddam, R.R.; Bhatti, J.S.; Tikoo, K. Methionine as a Double-Edged Sword in Health and Disease: Current Perspective and Future Challenges. Ageing Res. Rev. 2021, 72, 101500. [Google Scholar] [CrossRef] [PubMed]
- Vijayan, V.; Khandelwal, M.; Manglani, K.; Gupta, S.; Surolia, A. Methionine down-Regulates TLR4/MyD88/NF-κB Signalling in Osteoclast Precursors to Reduce Bone Loss during Osteoporosis. Br. J. Pharmacol. 2014, 171, 107–121. [Google Scholar] [CrossRef] [PubMed]
- Ouattara, A.; Cooke, D.; Gopalakrishnan, R.; Huang, T.H.; Ables, G.P. Methionine Restriction Alters Bone Morphology and Affects Osteoblast Differentiation. Bone Rep. 2016, 5, 33–42. [Google Scholar] [CrossRef]
- Plummer, J.; Park, M.; Perodin, F.; Horowitz, M.C.; Hens, J.R. Methionine-Restricted Diet Increases miRNAs That Can Target RUNX2 Expression and Alters Bone Structure in Young Mice. J. Cell Biochem. 2017, 118, 31–42. [Google Scholar] [CrossRef]
- Woitge, H.W.; Seibel, M.J. Markers of Bone and Cartilage Turnover. Exp. Clin. Endocrinol. Diabetes 2017, 125, 454–469. [Google Scholar] [CrossRef]
- Hlaing, T.T.; Compston, J.E. Biochemical Markers of Bone Turnover—Uses and Limitations. Ann. Clin. Biochem. 2014, 51, 189–202. [Google Scholar] [CrossRef]
- Kumar Srivastava, A.; Khare, P.; Kumar Nagar, H.; Raghuwanshi, N.; Srivastava, R. Hydroxyproline: A Potential Biochemical Marker and Its Role in the Pathogenesis of Different Diseases. Curr. Protein Pept. Sci. 2016, 17, 596–602. [Google Scholar] [CrossRef]
- Onwuka, C.I.; Uguru, C.C.; Onwuka, C.I.; Obiechina, A.E. Evaluation of Urinary Hydroxyproline and Creatinine Level in Patients with Benign Mandibular Odontogenic Tumor. Clin. Exp. Dent. Res. 2021, 7, 934–940. [Google Scholar] [CrossRef]
- Mediero, A.; Cronstein, B.N. Adenosine and Bone Metabolism. Trends Endocrinol. Metab. 2013, 24, 290–300. [Google Scholar] [CrossRef]
- Haskó, G.; Linden, J.; Cronstein, B.; Pacher, P. Adenosine Receptors: Therapeutic Aspects for Inflammatory and Immune Diseases. Nat. Rev. Drug Discov. 2008, 7, 759–770. [Google Scholar] [CrossRef]
- Le, G.Y.; Essackjee, H.C.; Ballard, H.J. Intracellular Adenosine Formation and Release by Freshly-Isolated Vascular Endothelial Cells from Rat Skeletal Muscle: Effects of Hypoxia And/or Acidosis. Biochem. Biophys. Res. Commun. 2014, 450, 93–98. [Google Scholar] [CrossRef]
- Fisher, O.; Benson, R.A.; Imray, C.H. The Clinical Application of Purine Nucleosides as Biomarkers of Tissue Ischemia and Hypoxia in Humans in Vivo. Biomark. Med. 2018, 13, 953–965. [Google Scholar] [CrossRef]
- Hejrati, A.; Taghadosi, M.; Alizadeh-Navaei, R.; Hosseinzadeh, S.; Bashash, D.; Esmaili, M.; Zafari, P. Neopterin Serum Level Does Not Reflect the Disease Activity in Rheumatoid Arthritis: A Systematic Review and Meta-Analysis. IUBMB Life 2020, 72, 2563–2571. [Google Scholar] [CrossRef]
- Baxter-Parker, G.; Roffe, L.; Moltchanova, E.; Jefferies, J.; Raajasekar, S.; Hooper, G.; Gieseg, S.P. Urinary Neopterin and Total Neopterin Measurements Allow Monitoring of Oxidative Stress and Inflammation Levels of Knee and Hip Arthroplasty Patients. PLoS ONE 2021, 16, e0256072. [Google Scholar] [CrossRef]

| Clinical-chemical in vitro diagnostic parameters | Experimental Physiological Values of Selected Biochemical Parameters (Samples, n = 60) | ||||||
| Mean ± SD | Median; IQR | Minimum | Maximum | Physiological | |||
| SKYLA | TP (g × dL−1) | 8.26 ± 0.630 | 8.3; 0.7 | 6.7 | 10.0 | 7.6–8.9 | |
| ALB (g × dL−1) | 3.13 ± 0.343 | 3.1; 0.2 | 2.1 | 4.9 | 2.8–3.5 | ||
| GLOB (g × dL−1) | 5.13 ± 0.393 | 5.2; 0.675 | 3.5 | 7.2 | 4.7–5.6 | ||
| A/G | 0.62 ± 0.099 | 0.6; 0.2 | 0.3 | 1.0 | 0.5–0.8 | ||
| ALP (U × L−1) | 294.9 ± 170.418 | 282.0; 301.0 | 76.0 | 605.0 | 124.0–466.0 | ||
| ALT (U × L−1) | 23.3 ± 6.283 | 20.0; 5.0 | 20.0 | 48.0 | 17.0–30.0 | ||
| AST (U × L−1) | 130.2 ± 25.718 | 134.0; 20.5 | 84.0 | 209.0 | 104.0–156.0 | ||
| GGT (U × L−1) | 60.5 ± 14.827 | 59.0; 12.0 | 38.0 | 117.0 | 45.0–75.0 | ||
| CREA (mg × dL−1) | 1.1 ± 0.129 | 1.055; 0.19 | 0.8 | 1.4 | 0.9–1.3 | ||
| TBIL (mg × dL−1) | 0.4 ± 0.057 | 0.4; 0.0 | 0.32 | 0.48 | 0.35–0.45 | ||
| TC (g × dL−1) | 83.8 ± 18.432 | 79.5; 17.0 | 55.0 | 115.0 | 65.0–103.0 | ||
| GLU (mg × dL−1) | 44.8 ± 8.400 | 45.0; 11.0 | 30.0 | 68.0 | 36.0–53.5 | ||
| UA (mg × dL−1) | <1.0 | <1.0 | <1.0 | <1.0 | <1.0 | ||
| UREA (mg × dL−1) | 49.6 ± 8.087 | 47.3; 9.6 | 33.6 | 68.1 | 41.5–58.0 | ||
| BUN (mg × dL−1) | 23.2 ± 3.778 | 22.1; 4.5 | 15.7 | 31.8 | 19.0–27.0 | ||
| Na (mmol × L−1) | 140.6 ± 5.875 | 141.5; 6.0 | 120.0 | 153.0 | 134.5–146.5 | ||
| K (mmol × L−1) | 5.2 ± 0.455 | 5.15; 0.7 | 4.2 | 5.9 | 4.7–5.7 | ||
| Ca (mmol × L−1) | 10.4 ± 0.626 | 10.4; 0.6 | 8.6 | 11.3 | 9.7–11.3 | ||
| Cl (mmol × L−1) | 106.9 ± 3.673 | 104.5; 10.0 | 89.0 | 112.0 | 103.2–110.6 | ||
| PHOS (mg × dL−1) | 5.8 ± 0.953 | 5.6; 1.5 | 3.9 | 7.6 | 4.8–6.8 | ||
| EXDIA | CRP (mg × L−1) | 0.262 ± 0.058 | 0.25; 0.04 | 0.18 | <0.38 | 0.20–0.32 | |
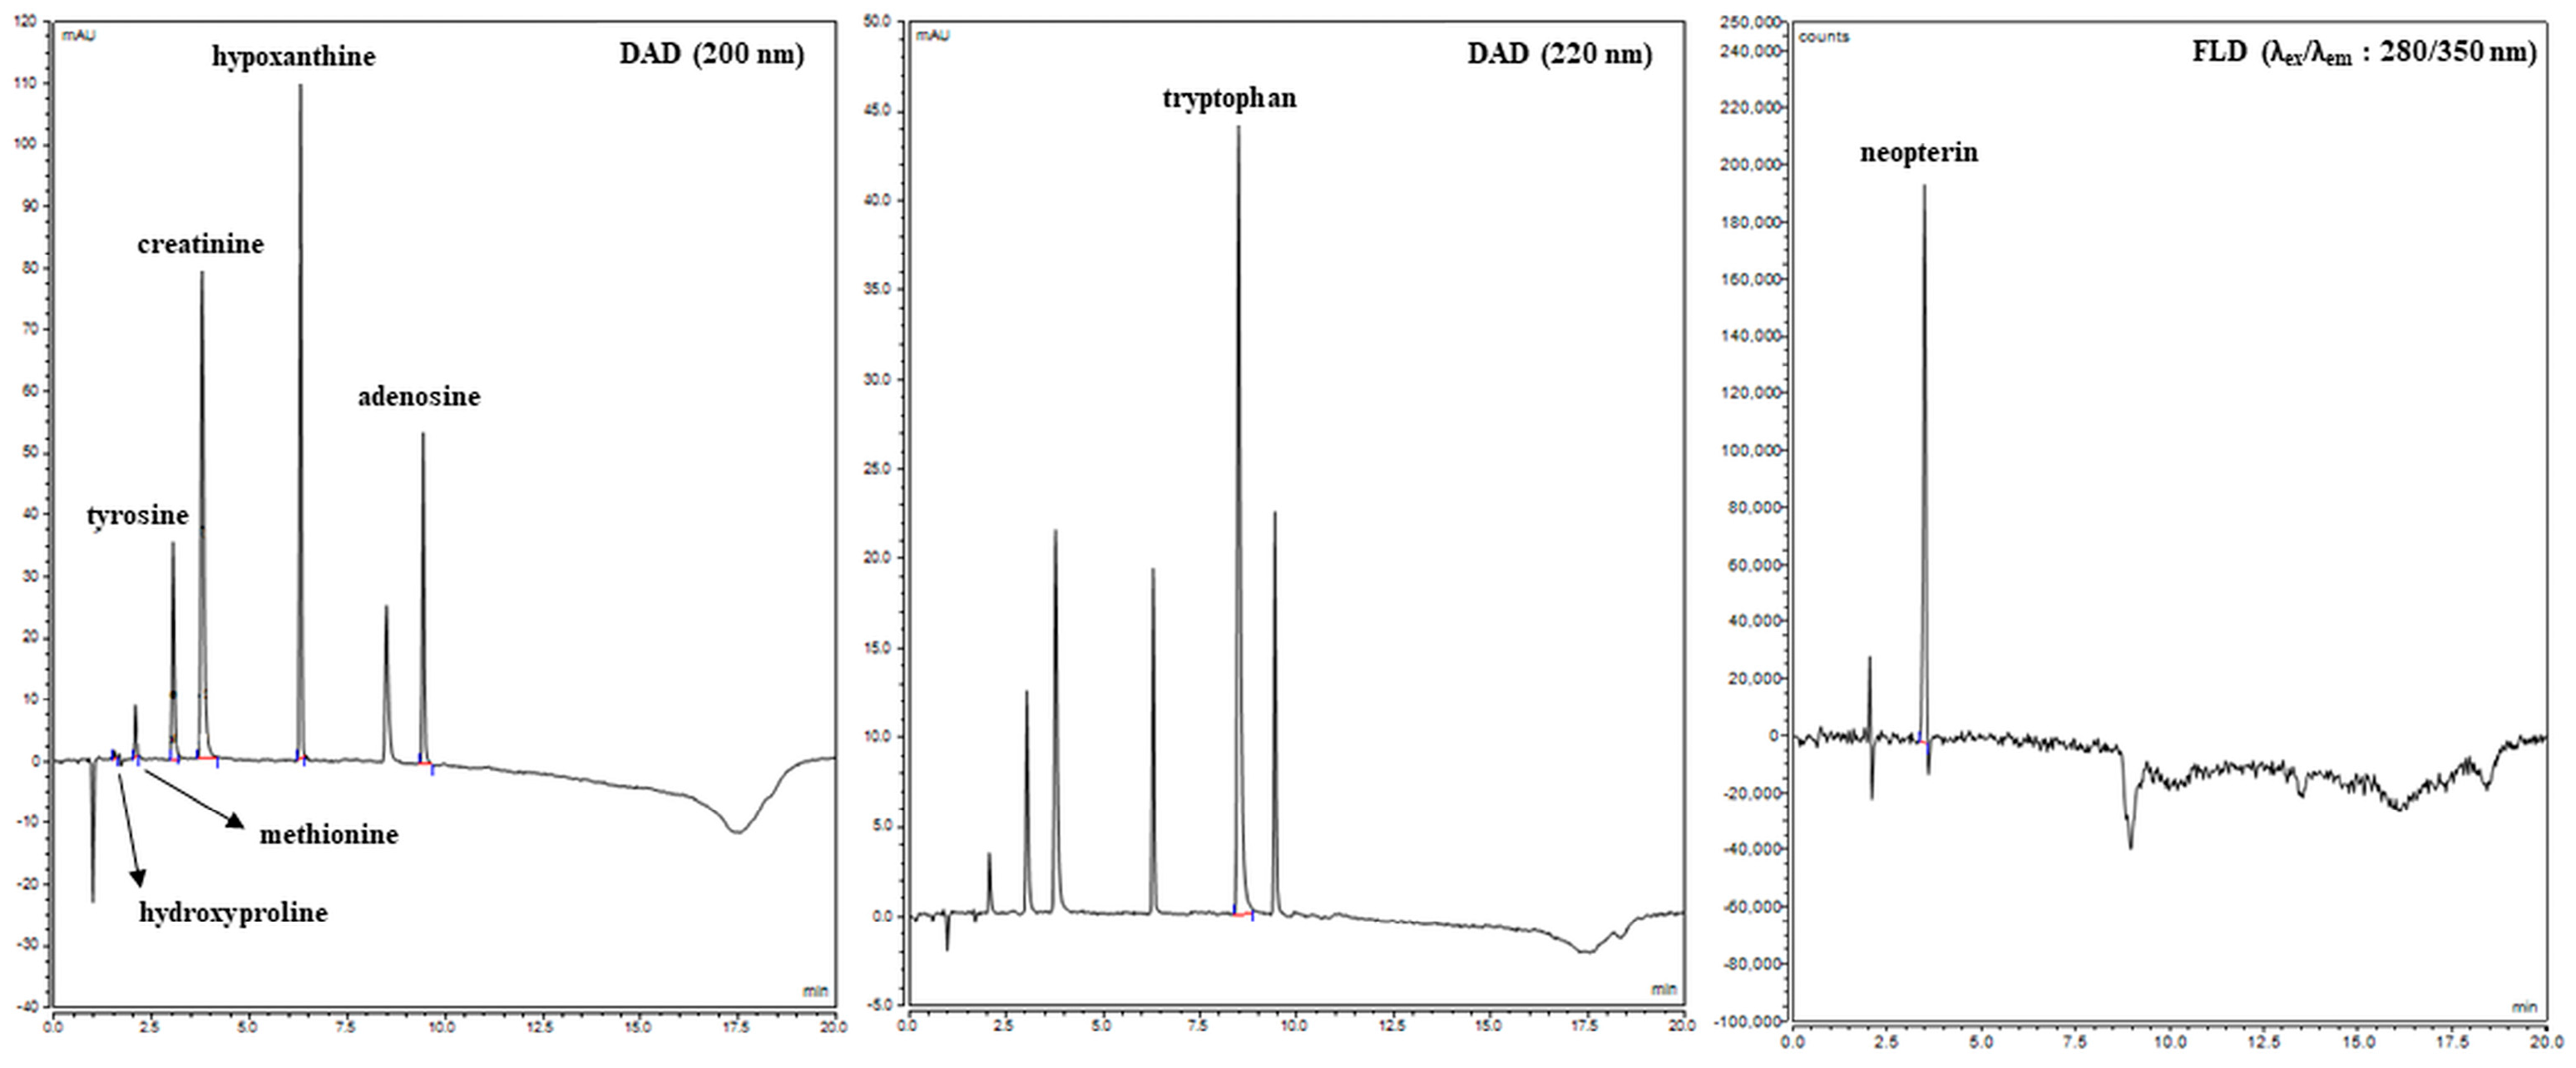
| Analytes | Detection | Retention Times (tR, min) | Calibration Line Equation | Correlation Coefficient (R2) | RSD (%) | Recovery (Intra/Inter, %) | LOD (ng × mL−1) | LOQ (ng × mL−1) |
| creatinine | DAD | 3.537 | x = 0.7067y + 0.0714 | 0.9998 | 2.516 | 103.1/107.2 | 7 | 22 |
| tyrosine | DAD | 3.027 | x = 0.2456y + 0.0082 | 0.9998 | 5.459 | 102.3/104.2 | 8 | 25 |
| tryptophan | DAD | 8.493 | x = 0.4355y − 0.0191 | 0.9998 | 4.980 | 99.0/101.0 | 5 | 15 |
| methionine | DAD | 2.070 | x = 0.0501y − 0.0022 | 0.9978 | 3.152 | 101.0/105.0 | 9 | 28 |
| hydroxyproline | DAD | 1.527 | x = 0.0714y | 0.9966 | 6.728 | 98.0/102.0 | 10 | 31 |
| adenosine | DAD | 9.423 | x = 0.3078y − 0.0085 | 0.9993 | 4.239 | 101.0/103.0 | 7 | 23 |
| hypoxanthin | DAD | 6.283 | x = 0.5911y + 0.0839 | 0.9991 | 3.855 | 99.0/102.0 | 6 | 20 |
| neopterin | FLD | 3.390 | x = 1933.3816y + 353.221 | 0.9995 | 2.791 | 101.0/103.0 | 5 | 17 |
| Experimental Blood Serum Values of Selected Metabolomics Parameters [Samples (n = 60); µmol × L−1] | |||||
|---|---|---|---|---|---|
| Metabolites | Mean ± SD | Minimum | Maximum | Physiological | |
| UHPLC | creatinine | 88 ± 17 | 54 | 117 | 70–100 |
| tyrosine | 92 ± 27 | 11 | 143 | 65–120 | |
| tryptophan | 57 ± 26 | 20 | 102 | 30–85 | |
| methionine | 41 ± 12 | 19 | 74 | 29–55 | |
| hydroxyproline | 34 ± 10 | 16 | 59 | 24–45 | |
| adenosine | 1.795 ± 0.560 | 1.022 | 3.182 | 1.2–2.4 | |
| hypoxanthin | 3.150 ± 0.952 | 1.704 | 5.901 | 2.2–4.1 | |
| neopterin | 2.985 ± 0.641 | 2.015 | 4.464 | 2.3–3.7 | |
Disclaimer/Publisher’s Note: The statements, opinions and data contained in all publications are solely those of the individual author(s) and contributor(s) and not of MDPI and/or the editor(s). MDPI and/or the editor(s) disclaim responsibility for any injury to people or property resulting from any ideas, methods, instructions or products referred to in the content. |
© 2025 by the authors. Licensee MDPI, Basel, Switzerland. This article is an open access article distributed under the terms and conditions of the Creative Commons Attribution (CC BY) license (https://creativecommons.org/licenses/by/4.0/).
Share and Cite
Očenáš, P.; Baloga, M.; Valko-Rokytovská, M.; Ivašková, S. Determination of Biochemical and Metabolomic Characteristics of Sheep Blood Serum and Their Application in Clinical Practice. Life 2025, 15, 1141. https://doi.org/10.3390/life15071141
Očenáš P, Baloga M, Valko-Rokytovská M, Ivašková S. Determination of Biochemical and Metabolomic Characteristics of Sheep Blood Serum and Their Application in Clinical Practice. Life. 2025; 15(7):1141. https://doi.org/10.3390/life15071141
Chicago/Turabian StyleOčenáš, Peter, Matej Baloga, Marcela Valko-Rokytovská, and Sonja Ivašková. 2025. "Determination of Biochemical and Metabolomic Characteristics of Sheep Blood Serum and Their Application in Clinical Practice" Life 15, no. 7: 1141. https://doi.org/10.3390/life15071141
APA StyleOčenáš, P., Baloga, M., Valko-Rokytovská, M., & Ivašková, S. (2025). Determination of Biochemical and Metabolomic Characteristics of Sheep Blood Serum and Their Application in Clinical Practice. Life, 15(7), 1141. https://doi.org/10.3390/life15071141