
Differential Analysis of Hemogram Parameters and Cellular Ratios in Severe Asthma Exacerbations: A Comparative Study of Eosinophilic and Non-Eosinophilic Phenotypes

 ,
,  , ,
, ,
Abstract
1. Introduction
2. Materials and Methods
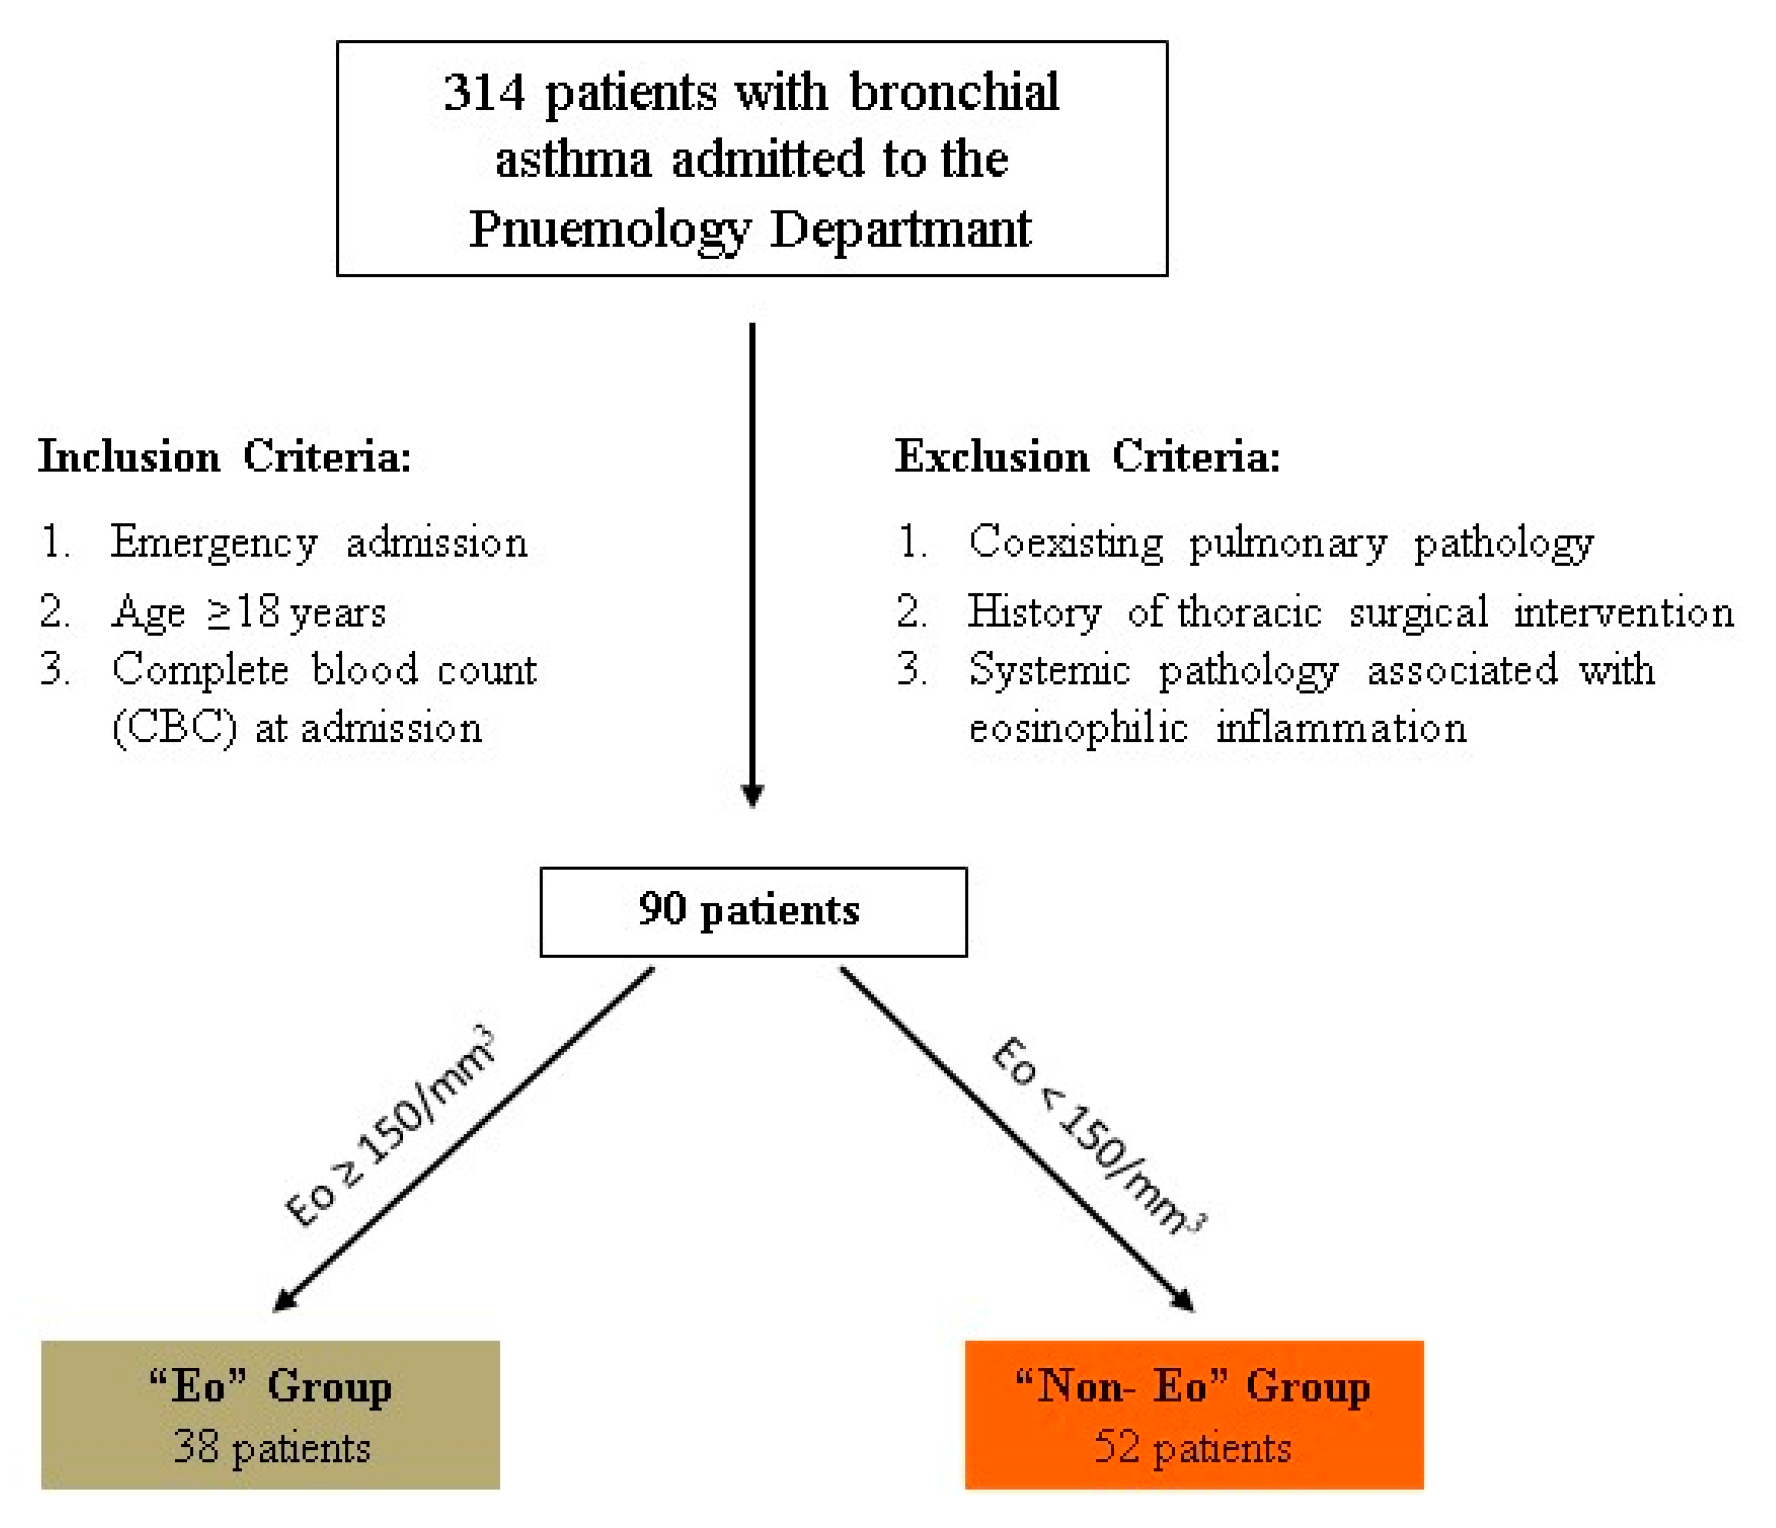
2.1. Study Design
2.2. Sample Collection Procedure
2.3. Inclusion and Exclusion Criteria
2.4. Study Groups
2.5. Statistical Analysis
3. Results
3.1. Study Limitations
3.2. Discussion and Conclusions
Author Contributions
Funding
Institutional Review Board Statement
Informed Consent Statement
Data Availability Statement
Acknowledgments
Conflicts of Interest
Abbreviations
| ACE | Angiotensin-Converting Enzyme |
| ACEIs | Angiotensin-Converting Enzyme Inhibitors |
| AUC | Area Under the Curve |
| BEecf | Base Excess of Extracellular Fluid |
| CBC | Complete Blood Count |
| COPD | Chronic Obstructive Pulmonary Disease |
| cysLTs | Cysteinyl Leukotrienes |
| EBef | Effective Base Excess |
| ELISA | Enzyme-Linked Immunosorbent Assay |
| ELR | Eosinophil-to-Leukocyte Ratio |
| Eo | Eosinophilic Group |
| ExBA | Exacerbated Bronchial Asthma |
| FeNO | Fractional Exhaled Nitric Oxide |
| FEV1 | Forced Expiratory Volume in One Second |
| GINA | Global Initiative for Asthma |
| ICU | Intensive Care Unit |
| IgE | Immunoglobulin E |
| NLR | Neutrophil-to-Lymphocyte Ratio |
| Non-Eo | Non-Eosinophilic Group |
| pCO2 | Partial Pressure of Carbon Dioxide |
| pO2 | Partial Pressure of Oxygen |
| RR | Relative Risk |
| ROC | Receiver Operating Characteristic |
| SD | Standard Deviation |
| T2-high | Type 2 Inflammation High |
| T2-low | Type 2 Inflammation Low |
| TGF-β | Transforming Growth Factor Beta |
| TLR | Thrombocyte-to-Lymphocyte Ratio |
References
- Maslan, J.; Mims, J.W. What is asthma? Pathophysiology, demographics, and health care costs. Otolaryngol. Clin. N. Am. 2014, 47, 13–22. [Google Scholar] [CrossRef] [PubMed]
- Rajvanshi, N.; Kumar, P.; Goyal, J.P. Global Initiative for Asthma Guidelines 2024: An Update. Indian Pediatr. 2024, 61, 781–786. [Google Scholar] [CrossRef] [PubMed]
- Botelho, F.M.; Llop-Guevara, A.; Trimble, N.J.; Nikota, J.K.; Bauer, C.M.; Lambert, K.N.; Kianpour, S.; Jordana, M.; Stämpfli, M.R. Cigarette smoke differentially affects eosinophilia and remodeling in a model of house dust mite asthma. Am. J. Respir. Cell Mol. Biol. 2011, 45, 753–760. [Google Scholar] [CrossRef] [PubMed]
- Ansari, S.F.; Gohil, R.; John, M. Risk factors associated with frequent acute exacerbations of asthma. Cureus 2020, 12, e11090. [Google Scholar] [CrossRef]
- Castillo, J.R.; Peters, S.P.; Busse, W.W. Asthma exacerbations: Pathogenesis, prevention, and treatment. J. Allergy Clin. Immunol. Pract. 2017, 5, 918–927. [Google Scholar] [CrossRef]
- Green, R.H.; Brightling, C.E.; McKenna, S.; Hargadon, B.; Parker, D.; Bradding, P.; Wardlaw, A.J.; Pavord, I.D. Asthma exacerbations and sputum eosinophil counts: A randomised controlled trial. Lancet 2002, 360, 1715–1721. [Google Scholar] [CrossRef]
- Price, D.B.; Rigazio, A.; Campbell, J.D.; Bleecker, E.R.; Corrigan, C.J.; Thomas, M.; Wenzel, S.E.; Wilson, A.M.; Small, M.B.; Gopalan, G.; et al. Blood eosinophil count and prospective annual asthma disease burden: A UK cohort study. Lancet Respir. Med. 2015, 3, 849–858. [Google Scholar] [CrossRef]
- Hasegawa, K.; Craig, S.S.; Teach, S.J.; Camargo, C.A., Jr. Management of asthma exacerbations in the emergency department. J. Allergy Clin. Immunol. Pract. 2021, 9, 2599–2610. [Google Scholar] [CrossRef]
- Ojanguren, I.; Pérez, J.; Sánchez, J.; de Llano, L.P.; del Pozo, V. Phenotyping asthma exacerbations: One step further in the management of severe asthma. J. Investig. Allergol. Clin. Immunol. 2025, 35, 1–11. [Google Scholar] [CrossRef]
- McDowell, P.J.; Busby, J.; Hanratty, C.E.; Djukanovic, R.; Woodcock, A.; Walker, S.; Hardman, T.C.; Arron, J.R.; Choy, D.F.; Bradding, P.; et al. Exacerbation profile and risk factors in a type-2-low enriched severe asthma cohort: A clinical trial to assess asthma exacerbation phenotypes. Am. J. Respir. Crit. Care Med. 2022, 206, 545–553. [Google Scholar] [CrossRef]
- Osman, A.M.; Elsaid, A.M. Airway inflammatory biomarkers in different asthma phenotypes. Egypt. J. Bronchol. 2019, 13, 580–583. [Google Scholar] [CrossRef]
- Bjerregaard, A.; Laing, I.A.; Backer, V.; Fally, M.; Khoo, S.; Chidlow, G.; Sikazwe, C.; Smith, D.W.; Le Souëf, P.; Porsbjerg, C.; et al. Clinical characteristics of eosinophilic asthma exacerbations. Respirology 2017, 22, 295–300. [Google Scholar] [CrossRef] [PubMed]
- Idzko, M.; Pitchford, S.; Page, C. Role of platelets in allergic airway inflammation. J. Allergy Clin. Immunol. 2015, 135, 1416–1423. [Google Scholar] [CrossRef] [PubMed]
- Kemona-Chetnik, I.; Bodzenta-Lukaszyk, A.; Butkiewicz, A.; Dymnicka-Piekarska, V.; Kemona, H. Thrombocytopoiesis in allergic asthma. Pol. Arch. Med. Wewn. 2007, 117, 9–13. [Google Scholar] [CrossRef]
- Zhang, X.Y.; Simpson, J.L.; Powell, H.; Yang, I.; Upham, J.; Reynolds, P.N.; Hodge, S.; James, A.L.; Jenkins, C.; Peters, M.; et al. Full blood count parameters for the detection of asthma inflammatory phenotypes. Clin. Exp. Allergy 2014, 44, 1137–1145. [Google Scholar] [CrossRef]
- Cowburn, A.S.; Sladek, K.; Soja, J.; Adamek, L.; Nizankowska, E.; Szczeklik, A.; Lam, B.K.; Penrose, J.F.; Austen, F.K.; Holgate, S.T.; et al. Overexpression of leukotriene C4 synthase in bronchial biopsies from patients with aspirin-intolerant asthma. J. Clin. Investig. 1998, 101, 834–846. [Google Scholar] [CrossRef]
- Seymour, M.L.; Rak, S.; Aberg, D.; Riise, G.C.; Penrose, J.F.; Kanaoka, Y.; Austen, K.F.; Holgate, S.T.; Sampson, A.P. Leukotriene and prostanoid pathway enzymes in bronchial biopsies of seasonal allergic asthmatics. Am. J. Respir. Crit. Care Med. 2001, 164, 2051–2056. [Google Scholar] [CrossRef]
- Backman, H.; Håkansson, M.; Arvidsson, M.; Stridsman, C.; Jansson, S.A.; Sandström, T.; Lundbäck, B.; Rönmark, E. FEV1 decline in relation to blood eosinophils and neutrophils in a population-based asthma cohort. World Allergy Organ. J. 2020, 13, 100110. [Google Scholar] [CrossRef]
- Denlinger, L.C.; Phillips, B.R.; Ramratnam, S.; Ross, K.; Bhakta, N.R.; Cardet, J.C.; Castro, M.; Peters, S.P.; Phipatanakul, W.; Aujla, S.; et al. Inflammatory and comorbid features of patients with severe asthma and frequent exacerbations. Am. J. Respir. Crit. Care Med. 2017, 195, 302–313. [Google Scholar] [CrossRef]
- Ke, J.; Zhang, Y.; Sun, Z.; Wei, S. Associations of complete blood cell count-derived inflammatory biomarkers with asthma and mortality in adults: A population-based study. Front. Immunol. 2023, 14, 1205687. [Google Scholar] [CrossRef]
- Budin, C.E.; Cocuz, I.G.; Enache, L.S.; Rența, I.A.; Cazacu, C.; Pătrîntașu, D.E.; Olteanu, M.; Râjnoveanu, R.M.; Ianoși, E.S.; Râjnoveanu, A.; et al. Neutrophil-to-lymphocyte and platelet-to-lymphocyte ratio: Side by side with molecular mutations in patients with non-small cell lung cancer—The INOLUNG study. Cancers 2024, 16, 2903. [Google Scholar] [CrossRef] [PubMed]
- Kuikel, S.; Pathak, N.; Poudel, S.; Thapa, S.; Bhattarai, S.L.; Chaudhary, G.; Pandey, K.R. Neutrophil-lymphocyte ratio as a predictor of adverse outcome in patients with community-acquired pneumonia: A systematic review. Health Sci. Rep. 2022, 5, e630. [Google Scholar] [CrossRef] [PubMed]
- Drăgoescu, A.N.; Pădureanu, V.; Stănculescu, A.D.; Chiuțu, L.C.; Tomescu, P.; Geormăneanu, C.; Pădureanu, R.; Iovănescu, V.F.; Ungureanu, B.S.; Pănuș, A.; et al. Neutrophil to lymphocyte ratio (NLR)—A useful tool for the prognosis of sepsis in the ICU. Biomedicines 2021, 10, 75. [Google Scholar] [CrossRef]
- Pătrîntașu, D.E.; Hédi-Katalin, S.; Rența, I.A.; Prădatu, A.M.; Lupușor, E.; Demenciuc, N.; Mărginean, C.; Ianoși, E.S.; Budin, C.E. Value of neutrophil to lymphocyte ratio as a new biomarker in tuberculosis inflammation. Pneumologia 2024, 72, 97–104. [Google Scholar] [CrossRef]
- Olaee, A.; Rezaeetalab, F.; Lotfinejad, N. Comparison of diagnostic values of hematological and inflammatory parameters in predicting COPD exacerbation. Pneumologia 2021, 69, 227–233. [Google Scholar] [CrossRef]
- Alzoubi, O.; Khanfar, A. Association between neutrophil-to-lymphocyte ratio and mortality among community-acquired pneumonia patients: A meta-analysis. Monaldi Arch. Chest Dis. 2021, 92, 2050. [Google Scholar] [CrossRef]
- Ruta, V.M.; Man, A.M.; Alexescu, T.G.; Motoc, N.S.; Tarmure, S.; Ungur, R.A.; Todea, D.A.; Coste, S.C.; Valean, D.; Pop, M.C. Neutrophil-to-lymphocyte ratio and systemic immune-inflammation index-biomarkers in interstitial lung disease. Medicina 2020, 56, 381. [Google Scholar] [CrossRef]
- Forget, P.; Khalifa, C.; Defour, J.P.; Latinne, D.; Van Pel, M.C.; De Kock, M. What is the normal value of the neutrophil-to-lymphocyte ratio? BMC Res. Notes 2017, 10, 12. [Google Scholar] [CrossRef]
- Song, W.-J.; Niimi, A. Angiotensin-converting enzyme inhibitors, asthma, and cough: Relighting the torch. J. Allergy Clin. Immunol. Pract. 2021, 9, 3440–3441. [Google Scholar] [CrossRef]

| Parameter | Normal Range | Eosinophilic Group | Non-Eosinophilic Group | p-Value |
|---|---|---|---|---|
| Leukocytes (cells/mm3) | 4000–11,000 | 9370 (±SD: 2693) | 10,489 (±SD: 5365) | 0.24 |
| Neutrophils (cells/mm3) | 1800–7500 | 5808 (±SD: 2825) | 8526 (±SD: 5099) | 0.0039 |
| Lymphocytes (cells/mm3) | 1000–4800 | 2128 (±SD: 1185) | 1357 (±SD: 645) | 0.0002 |
| Platelets (cells/mm3) | 150–400,000 | 277.7 (±SD: 94) | 273.2 (±SD: 91) | 0.81 |
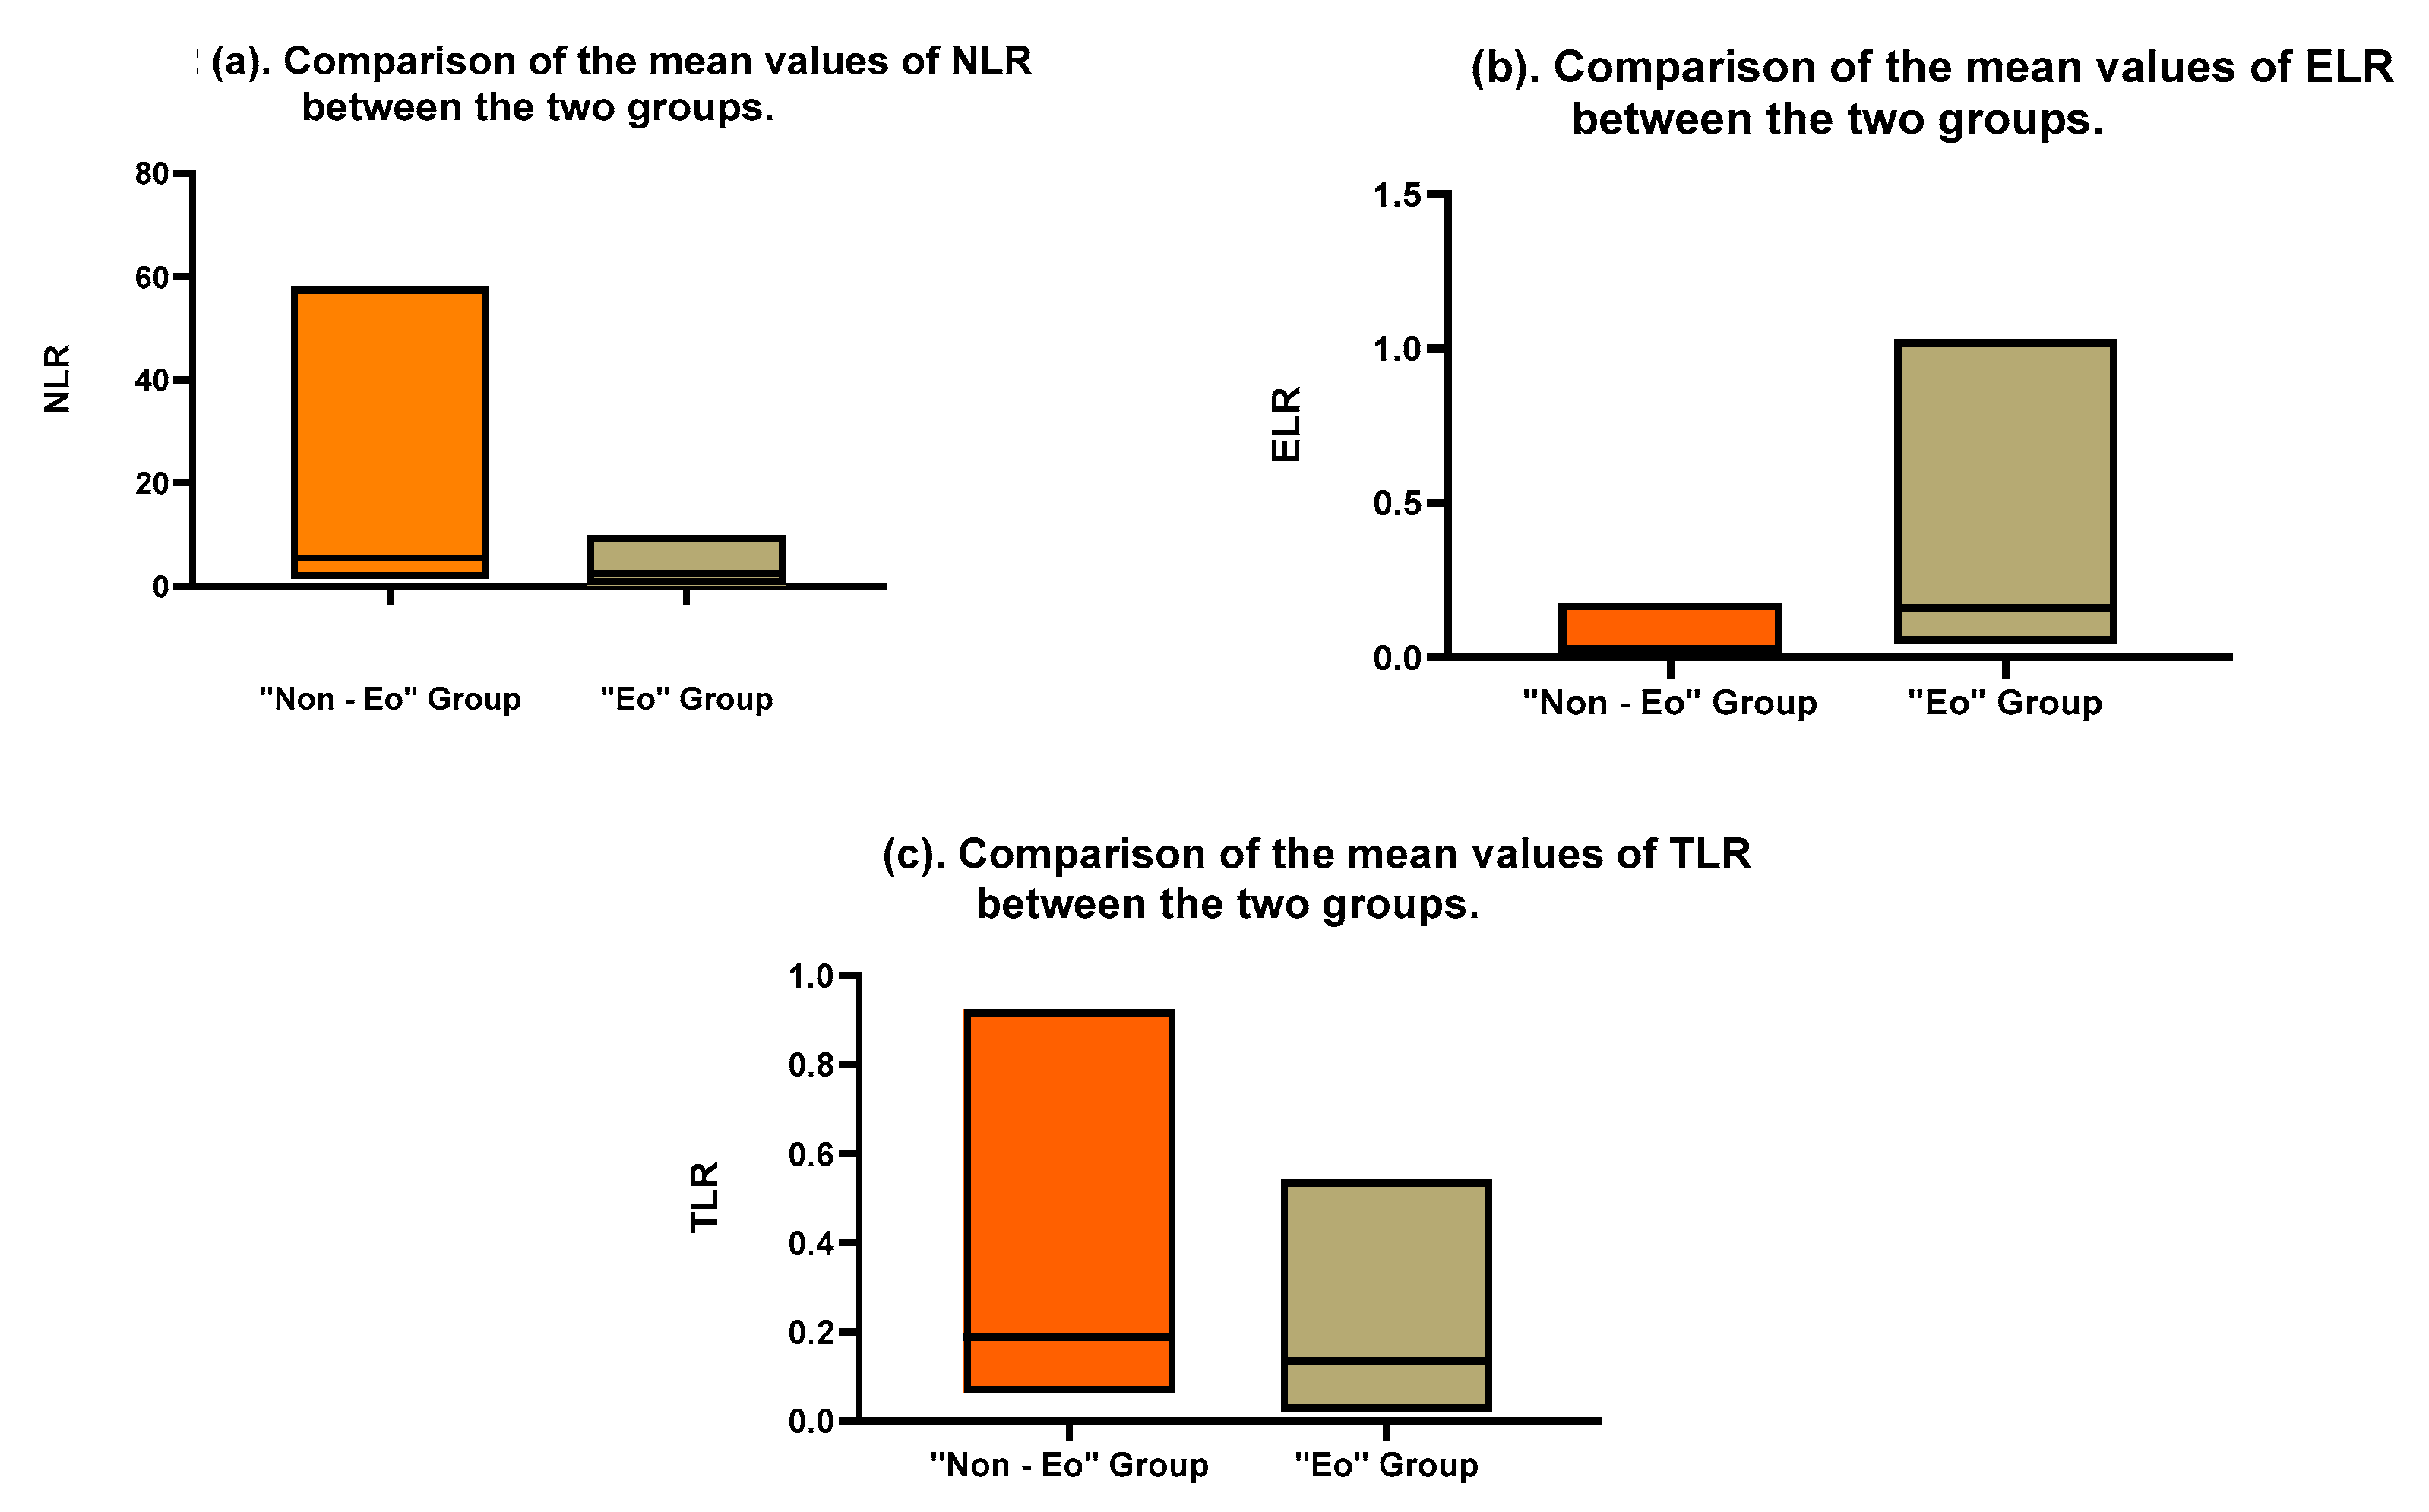
| Neutrophil-to-Lymphocyte Ratio (NLR) | 1.0–3.5 | 3.644 (±SD: 2.71) | 9.823 (±SD: 12.19) | 0.0029 |
| Thrombocyte-to-Lymphocyte Ratio (TLR) | 0.1–0.3 | 0.1698 (±SD: 0.1086) | 0.2742 (±SD: 0.2183) | 0.0081 |
| Eosinophil-to-Leukocyte Ratio (ELR) | 0.01–0.06 | 0.0383 (±SD: 0.0437) | 0.2414 (±SD: 0.2269) | <0.0001 |
| Parameter | Normal Range | Eosinophilic Group | Non-Eosinophilic Group | p-Value |
|---|---|---|---|---|
| pH | 7.35–7.45 | 7.39 (±SD: 0.06) | 7.421 (±SD: 0.09) | 0.42 |
| pCO2 * (mmHg) | 35–45 | 37.98 (±SD: 17.38) | 38.49 (±SD: 21.54) | 0.88 |
| pO2 ** (mmHg) | 75–100 | 82.89 (±SD: 42.23) | 91.18 (±SD: 31.88) | 0.71 |
| HCO3 *** (mEq/L) | 22–26 | 23.98 (±SD: 10.91) | 25.00 (±SD: 12.32) | 0.50 |
| BEecf **** (mEq/L) | −2 to +2 | −0.75 (±SD: 3.98) | 0.075 (±SD: 4.14) | 0.57 |
| Lactate (mg/dL) | 4.5–19.8 | 1.83 (±SD: 1.78) | 2.977 (±SD: 0.61) | 0.24 |
| Parameter | Eosinophilic Group | Non-Eosinophilic Group | p-Value |
|---|---|---|---|
| Age (years) | 63 (±SD: 2) | 63 (±SD: 2) | 0.99 |
| Length of hospital stay (days) | 4.97 (±SD: 1.74) | 4.92 (±SD: 2.63) | 0.91 |
| Length of stay in ICU * (days) | 5/189 (2.64%) | 10/256 (3.90%) | - |
| Reimbursement value (euros) | EUR 556 (±SD: EUR 626) | EUR 571 (±SD: EUR 907) | 0.92 |
| Death (number) | 1/38 (2.53%) | 1/52 (1.92%) | - |
| Parameter | Eosinophilic Group | Non-Eosinophilic Group | Relative Risk (RR) | Confidence Interval (CI) | p-Value |
|---|---|---|---|---|---|
| Gender | F *—23 M **—15 | F—29 M—23 | 1.121 | 0.6808–1.844 | 0.67 |
| Active smoking | Smokers—16 Non-smokers—22 | Smokers—17 Non-smokers—35 | 0.839 | 0.5681–1.239 | 0.384 |
| ACE *** | With ACE—22 Without ACE—15 | With ACE—19 Without ACE—33 | 0.6881 | 0.4691–1.009 | 0.0553 |
| Personal or family history of allergy (atopy) | With personal/family history of atopy—13 Without a personal/family history of atopy—19 | With personal/family history of atopy—8 Without personal/family history of atopy—44 | 2.641 | 1.231–5.663 | 0.0181 |
| Parameter | Eosinophilic Group | Non-Eosinophilic Group | Relative Risk (RR) | Confidence Interval (CI) | p-Value |
|---|---|---|---|---|---|
| Initiation of antibiotic therapy | With ABX—1 Without ABX—37 | With ABX—5 Without ABX—47 | 0.3949 | 0.0333–2.249 | 0.3949 |
| Combined antibiotic therapy | No—25 Yes—12 | No—27 Yes—20 | 1.176 | 0.8436–1.640 | 0.3739 |
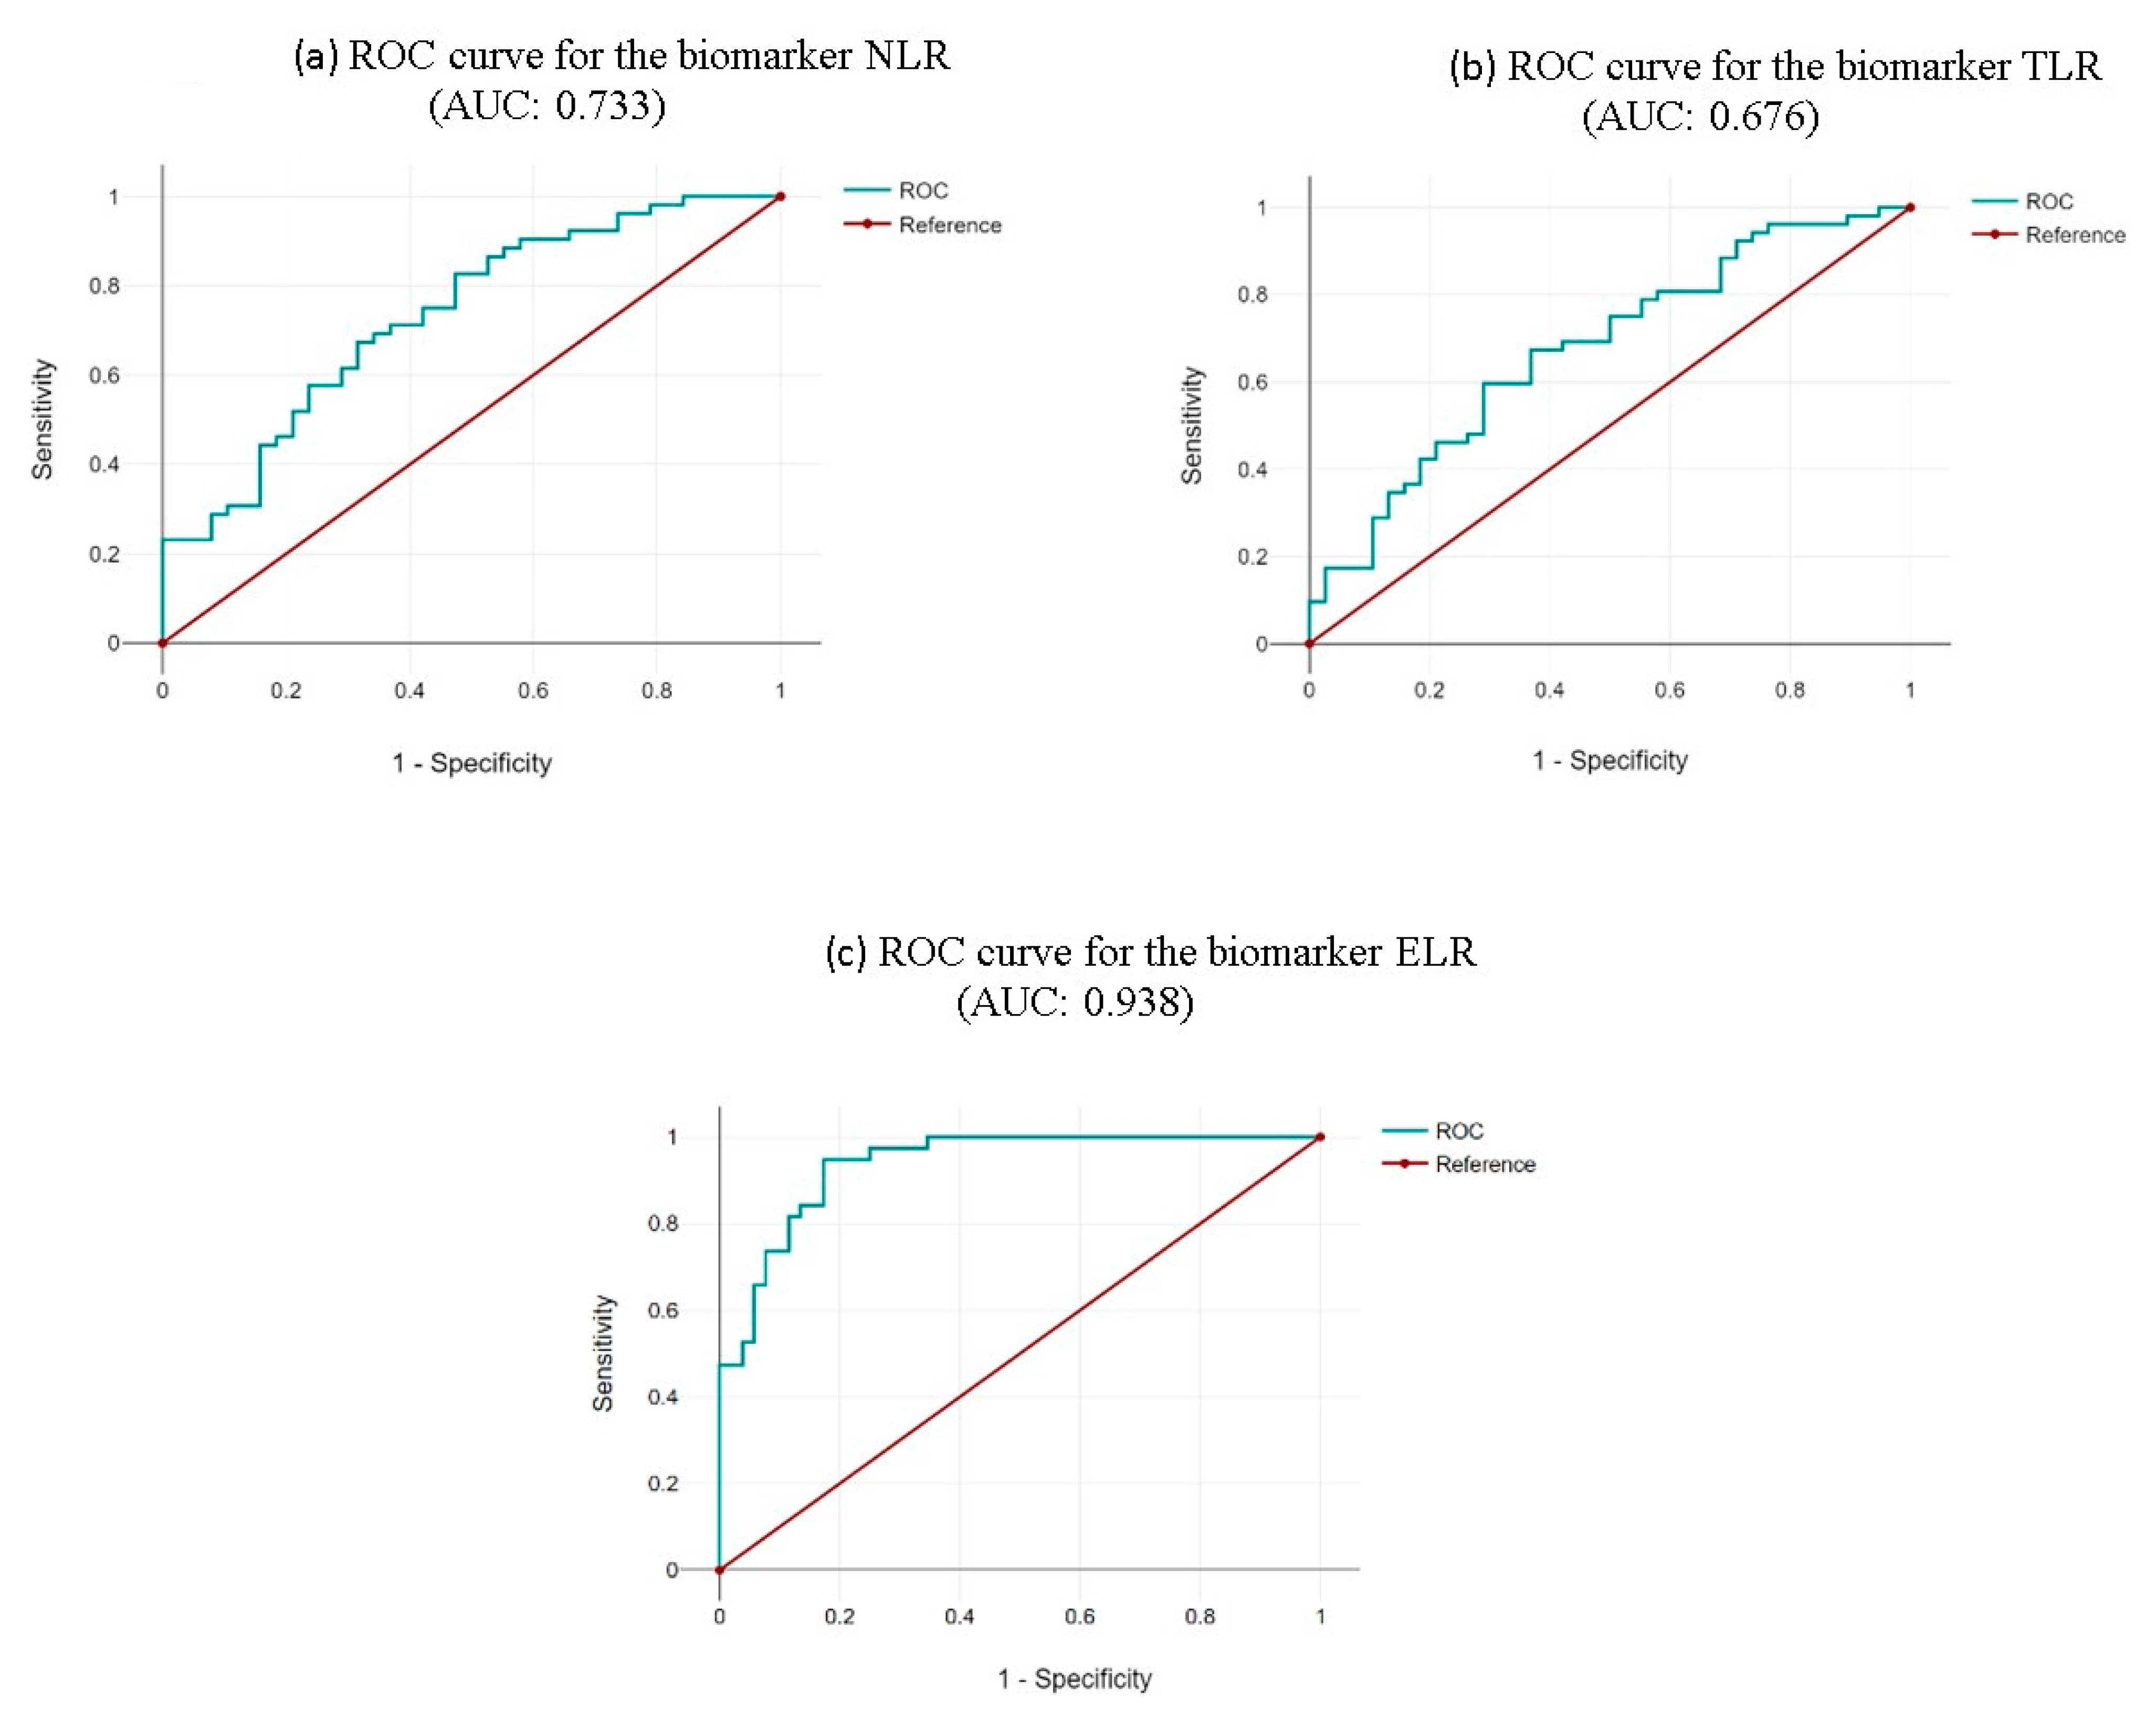
| Neutrophil-to-Lymphocyte Ratio (NLR) | Thrombocyte-to-Lymphocyte Ratio (TLR) | Eosinophil-to-Leukocyte Ratio (ELR) |
|---|---|---|
|
|
|
Disclaimer/Publisher’s Note: The statements, opinions and data contained in all publications are solely those of the individual author(s) and contributor(s) and not of MDPI and/or the editor(s). MDPI and/or the editor(s) disclaim responsibility for any injury to people or property resulting from any ideas, methods, instructions or products referred to in the content. |
© 2025 by the authors. Licensee MDPI, Basel, Switzerland. This article is an open access article distributed under the terms and conditions of the Creative Commons Attribution (CC BY) license (https://creativecommons.org/licenses/by/4.0/).
Share and Cite
Demenciuc, N.; Budin, C.E.; Ureche, C.; Stoian, M.; Nicola-Varo, T.; Baba, D.-F.; Pătrîntașu, D.-E.; Deleanu, D. Differential Analysis of Hemogram Parameters and Cellular Ratios in Severe Asthma Exacerbations: A Comparative Study of Eosinophilic and Non-Eosinophilic Phenotypes. Life 2025, 15, 970. https://doi.org/10.3390/life15060970
Demenciuc N, Budin CE, Ureche C, Stoian M, Nicola-Varo T, Baba D-F, Pătrîntașu D-E, Deleanu D. Differential Analysis of Hemogram Parameters and Cellular Ratios in Severe Asthma Exacerbations: A Comparative Study of Eosinophilic and Non-Eosinophilic Phenotypes. Life. 2025; 15(6):970. https://doi.org/10.3390/life15060970
Chicago/Turabian StyleDemenciuc, Nicolae, Corina Eugenia Budin, Corina Ureche, Mircea Stoian, Teodora Nicola-Varo, Dragos-Florin Baba, Dariana-Elena Pătrîntașu, and Diana Deleanu. 2025. "Differential Analysis of Hemogram Parameters and Cellular Ratios in Severe Asthma Exacerbations: A Comparative Study of Eosinophilic and Non-Eosinophilic Phenotypes" Life 15, no. 6: 970. https://doi.org/10.3390/life15060970
APA StyleDemenciuc, N., Budin, C. E., Ureche, C., Stoian, M., Nicola-Varo, T., Baba, D.-F., Pătrîntașu, D.-E., & Deleanu, D. (2025). Differential Analysis of Hemogram Parameters and Cellular Ratios in Severe Asthma Exacerbations: A Comparative Study of Eosinophilic and Non-Eosinophilic Phenotypes. Life, 15(6), 970. https://doi.org/10.3390/life15060970