
Geographical Association of Bird Species Richness with All-Cause and Cause-Specific Mortality Rates of Local Residents: An Ecological Study in China

 ,
, 

Abstract
1. Introduction
2. Materials and Methods
2.1. Study Design
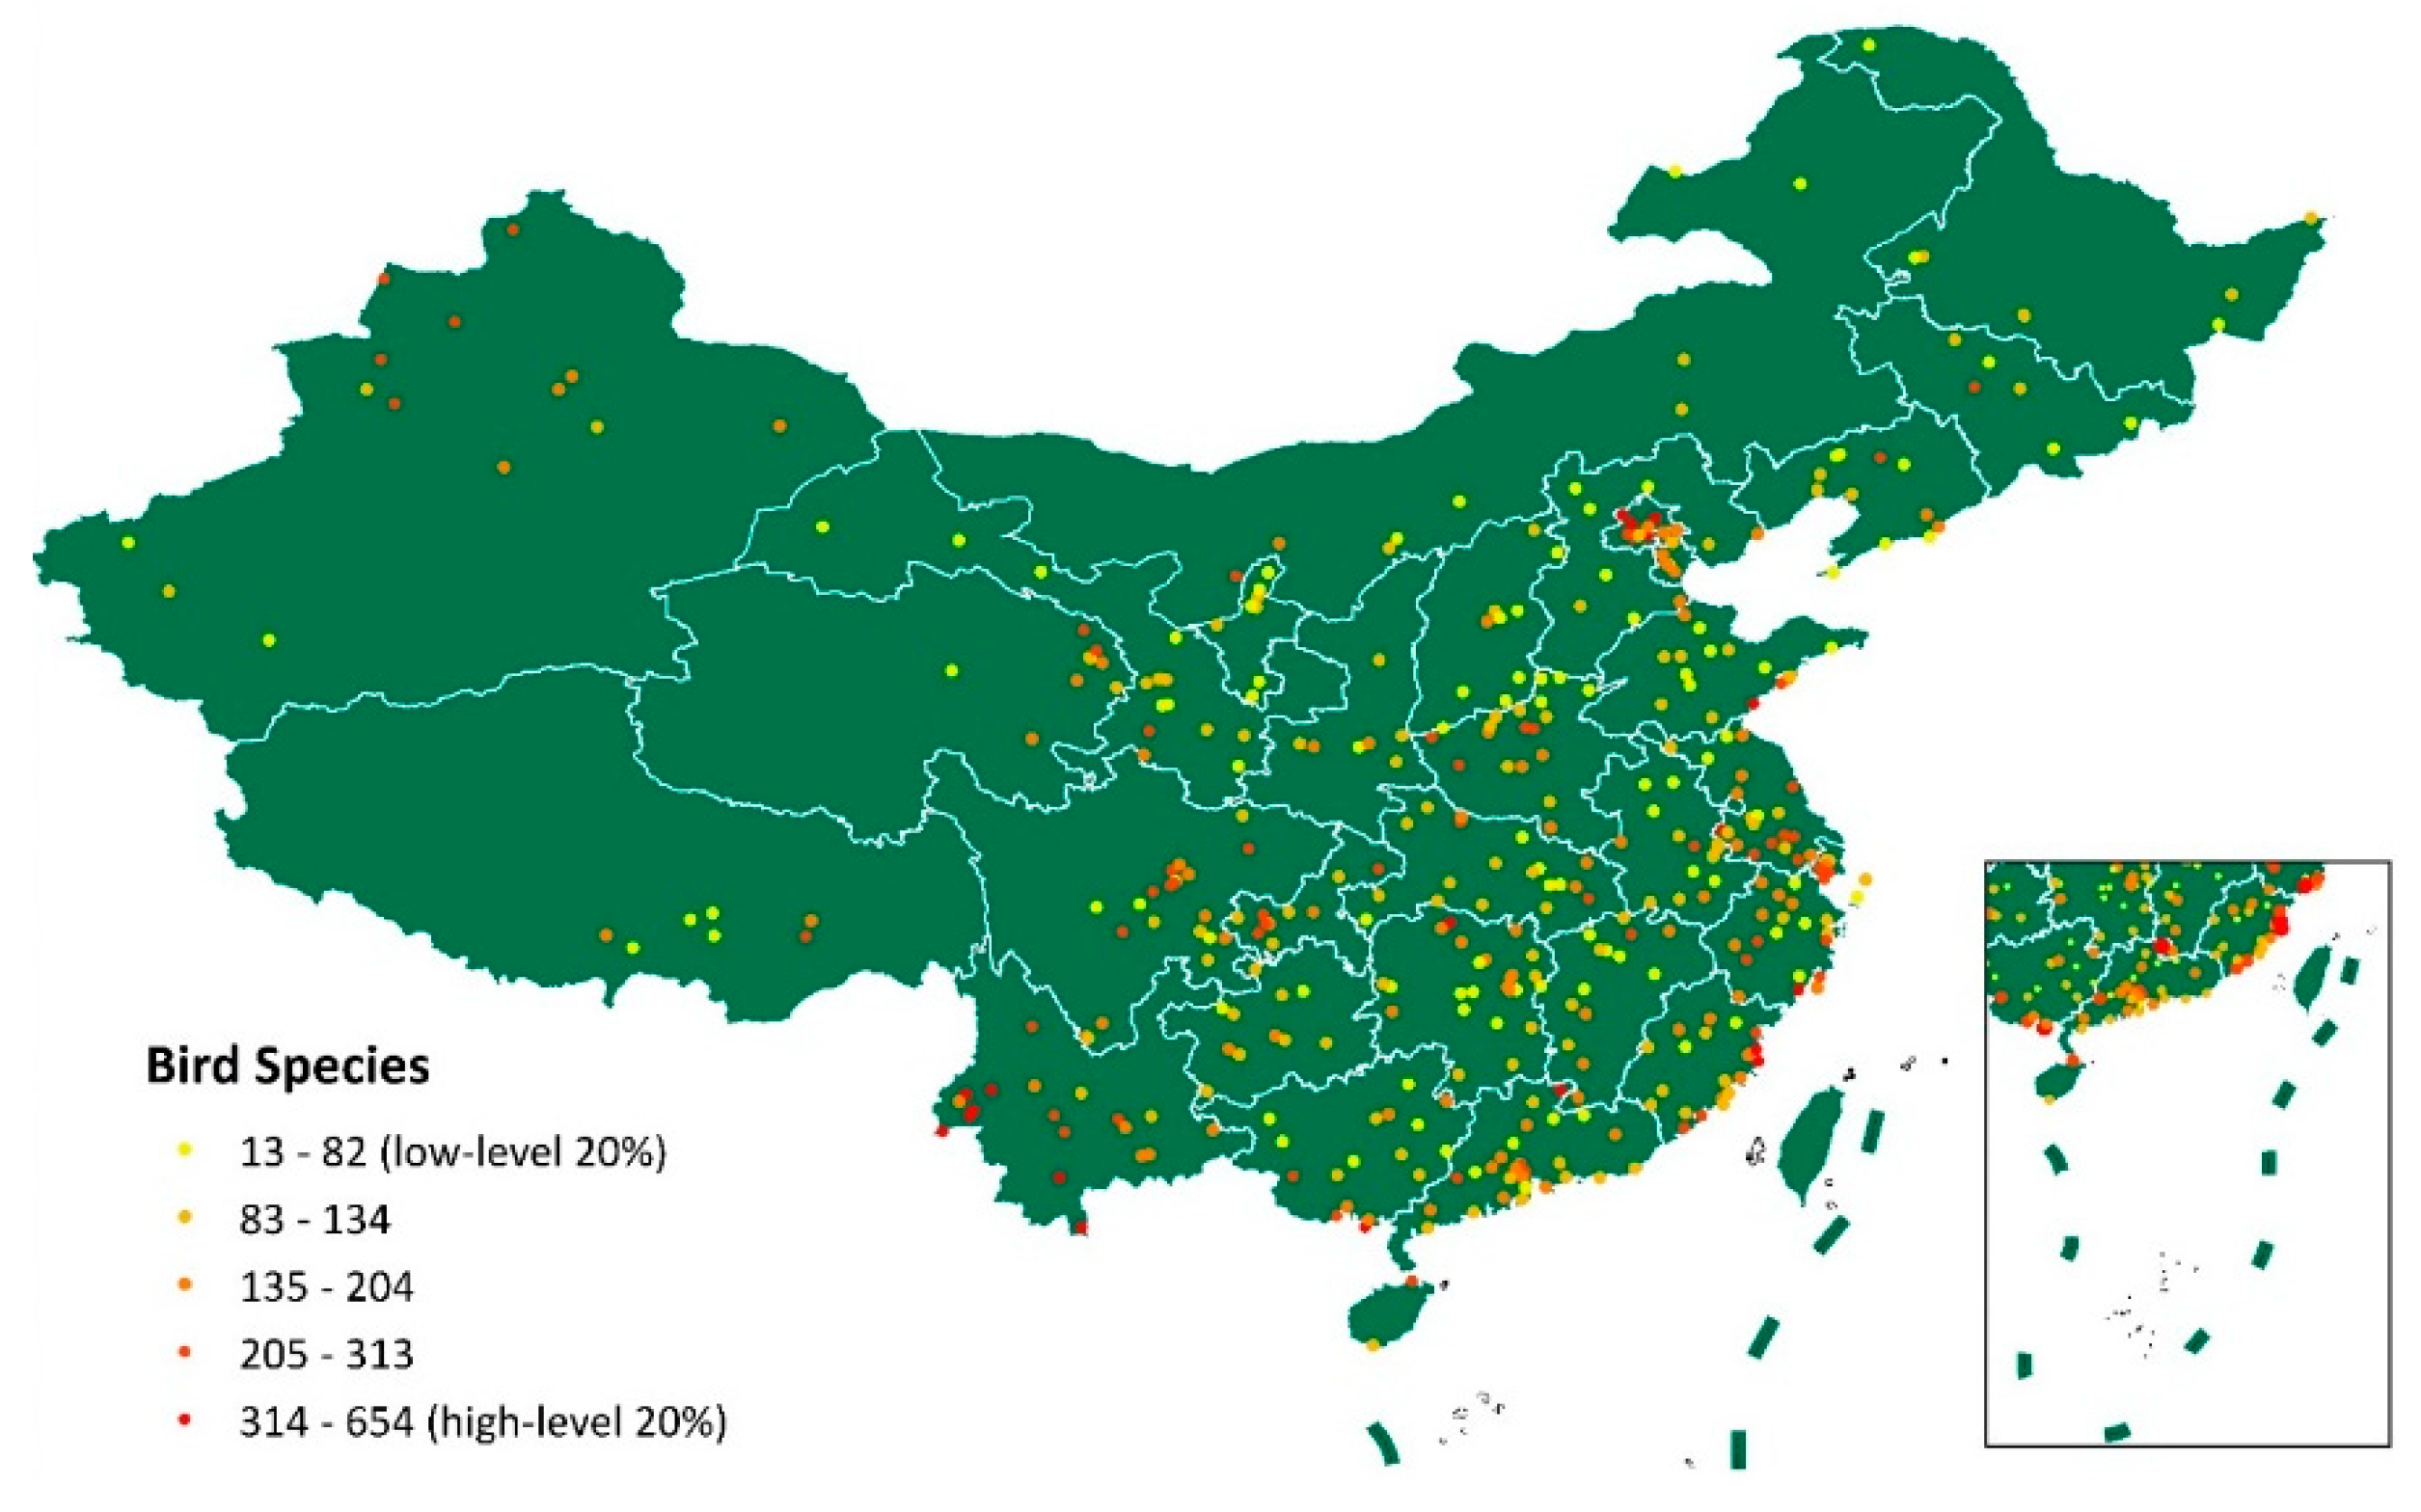
2.2. Measurement of Biodiversity
2.3. Measurement of Population Health
2.4. Covariates
2.5. Mapping of Datasets
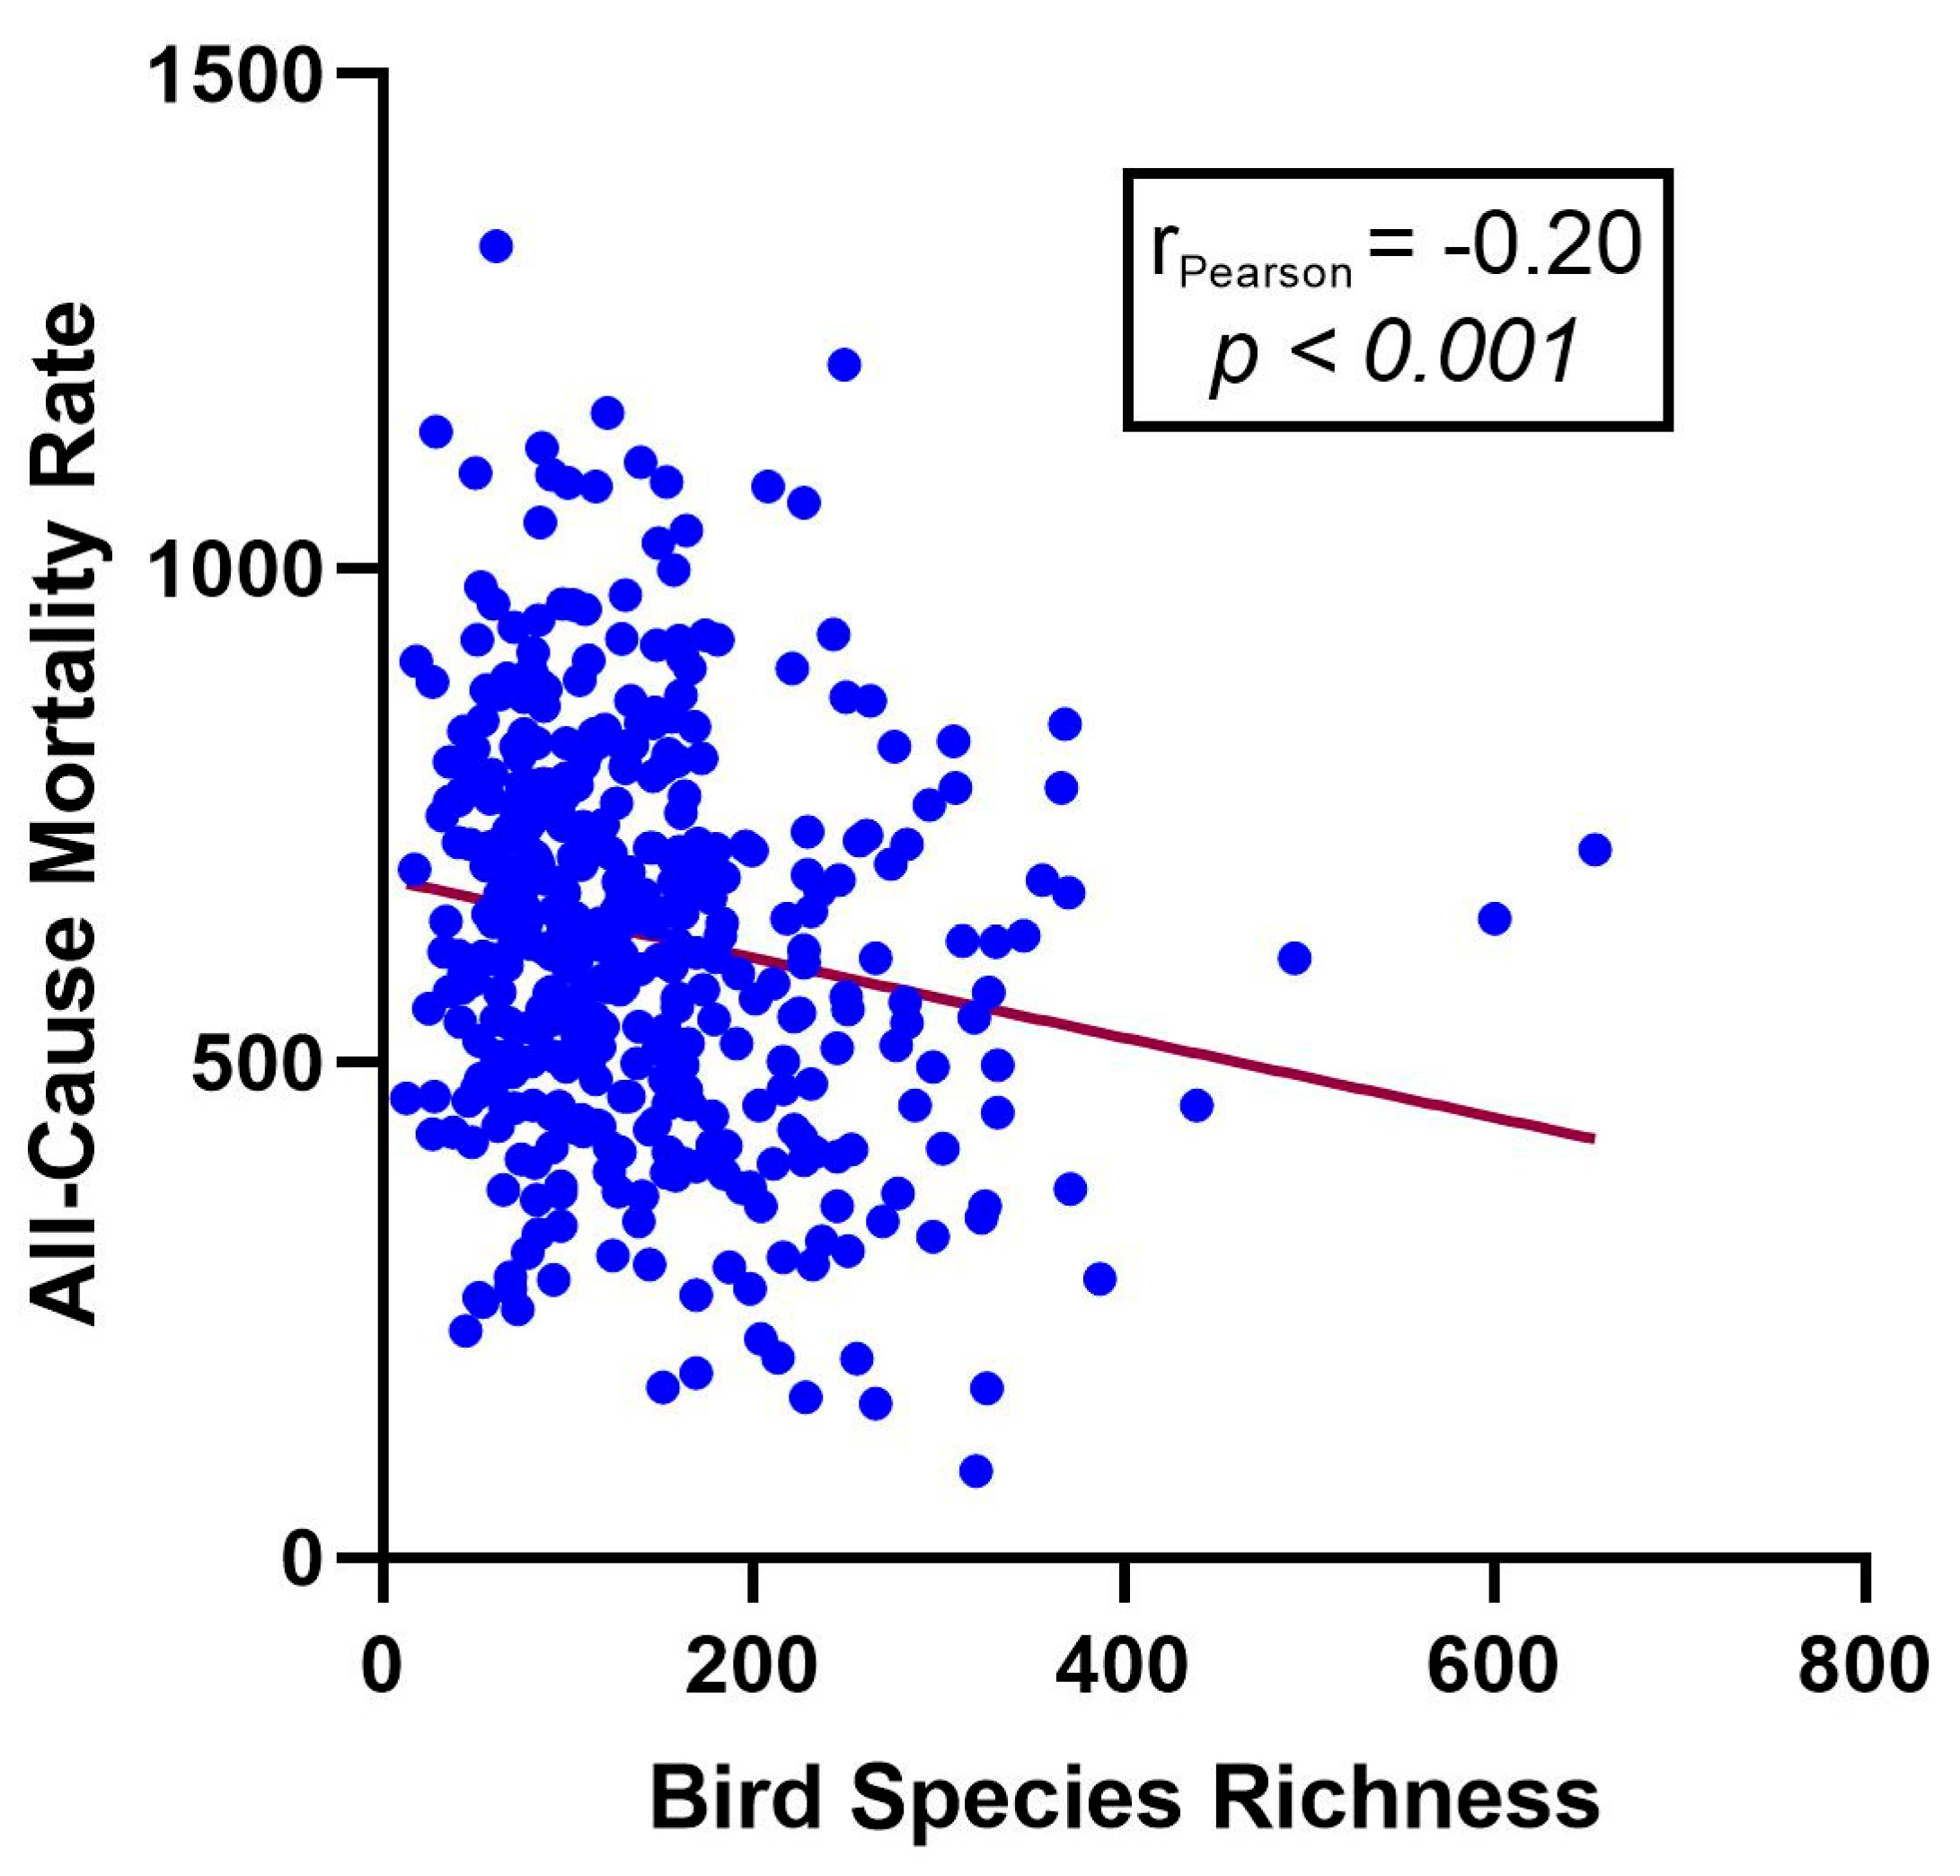
2.6. Statistical Analysis
3. Results
4. Discussion
5. Conclusions
Supplementary Materials
Author Contributions
Funding
Institutional Review Board Statement
Informed Consent Statement
Data Availability Statement
Conflicts of Interest
References
- Turner, W.R.; Brandon, K.; Brooks, T.M.; Costanza, R.; Da Fonseca, G.A.B.; Portela, R. Global Conservation of Biodiversity and Ecosystem Services. BioScience 2007, 57, 868–873. [Google Scholar] [CrossRef]
- Alho, C.J.R. The Value of Biodiversity. Braz. J. Biol. 2008, 68, 1115–1118. [Google Scholar] [CrossRef] [PubMed]
- Pattberg, P.; Bäckstrand, K. Enhancing the Achievement of the SDGs: Lessons Learned at the Half-Way Point of the 2030 Agenda. Int. Environ. Agreem. 2023, 23, 107–114. [Google Scholar] [CrossRef]
- Guidance on integrating biodiversity considerations into one health approaches. In Proceedings of the Twenty-First Meeting of the Subsidiary Body on Scientific, Technical and Technological Advice, Montreal, QC, Canada, 11–14 December 2017.
- Horefti, E. The Importance of the One Health Concept in Combating Zoonoses. Pathogens 2023, 12, 977. [Google Scholar] [CrossRef]
- van Bruggen, A.H.C.; Goss, E.M.; Havelaar, A.; van Diepeningen, A.D.; Finckh, M.R.; Morris, J.G. One Health—Cycling of Diverse Microbial Communities as a Connecting Force for Soil, Plant, Animal, Human and Ecosystem Health. Sci. Total Environ. 2019, 664, 927–937. [Google Scholar] [CrossRef]
- Corvalan, C.; Hales, S.; McMichael, A.J. Ecosystems and Human Well-Being: Health Synthesis; World Health Organization: Geneva, Switzerland, 2005. [Google Scholar]
- Marselle, M.R.; Hartig, T.; Cox, D.T.C.; de Bell, S.; Knapp, S.; Lindley, S.; Triguero-Mas, M.; Böhning-Gaese, K.; Braubach, M.; Cook, P.A.; et al. Pathways Linking Biodiversity to Human Health: A Conceptual Framework. Environ. Int. 2021, 150, 106420. [Google Scholar] [CrossRef] [PubMed]
- Carrus, G.; Scopelliti, M.; Lafortezza, R.; Colangelo, G.; Ferrini, F.; Salbitano, F.; Agrimi, M.; Portoghesi, L.; Semenzato, P.; Sanesi, G. Go Greener, Feel Better? The Positive Effects of Biodiversity on the Well-Being of Individuals Visiting Urban and Peri-Urban Green Areas. Landsc. Urban Plan. 2015, 134, 221–228. [Google Scholar] [CrossRef]
- Dallimer, M.; Irvine, K.N.; Skinner, A.M.J.; Davies, Z.G.; Rouquette, J.R.; Maltby, L.L.; Warren, P.H.; Armsworth, P.R.; Gaston, K.J. Biodiversity and the Feel-Good Factor: Understanding Associations between Self-Reported Human Well-Being and Species Richness. BioScience 2012, 62, 47–55. [Google Scholar] [CrossRef]
- Cox, D.T.C.; Shanahan, D.F.; Hudson, H.L.; Plummer, K.E.; Siriwardena, G.M.; Fuller, R.A.; Anderson, K.; Hancock, S.; Gaston, K.J. Doses of Neighborhood Nature: The Benefits for Mental Health of Living with Nature. BioScience 2017, 67, 147–155. [Google Scholar] [CrossRef]
- Fuller, R.A.; Irvine, K.N.; Devine-Wright, P.; Warren, P.H.; Gaston, K.J. Psychological Benefits of Greenspace Increase with Biodiversity. Biol. Lett. 2007, 3, 390–394. [Google Scholar] [CrossRef]
- Aerts, R.; Honnay, O.; Van Nieuwenhuyse, A. Biodiversity and Human Health: Mechanisms and Evidence of the Positive Health Effects of Diversity in Nature and Green Spaces. Br. Med. Bull. 2018, 127, 5–22. [Google Scholar] [CrossRef] [PubMed]
- Lõhmus, M.; Balbus, J. Making Green Infrastructure Healthier Infrastructure. Infect. Ecol. Epidemiol. 2015, 5, 30082. [Google Scholar] [CrossRef] [PubMed]
- Campbell, D.N. The Maoist Legacy and Environmental Implementation in China: The Case of Xiamen’s Yun Dang Lake. Asian Surv. 1997, 37, 859–875. [Google Scholar] [CrossRef]
- Wang, B.; McBeath, J. Contrasting Approaches to Biodiversity Conservation: China as Compared to the United States. Environ. Dev. 2017, 23, 65–71. [Google Scholar] [CrossRef]
- Che-Castaldo, J.P.; Grow, S.A.; Faust, L.J. Evaluating the Contribution of North American Zoos and Aquariums to Endangered Species Recovery. Sci. Rep. 2018, 8, 9789. [Google Scholar] [CrossRef]
- Xie, Y.; Gan, X.; Yang, W. Strengthening the Legal Basis for Designating and Managing Protected Areas in China. J. Int. Wildl. Law Policy 2014, 17, 115–129. [Google Scholar] [CrossRef]
- Hughes, A.C.; Grumbine, R.E. The Kunming-Montreal Global Biodiversity Framework: What It Does and Does Not Do, and How to Improve It. Front. Environ. Sci. 2023, 11. [Google Scholar] [CrossRef]
- Chen, Y.; Zhao, P.; Xu, Q.; Qu, B.; Li, D.; Clement, S.; Li, L. Relating Biodiversity with Health Disparities of Human Population: An Ecological Study across the United States. One Health 2023, 16, 100548. [Google Scholar] [CrossRef]
- Eglington, S.M.; Noble, D.G.; Fuller, R.J. A Meta-Analysis of Spatial Relationships in Species Richness across Taxa: Birds as Indicators of Wider Biodiversity in Temperate Regions. J. Nat. Conserv. 2012, 20, 301–309. [Google Scholar] [CrossRef]
- Sekercioglu, C.H. Increasing Awareness of Avian Ecological Function. Trends Ecol. Evol. 2006, 21, 464–471. [Google Scholar] [CrossRef]
- Ding, Y.; Xiong, L.; Ji, F.; Lu, J.; Zhu, X.; Huang, H. Using Citizen Science Data to Improve Regional Bird Species List: A Case Study in Shaanxi, China. Avian Res. 2022, 13, 100045. [Google Scholar] [CrossRef]
- Li, L.; Hu, R.; Huang, J.; Bürgi, M.; Zhu, Z.; Zhong, J.; Lü, Z. A Farmland Biodiversity Strategy Is Needed for China. Nat. Ecol. Evol. 2020, 4, 772–774. [Google Scholar] [CrossRef]
- Chen, R.; Yin, P.; Meng, X.; Liu, C.; Wang, L.; Xu, X.; Ross, J.A.; Tse, L.A.; Zhao, Z.; Kan, H.; et al. Fine Particulate Air Pollution and Daily Mortality. A Nationwide Analysis in 272 Chinese Cities. Am. J. Respir. Crit. Care Med. 2017, 196, 73–81. [Google Scholar] [CrossRef] [PubMed]
- Liu, S.; Wu, X.; Lopez, A.D.; Wang, L.; Cai, Y.; Page, A.; Yin, P.; Liu, Y.; Li, Y.; Liu, J.; et al. An Integrated National Mortality Surveillance System for Death Registration and Mortality Surveillance, China. Bull. World Health Organ. 2016, 94, 46–57. [Google Scholar] [CrossRef] [PubMed]
- Xu, Q.; Qu, B.; Li, L.; Chen, Y. Geographical Association of Biodiversity with Cancer and Cardiovascular Mortality Rates: Analysis of 39 Distinct Conditions. Front. Public Health 2024, 12, 1368017. [Google Scholar] [CrossRef]
- Karesh, W.B.; Dobson, A.; Lloyd-Smith, J.O.; Lubroth, J.; Dixon, M.A.; Bennett, M.; Aldrich, S.; Harrington, T.; Formenty, P.; Loh, E.H.; et al. Ecology of Zoonoses: Natural and Unnatural Histories. Lancet 2012, 380, 1936–1945. [Google Scholar] [CrossRef] [PubMed]
- Roth, G.A.; Dwyer-Lindgren, L.; Bertozzi-Villa, A.; Stubbs, R.W.; Morozoff, C.; Naghavi, M.; Mokdad, A.H.; Murray, C.J.L. Trends and Patterns of Geographic Variation in Cardiovascular Mortality Among US Counties, 1980-2014. JAMA 2017, 317, 1976–1992. [Google Scholar] [CrossRef]
- Barton, M.G.; Henderson, I.; Border, J.A.; Siriwardena, G. A Review of the Impacts of Air Pollution on Terrestrial Birds. Sci. Total Environ. 2023, 873, 162136. [Google Scholar] [CrossRef]
- Eeva, T.; Belskii, E.; Kuranov, B. Environmental Pollution Affects Genetic Diversity in Wild Bird Populations. Mutat. Res./Genet. Toxicol. Environ. Mutagen. 2006, 608, 8–15. [Google Scholar] [CrossRef]
- Francis, E.A. Paramount Roles of Wild Birds as Bioindicators of Contamination. IJAWB 2017, 2, 194–199. [Google Scholar] [CrossRef]
- Sanderfoot, O.V.; Holloway, T. Air Pollution Impacts on Avian Species via Inhalation Exposure and Associated Outcomes. Environ. Res. Lett. 2017, 12, 083002. [Google Scholar] [CrossRef]
- Sonne, C.; Alstrup, A.K.O.; Therkildsen, O.R. A Review of the Factors Causing Paralysis in Wild Birds: Implications for the Paralytic Syndrome Observed in the Baltic Sea. Sci. Total Environ. 2012, 416, 32–39. [Google Scholar] [CrossRef] [PubMed]
- Wilson, A.A.; Ditmer, M.A.; Barber, J.R.; Carter, N.H.; Miller, E.T.; Tyrrell, L.P.; Francis, C.D. Artificial Night Light and Anthropogenic Noise Interact to Influence Bird Abundance over a Continental Scale. Glob. Change Biol. 2021, 27, 3987–4004. [Google Scholar] [CrossRef]
- Parsa, N. Environmental Factors Inducing Human Cancers. Iran. J. Public Health 2012, 41, 1–9. [Google Scholar] [PubMed]
- Koual, M.; Tomkiewicz, C.; Cano-Sancho, G.; Antignac, J.-P.; Bats, A.-S.; Coumoul, X. Environmental Chemicals, Breast Cancer Progression and Drug Resistance. Environ. Health 2020, 19, 117. [Google Scholar] [CrossRef]
- Hill, W.; Lim, E.L.; Weeden, C.E.; Lee, C.; Augustine, M.; Chen, K.; Kuan, F.-C.; Marongiu, F.; Evans, E.J.; Moore, D.A.; et al. Lung Adenocarcinoma Promotion by Air Pollutants. Nature 2023, 616, 159–167. [Google Scholar] [CrossRef]
- Miller, K.A.; Siscovick, D.S.; Sheppard, L.; Shepherd, K.; Sullivan, J.H.; Anderson, G.L.; Kaufman, J.D. Long-Term Exposure to Air Pollution and Incidence of Cardiovascular Events in Women. N. Engl. J. Med. 2007, 356, 447–458. [Google Scholar] [CrossRef]
- Izah, S.C.; Iyiola, A.O.; Yarkwan, B.; Richard, G. Chapter 7–Impact of Air Quality as a Component of Climate Change on Biodiversity-Based Ecosystem Services. In Visualization Techniques for Climate Change with Machine Learning and Artificial Intelligence; Srivastav, A., Dubey, A., Kumar, A., Kumar Narang, S., Ali Khan, M., Eds.; Elsevier: Amsterdam, The Netherlands, 2023; pp. 123–148. ISBN 978-0-323-99714-0. [Google Scholar]
- Gregory, R.D.; van Strien, A. Wild Bird Indicators: Using Composite Population Trends of Birds as Measures of Environmental Health. Ornithol. Sci. 2010, 9, 3–22. [Google Scholar] [CrossRef]
- Methorst, J.; Bonn, A.; Marselle, M.; Böhning-Gaese, K.; Rehdanz, K. Species Richness Is Positively Related to Mental Health—A Study for Germany. Landsc. Urban Plan. 2021, 211, 104084. [Google Scholar] [CrossRef]
- Buxton, R.T.; Pearson, A.L.; Lin, H.-Y.; Sanciangco, J.C.; Bennett, J.R. Exploring the Relationship between Bird Diversity and Anxiety and Mood Disorder Hospitalisation Rates. Geo Geogr. Environ. 2023, 10, e00127. [Google Scholar] [CrossRef]
- Wheeler, B.W.; Lovell, R.; Higgins, S.L.; White, M.P.; Alcock, I.; Osborne, N.J.; Husk, K.; Sabel, C.E.; Depledge, M.H. Beyond Greenspace: An Ecological Study of Population General Health and Indicators of Natural Environment Type and Quality. Int. J. Health Geogr. 2015, 14, 17. [Google Scholar] [CrossRef] [PubMed]
- Luck, G.W.; Davidson, P.; Boxall, D.; Smallbone, L. Relations between Urban Bird and Plant Communities and Human Well-Being and Connection to Nature. Conserv. Biol. 2011, 25, 816–826. [Google Scholar] [CrossRef] [PubMed]
- Gascon, M.; Triguero-Mas, M.; Martínez, D.; Dadvand, P.; Rojas-Rueda, D.; Plasència, A.; Nieuwenhuijsen, M.J. Residential Green Spaces and Mortality: A Systematic Review. Environ. Int. 2016, 86, 60–67. [Google Scholar] [CrossRef] [PubMed]

| Variable | Number (%) or Median (IQR) | Mean (SD) |
|---|---|---|
| Biodiversity | ||
| Bird species richness | 119.50 (79.00, 177.50) | 140.72 (87.37) |
| Human health | ||
| All-cause mortality rate, per 100,000 population | 628.54 (483.34, 767.24) | 632.93 (215.32) |
| Population demographics | ||
| Population density, person/ | 417.59 (162.46, 979.41) | 1702.06 (4175.29) |
| Male distribution of deaths, % | 57.43% (56.30%, 57.81%) | 57.61 (1.99) |
| Age distribution of deaths, % | ||
| 0–9 years | 0.44% (0.27%, 0.73%) | 0.63% (0.76%) |
| 10–19 years | 0.33% (0.22%, 0.51%) | 0.42% (0.35%) |
| 20–29 years | 0.53% (0.36%, 0.79%) | 0.65% (0.92%) |
| 30–39 years | 1.43% (1.06%, 1.92%) | 1.64% (0.92%) |
| 40–49 years | 3.57% (2.82%, 4.53%) | 3.92% (1.69%) |
| 50–59 years | 10.04% (8.72%, 11.58%) | 10.27% (2.42%) |
| 60–69 years | 15.86% (14.21%, 17.95%) | 16.31% (3.19%) |
| 70–79 years | 25.32% (23.06%, 28.10%) | 25.58% (3.59%) |
| 80 years and over | 41.20% (35.65%, 45.89%) | 40.59% (8.26%) |
| Socio-economics | ||
| Administrative region land area, | 1523 (664, 2673) | 2877.00 (6925.01) |
| Per capita GDP, CNY | 71,435 (40,326.56, 108,067.10) | 88,415.67 (74,554) |
| Primary industry, % | 10.11% (3.52%, 18.51%) | 12.16% (10.41%) |
| Secondary industry, % | 36.85% (26.49%, 46.70%) | 36.75% (14.58%) |
| Tertiary industry, % | 48.53% (42.04%, 59.08%) | 50.53% (15.04%) |
| Urbanization rate, % | 60.27% (47.17%, 83.04%) | 64.74% (22.15%) |
| Education and healthcare service | ||
| Number of beds, per 1000 population | 5.57 (4.6, 7.27) | 6.23 (2.98) |
| Length of education, years | 9.19 (8.63, 10.45) | 9.51 (1.26) |
| All-Cause Mortality Rate, per 100,000 Population (Outcome Variable) | ||||||
|---|---|---|---|---|---|---|
| Exposure Variable | Separate Univariate Models | Multivariate Model | ||||
| Regression Coefficient (95% Confidence Interval) | p-Value | R2 | Regression Coefficient (95% Confidence Interval) | p-Value | R2 | |
| Biodiversity | ||||||
| Bird species richness | −0.4462 (−0.6977, −0.1947) | 0.001 | 0.033 | −0.1967 (−0.3763, −0.0173) | 0.032 | 0.356 |
| Population characteristics | ||||||
| Age ≥ 65 (%) | 1.8689 (−1.5017, 5.2394) | 0.276 | 0.003 | 7.3490 (3.6895, 11.0085) | <0.001 | |
| Male (%) | −13.8474 (−24.1776, −3.5173) | 0.009 | 0.017 | −9.3523 (−18.4885, −0.2161) | 0.045 | |
| Population density (per km2) | −0.0028 (−0.0078, 0.0021) | 0.263 | 0.003 | 0.0113 (0.0060, 0.0167) | <0.001 | |
| Socio-economics | ||||||
| Per capita GDP (CNY) | −0.0011 (−0.0013, −0.0008) | <0.001 | 0.152 | −0.0007 (−0.0010, −0.0004) | <0.001 | |
| Primary industry (%) | 7.4521 (5.8875, 9.3168) | <0.001 | 0.130 | 4.6799 (1.9361, 7.4236) | 0.001 | |
| Secondary industry (%) | −0.1424 (−1.5685, 1.2846) | 0.845 | <0.001 | 2.0686 (0.6538, 3.4833) | 0.004 | |
| Tertiary industry (%) | −2.9600 (−4.3166, −1.6095) | <0.001 | 0.043 | −0.4589 (−1.8335, 0.9156) | 0.512 | |
| Urbanization rate (%) | −4.0583 (−4.9118, −3.2047) | <0.001 | 0.174 | −3.0276 (−5.3016, −0.7537) | 0.009 | |
| Education and healthcare service | ||||||
| Number of beds (per 1000 persons) | −10.1644 (−17.0946, −3.2342) | 0.004 | 0.020 | 3.5006 (−2.3015, 9.3027) | 0.236 | |
| Length of education (years) | −62.7881 (−78.1801, −47.3960) | <0.001 | 0.134 | −11.3529 (−40.6368, 17.9310) | 0.446 | |
| Cause of Death | Bird Species Richness (Exposure Variable) | |||||
|---|---|---|---|---|---|---|
| Univariate Analyses (Unadjusted) | Multivariate Analyses (Adjusted) | |||||
| Regression Coefficient (95% Confidence Interval) | p-Value | Regression Coefficient (95% Confidence Interval) | p-Value | |||
| Infectious diseases, maternal and infant diseases, and nutritional deficiencies | ||||||
| Infectious diseases | −0.0051 (−0.01203, 0.0017) | 0.007 | 0.142 | −0.0030 (−0.0093, 0.0032) | 0.340 | |
| HIV/AIDS, sexually transmitted diseases, and tuberculosis | −0.0016 (−0.0062, 0.0030) | 0.002 | 0.487 | −0.0008 (−0.0050, 0.0037) | 0.716 | |
| Hepatitis | −0.0043 (−0.0071, −0.0015) | 0.020 | 0.003 | −0.0030 (−0.0058, −0.0003) | 0.028 | |
| Respiratory infection | −0.0002 (−0.0035, 0.0031) | <0.001 | 0.905 | 0.0002 (−0.0032, 0.0036) | 0.908 | |
| Nutritional deficiencies | 0.0041 (−0.0022, 0.0104) | 0.007 | 0.199 | 0.0051 (−0.0018, 0.0120) | 0.150 | |
| Parasitic diseases | −0.0003 (−0.0010, 0.0004) | 0.002 | 0.382 | −0.0003 (−0.0010, 0.0004) | 0.398 | |
| Pregnancy, childbirth, and postnatal complications | −0.0001 (−0.0002, 0.0000) | 0.004 | 0.146 | −0.0001 (−0.0002, 0.0006) | 0.309 | |
| Chronic non-communicable diseases | ||||||
| Cardiovascular diseases | −0.3112 (−0.4543, −0.1682) | 0.055 | <0.001 | −0.2107 (−0.3152, −0.1062) | <0.001 | |
| Cerebrovascular disease | −0.1410 (−0.2161, −0.0659) | 0.043 | <0.001 | −0.0871 (−0.1398, −0.0344) | 0.001 | |
| Ischemic heart disease | −0.1705 (−0.2366, −0.1044) | 0.060 | <0.001 | −0.1395 (−0.1973, −0.0816) | <0.001 | |
| Hypertension | 0.0046 (−0.0100, 0.0192) | 0.001 | 0.535 | 0.0132 (−0.0009, 0.0273) | 0.067 | |
| Rheumatic heart disease | −0.0014 (−0.0054, 0.0026) | 0.001 | 0.492 | 0.0014 (−0.0027, 0.0055) | 0.501 | |
| Cardiomyopathy | −0.0004 (−0.0000, 0.0008) | 0.005 | 0.051 | 0.0004 (−0.0000, 0.0009) | 0.054 | |
| Cancers | −0.1031 (−0.1628, −0.0434) | 0.022 | 0.001 | −0.0573 (−0.1134, −0.0012) | 0.045 | |
| Lung cancer | −0.0352 (−0.0545, −0.0158) | 0.021 | <0.001 | −0.0215 (−0.0415, −0.0014) | 0.036 | |
| Colorectal cancer | −0.0008 (−0.0070, 0.0053) | 0.0001 | 0.788 | 0.0019 (−0.0038, 0.0077) | 0.516 | |
| Lymphoma and multiple myeloma | 0.0008 (−0.0013, 0.0029) | 0.001 | 0.437 | 0.0013 (−0.0006, 0.0032) | 0.174 | |
| Leukemia | −0.0020 (−0.0035, −0.0005) | 0.012 | 0.011 | −0.0012 (−0.0026, 0.0001) | 0.084 | |
| Prostate cancer | −0.0006 (−0.0019, 0.0007) | 0.002 | 0.371 | −0.0003 (−0.0016, 0.0010) | 0.635 | |
| Ovarian cancer | −0.0004 (−0.0014, 0.0006) | 0.003 | 0.432 | −0.0003 (−0.0012, 0.0007) | 0.592 | |
| Stomach cancer | −0.0031 (−0.0065, 0.0003) | 0.004 | 0.071 | −0.0033 (−0.0067, 0.0002) | 0.064 | |
| Endometrial cancer | −0.0008 (−0.0016, 0.0001) | 0.008 | 0.065 | −0.0004 (−0.0011, 0.0004) | 0.318 | |
| Liver cancer | −0.0025 (−0.0047, −0.0003) | 0.008 | 0.028 | −0.0018 (−0.0039, 0.0004) | 0.104 | |
| Mammary cancer | −0.0002 (−0.0005, 0.0011) | 0.001 | 0.570 | 0.0006 (−0.0001, 0.0014) | 0.107 | |
| Esophageal cancer | −0.0001 (−0.0015, 0.0013) | 0.001 | 0.907 | 0.0003 (−0.0013, 0.0019) | 0.711 | |
| Skin cancer | −0.0003 (−0.0008, 0.0003) | 0.001 | 0.353 | 0.0001 (−0.0005, 0.0007) | 0.785 | |
| Pancreatic cancer | −0.0084 (−0.0196, 0.0027) | 0.006 | 0.137 | −0.0011 (−0.0119, 0.0097) | 0.837 | |
| Cervical cancer | −0.0008 (−0.0015, −0.0001) | 0.0115 | 0.023 | −0.0006 (−0.0012, −0.0001) | 0.084 | |
| Bladder cancer | −0.0007 (−0.0014, 0.0001) | 0.010 | 0.068 | −0.0007 (−0.0015, 0.0001) | 0.090 | |
| Respiratory diseases | −0.0034 (−0.0375, 0.0305) | 0.0001 | 0.842 | 0.0197 (−0.0125, 0.0518) | 0.230 | |
| Chronic obstructive pulmonary disease | −0.0070 (−0.0383, 0.0243) | 0.0004 | 0.660 | 0.0147 (−0.0149, 0.0443) | 0.331 | |
| Asthma | 0.0015 (−0.0002, 0.0032) | 0.008 | 0.088 | 0.0019 (0.0001, 0.0037) | 0.038 | |
| Endocrine nutritional metabolic diseases | −0.0084 (−0.0196, 0.0027) | 0.006 | 0.137 | −0.0011 (−0.0119, 0.0097) | 0.837 | |
| Diabetes | −0.0127 (−0.0211, −0.0045) | 0.018 | 0.001 | −0.0065 (−0.0145, 0.0015) | 0.109 | |
| Digestive disorders | 0.0008 (−0.0087, 0.0102) | 0.001 | 0.872 | 0.0078 (−0.0005, 0.0161) | 0.067 | |
| Neurological and mental disorders | 0.0056 (0.0011, 0.0122) | 0.005 | 0.025 | 0.0079 (0.0007, 0.0151) | 0.030 | |
| Dementia | 0.0031 (−0.0016, 0.0077) | 0.003 | 0.196 | 0.0040 (−0.0009, 0.0089) | 0.112 | |
| Epilepsy | 0.0001 (−0.0009, 0.0009) | <0.001 | 0.953 | 0.0003 (−0.0005, 0.0011) | 0.426 | |
| Schizophrenic | 0.0003 (−0.0006, 0.0010) | 0.003 | 0.332 | 0.0006 (−0.0001, 0.0012) | 0.065 | |
| Unipolar mental depression | −0.0002 (−0.0003, 0.0001) | 0.005 | 0.069 | −0.0002 (−0.0003, 0.0001) | 0.072 | |
| Bipolar disorder | 0.0001 (−0.0000, 0.0001) | 0.001 | 0.495 | 0.0001 (−0.0005, 0.0001) | 0.436 | |
| Urogenital diseases | −0.0004 (−0.0057, 0.0048) | 0.0001 | 0.867 | 0.0038 (−0.0002, 0.0077) | 0.065 | |
| Musculoskeletal and connective tissue disorders | 0.0018 (−0.0003, 0.0039) | 0.006 | 0.100 | 0.0028 (0.0007, 0.0048) | 0.010 | |
| Hematopoietic diseases | −0.0001 (−0.0015, 0.0013) | 0.0001 | 0.907 | 0.0003 (−0.0013, 0.0019) | 0.711 | |
| Congenital anomalies | 0.0002 (−0.0006, 0.0011) | 0.001 | 0.570 | 0.0006 (−0.0001, 0.0014) | 0.107 | |
| Sensory diseases | 0.0001 (−0.0001, 0.0001) | 0.001 | 0.625 | −0.0001 (−0.0000, 0.0001) | 0.318 | |
| Oral diseases | −0.0001 (−0.0001, 0.0000) | 0.005 | 0.146 | −0.0001 (−0.0001, 0.0000) | 0.192 | |
| Injuries | ||||||
| Accidents | 0.0026 (−0.0154, 0.0207) | 0.0002 | 0.775 | 0.0181 (0.0026, 0.0335) | 0.022 | |
| Traffic accidents | −0.0087 (−0.0158, −0.0017) | 0.014 | 0.016 | −0.0052 (−0.0114,0.0011) | 0.107 | |
| Accidental falls | 0.0071 (−0.0009, 0.0152) | 0.005 | 0.082 | 0.0137 (0.0059,0.0216) | 0.001 | |
| Accidental poisoning | 0.0008 (−0.0027, 0.0042) | 0.001 | 0.665 | 0.0024 (−0.0005,0.0054) | 0.108 | |
| Fire | −0.00001 (−0.0007,0.0006) | 0.000 | 0.961 | 0.0001 (−0.0005,0.0008) | 0.684 | |
| Unintentional injuries | 0.0012 (−0.0038, 0.0063) | 0.004 | 0.632 | 0.0039 (−0.0011, 0.0089) | 0.122 | |
| Suicide and sequelae | 0.0013 (−0.0037, 0.0062) | 0.001 | 0.609 | 0.0036 (−0.0011, 0.0088) | 0.123 | |
| Homicide and sequelae | −0.0001 (−0.0004, 0.0003) | 0.0002 | 0.754 | 0.0001 (−0.0003, 0.0004) | 0.796 | |
| Cause of Death | Bird Species Richness (Exposure Variable) | ||||
|---|---|---|---|---|---|
| Adjusted Analyses in Females | Adjusted Analyses in Males | ||||
| Regression Coefficient (95% Confidence Interval) | p-Value | Regression Coefficient (95% Confidence Interval) | p-Value | ||
| Infectious diseases, maternal and infant diseases, and nutritional deficiencies | |||||
| Infectious diseases | −0.0017 (−0.0066, 0.0032) | 0.493 | −0.0063 (−0.0167, 0.0040) | 0.229 | |
| HIV/AIDS, STDs, and tuberculosis | −0.0011 (−0.0043, 0.0021) | 0.496 | −0.0018 (−0.0086, 0.0049) | 0.595 | |
| Hepatitis | −0.0018 (−0.0416, −0.0005) | 0.129 | −0.0052 (−0.0094, −0.0010) | 0.016 | |
| Respiratory infection | −0.0004 (−0.0038, 0.0029) | 0.792 | 0.0001 (−0.0043, 0.0044) | 0.982 | |
| Nutritional deficiencies | 0.0052 (−0.0025, 0.0134) | 0.182 | 0.0043 (−0.0018, 0.0105) | 0.167 | |
| Parasitic diseases | −0.0004 (−0.0012, 0.0005) | 0.385 | −0.0003 (−0.0011, 0.0004) | 0.389 | |
| Pregnancy, childbirth, and postnatal complications | −0.0002 (−0.0004, 0.0001) | 0.239 | - | - | |
| Chronic non-communicable diseases | |||||
| Cardiovascular diseases | −0.2048 (−0.3068, −0.1027) | <0.001 | −0.2756 (−0.4037, −0.1475) | <0.001 | |
| Cerebrovascular disease | −0.0818 (−0.1308, −0.0328) | 0.001 | −0.1207 (−0.1866, −0.0548) | <0.001 | |
| Ischemic heart disease | −0.1354 (−0.1935, −0.0774) | <0.001 | −0.1698 (−0.2391, −0.1006) | <0.001 | |
| Hypertension | 0.0139 (−0.0033, 0.0310) | 0.241 | 0.0122 (−0.0019, 0.0264) | 0.090 | |
| Rheumatic heart disease | 0.0021 (−0.0026, 0.0069) | 0.379 | 0.0010 (−0.0330, 0.0053) | 0.653 | |
| Cardiomyopathy | 0.0002 (−0.0006, 0.0010) | 0.591 | 0.0006 (−0.0000, 0.0012) | 0.065 | |
| Cancers | −0.0518 (−0.0993, −0.0043) | 0.033 | −0.0865 (−0.1630, −0.0107) | 0.027 | |
| Lung cancer | −0.0172 (−0.0325, −0.0020) | 0.027 | −0.0328 (−0.0621, −0.0035) | 0.028 | |
| Colorectal cancer | −0.0009 (−0.0067, 0.0048) | 0.748 | 0.0033 (−0.0046, 0.0113) | 0.406 | |
| Lymphoma and multiple myeloma | 0.0017 (−0.0002, 0.0036) | 0.075 | 0.0008 (−0.0017, 0.0033) | 0.536 | |
| Leukemia | −0.0010 (−0.0026, 0.0007) | 0.243 | −0.0020 (−0.0039, −0.0001) | 0.043 | |
| Prostate cancer | - | - | −0.0010 (−0.0035, 0.0016) | 0.462 | |
| Ovarian cancer | −0.0011 (−0.0032, 0.0012) | 0.371 | - | - | |
| Stomach cancer | −0.0024 (−0.0047, −0.0001) | 0.045 | −0.0049 (−0.0100, 0.0006) | 0.061 | |
| Endometrial cancer | −0.0009 (−0.0027, 0.0008) | 0.303 | - | - | |
| Liver cancer | −0.0013 (−0.0027, −0.0001) | 0.074 | −0.0027 (−0.0059, 0.0004) | 0.090 | |
| Mammary cancer | 0.0005 (−0.0006, 0.0015) | 0.385 | 0.0006 (−0.0004, 0.0017) | 0.248 | |
| Esophageal cancer | −0.0003 (−0.0022, 0.0015) | 0.724 | 0.0005 (−0.0014, 0.0024) | 0.606 | |
| Skin cancer | 0.0002 (−0.0010, 0.0015) | 0.712 | 0.0003 (−0.0009, 0.0015) | 0.630 | |
| Pancreatic cancer | −0.0008 (−0.0130, 0.0113) | 0.890 | −0.0054 (−0.0167, 0.0059) | 0.346 | |
| Cervical cancer | −0.0013 (−0.0027, −0.0001) | 0.045 | - | - | |
| Bladder cancer | −0.0003 (−0.0007, 0.0000) | 0.079 | −0.0012 (−0.0027, 0.0025) | 0.105 | |
| Respiratory diseases | 0.0080 (−0.0219, 0.0379) | 0.599 | 0.0243 (−0.0148, 0.0635) | 0.223 | |
| Chronic obstructive pulmonary disease | 0.0080 (−0.0193, 0.0353) | 0.567 | 0.0192 (−0.0164, 0.0548) | 0.289 | |
| Asthma | 0.0010 (−0.0006, 0.0028) | 0.216 | 0.0027 (0.0004, 0.0050) | 0.021 | |
| Endocrine nutritional metabolic diseases | −0.0009 (−0.0130, 0.0113) | 0.890 | −0.0054 (−0.0167, 0.0059) | 0.346 | |
| Diabetes | −0.0068 (−0.0160, 0.0024) | 0.149 | −0.0099 (−0.0187, −0.0011) | 0.027 | |
| Digestive disorders | 0.0005 (−0.0072, 0.0083) | 0.895 | 0.0120 (0.0001, 0.0240) | 0.048 | |
| Neurological and mental disorders | 0.0100 (0.0014, 0.0187) | 0.023 | 0.0070 (−0.0001, 0.0142) | 0.054 | |
| Dementia | 0.0054 (−0.0008, 0.0117) | 0.088 | 0.0025 (−0.0019, 0.0069) | 0.261 | |
| Epilepsy | 0.0010 (−0.0011, 0.0032) | 0.345 | 0.0001 (−0.0012, 0.0013) | 0.910 | |
| Schizophrenic | 0.0004 (−0.0004, 0.0013) | 0.320 | 0.0006 (−0.0001, 0.0013) | 0.096 | |
| Unipolar mental depression | −0.0002 (−0.0005, −0.001) | 0.263 | −0.0002 (−0.0004, 0.0001) | 0.069 | |
| Bipolar disorder | 0.0001 (−00001, 0.0001) | 0.820 | 0.0001 (−0.0001, 0.0002) | 0.425 | |
| Urogenital diseases | 0.0019 (−0.0026, 0.0063) | 0.407 | 0.0054 (0.0003, 0.0105) | 0.036 | |
| Musculoskeletal and connective tissue disorders | 0.0028 (0.0003, 0.0053) | 0.027 | 0.0023 (0.0001, 0.0045) | 0.038 | |
| Hematopoietic diseases | −0.0003 (−0.0022, 0.0015) | 0.724 | 0.0005 (−0.0014, 0.0024) | 0.606 | |
| Congenital anomalies | 0.0005 (−0.0006, 0.0015) | 0.385 | 0.0006 (−0.0004, 0.0017) | 0.248 | |
| Sensory diseases | −0.0003 (−0.0001, 0.0000) | 0.296 | 0.0002 (−0.0001, 0.0029) | 0.180 | |
| Oral diseases | 0.0001 (−0.0001, 0.0001) | 0.240 | −0.0002 (−0.0003, −0.0001) | 0.037 | |
| Injuries | |||||
| Accidents | 0.0138 (0.0014, 0.0262) | 0.029 | 0.0194 (−0.0018, 0.0410) | 0.072 | |
| Traffic accidents | −0.0029 (−0.0070, 0.0011) | 0.153 | −0.0095 (−0.0189, −0.0001) | 0.048 | |
| Accidental falls | 0.0116 (0.0043, 0.0189) | 0.002 | 0.0161 (0.0059, 0.0262) | 0.002 | |
| Accidental poisoning | 0.0005 (−0.0012, 0.0021) | 0.568 | 0.0042 (−0.0009, 0.0093) | 0.106 | |
| Fire | 0.0014 (−0.0005,0.0008) | 0.664 | 0.0019 (−0.0010,0.0014) | 0.756 | |
| Unintentional injuries | 0.0030 (−0.0023, 0.0084) | 0.265 | 0.0039 (−0.0021, 0.0098) | 0.202 | |
| Suicide and sequelae | 0.0029 (−0.0024, 0.0008) | 0.287 | 0.0029 (−0.0029, 0.0087) | 0.325 | |
| Homicide and sequelae | −0.0003 (−0.0011, 0.0005) | 0.490 | 0.0002 (−0.0007, 0.0011) | 0.612 | |
Disclaimer/Publisher’s Note: The statements, opinions and data contained in all publications are solely those of the individual author(s) and contributor(s) and not of MDPI and/or the editor(s). MDPI and/or the editor(s) disclaim responsibility for any injury to people or property resulting from any ideas, methods, instructions or products referred to in the content. |
© 2025 by the authors. Licensee MDPI, Basel, Switzerland. This article is an open access article distributed under the terms and conditions of the Creative Commons Attribution (CC BY) license (https://creativecommons.org/licenses/by/4.0/).
Share and Cite
Zhang, N.; You, J.; Xu, Q.; Cai, J.; Jordan, K.P.; Li, L.; Yu, T.; Chen, Y. Geographical Association of Bird Species Richness with All-Cause and Cause-Specific Mortality Rates of Local Residents: An Ecological Study in China. Life 2025, 15, 875. https://doi.org/10.3390/life15060875
Zhang N, You J, Xu Q, Cai J, Jordan KP, Li L, Yu T, Chen Y. Geographical Association of Bird Species Richness with All-Cause and Cause-Specific Mortality Rates of Local Residents: An Ecological Study in China. Life. 2025; 15(6):875. https://doi.org/10.3390/life15060875
Chicago/Turabian StyleZhang, Ning, Jinling You, Qiaochu Xu, Jiacheng Cai, Kelvin P. Jordan, Li Li, Tanchun Yu, and Ying Chen. 2025. "Geographical Association of Bird Species Richness with All-Cause and Cause-Specific Mortality Rates of Local Residents: An Ecological Study in China" Life 15, no. 6: 875. https://doi.org/10.3390/life15060875
APA StyleZhang, N., You, J., Xu, Q., Cai, J., Jordan, K. P., Li, L., Yu, T., & Chen, Y. (2025). Geographical Association of Bird Species Richness with All-Cause and Cause-Specific Mortality Rates of Local Residents: An Ecological Study in China. Life, 15(6), 875. https://doi.org/10.3390/life15060875