
Impact of Neuromuscular Fatigue on Dynamic Knee Valgus in Female Basketball Players


Abstract
1. Introduction
2. Materials and Methods
2.1. Participants
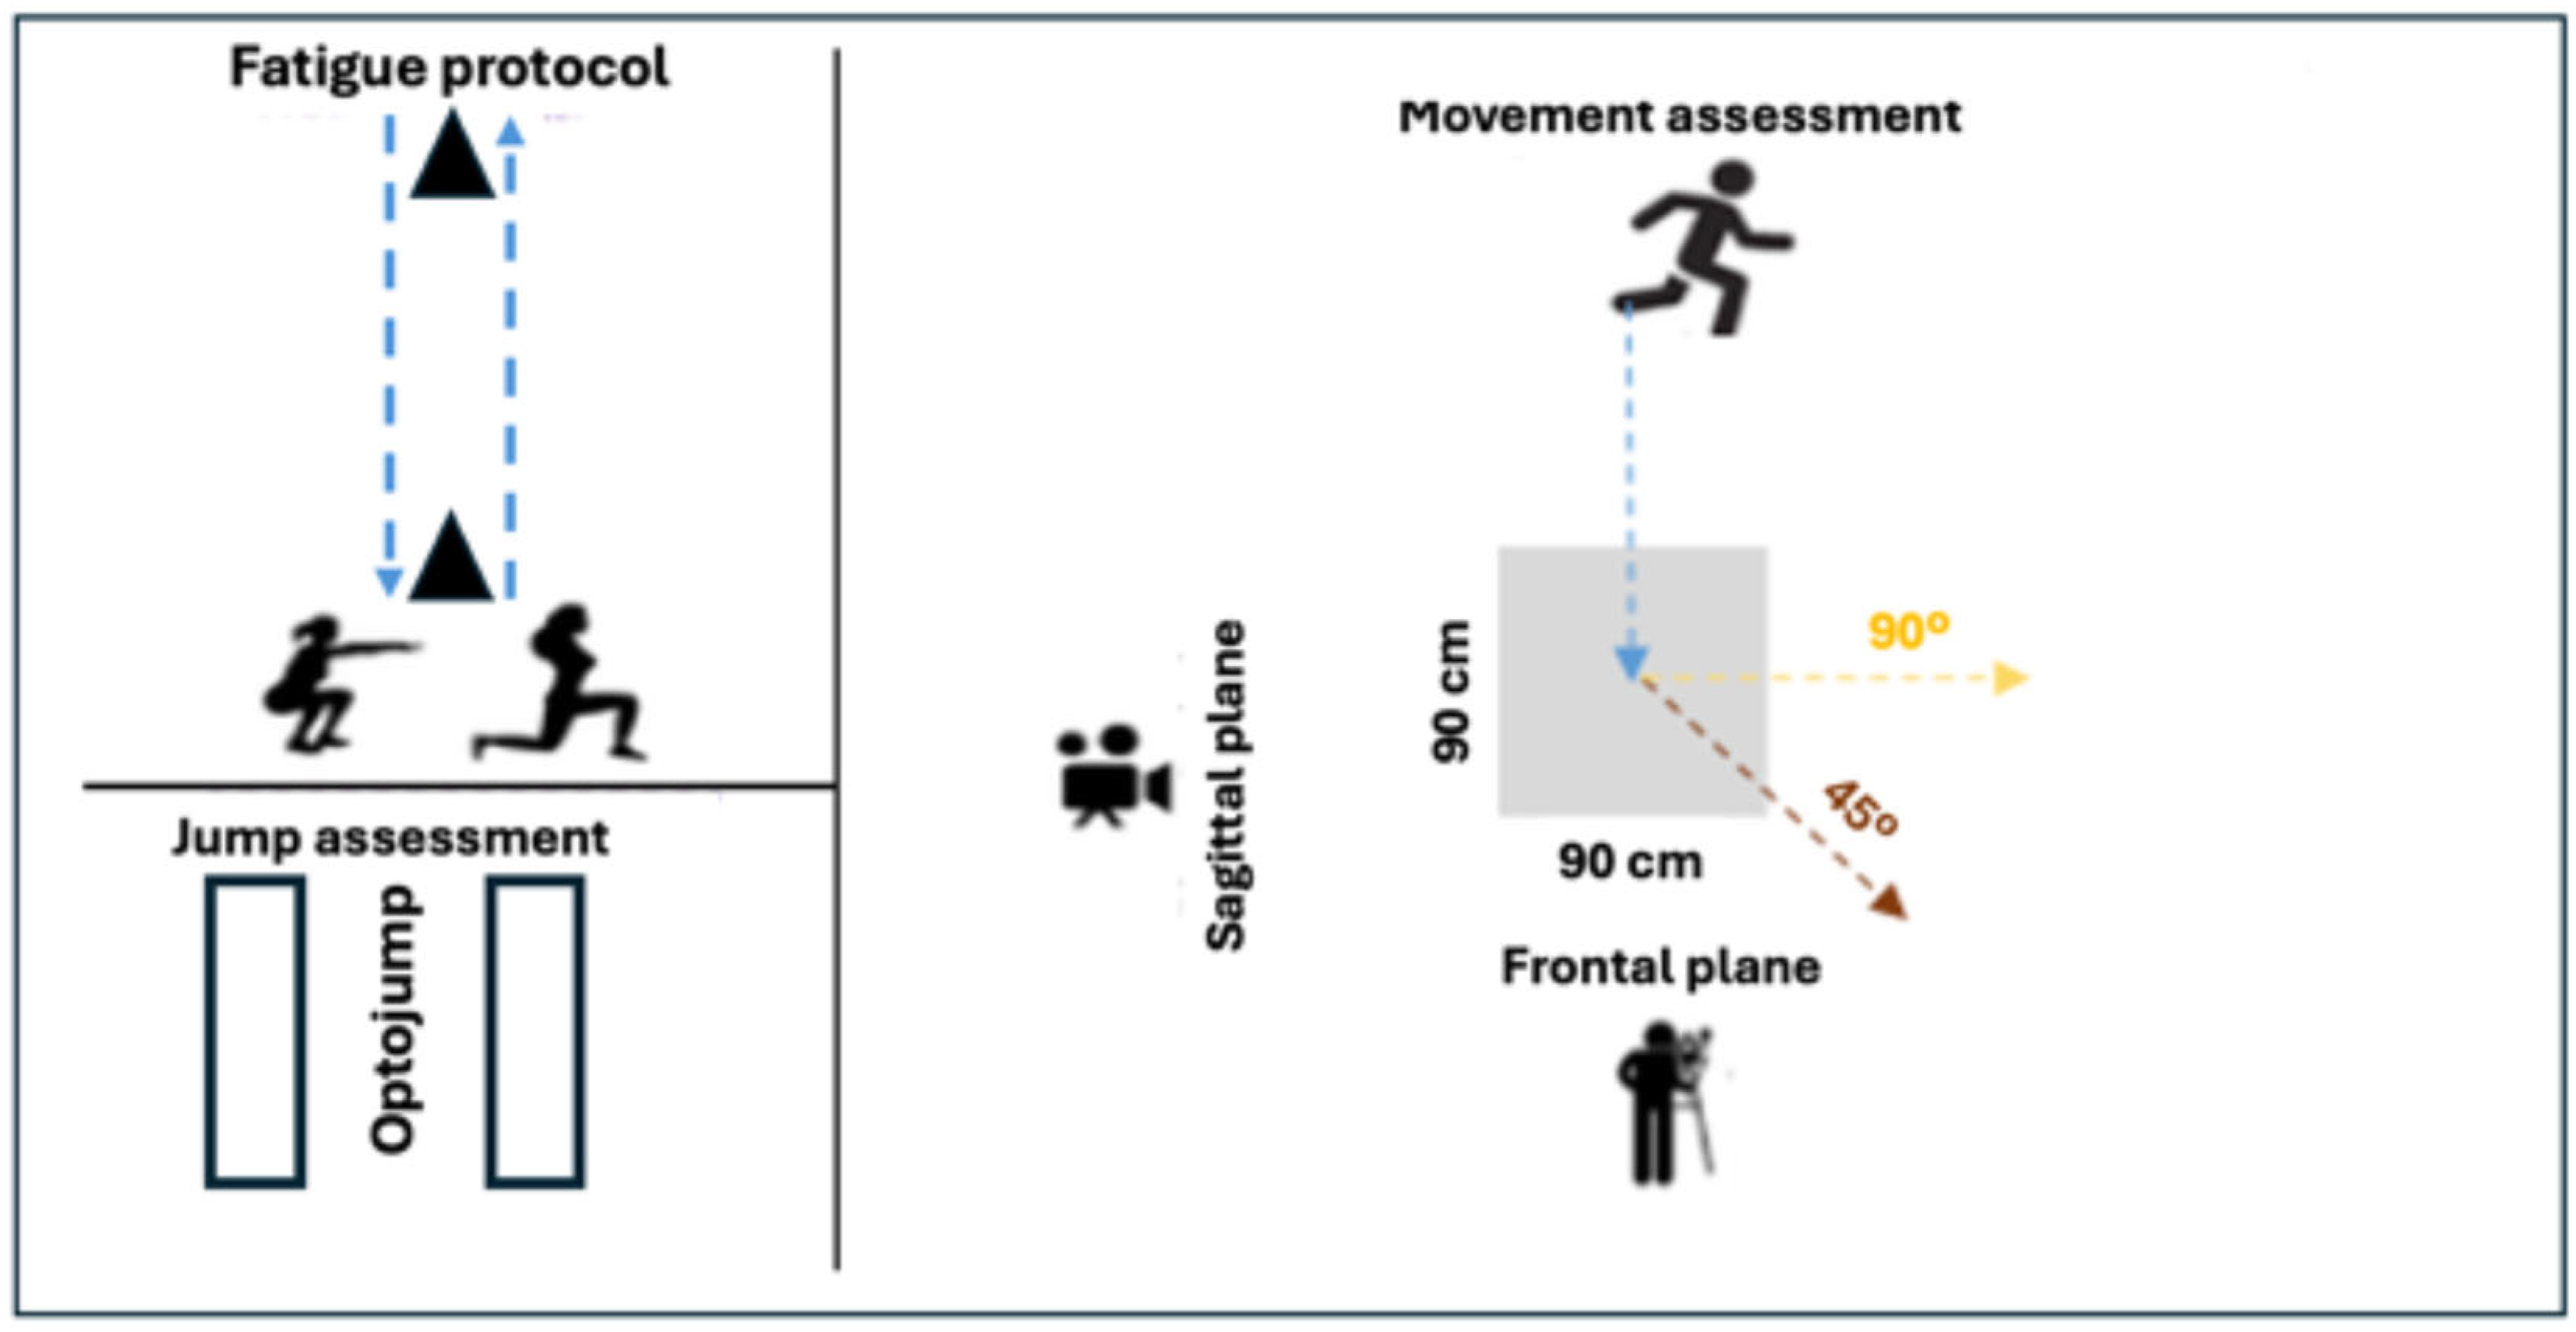
2.2. Study Design
2.3. Procedures
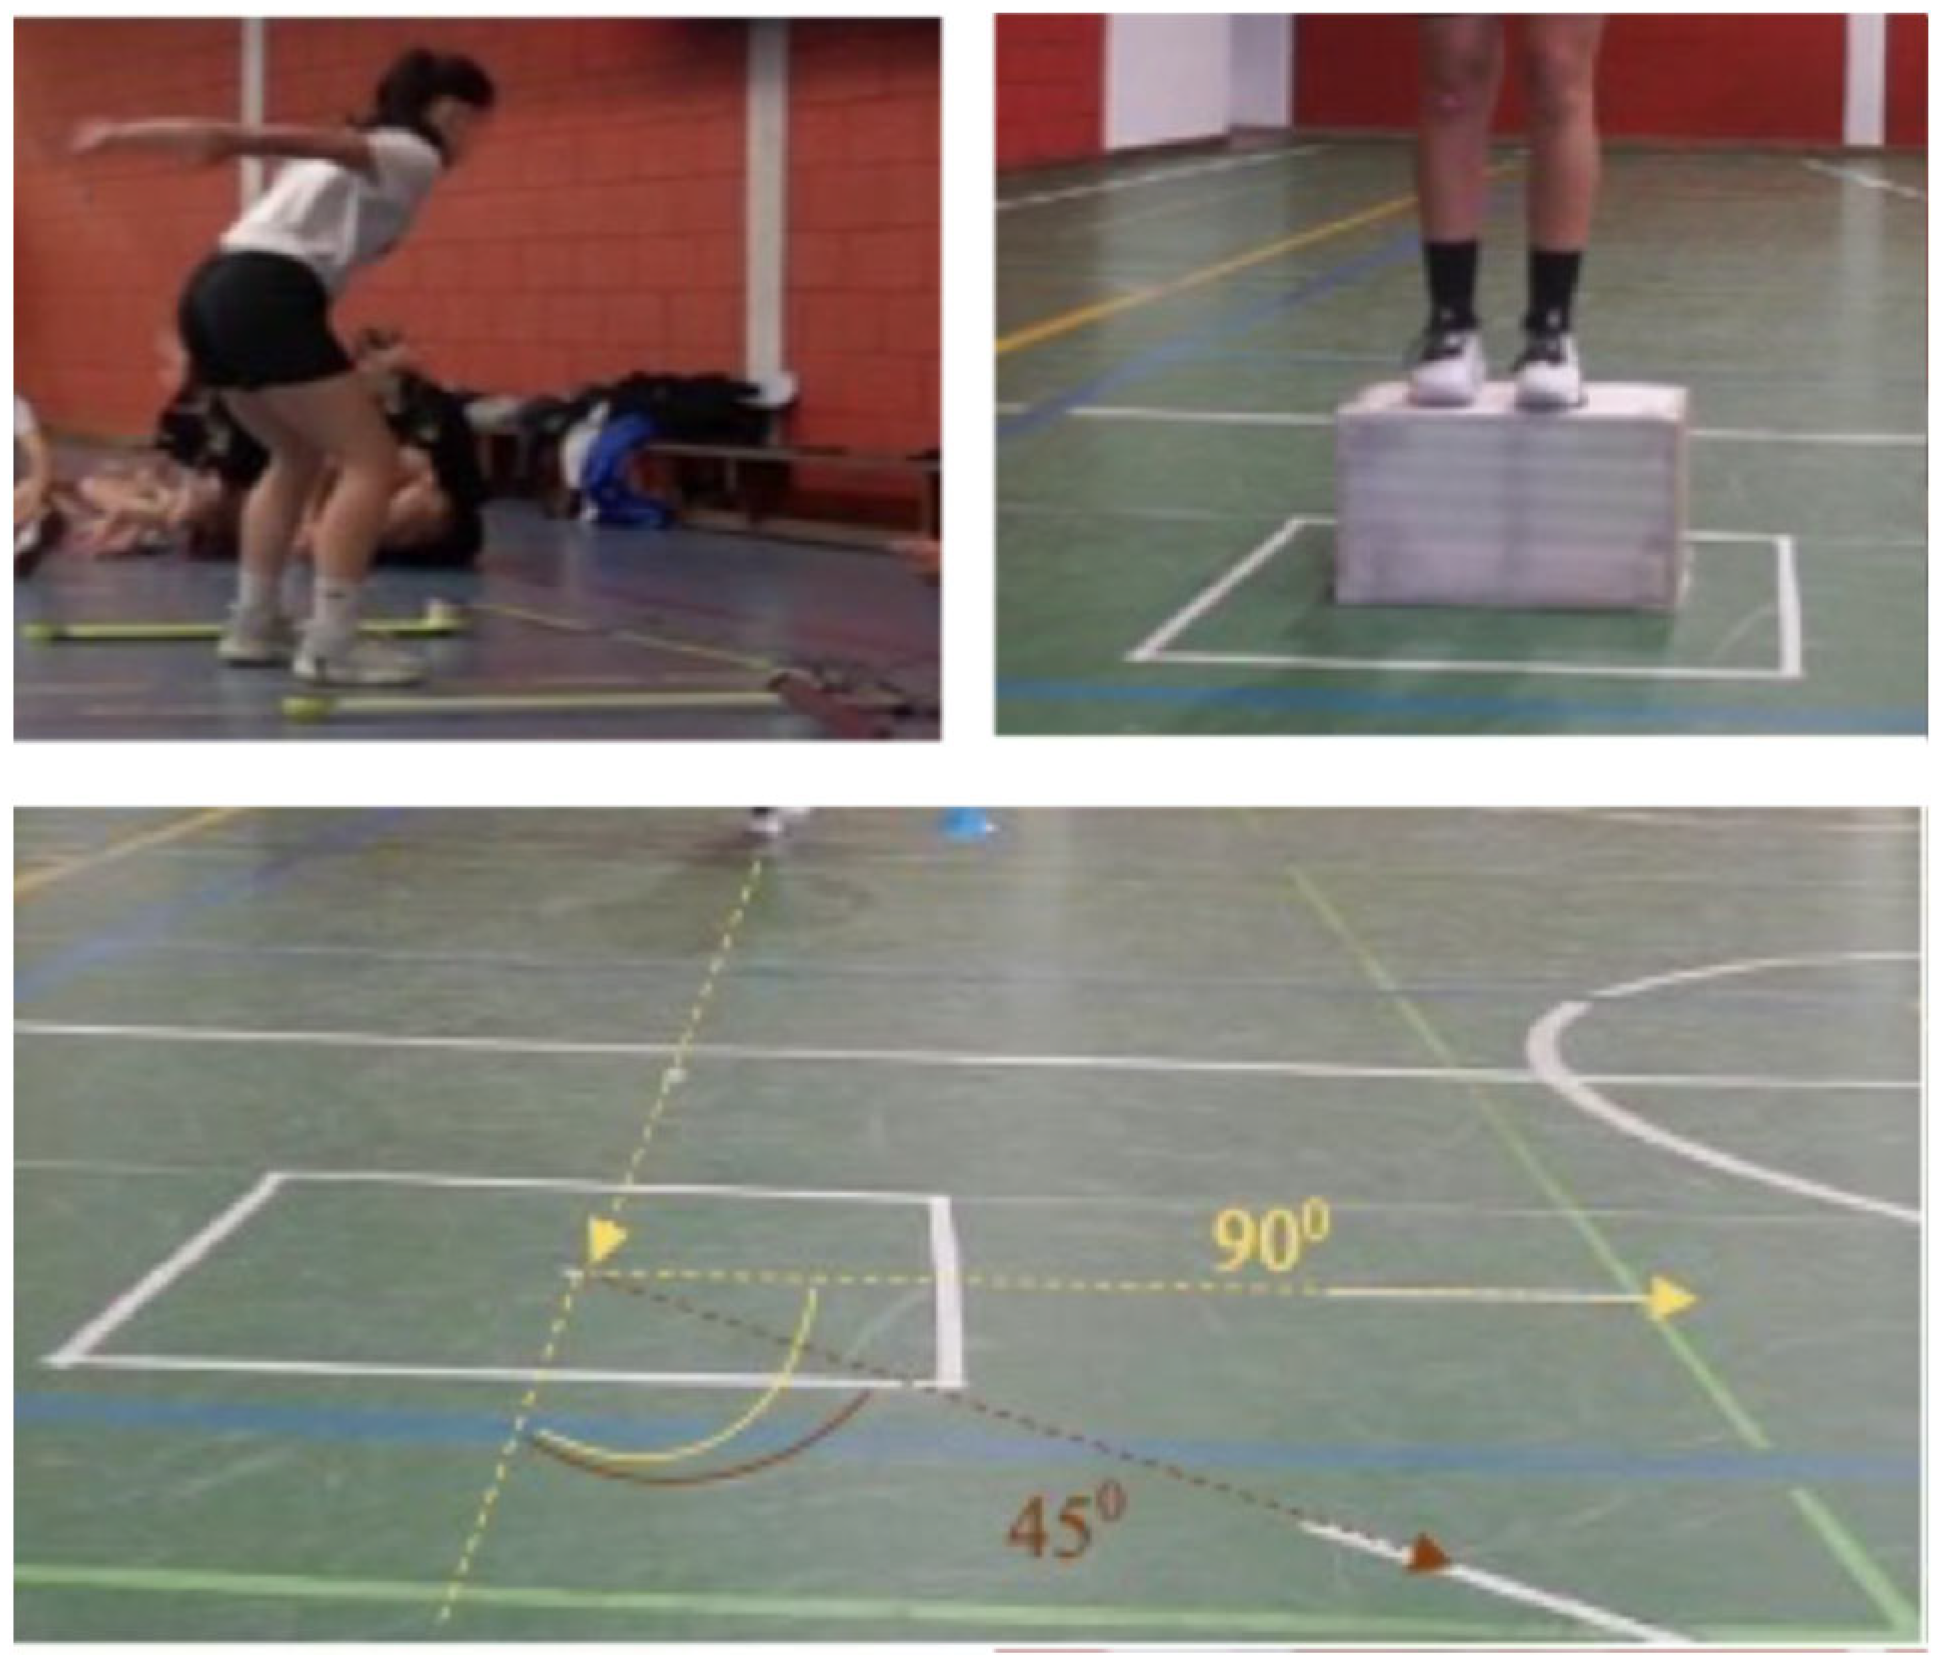
2.3.1. Single-Leg Drop Jumps (DJ-SL)
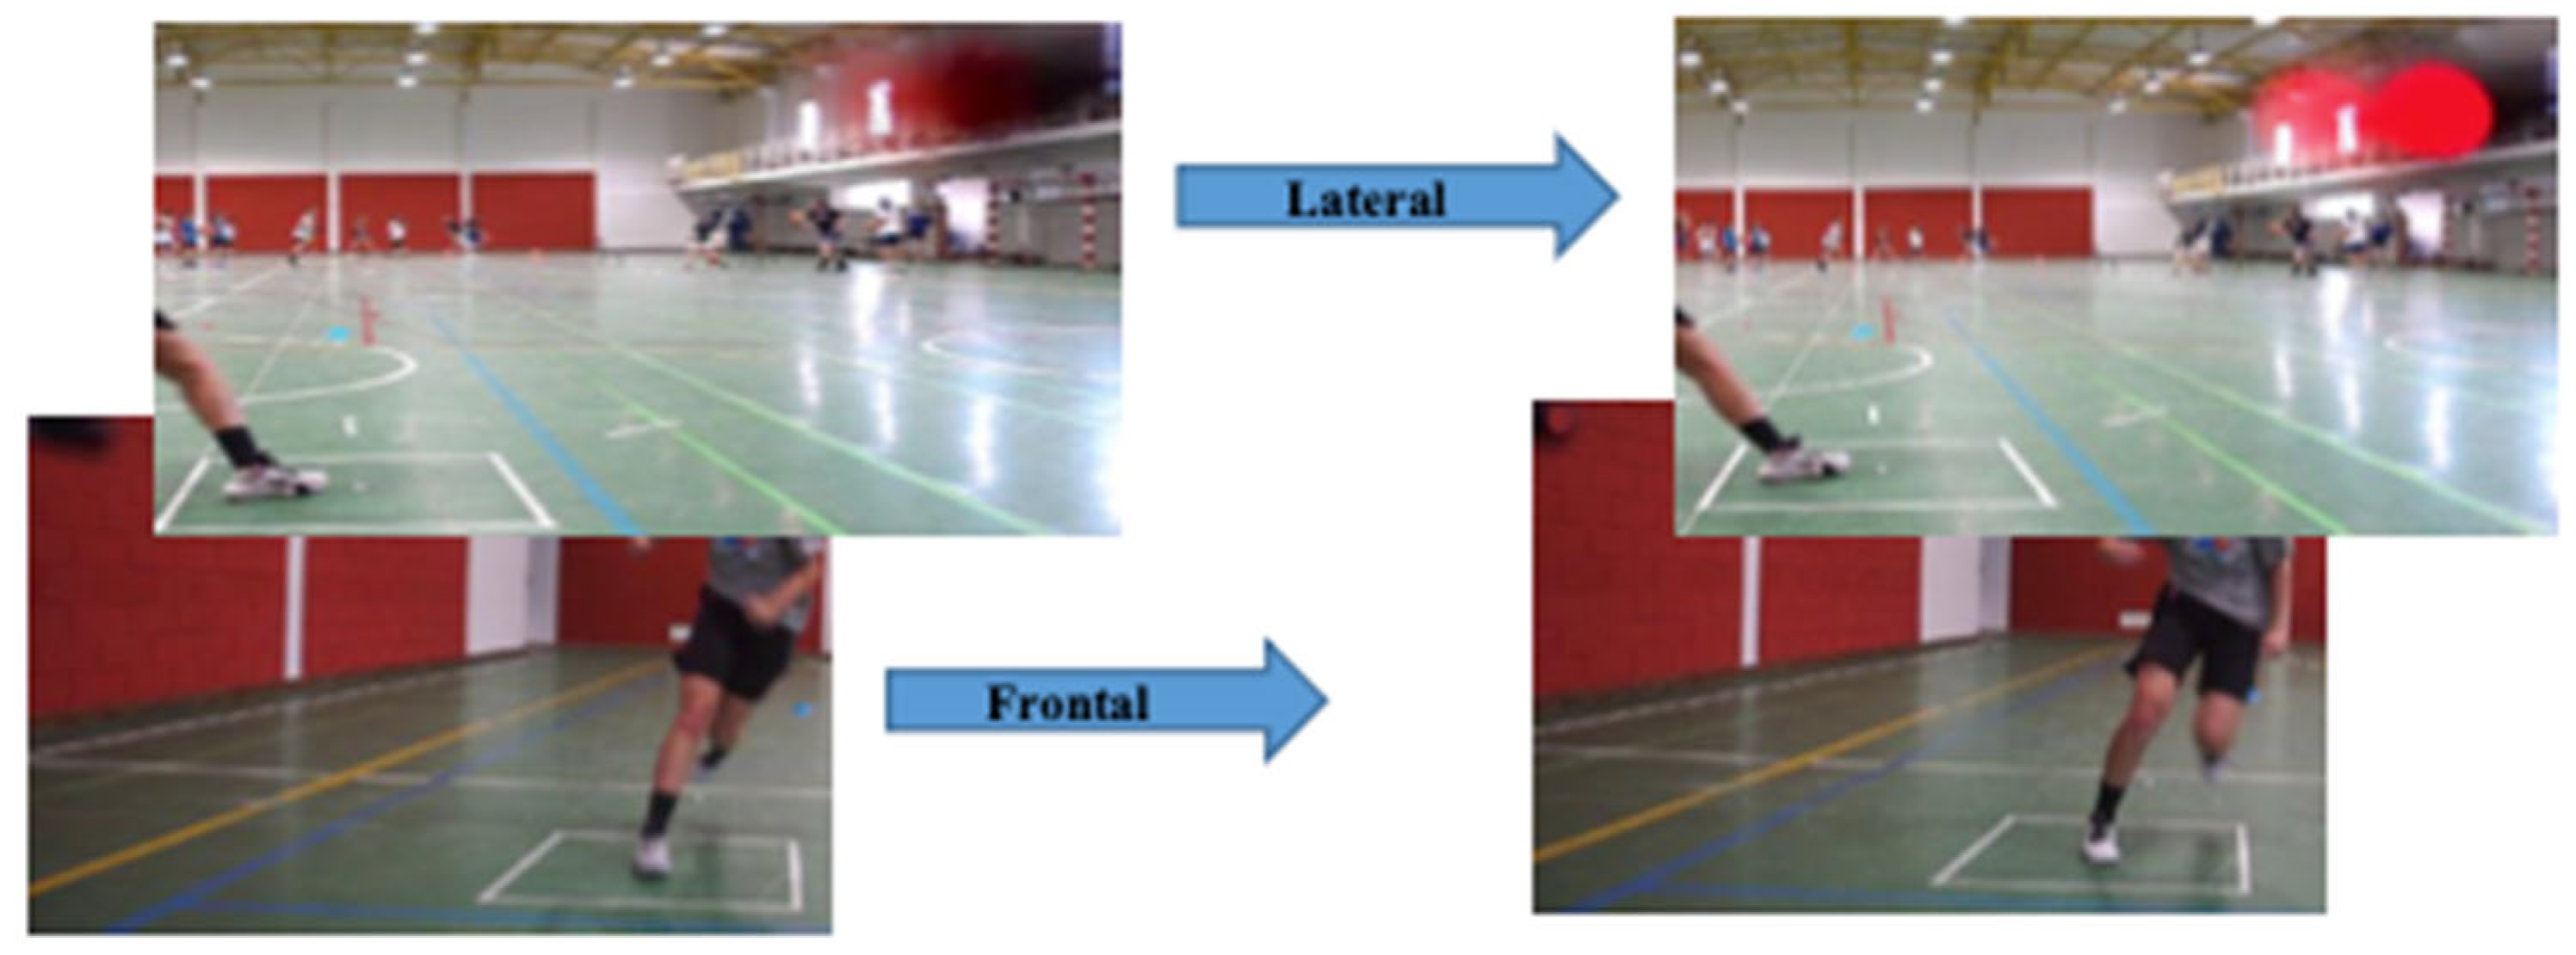
2.3.2. Change of Direction (COD) Test
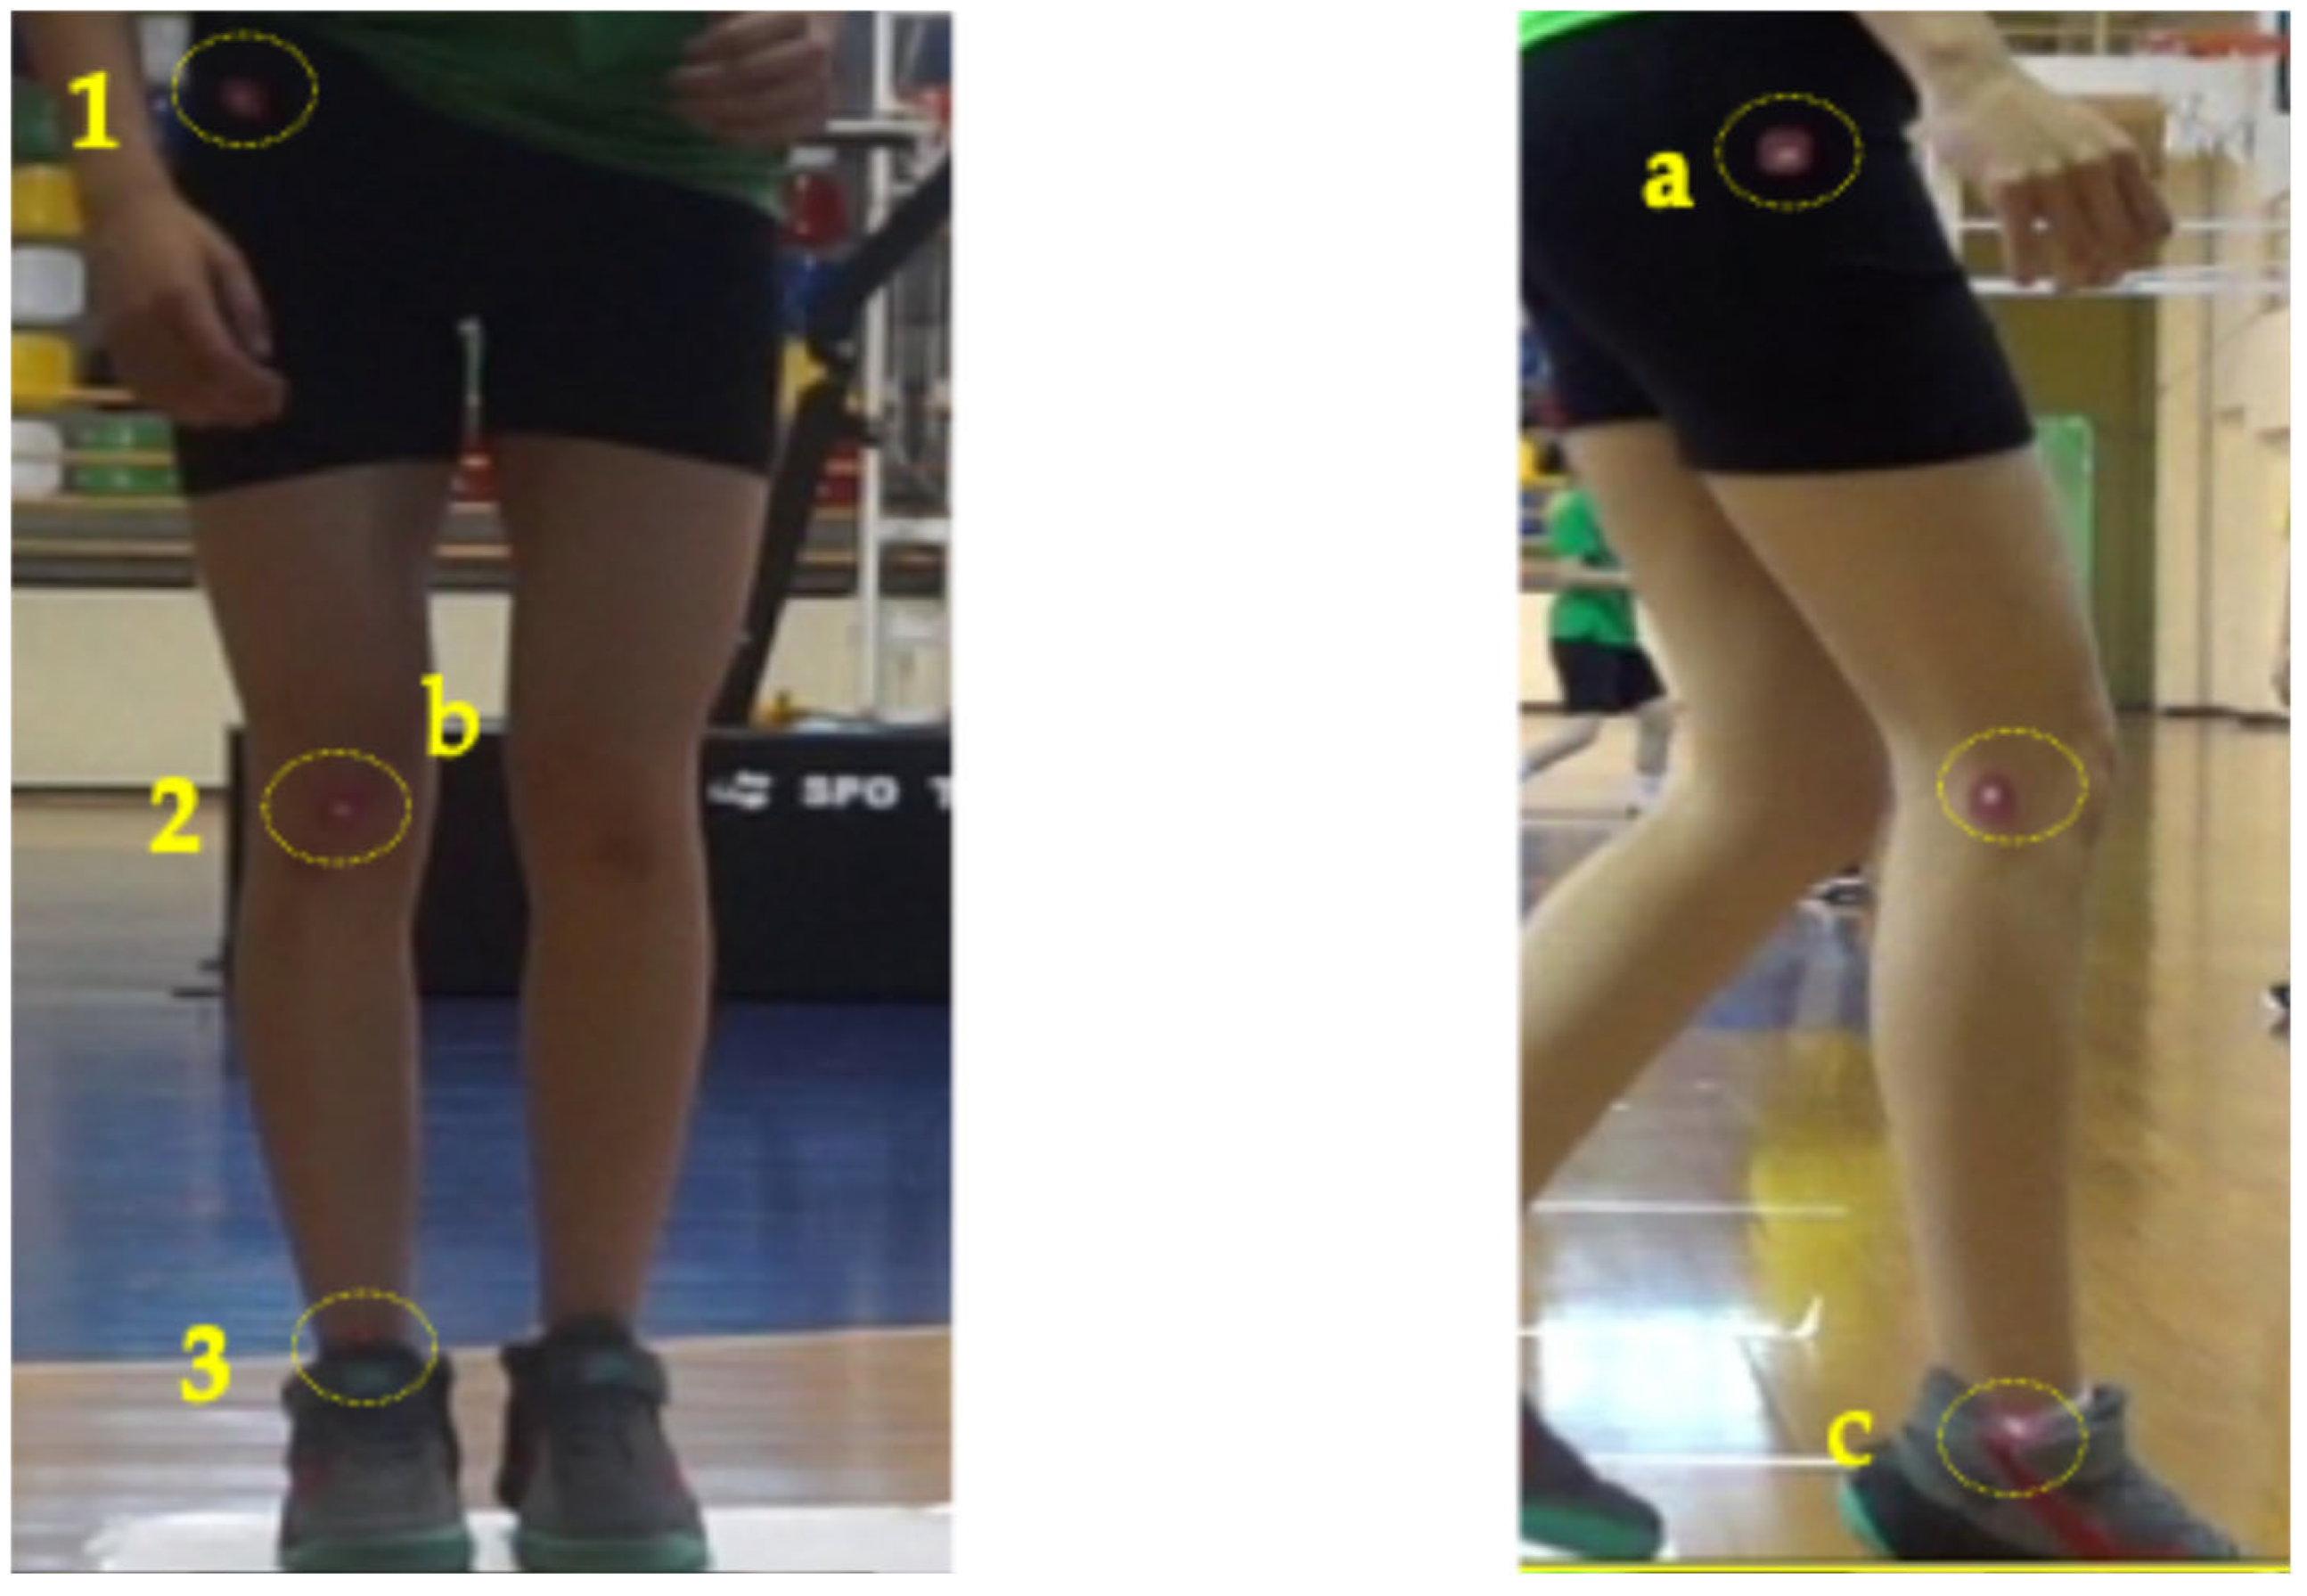
2.3.3. Frontal Plane Projection Angle (FPPA) and Video Analysis
2.3.4. Fatigue Protocol
2.4. Statistical Analysis
3. Results
4. Discussion
5. Conclusions
Author Contributions
Funding
Institutional Review Board Statement
Informed Consent Statement
Data Availability Statement
Acknowledgments
Conflicts of Interest
References
- Hewett, T.E.; Myer, G.D.; Ford, K.R.; Heidt, R.S.; Colosimo, A.J.; McLean, S.G.; van den Bogert, A.J.; Paterno, M.V.; Succop, P. Biomechanical Measures of Neuromuscular Control and Valgus Loading of the Knee Predict Anterior Cruciate Ligament Injury Risk in Female Athletes: A Prospective Study. Am. J. Sports Med. 2005, 33, 492–501. [Google Scholar] [CrossRef]
- Paterno, M.V.; Weed, A.M.; Hewett, T.E. A Between Sex Comparison of Anterior-Posterior Knee Laxity after Anterior Cruciate Ligament Reconstruction with Patellar Tendon or Hamstrings Autograft. Sports Med. 2012, 42, 135–152. [Google Scholar] [CrossRef]
- Chandrashekar, N.; Mansouri, H.; Slauterbeck, J.; Hashemi, J. Sex-based differences in the tensile properties of the human anterior cruciate ligament. J. Biomech. 2006, 39, 2943–2950. [Google Scholar] [CrossRef]
- Willson, J.D.; Ireland, M.L.; Davis, I. Core strength and lower extremity alignment during single leg squats. Med. Sci. Sports Exerc. 2006, 38, 945–952. [Google Scholar] [CrossRef] [PubMed]
- Fidai, M.S.; Okoroha, K.R.; Meldau, J.; Meta, F.; Lizzio, V.A.; Borowsky, P.; Redler, L.H.; Moutzouros, V.; Makhni, E.C. Fatigue Increases Dynamic Knee Valgus in Youth Athletes: Results From a Field-Based Drop-Jump Test. Arthroscopy 2020, 36, 214–222.e212. [Google Scholar] [CrossRef]
- Leppänen, M.; Parkkari, J.; Vasankari, T.; Äyrämö, S.; Kulmala, J.P.; Krosshaug, T.; Kannus, P.; Pasanen, K. Change of Direction Biomechanics in a 180-Degree Pivot Turn and the Risk for Noncontact Knee Injuries in Youth Basketball and Floorball Players. Am. J. Sports Med. 2021, 49, 2651–2658. [Google Scholar] [CrossRef] [PubMed]
- Numata, H.; Nakase, J.; Kitaoka, K.; Shima, Y.; Oshima, T.; Takata, Y.; Shimozaki, K.; Tsuchiya, H. Two-dimensional motion analysis of dynamic knee valgus identifies female high school athletes at risk of non-contact anterior cruciate ligament injury. Knee Surg. Sports Traumatol. Arthrosc. 2018, 26, 442–447. [Google Scholar] [CrossRef]
- Foley, R.C.A.; Bulbrook, B.D.; Button, D.C.; Holmes, M.W.R. Effects of a band loop on lower extremity muscle activity and kinematics during the barbell squat. Int. J. Sports Phys. Ther. 2017, 12, 550–559. [Google Scholar] [PubMed]
- Powers, C. The Influence of Abnormal Hip Mechanics on Knee Injury: A Biomechanical Perspective. J. Orthop. Sports Phys. Ther. 2010, 40, 42–51. [Google Scholar] [CrossRef]
- Cumps, E.; Verhagen, E.; Meeusen, R. Prospective epidemiological study of basketball injuries during one competitive season: Ankle sprains and overuse knee injuries. J. Sports Sci. Med. 2007, 6, 204–211. [Google Scholar]
- Mehl, J.; Diermeier, T.; Herbst, E.; Imhoff, A.B.; Stoffels, T.; Zantop, T.; Petersen, W.; Achtnich, A. Evidence-based concepts for prevention of knee and ACL injuries. 2017 guidelines of the ligament committee of the German Knee Society (DKG). Arch. Orthop. Trauma. Surg. 2018, 138, 51–61. [Google Scholar] [CrossRef] [PubMed]
- Fleming, B.C.; Renstrom, P.A.; Beynnon, B.D.; Engstrom, B.; Peura, G.D.; Badger, G.J.; Johnson, R.J. The effect of weightbearing and external loading on anterior cruciate ligament strain. J. Biomech. 2001, 34, 163–170. [Google Scholar] [CrossRef] [PubMed]
- Benjaminse, A.; Habu, A.; Sell, T.C.; Abt, J.P.; Fu, F.H.; Myers, J.B.; Lephart, S.M. Fatigue alters lower extremity kinematics during a single-leg stop-jump task. Knee Surg. Sports Traumatol. Arthrosc. 2008, 16, 400–407. [Google Scholar] [CrossRef]
- Dickin, D.C.; Johann, E.; Wang, H.; Popp, J.K. Combined Effects of Drop Height and Fatigue on Landing Mechanics in Active Females. J. Appl. Biomech. 2015, 31, 237–243. [Google Scholar] [CrossRef] [PubMed]
- Emery, C.A.; Roy, T.O.; Whittaker, J.L.; Nettel-Aguirre, A.; van Mechelen, W. Neuromuscular training injury prevention strategies in youth sport: A systematic review and meta-analysis. Br. J. Sports Med. 2015, 49, 865–870. [Google Scholar] [CrossRef]
- Drakos, M.C.; Domb, B.; Starkey, C.; Callahan, L.; Allen, A.A. Injury in the National Basketball Association. Sports Health 2010, 2, 284–290. [Google Scholar] [CrossRef]
- Maffulli, N.; Caine, D. The Epidemiology of Children’s Team Sports Injuries. In Epidemiology of Pediatric Sports Injuries; Karger: Basel, Switzerland, 2005; pp. 1–8. [Google Scholar] [CrossRef]
- Caseiro, A.; França, C.; Faro, A.; Branquinho Gomes, B. Kinematic analysis of the basketball jump shot with increasing shooting distance: Comparison between experienced and non-experienced players. Acta Bioeng. Biomech. 2023, 25, 61–67. [Google Scholar] [CrossRef] [PubMed]
- Bolgla, L.A.; Gibson, H.N.; Hannah, D.C.; Curry-McCoy, T. Comparison of the Frontal Plane Projection Angle and the Dynamic Valgus Index to Identify Movement Dysfunction in Females with Patellofemoral Pain. Int. J. Sports Phys. Ther. 2023, 18, 619–625. [Google Scholar] [CrossRef] [PubMed] [PubMed Central]
- Bailon, C.; Damas, M.; Baños, O. Automatic 2D motion capture system for joint angle measurement. In Lecture Notes in Computer Science; Springer: Berlin/Heidelberg, Germany, 2017; Volume 10305, pp. 84–93. [Google Scholar] [CrossRef]
- Smajla, D.; Šarabon, N.; García Ramos, A.; Janicijevic, D.; Kozinc, Ž. Influence of Isometric and Dynamic Fatiguing Protocols on Dynamic Strength Index. Appl. Sci. 2024, 14, 2722. [Google Scholar] [CrossRef]
- Sinsurin, K.; Vachalathiti, R.; Jalayondeja, W.; Limroongreungrat, W. Altered Peak Knee Valgus during Jump-Landing among Various Directions in Basketball and Volleyball Athletes. Asian J. Sports Med. 2013, 4, 195–200. [Google Scholar] [CrossRef]
- Schurr, S.A.; Marshall, A.N.; Resch, J.E.; Saliba, S.A. Two-dimensional video analysis is comparable to 3D motion capture in lower extremity movement assessment. Int. J. Sports Phys. Ther. 2017, 12, 163–172. [Google Scholar] [PubMed]
- Ortiz, A.; Rosario-Canales, M.; Rodríguez, A.; Seda, A.; Figueroa, C.; Venegas-Ríos, H. Reliability and Concurrent Validity between Two-Dimensional and Three-Dimensional Evaluations of Knee Valgus during Drop Jumps. Open Access J. Sports Med. 2016, 7, 65–73. [Google Scholar] [CrossRef] [PubMed]
- Erdman, A.L.; Loewen, A.H.; Dressing, M.A.; Wyatt, C.L.; Oliver, G.D.; Butler, L.A.; Sugimoto, D.; Black, A.M.; Tulchin-Francis, K.; Bazett-Jones, D.M.; et al. A 2D Video-Based Assessment Is Associated with 3D Biomechanical Contributors to Dynamic Knee Valgus in the Coronal Plane. Front. Sports Act. Living 2024, 6, 1352286. [Google Scholar] [CrossRef] [PubMed]


| Variable | Before Fatigue N = 33 | After Fatigue N = 33 | t-Test (p) | Effect Size |
|---|---|---|---|---|
| mDKV—COD 45° (°) | 24.77 ±8.25 | 26.59 ± 12.30 | −0.318 (0.552) | 0.176 |
| mDKV—COD 90° (°) | 34.55 ± 10.40 | 35.87 ± 10.37 | −0.416 (0.602) | 0.143 |
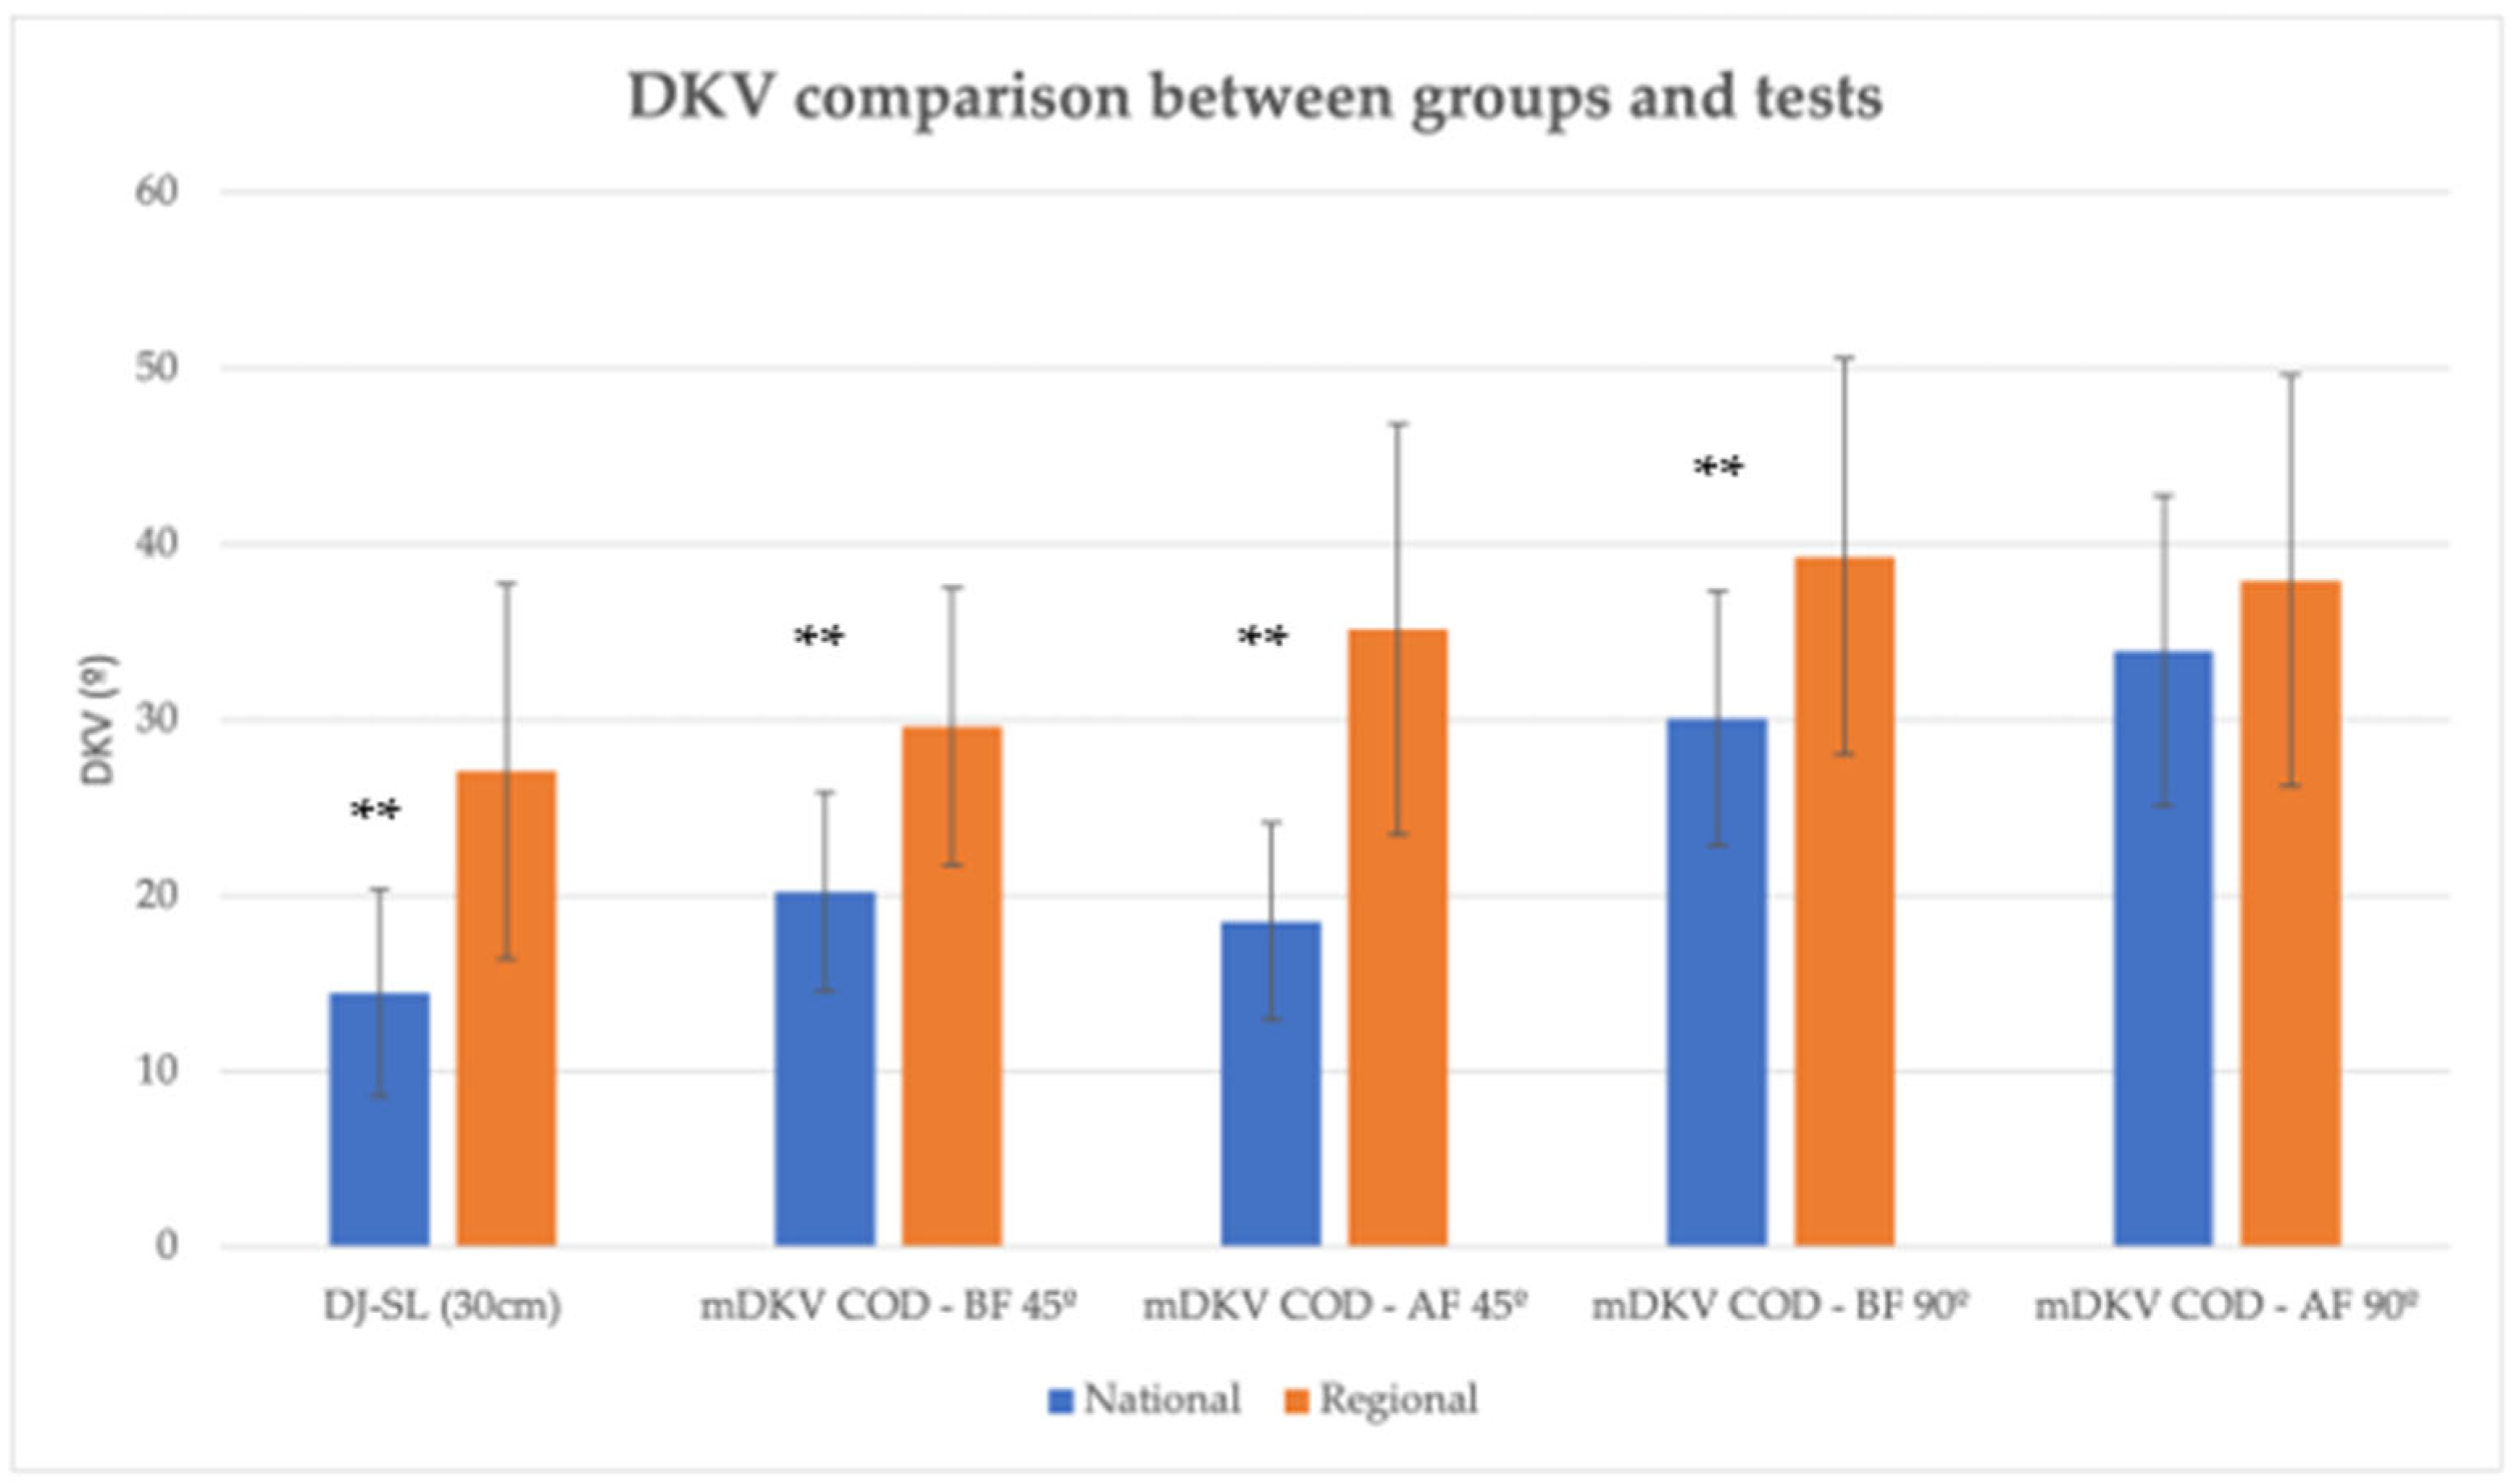
| Variable | National N = 17 | Regional N = 16 | p | ES | |
|---|---|---|---|---|---|
| mDKV DJ-SL (30 cm) (°) | 14.46 ± 5.88 | 27.07 ± 10.67 | 0.000 ** | 1.476 | |
| Change of Direction (COD) | mDKV COD—BF 45° (°) | 20.21 ± 5.67 | 29.61 ± 7.90 | 0.000 ** | 1.373 |
| mDKV COD—AF 45° (°) | 18.55 ± 5.61 | 35.14 ± 11.73 | 0.000 ** | 1.823 | |
| Knee angle 45 (°) | 133.72 ± 28.87 | 128.57 ± 14.85 | 0.528 | 0.222 | |
| mDKV COD—BF 90 (°) | 30.07 ± 7.26 | 39.30 ± 11.30 | 0.008 ** | 0.979 | |
| mDKV COD—AF 90 (°) | 33.93 ± 8.85 | 37.93 ± 11.72 | 0.275 | 0.387 | |
| Knee angle 90° (°) | 136.91 ± 12.71 | 128.73 ± 12.81 | 0.075 | 0.641 | |
| RAST Pmax (W) | 409.29 ± 86.76 | 326.53 ± 52.75 | 0.003 ** | 1.144 | |
| RAST Pmin (W) | 235.23 ± 60.17 | 224.38 ± 38.88 | 0.560 | 0.205 | |
| RAST Prel (W/kg) | 6.62 ± 1.38 | 5.99 ± 1.06 | 0.156 | 0.507 | |
| RAST Fatigue (W/s) | 4.51 ± 1.60 | 2.68 ± 0.91 | 0.000 ** | 1.396 | |
| CMJ FREE ARMS PF (%) | 24.51 ± 4.74 | 22.34 ± 2.05 | 0.101 | 0.574 |
Disclaimer/Publisher’s Note: The statements, opinions and data contained in all publications are solely those of the individual author(s) and contributor(s) and not of MDPI and/or the editor(s). MDPI and/or the editor(s) disclaim responsibility for any injury to people or property resulting from any ideas, methods, instructions or products referred to in the content. |
© 2025 by the authors. Licensee MDPI, Basel, Switzerland. This article is an open access article distributed under the terms and conditions of the Creative Commons Attribution (CC BY) license (https://creativecommons.org/licenses/by/4.0/).
Share and Cite
Gomes, B.B.; Cardoso, R.; Fernandes, R.A.; Ferreira, R.A. Impact of Neuromuscular Fatigue on Dynamic Knee Valgus in Female Basketball Players. Life 2025, 15, 816. https://doi.org/10.3390/life15050816
Gomes BB, Cardoso R, Fernandes RA, Ferreira RA. Impact of Neuromuscular Fatigue on Dynamic Knee Valgus in Female Basketball Players. Life. 2025; 15(5):816. https://doi.org/10.3390/life15050816
Chicago/Turabian StyleGomes, Beatriz B., Ricardo Cardoso, Rui A. Fernandes, and Rui A. Ferreira. 2025. "Impact of Neuromuscular Fatigue on Dynamic Knee Valgus in Female Basketball Players" Life 15, no. 5: 816. https://doi.org/10.3390/life15050816
APA StyleGomes, B. B., Cardoso, R., Fernandes, R. A., & Ferreira, R. A. (2025). Impact of Neuromuscular Fatigue on Dynamic Knee Valgus in Female Basketball Players. Life, 15(5), 816. https://doi.org/10.3390/life15050816