

Prevalence of Neuropathic Pain in Morocco: A Systematic Review and Meta-Analysis

Abstract
1. Introduction
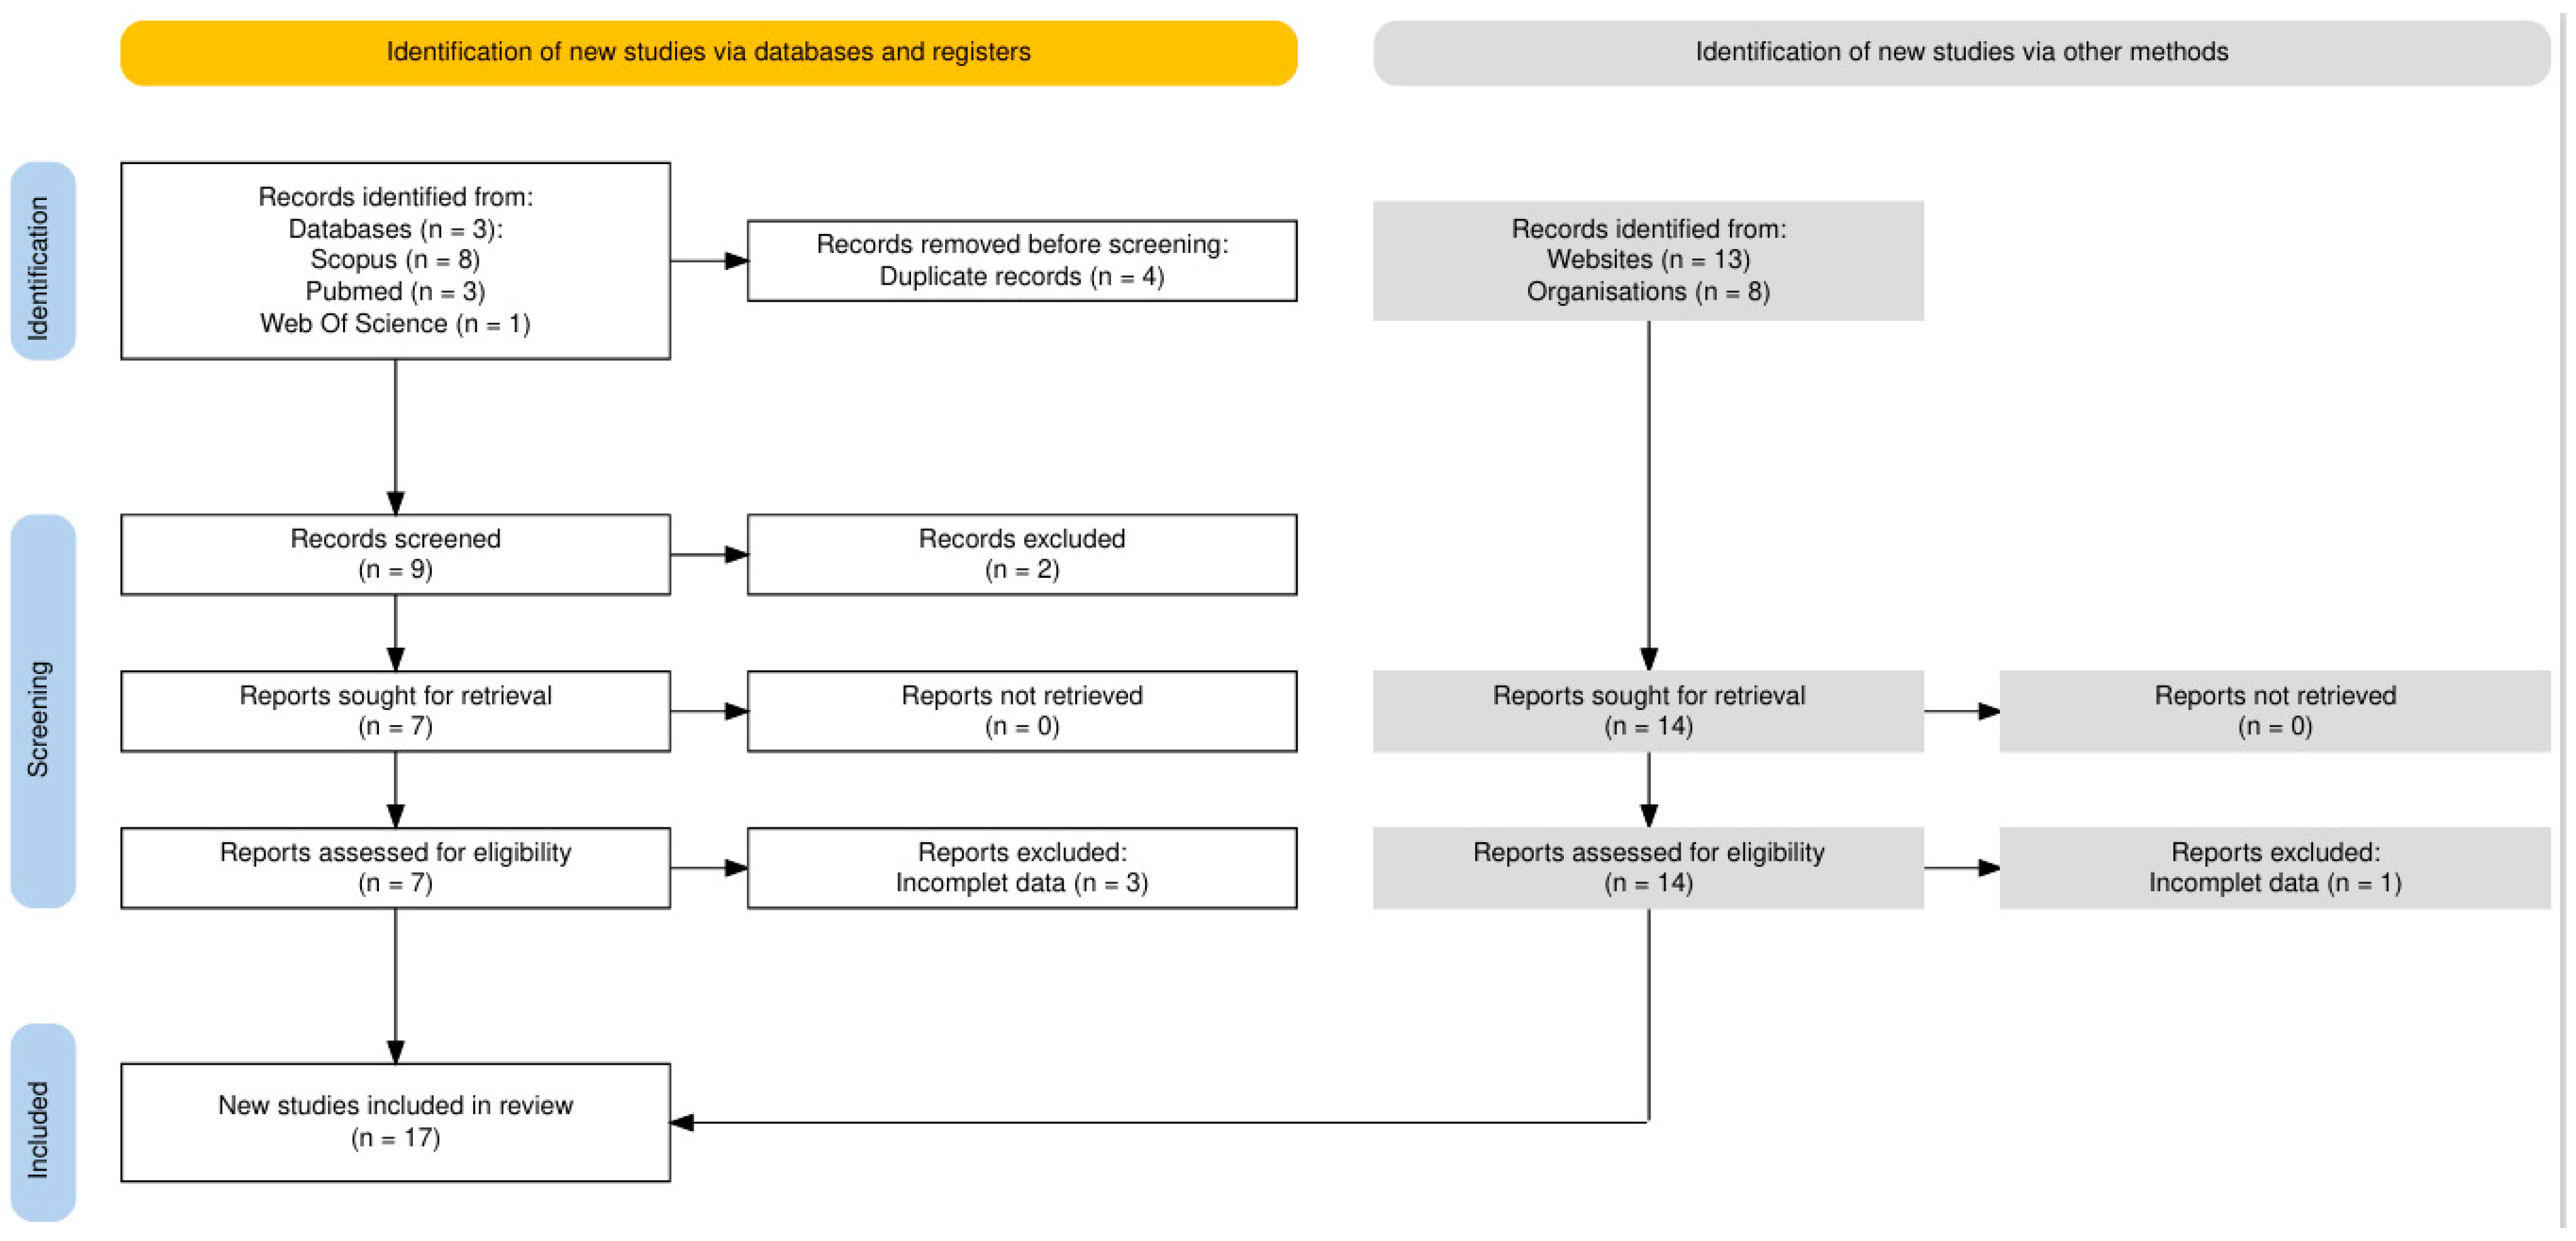
2. Method
2.1. Data Sources
2.2. Screening Strategy and Inclusion Criteria
2.3. Search Strategy
2.4. Data Extraction
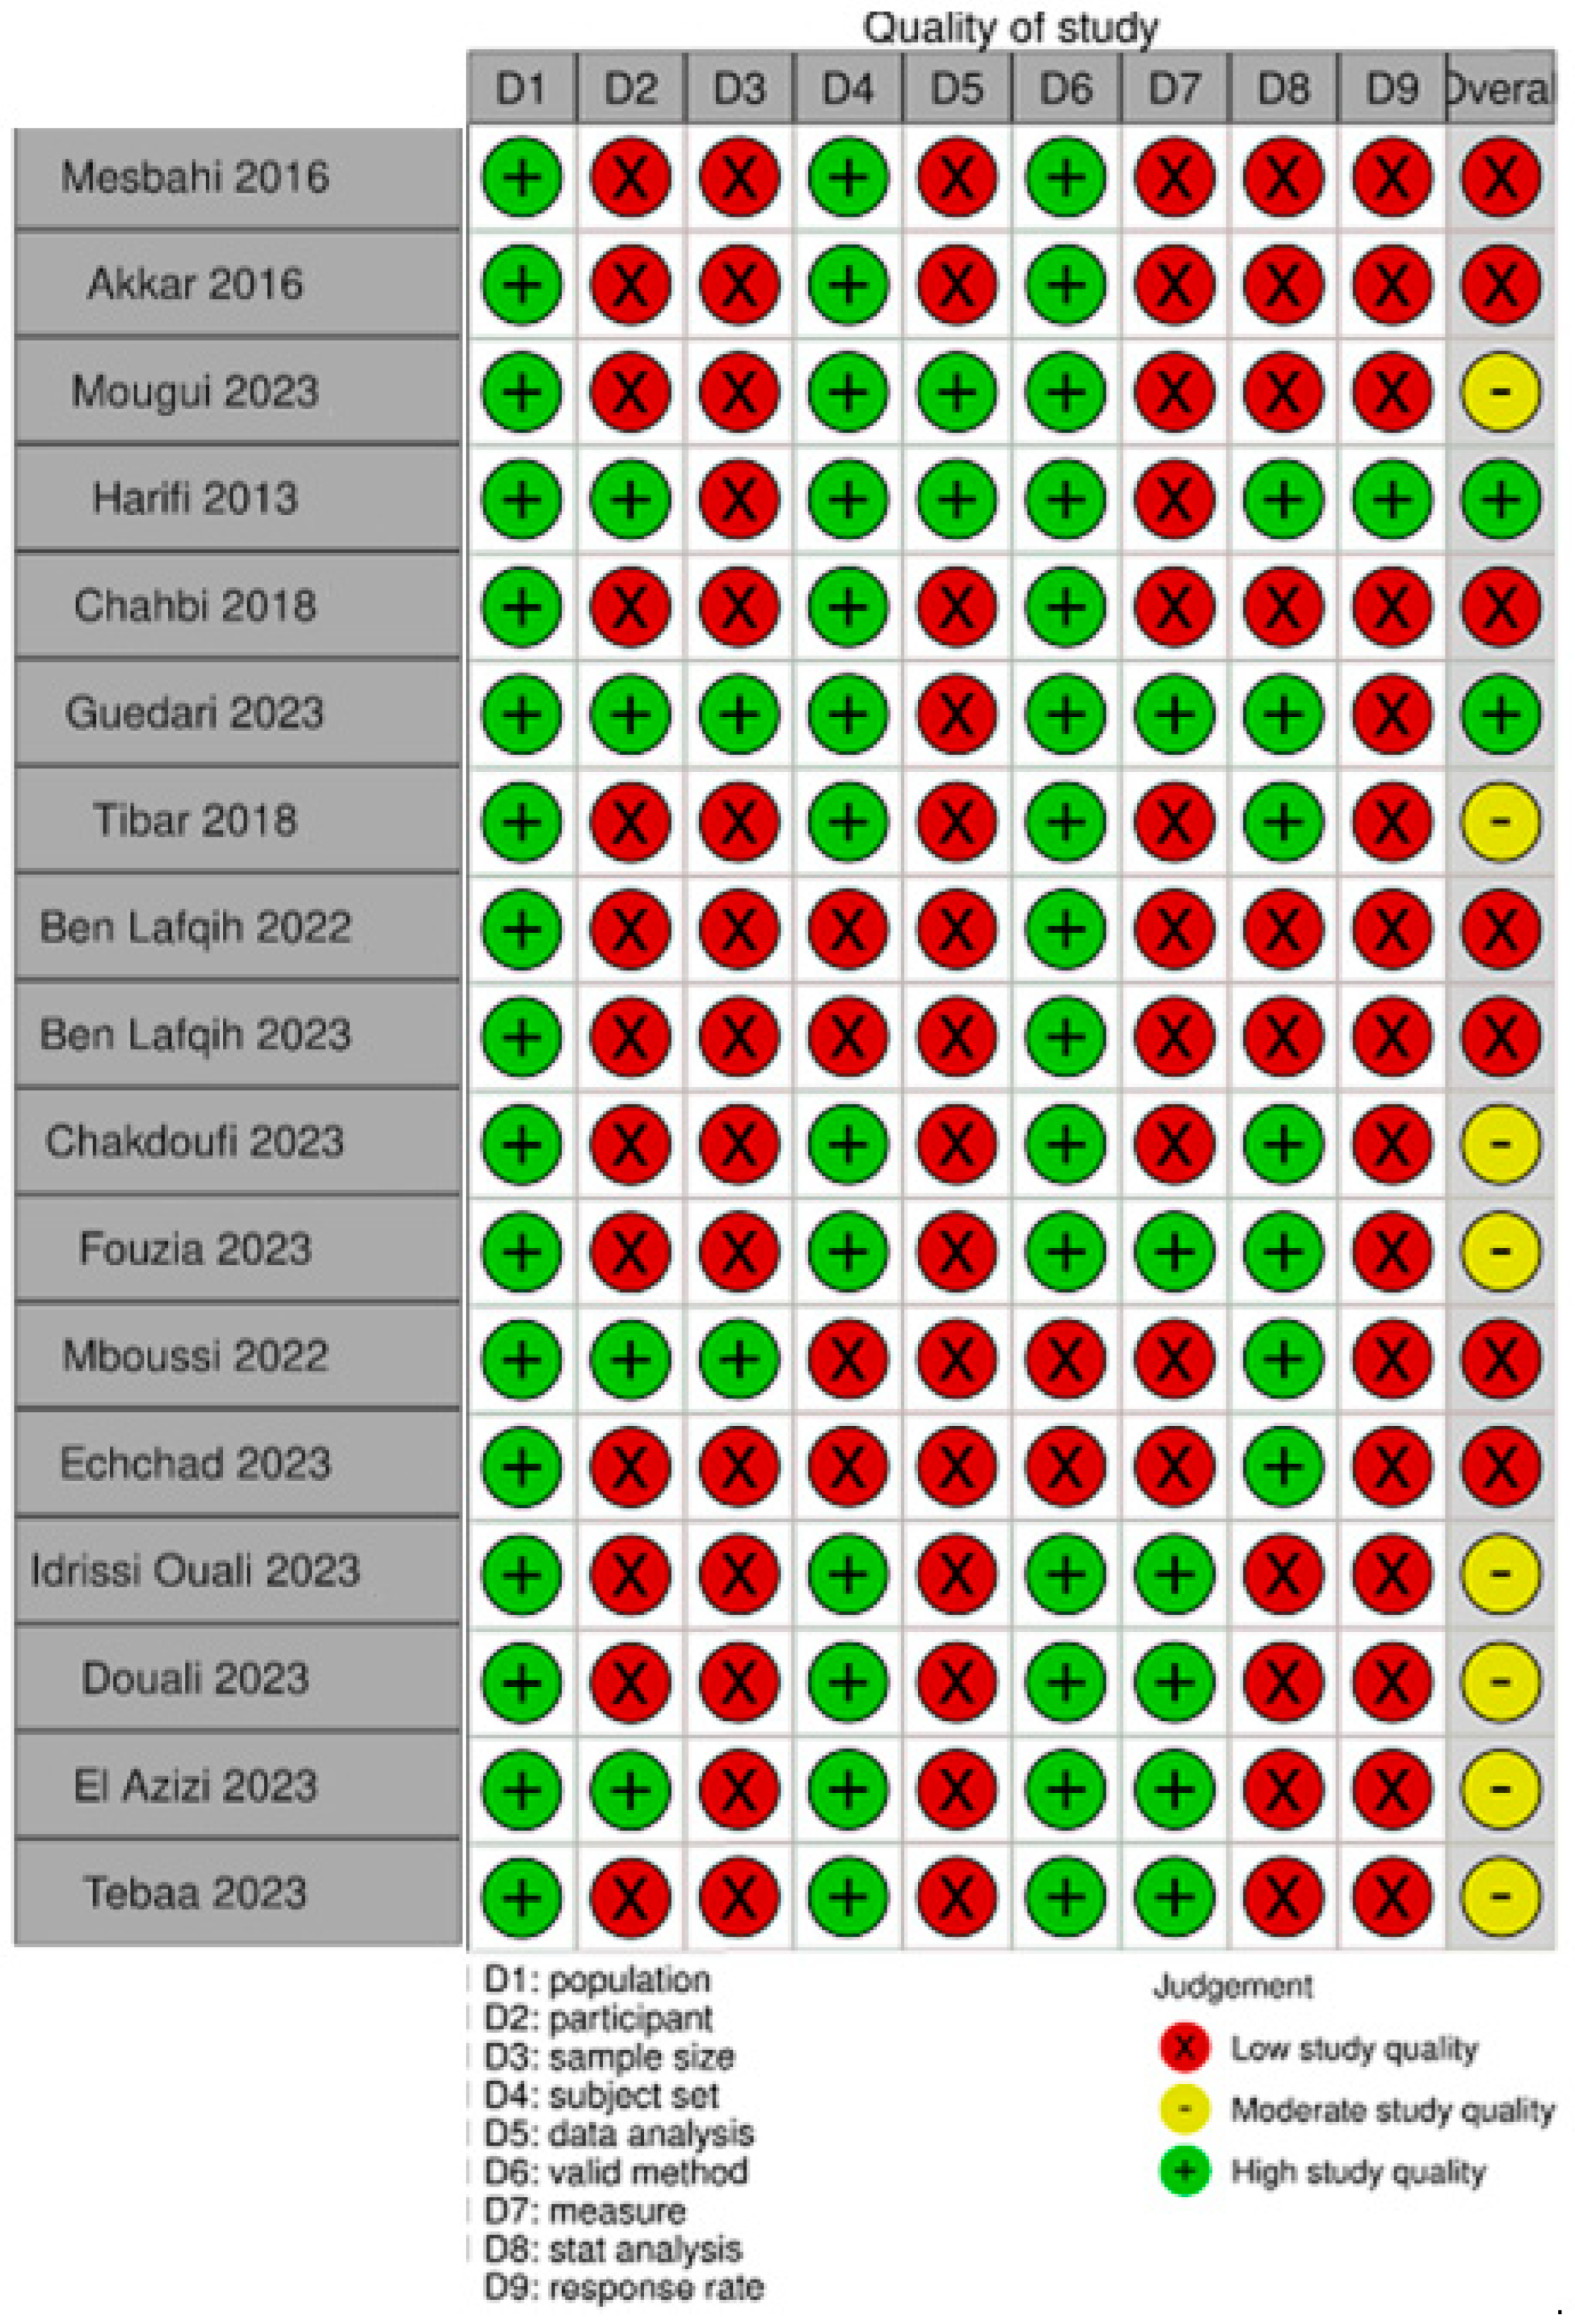
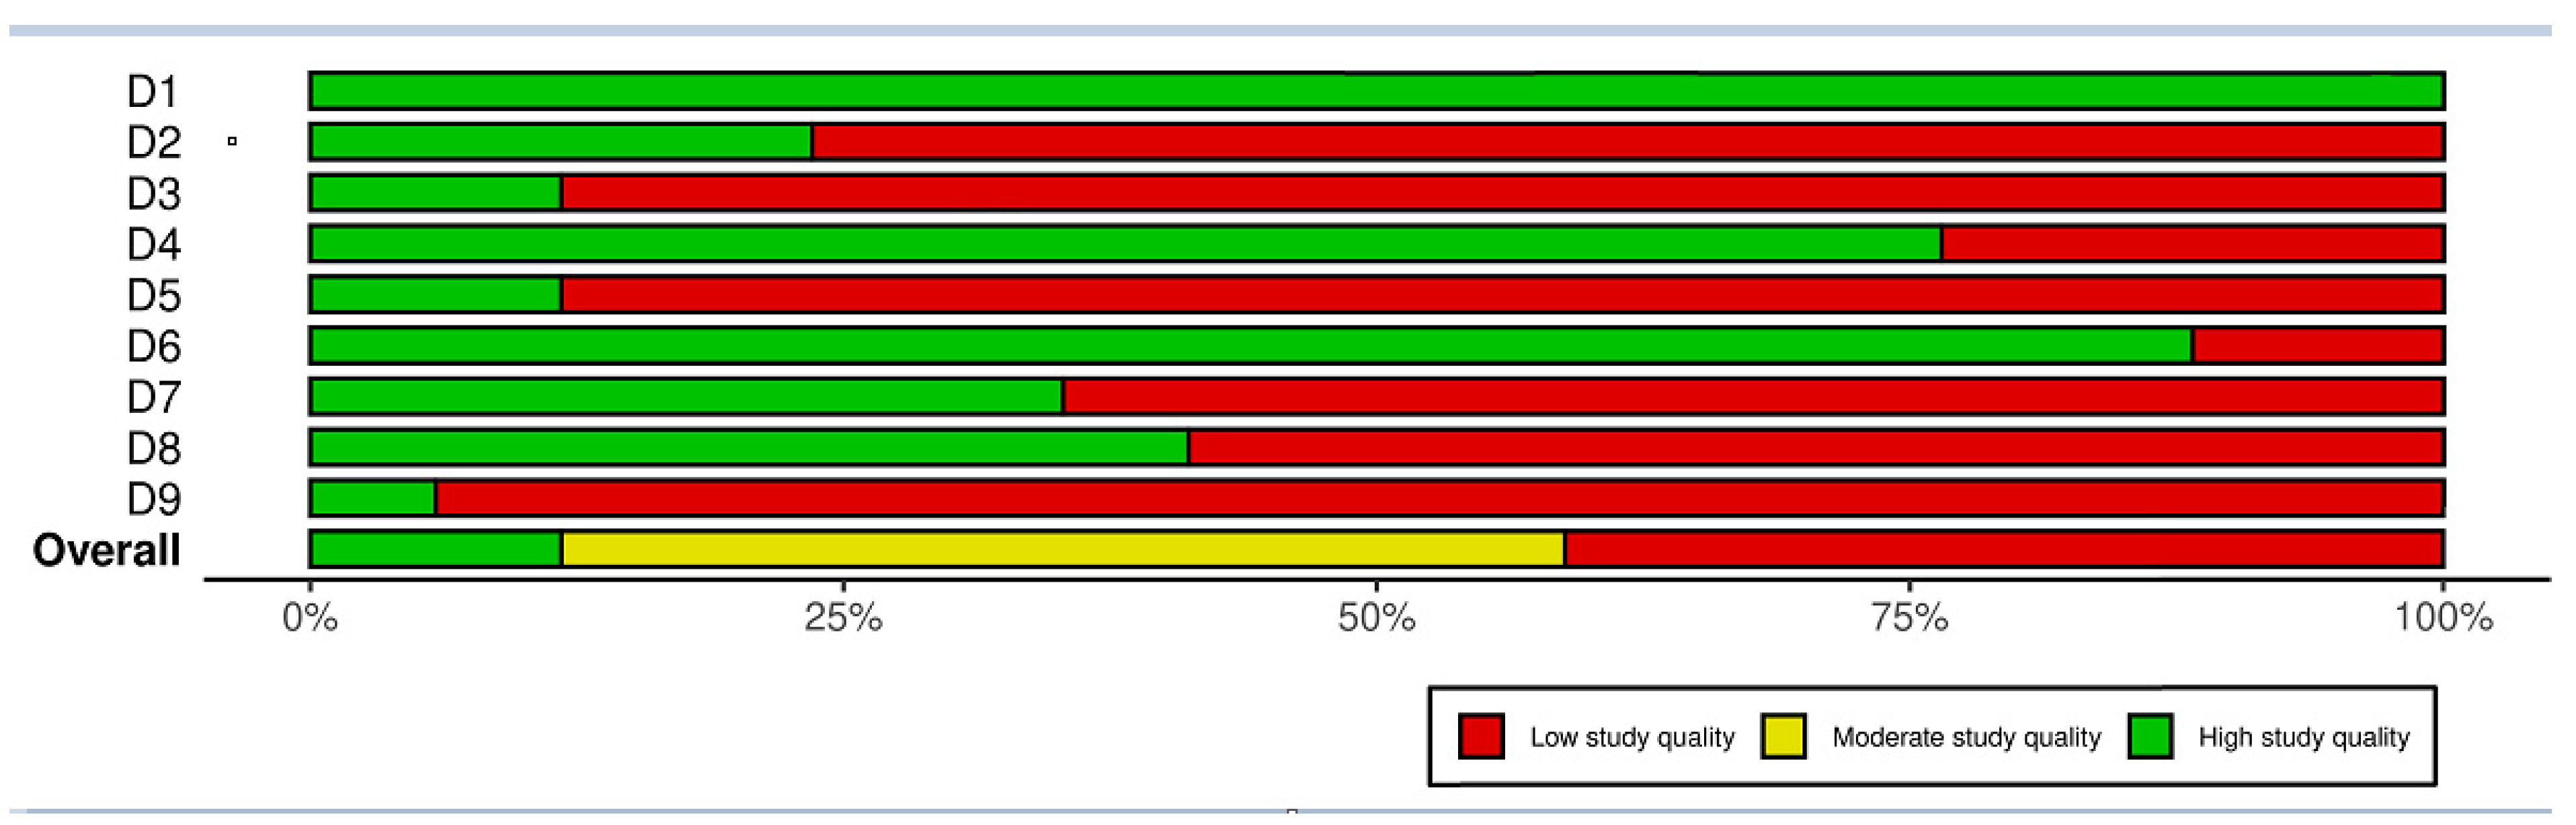
2.5. Quality Assessment
2.6. Statistical Analysis
2.7. Missing Data
3. Results
3.1. Characteristics of Included Studies
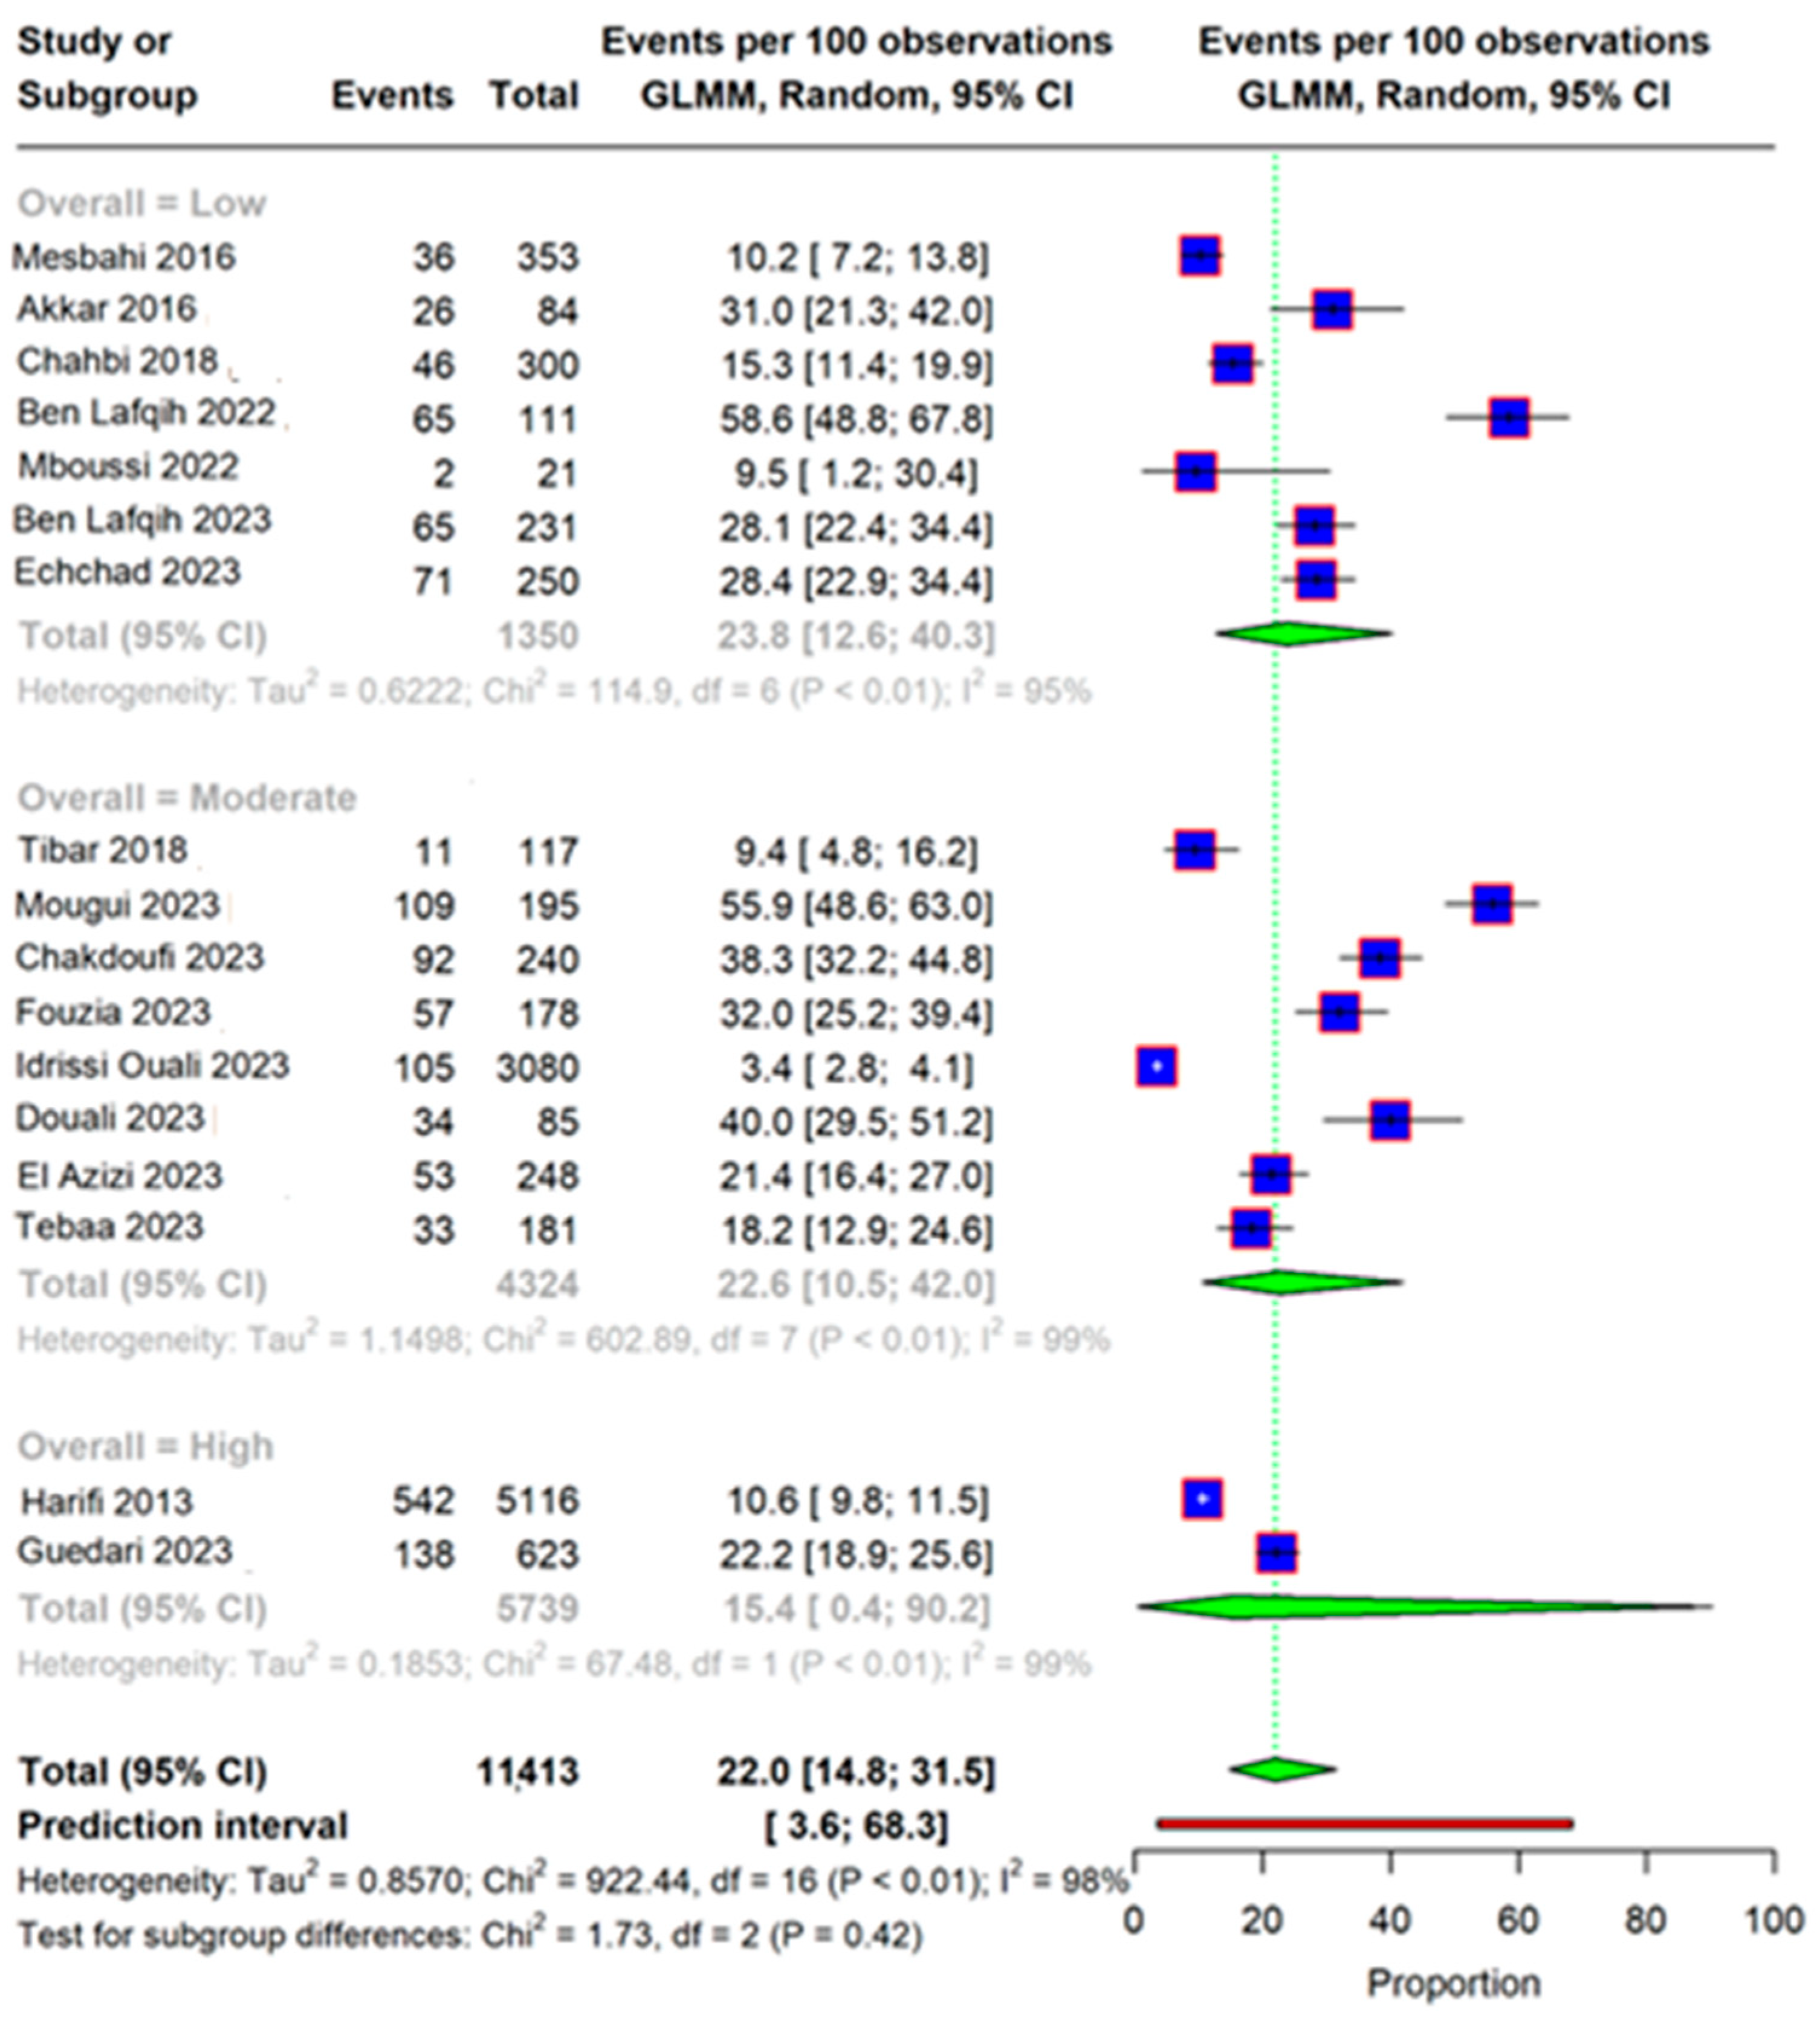
3.2. Quality Assessment
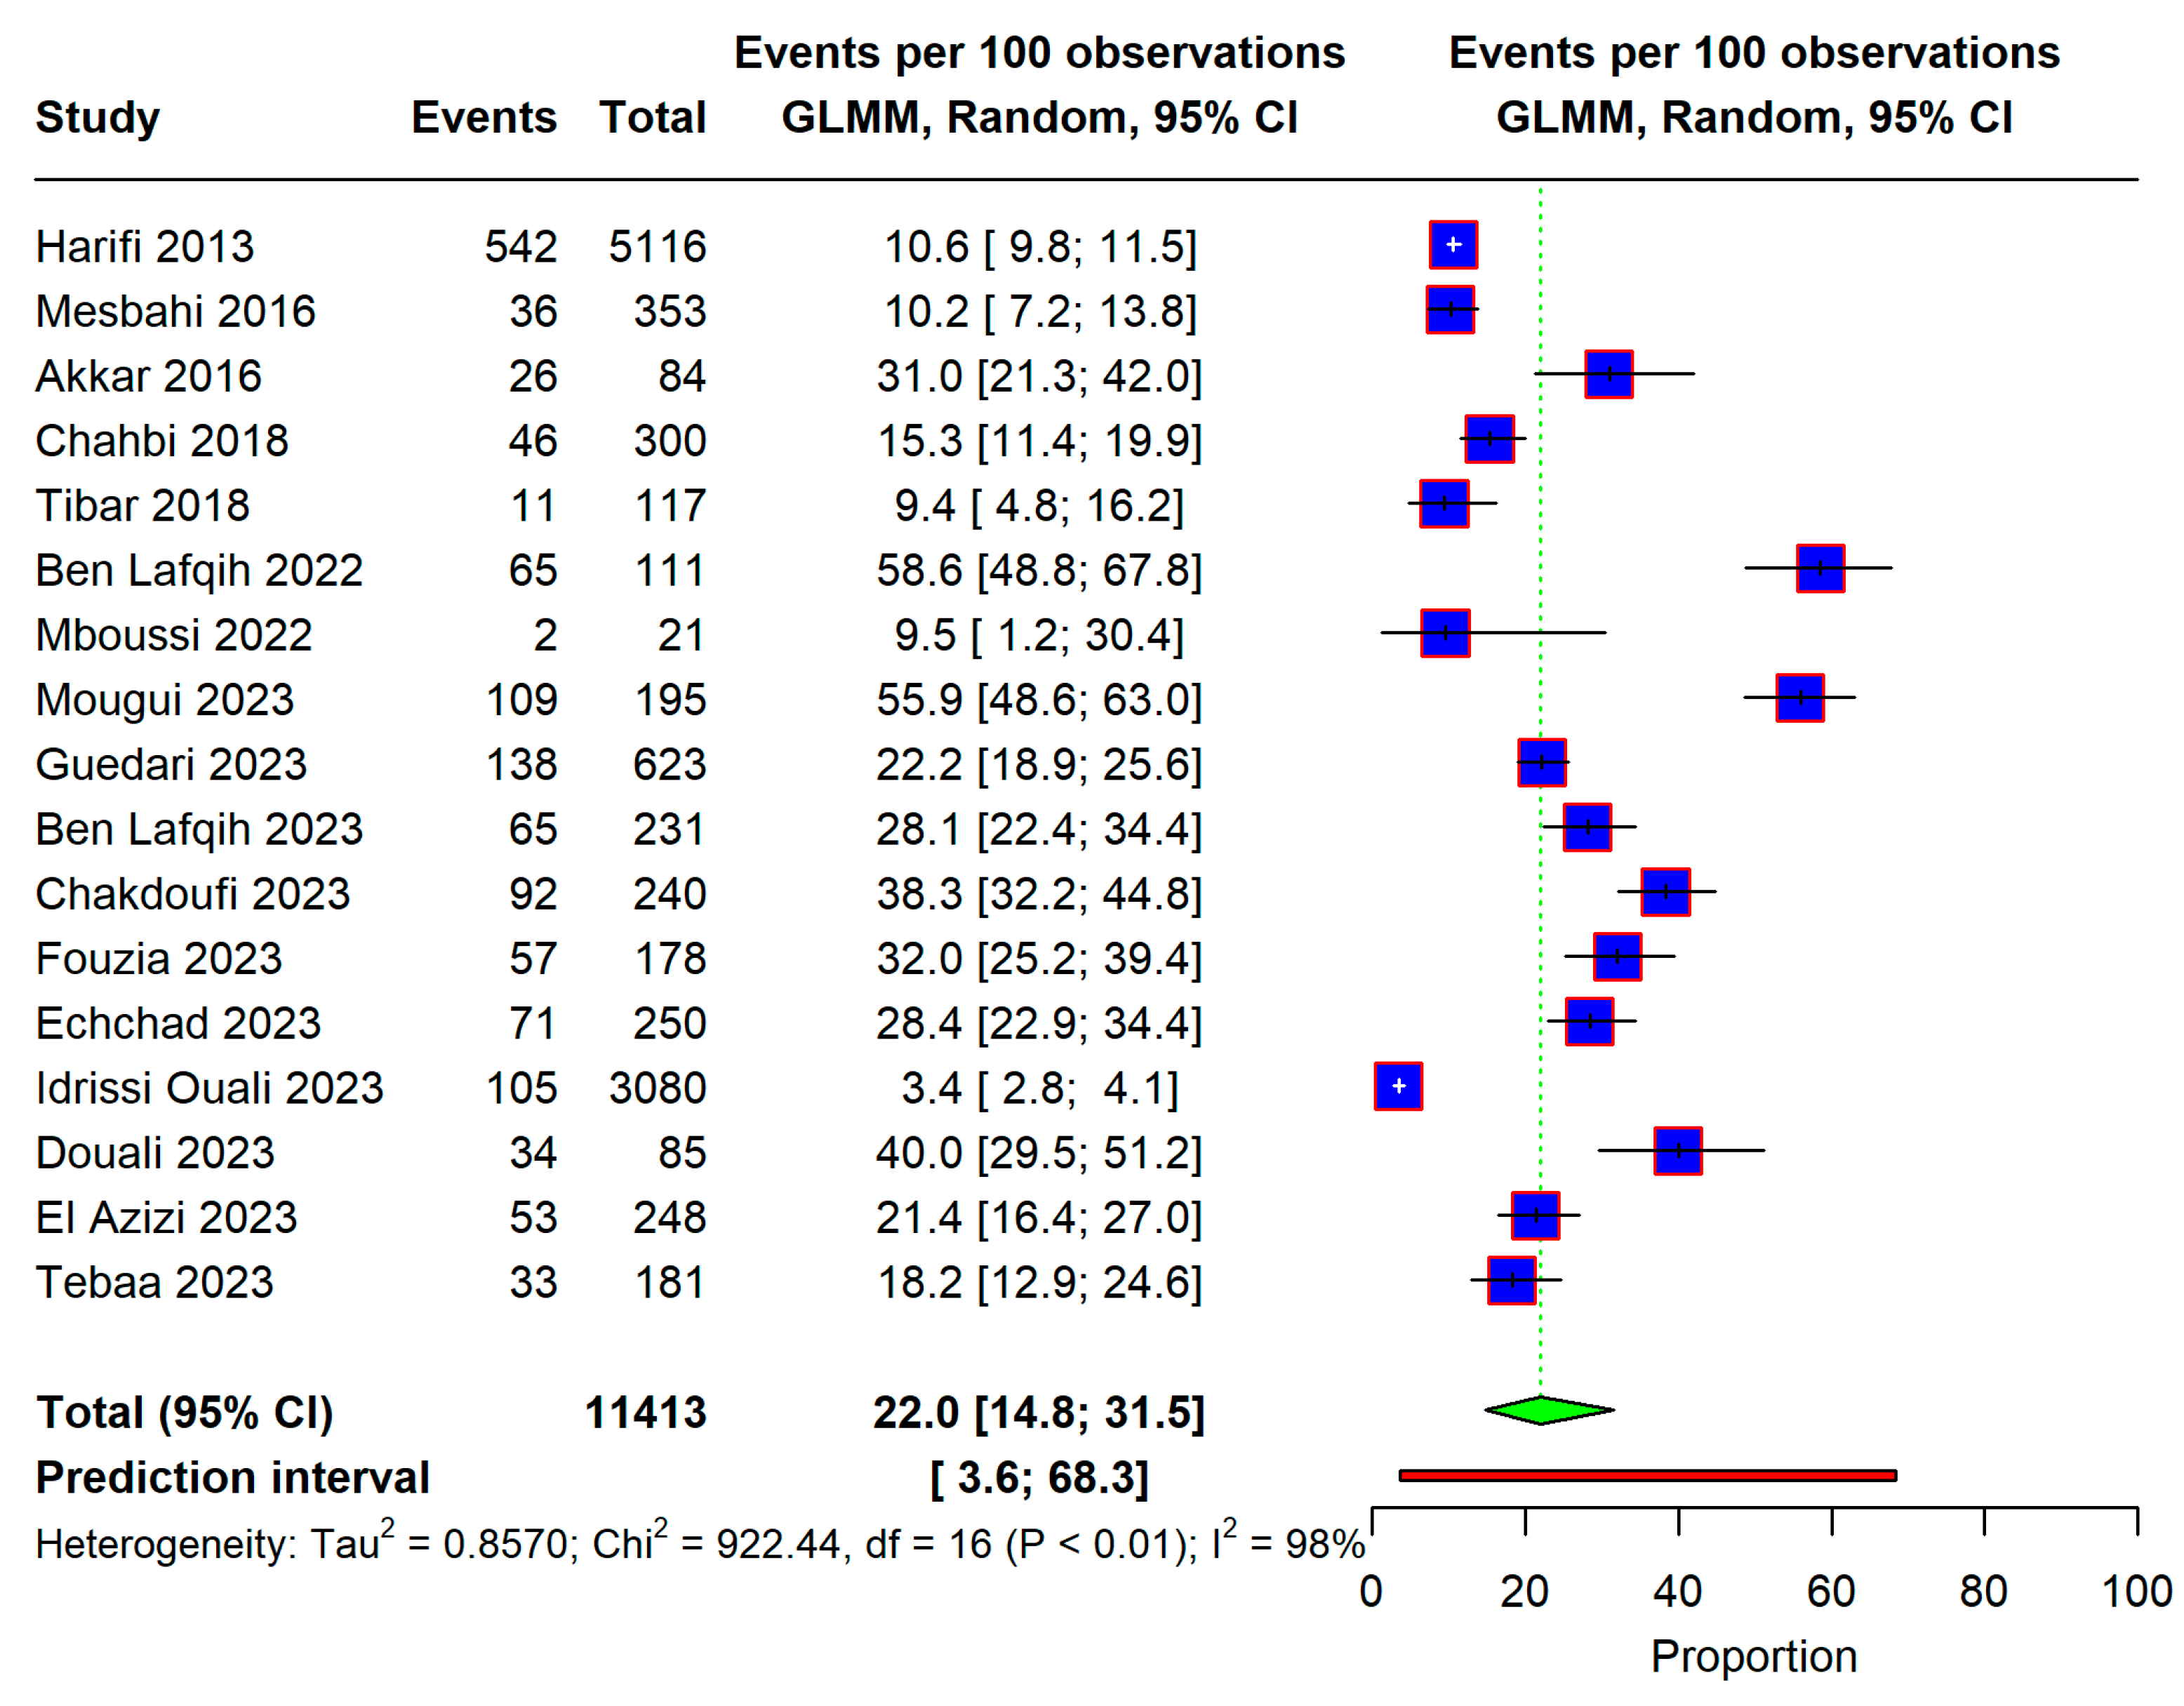
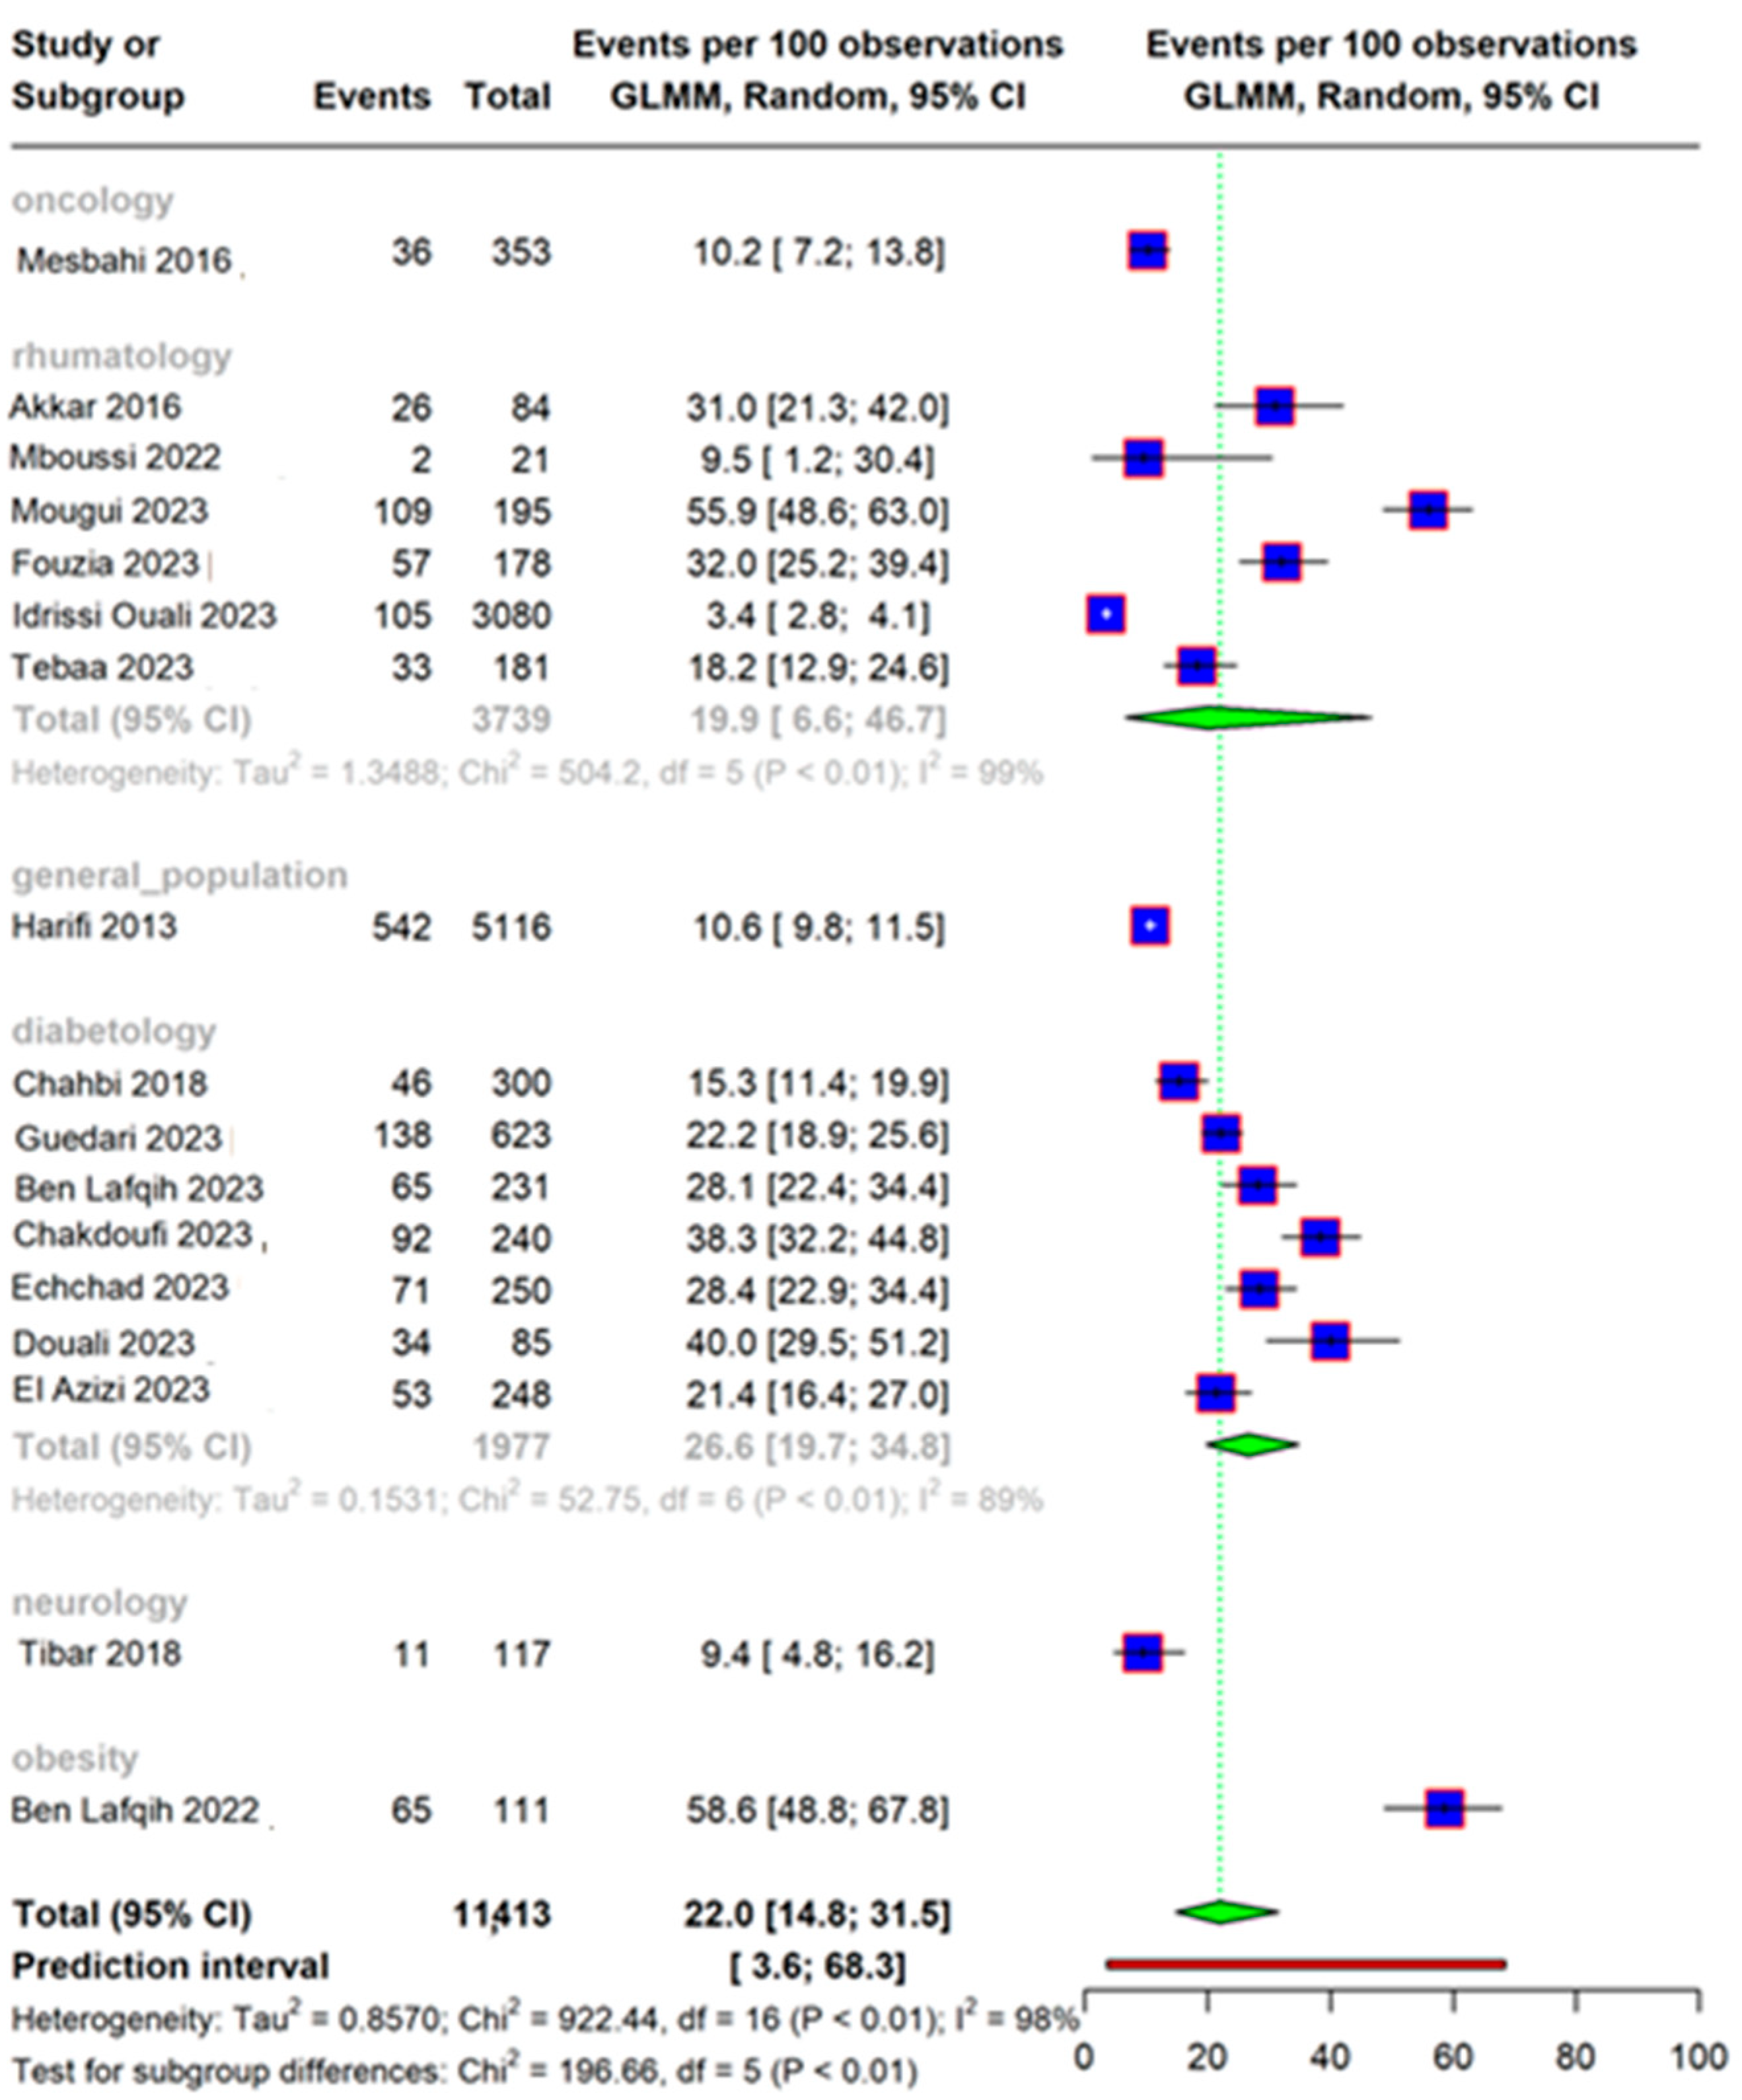
3.3. Overall Prevalence
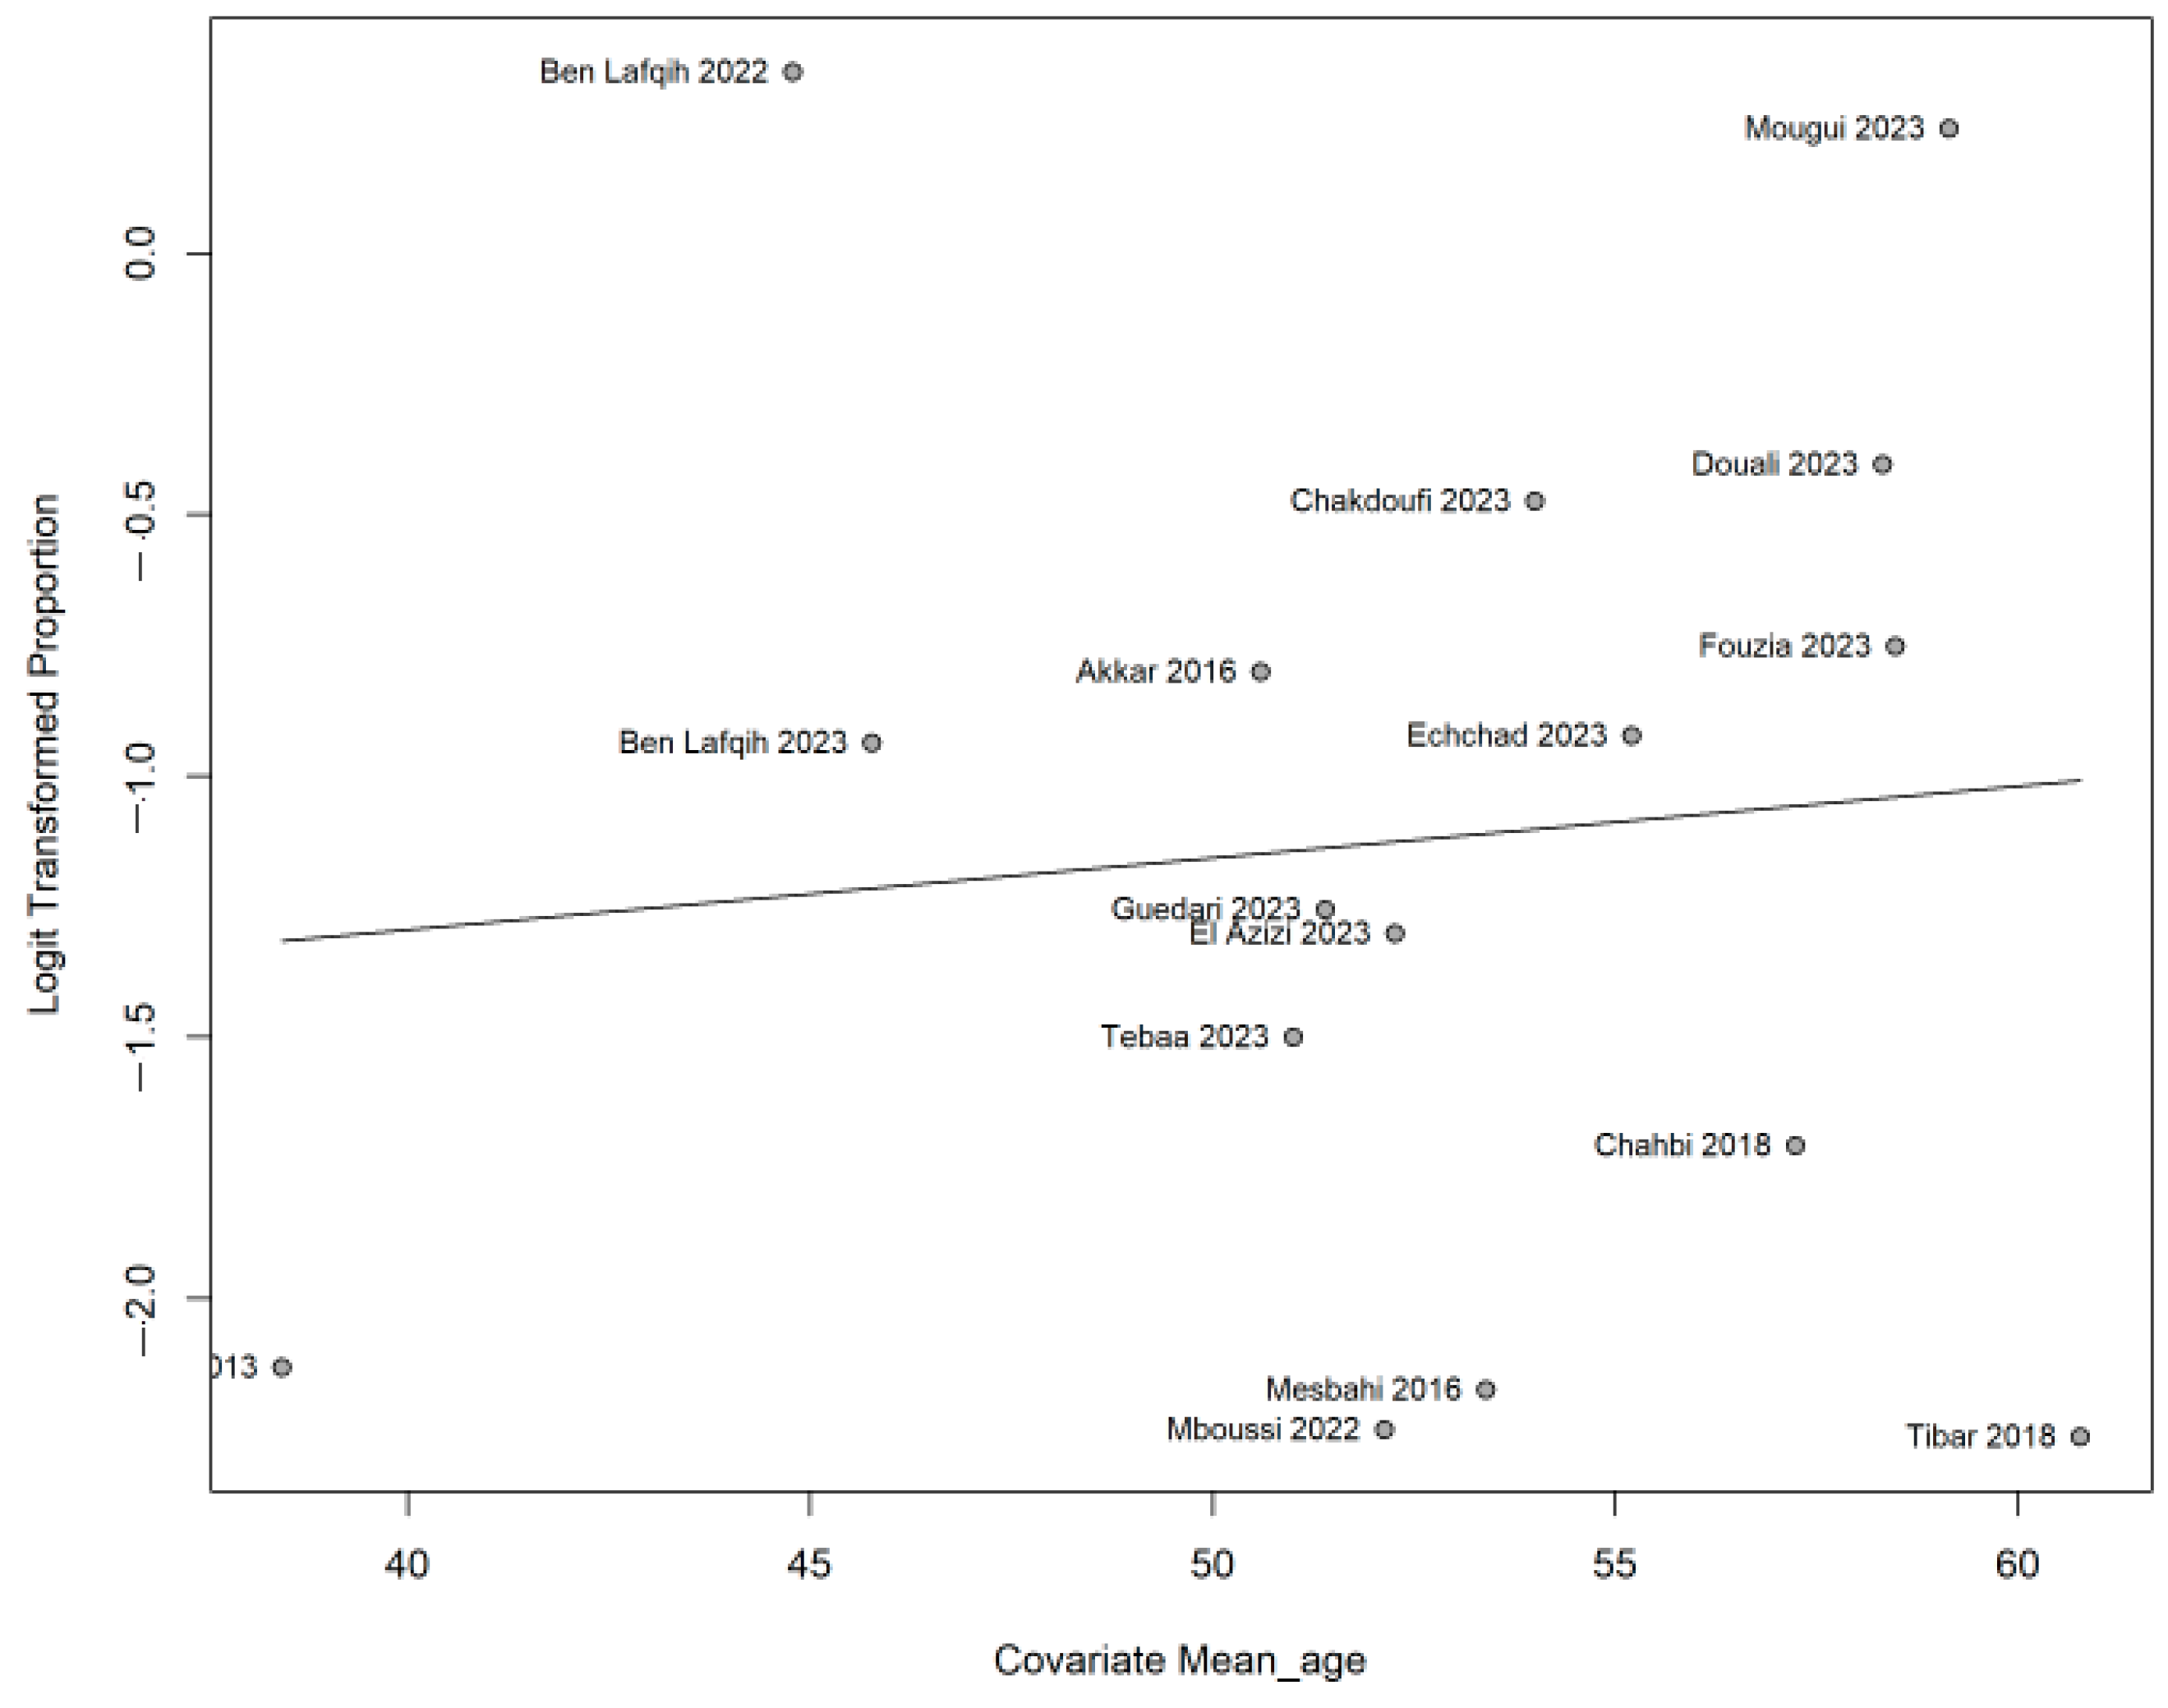
3.4. Subgroup Analysis and Meta-Regression
3.5. Publication Bias
4. Discussion
5. Conclusions
Supplementary Materials
Author Contributions
Funding
Acknowledgments
Conflicts of Interest
References
- Scholz, J.; Finnerup, N.B.; Attal, N.; Aziz, Q.; Baron, R.; Bennett, M.I.; Benoliel, R.; Cohen, M.; Cruccu, G.; Davis, K.D.; et al. The IASP classification of chronic pain for ICD-11: Chronic neuropathic pain. Pain 2019, 160, 53–59. [Google Scholar] [CrossRef] [PubMed]
- Finnerup, N.B.; Kuner, R.; Jensen, T.S. Neuropathic Pain: From Mechanisms to Treatment. Physiol. Rev. 2021, 101, 259–301. [Google Scholar] [CrossRef] [PubMed]
- Baron, R.; Binder, A.; Wasner, G. Neuropathic pain: Diagnosis, pathophysiological mechanisms, and treatment. Lancet Neurol. 2010, 9, 807–819. [Google Scholar] [CrossRef]
- Cavalli, E.; Mammana, S.; Nicoletti, F.; Bramanti, P.; Mazzon, E. The neuropathic pain: An overview of the current treatment and future therapeutic approaches. Int. J. Immunopathol. Pharmacol. 2019, 33, 205873841983838. [Google Scholar] [CrossRef]
- VanDenKerkhof, E.G.; Mann, E.G.; Torrance, N.; Smith, B.H.; Johnson, A.; Gilron, I. An Epidemiological Study of Neuropathic Pain Symptoms in Canadian Adults. Pain Res. Manag. 2016, 2016, 9815750. [Google Scholar] [CrossRef]
- Attal, N.; Bouhassira, D.; Baron, R. Diagnosis and assessment of neuropathic pain through questionnaires. Lancet Neurol. 2018, 17, 456–466. [Google Scholar] [CrossRef]
- Van Hecke, O.; Austin, S.K.; Khan, R.A.; Smith, B.H.; Torrance, N. Neuropathic pain in the general population: A systematic review of epidemiological studies. Pain 2014, 155, 654–662. [Google Scholar] [CrossRef] [PubMed]
- Cruccu, G.; Truini, A.; on behalf of the Neuropathic Pain Special Interest Group of the Italian Society of Neurology (Italian NeuPSIG). Neuropathic Pain: The Scope of the Problem. Pain Ther. 2017, 6, 1–3. [Google Scholar] [CrossRef]
- Page, M.J.; McKenzie, J.E.; Bossuyt, P.M.; Boutron, I.; Hoffmann, T.C.; Mulrow, C.D.; Shamseer, L.; Tetzlaff, J.M.; Brennan, S.E.; Chou, R.; et al. The PRISMA 2020 statement: An updated guideline for reporting systematic reviews. BMJ 2021, 372, n71. [Google Scholar] [CrossRef]
- Shi, J.; Gao, Y.; Zhao, L.; Li, Y.; Yan, M.; Niu, M.M.; Chen, Y.; Song, Z.; Zhang, R.; Zhang, L.; et al. Prevalence of delirium, depression, anxiety, and post-traumatic stress disorder among COVID-19 patients: Protocol for a living systematic review. Syst. Rev. 2020, 9, 258. [Google Scholar] [CrossRef]
- Harifi, G.; Amine, M.; Ait Ouazar, M.; Boujemaoui, A.; Ouilki, I.; Rekkab, I.; Belkhou, A.; El Bouchti, I.; Niamane, R.; El Hassani, S. Prevalence of Chronic Pain with Neuropathic Characteristics in the Moroccan General Population: A National Survey. Pain Med. 2013, 14, 287–292. [Google Scholar] [CrossRef]
- Chahbi, Z.; Lahmar, B.; Hadri, S.E.; Abainou, L.; Kaddouri, S.; Qacif, H.; Baizri, H.; Zyani, M. The prevalence of painful diabetic neuropathy in 300 Moroccan diabetics. Pan Afr. Med. J. 2018, 31, 158. [Google Scholar] [CrossRef] [PubMed]
- Lafqih, M.B.; Ouakrim, H.; Rafi, S.; Mghari, G.E.; Ansari, N.E. Neuropathic Pain in Obese Patients: Prevalence and Impact on Quality of Life. SAS J. Med. 2022, 8, 872–875. [Google Scholar] [CrossRef]
- Mboussi, P.C.M.; Bennani, F.E.; Belouaham, S.; Bara, H.; Mougui, A.; Bouchti, I.E. Pos1182 Epidemiological, Clinical and Therapeutic Aspects of Tabetic Arthropathy in a Population of Southern Morocco. Ann. Rheum. Dis. 2022, 81, 919. [Google Scholar] [CrossRef]
- Mougui, A.; Belouaham, S.; El Bouchti, I. Neuropathic pain in patients with primary knee osteoarthritis: A cross-sectional study. Rom. J. Intern. Med. Rev. 2023, 61, 186–194. [Google Scholar] [CrossRef] [PubMed]
- Lafqih, M.B.; Dafali, N.I.; Rafi, S.; Mghari, G.E.; Ansari, N.E. Neuropathic pain in patients with diabetes: Utility of DN4 questionnaire. World J. Adv. Res. Rev. 2023, 17, 093–096. [Google Scholar] [CrossRef]
- Douali, B. (Department of Endocrinology, Diabetology, Metabolic Diseases and Nutrition, Mohammed VI University Hospital of Marrakech, Morocco). Unpublished abstract. Personal communication, 2023.
- Tebaa, D. (Rheumatology Department, Mohammed VI University Hospital of Marrakech, Morocco). Unpublished abstract. Personal communication, 2023.
- Mesbahi, Z.; Belkhadir, Z.; Cherrah, Y.; Hassar, M.; Ahid, S. Assessment of cancer pain management in ambulatory care in Morocco. Bull. Cancer 2017, 104, 295–297. [Google Scholar] [CrossRef]
- Tibar, H.; El Bayad, K.; Bouhouche, A.; Ait Ben Haddou, E.H.; Benomar, A.; Yahyaoui, M.; Benazzouz, A.; Regragui, W. Non-Motor Symptoms of Parkinson’s Disease and Their Impact on Quality of Life in a Cohort of Moroccan Patients. Front. Neurol. 2018, 9, 170. [Google Scholar] [CrossRef]
- Idrissi Ouali, A. (Rheumatology department, Hassan II University Hospital, Fez, Morocco). Unpublished abstract. Personal communication, 2023.
- El Azizi, C. (Department of Endocrinology, Diabetology, Metabolic Diseases and Nutrition, Hassan II University Hospital, Fez, Morocco). Unpublished abstract. Personal communication, 2023.
- Fouzia, H.; Taik, F.Z.; Berrichi, I.; Soba, N.; Fourtassi, M.; Abourazzak, F.E. AB1196 Neuropathic Pain in Gonarthrosis: Prevalence and Associated Factors. Ann. Rheum. Dis. 2023, 82, 1827–1828. [Google Scholar] [CrossRef]
- Akkar, O.; Lehraiki, M.; Azzouzi, H.; Boutoualla, L.; Ichchou, L. Douleur neuropathique dans la polyarthrite rhumatoïde: Prévalence et association avec les paramètres de la maladie. Rev. Rhum. 2016, 83, A272. [Google Scholar] [CrossRef]
- Gueddari, A.; Essabah, H.N.; El, A.S.; Chadli, A. Prevalence and Predictive Factors of Painful Diabetic Peripheral Neuropathy in The Department of Endocrinology and Metabolic Diseases of The Uhc Ibn Rochd In Casablanca: About 623 cases. Endocr. Abstr. 2023, 90, P371. [Google Scholar] [CrossRef]
- Chakdoufi, S.; Moumen, A.; Guerboub, A. Dyslipidemia and Diabetic Retinopathy in Moroccans Type 2 Diabetics Patients: A Cross-Sectional Study. Res. Rev. 2023, 6, 2471–2479. [Google Scholar] [CrossRef]
- Echchad, L.; El, M.K.; Azriouil, M.; Rifai, K.; Iraqi, H.; El, H.G.M. Diabetic peripheral neuropathy: Prevalence and predictive factors. Endocr. Abstr. 2023, 90, EP366. [Google Scholar] [CrossRef]
- Unal-Cevik, I.; Sarioglu-Ay, S.; Evcik, D. A Comparison of the DN4 and LANSS Questionnaires in the Assessment of Neuropathic Pain: Validity and Reliability of the Turkish Version of DN4. J. Pain 2010, 11, 1129–1135. [Google Scholar] [CrossRef]
- Shakya, B.M.; Shrestha, A.; Poudyal, A.K.; Shrestha, N.; Acharya, B.; Gurung, R.; Shakya, S. Nepalese version of Douleur Neuropathique 4 (DN4) questionnaire for detection of neuropathic pain signs and symptoms: Translation and psychometric properties. PLoS ONE 2023, 18, e0287737. [Google Scholar] [CrossRef]
- Matsuki, Y.; Sukenaga, N.; Miyagi, K.; Tsunetoh, T.; Mizogami, M.; Shigemi, K.; Maeda, L.; Hirose, M. Reliability and validity of the Japanese translation of the DN4 Diagnostic Questionnaire in patients with neuropathic pain. J. Anesth. 2018, 32, 403–408. [Google Scholar] [CrossRef]
- Harifi, G.; Ouilki, I.; El Bouchti, I.; Ait Ouazar, M.; Belkhou, A.; Younsi, R.; Amine, M.; Tazi, I.; Abouqal, R.; Niamane, R.; et al. Validity and Reliability of the Arabic Adapted Version of the DN4 Questionnaire (Douleur Neuropathique 4 Questions) for Differential Diagnosis of Pain Syndromes with a Neuropathic or Somatic Component. Pain Pract. 2011, 11, 139–147. [Google Scholar] [CrossRef] [PubMed]
- Van Den Kerkhof, E.G.; Stitt, L.; Clark, A.J.; Gordon, A.; Lynch, M.; Morley-Forster, P.K.; Nathan, H.J.; Smyth, C.; Toth, C.; Ware, M.A.; et al. Sensitivity of the DN4 in Screening for Neuropathic Pain Syndromes. Clin. J. Pain 2018, 34, 30–36. [Google Scholar] [CrossRef]
- Torrance, N.; Smith, B.H.; Bennett, M.I.; Lee, A.J. The Epidemiology of Chronic Pain of Predominantly Neuropathic Origin. Results From a General Population Survey. J. Pain 2006, 7, 281–289. [Google Scholar] [CrossRef]
- Baskozos, G.; Hébert, H.L.; Pascal, M.M.V.; Themistocleous, A.C.; Macfarlane, G.J.; Wynick, D.; Bennett, D.L.H.; Smith, B.H. Epidemiology of neuropathic pain: An analysis of prevalence and associated factors in UK Biobank. Pain Rep. 2023, 8, e1066. [Google Scholar] [CrossRef]
- Sloan, G.; Shillo, P.; Selvarajah, D.; Wu, J.; Wilkinson, I.D.; Tracey, I.; Anand, P.; Tesfaye, S. A new look at painful diabetic neuropathy. Diabetes Res. Clin. Pract. 2018, 144, 177–191. [Google Scholar] [CrossRef] [PubMed]
- Garoushi, S.; Johnson, M.I.; Tashani, O.A. Point Prevalence of Painful Diabetic Neuropathy in the Middle East and North Africa Region: A Systematic Review with Meta-analysis. Libyan J. Med. Sci. 2018, 2, 85. [Google Scholar] [CrossRef]
- Miladi, S.; Yasmine, M.; Fazaa, A.; Mariem, S.; Ouenniche, K.; Souebni, L.; Kassab, S.; Chekili, S.; Ben Abdelghani, K.; Laatar, A. AB0717 Prevalence of Migraine and Neuropathic Pain Among Patients with Rheumatic Diseases. Ann. Rheum. Dis. 2021, 80, 1390. [Google Scholar] [CrossRef]
- Garip, Y.; Eser, F.; Kiliçarslan, A.; Bodur, H. Prevalence of Neuropathic Pain in Rheumatic Disorders: Association With Disease Activity, Functional Status and Quality of Life. Arch. Rheumatol. 2015, 30, 231–237. [Google Scholar] [CrossRef]


| Author and Year | City | Specialty | Sample Size | Age Mean ± SD | Score | Cutt off DN4 | Cross-Cultural Adaptation | n (%) | Overall Quality |
|---|---|---|---|---|---|---|---|---|---|
| Harifi 2013 [11] | Marrakech | general population | 5116 | 38.45 ± 14.13 | DN4 | 3 | Yes | 542 (10.6) | high |
| Mesbahi 2016 [19] | Rabat | oncology | 353 | 53.40 | DN4 | No | 36 (10.2) | low | |
| Akkar 2016 [24] | Oujda | rheumatology | 84 | 50.6 ± 12.29 | DN4 | No | 26 (31.0) | low | |
| Chahbi 2018 [12] | Marrakech | diabetology | 300 | 57.24 ± 9.79 | DN4 | 4 | No | 46 (15.4) | low |
| Tibar 2018 [20] | Rabat | neurology | 117 | 60.77 ± 11.36 | DN4 | 3 | No | 11 (13.0) | moderate |
| Ben Lafqih 2022 [13] | Marrakech | obesity | 111 | 44.79 ± 14.75 | DN4 | No | 65 (59.0) | low | |
| Mboussi 2022 [14] | Marrakech | rheumatology | 21 | 52.14 | other | 2 (9.5) | low | ||
| Mougui 2023 [15] | Marrakech | rheumatology | 195 | 59.15 | DN4 | 4 | Yes | 109 (55.9) | moderate |
| Guedari 2023 [25] | Casablanca | diabetology | 623 | 51.40 | DN4 | 4 | No | 138 (22.2) | high |
| Ben Lafqih 2023 [16] | Marrakech | diabetology | 231 | 45.77 | DN4 | 4 | No | 65 (28.1) | low |
| Chakdoufi 2023 [26] | Rabat | diabetology | 240 | 54.00 | DN4 | No | 92 (38.2) | moderate | |
| Fouzia 2023 [23] | Tanger | rheumatology | 178 | 58.0 ± 9.19 | DN4 | 4 | Yes | 57 (32.7) | moderate |
| Echchad 2023 [27] | Rabat | diabetology | 250 | 55.20 ± 14.80 | other | 71 (28.4) | low | ||
| Idrissi Ouali 2023 [21] | Fès | rheumatology | 3080 | DN4 | 4 | No | 105 (3.4) | moderate | |
| Douali 2023 [17] | Marrakech | diabetology | 85 | 58.32 ± 10.89 | DN4 | 4 | No | 34 (40.0) | moderate |
| El Azizi 2023 [22] | Fès | diabetology | 248 | 52.27 ± 12.00 | DN4 | 4 | No | 53 (21.4) | moderate |
| Tebaa 2023 [18] | Marrakech | rheumatology | 181 | 51.00 ± 13.00 | DN4 | 33 (31.0) | moderate |
Disclaimer/Publisher’s Note: The statements, opinions and data contained in all publications are solely those of the individual author(s) and contributor(s) and not of MDPI and/or the editor(s). MDPI and/or the editor(s) disclaim responsibility for any injury to people or property resulting from any ideas, methods, instructions or products referred to in the content. |
© 2025 by the authors. Licensee MDPI, Basel, Switzerland. This article is an open access article distributed under the terms and conditions of the Creative Commons Attribution (CC BY) license (https://creativecommons.org/licenses/by/4.0/).
Share and Cite
Zeghari, Z.; Belayachi, J.; El Ouardi, R.; Abouqal, R. Prevalence of Neuropathic Pain in Morocco: A Systematic Review and Meta-Analysis. Life 2025, 15, 780. https://doi.org/10.3390/life15050780
Zeghari Z, Belayachi J, El Ouardi R, Abouqal R. Prevalence of Neuropathic Pain in Morocco: A Systematic Review and Meta-Analysis. Life. 2025; 15(5):780. https://doi.org/10.3390/life15050780
Chicago/Turabian StyleZeghari, Zhor, Jihane Belayachi, Redouan El Ouardi, and Redouane Abouqal. 2025. "Prevalence of Neuropathic Pain in Morocco: A Systematic Review and Meta-Analysis" Life 15, no. 5: 780. https://doi.org/10.3390/life15050780
APA StyleZeghari, Z., Belayachi, J., El Ouardi, R., & Abouqal, R. (2025). Prevalence of Neuropathic Pain in Morocco: A Systematic Review and Meta-Analysis. Life, 15(5), 780. https://doi.org/10.3390/life15050780