

The Relationship Between Driving Performance and Lower Limb Motor Function After Total Knee Arthroplasty Using a Driving Simulator: A Pilot Study on Elucidating Factors Influencing Accelerator and Brake Operations
 , , , , and
Abstract
1. Introduction
2. Methods
2.1. Study Design
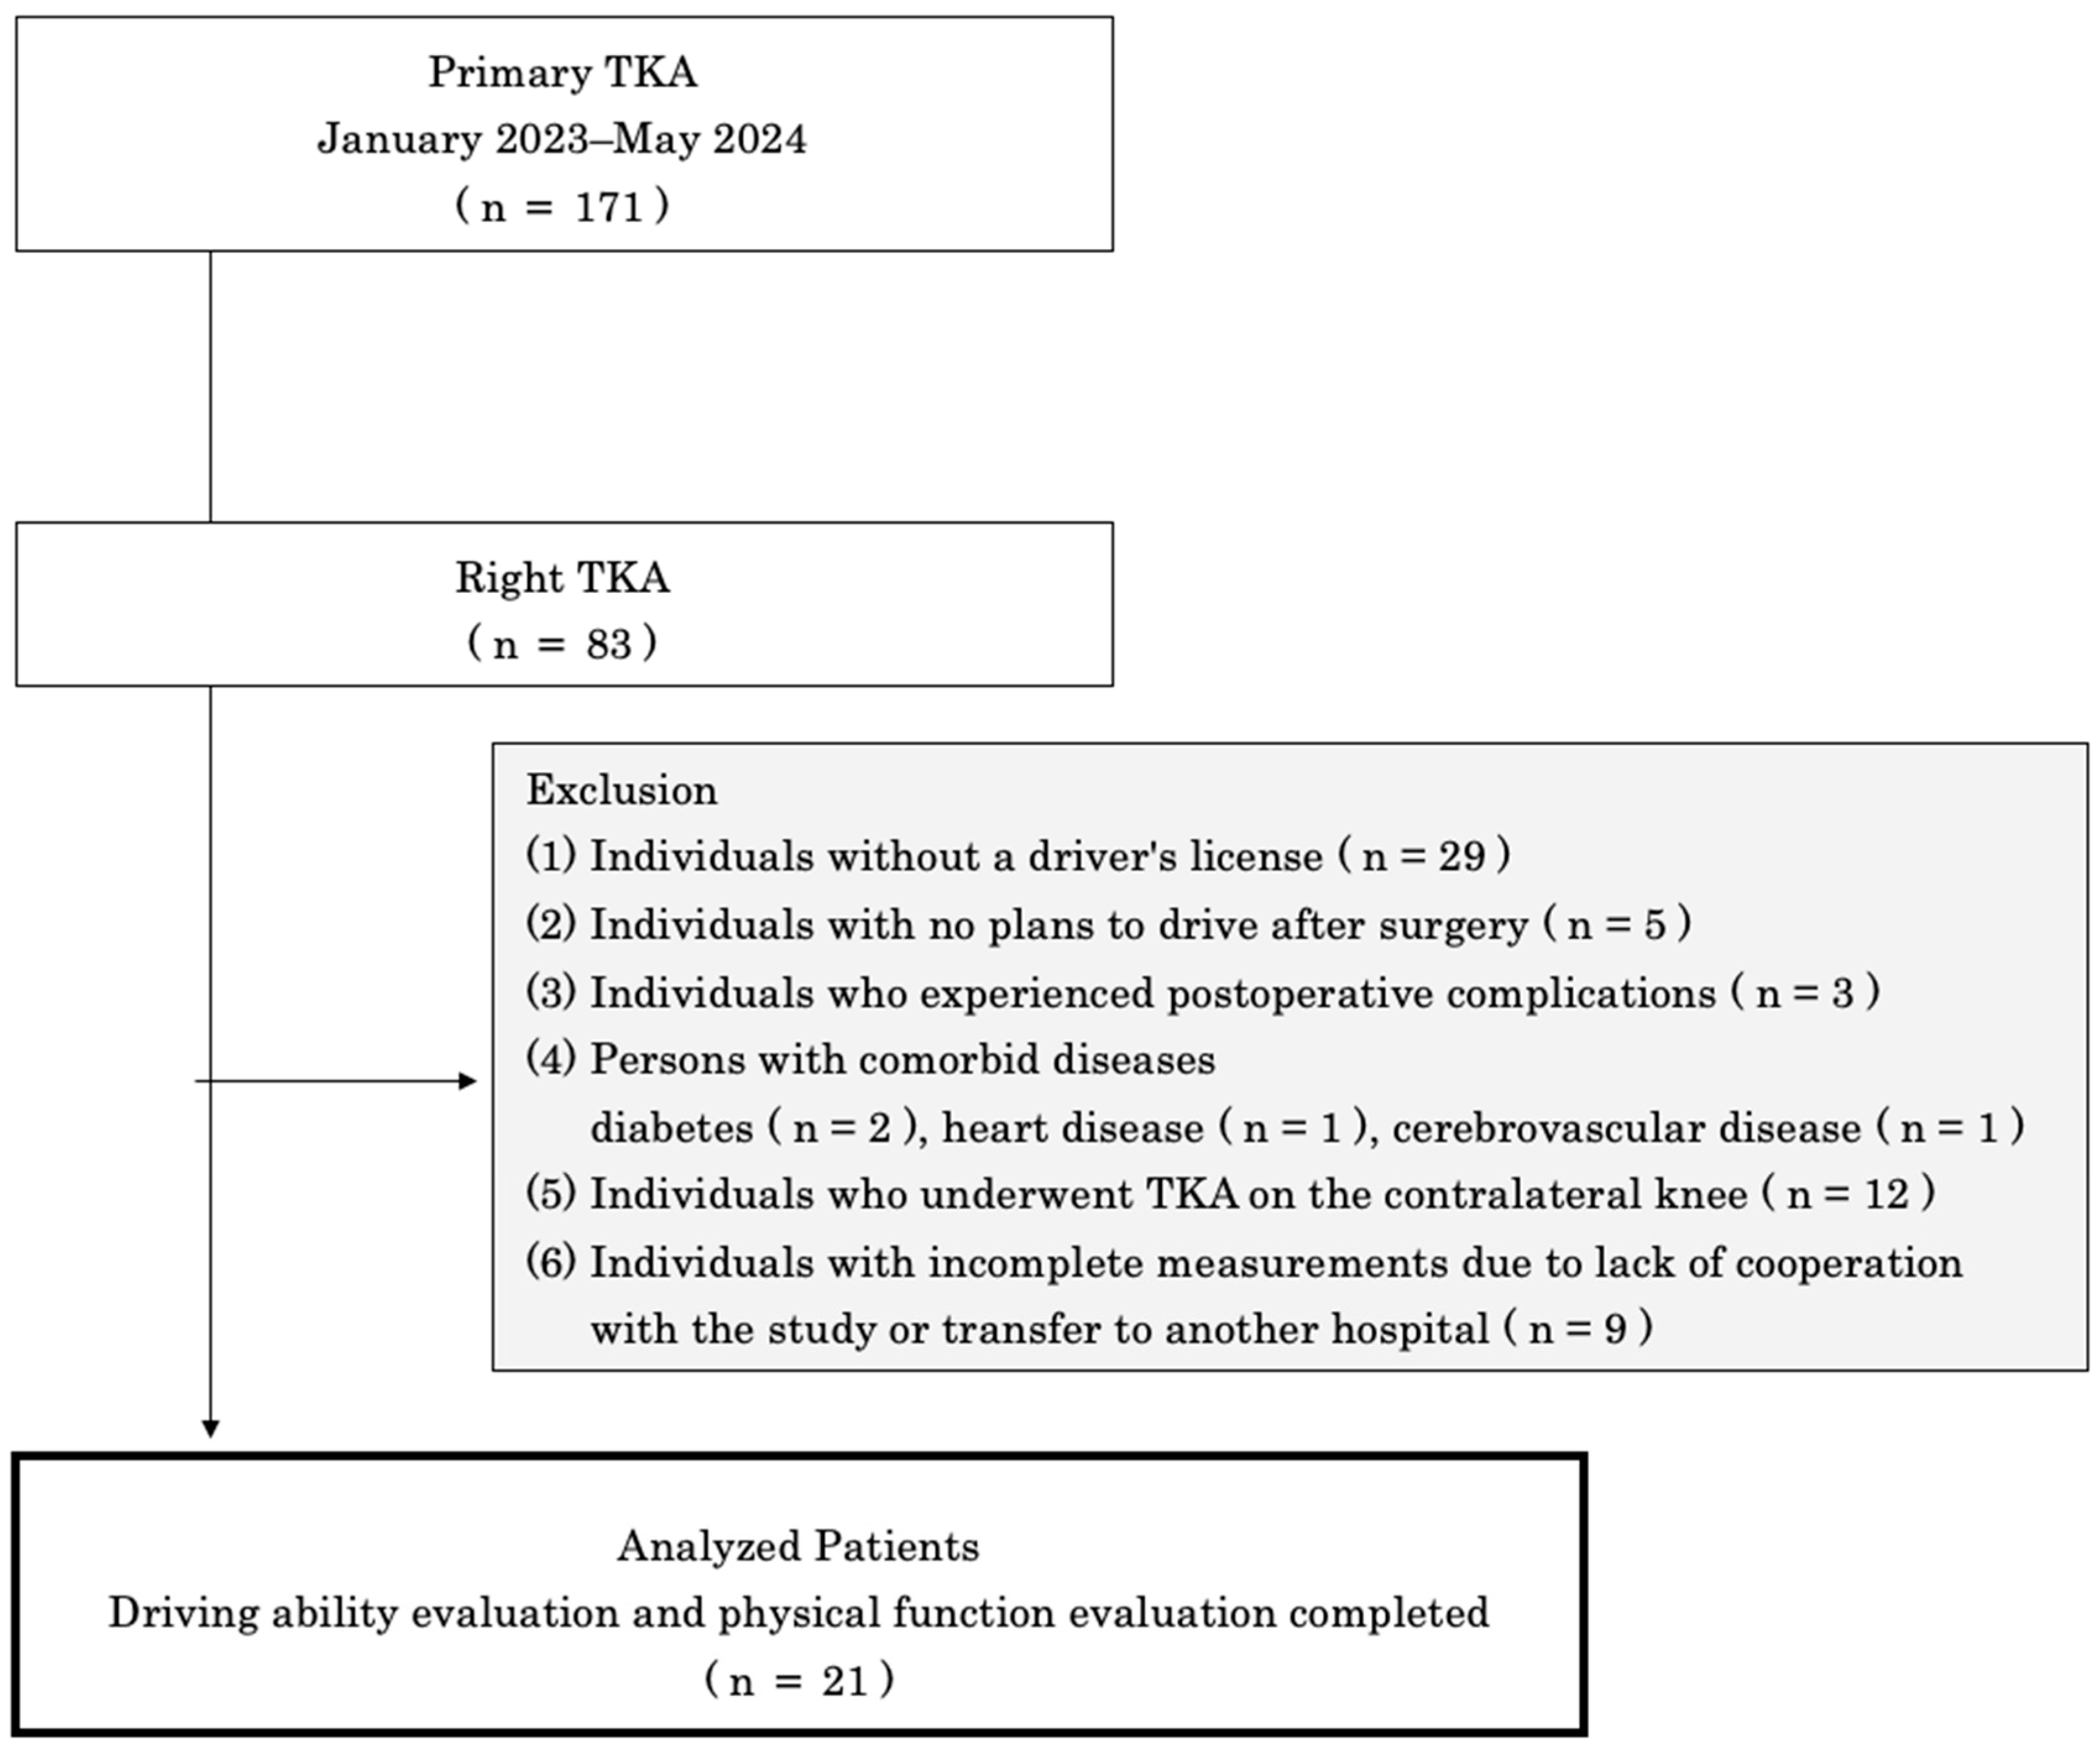
2.2. Participants
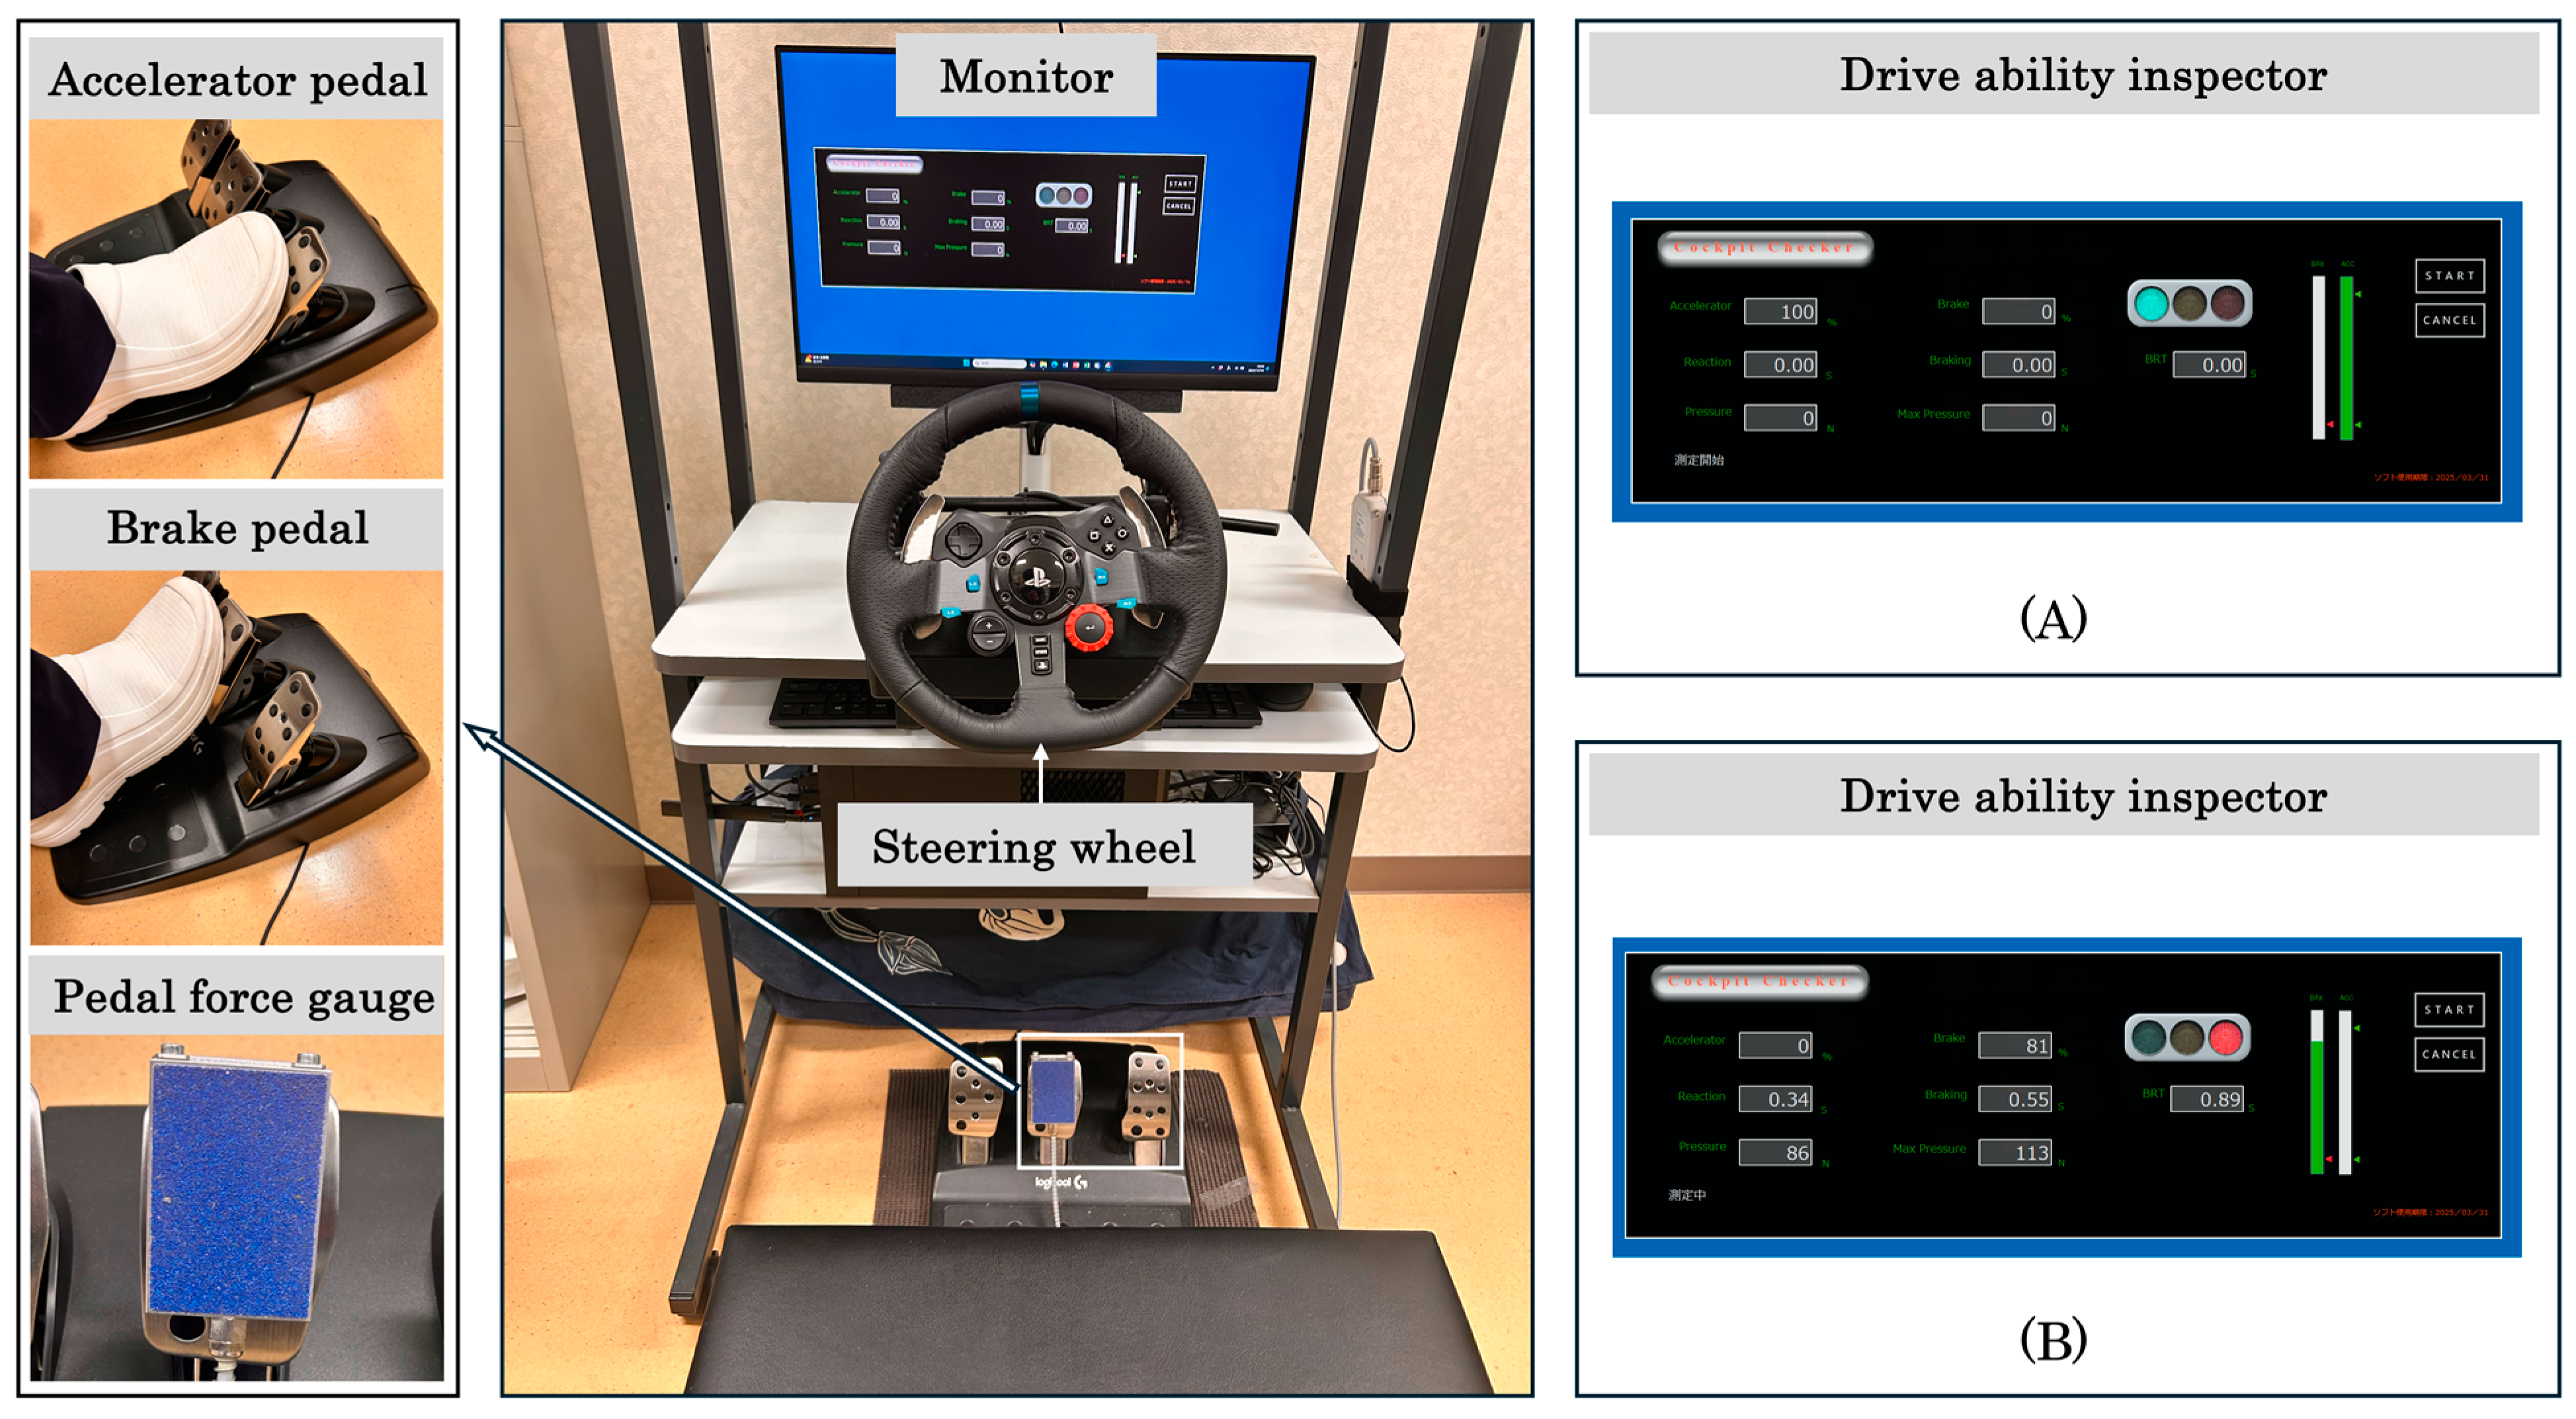
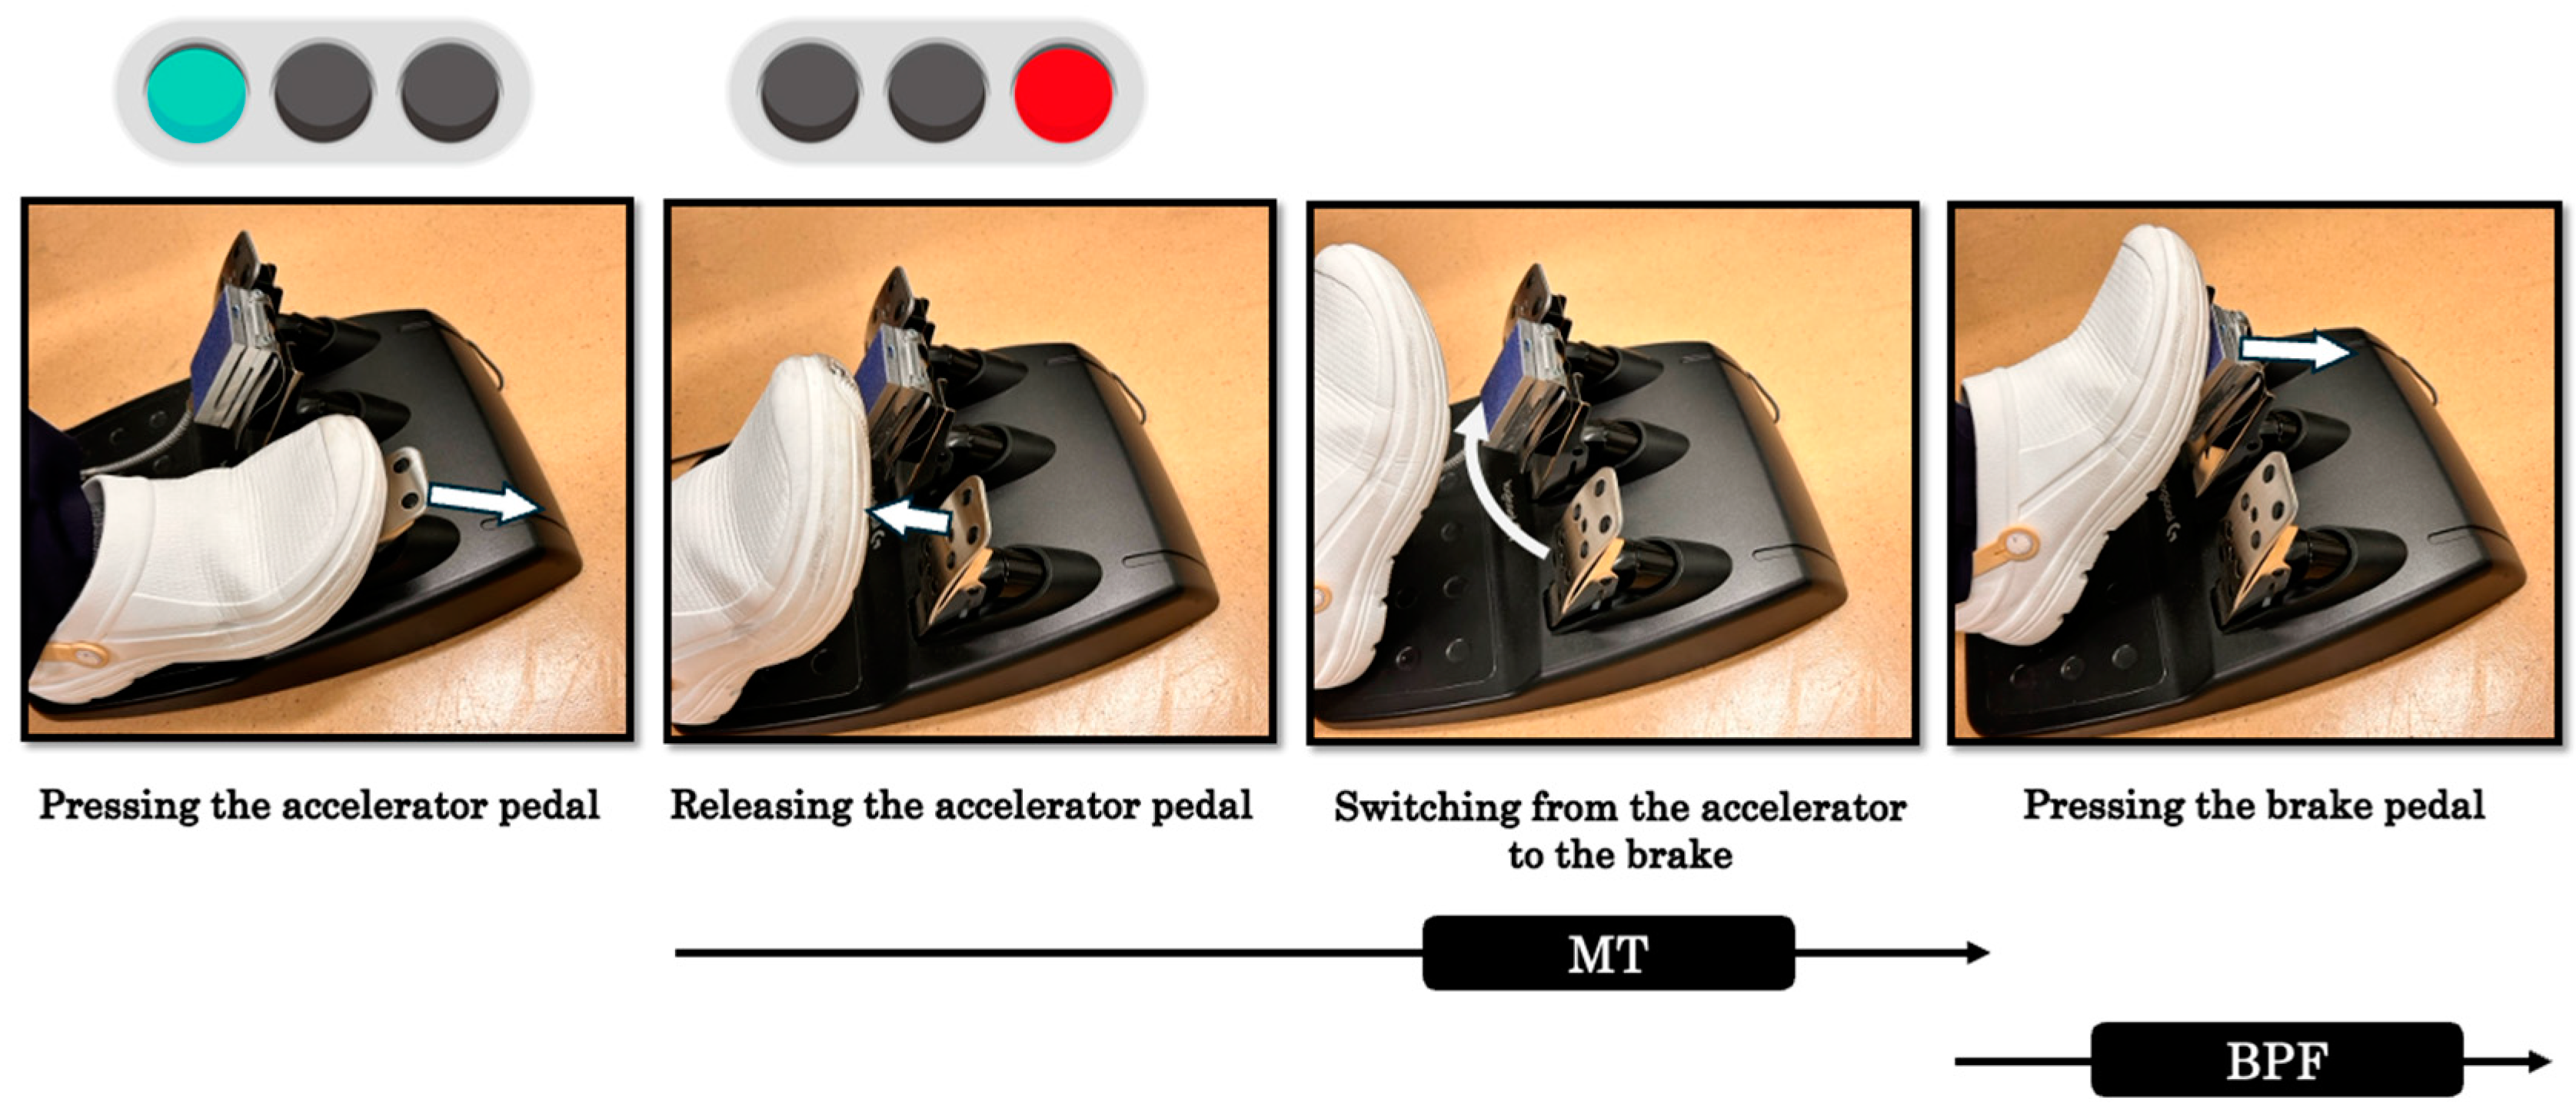
2.3. Tasks
2.4. Measurement Procedures
2.4.1. MT and BPF
2.4.2. ROM and Lower-Limb Muscle Strength
2.4.3. Gait Performance
2.4.4. Visual Analog Scale (VAS) and Tampa Scale of Kinesiophobia (TSK)
2.4.5. Statistical Analyses
3. Results
3.1. MT, BPF, and Physical Function
3.2. Correlation Among MT, BPF, and Physical Function
3.3. Multiple Regression Analysis of MT, BPF, and Physical Function
3.4. Validity of Sample Size
4. Discussion
4.1. Clinical Characteristics of MT, BPF, and Physical Function
4.2. Relationships Between MT, BPF, and Physical Function
4.3. Effects of Physical Function on MT, BPF
4.4. Limitations and Future Directions
5. Conclusions
Author Contributions
Funding
Institutional Review Board Statement
Informed Consent Statement
Data Availability Statement
Acknowledgments
Conflicts of Interest
References
- Ichikawa, M.; Inada, H.; Nakahara, S. Revisiting Older Drivers’ Risks of At-fault Motor Vehicle Collisions in Japan. J. Epidemiol. 2024, 34, 295–300. [Google Scholar] [CrossRef] [PubMed]
- Jordan, M.; Hofmann, U.K.; Grunwald, J.; Meyer, M.; Sachsenmaier, S.; Wulker, N.; Kluba, T.; Ipach, I. Influence of left- and right-side total hip arthroplasty on the ability to perform an emergency stop while driving a car. Arch. Phys. Med. Rehabil. 2014, 95, 1702–1709. [Google Scholar] [CrossRef] [PubMed]
- Kirschbaum, S.; Fuchs, M.; Otto, M.; Gwinner, C.; Perka, C.; Senturk, U.; Pfitzner, T. Reaction time and brake pedal force after total knee replacement: Timeframe for return to car driving. Knee Surg. Sports Traumatol. Arthrosc. 2021, 29, 3213–3220. [Google Scholar] [CrossRef] [PubMed]
- Park, Y.; Bae, Y. Brake time is correlated with lower extremity strength, dynamic balance and low-contrast sensitivity in unpredictable driving situations in elderly drivers compared with young drivers: A cross-sectional study. Geriatr. Gerontol. Int. 2020, 20, 571–577. [Google Scholar] [CrossRef]
- Alonso, A.C.; Peterson, M.D.; Busse, A.L.; Jacob-Filho, W.; Borges, M.T.A.; Serra, M.M.; Luna, N.M.S.; Marchetti, P.H.; Greve, J. Muscle strength, postural balance, and cognition are associated with braking time during driving in older adults. Exp. Gerontol. 2016, 85, 13–17. [Google Scholar] [CrossRef]
- Hartman, J.; Thornley, P.; Oreskovich, S.; Adili, A.; Bedi, A.; Khan, M. Braking Time Following Total Knee Arthroplasty: A Systematic Review. J. Arthroplast. 2018, 33, 284–290.e1. [Google Scholar] [CrossRef]
- Zhang, W.; Moskowitz, R.W.; Nuki, G.; Abramson, S.; Altman, R.D.; Arden, N.; Bierma-Zeinstra, S.; Brandt, K.D.; Croft, P.; Doherty, M.; et al. OARSI recommendations for the management of hip and knee osteoarthritis, Part II: OARSI evidence-based, expert consensus guidelines. Osteoarthr. Cartil. 2008, 16, 137–162. [Google Scholar] [CrossRef]
- Uchio, Y.; Ishijima, M.; Ikeuchi, M.; Ikegawa, S.; Ishibashi, Y.; Omori, G.; Shiba, N.; Takeuchi, R.; Tanaka, S.; Tsumura, H.; et al. Japanese Orthopaedic Association (JOA) Clinical Practice Guidelines on the Management of Osteoarthritis of the Knee; Nankodo: Tokyo, Japan, 2023; p. 147. [Google Scholar]
- Giannoudis, V.; Guy, S.; Romano, R.; Carsten, O.; Pandit, H.; van Duren, B. Doctor when can I drive? Braking response after knee arthroplasty: A systematic review & meta-analysis of brake reaction time. Knee 2021, 30, 214–240. [Google Scholar]
- Huang, H.T.; Liang, J.M.; Hung, W.T.; Chen, Y.Y.; Guo, L.Y.; Wu, W.L. Timeframe for return to driving for patients with minimally invasive knee arthroplasty is associated with knee performance on functional tests. Bmc Musculoskelet. Disord. 2014, 15, 198. [Google Scholar] [CrossRef]
- Gotlin, R.S.; Sherman, A.L.; Sierra, N.; Kelly, M.; Scott, W.N. Measurement of Brake Response Time After Right Anterior Cruciate Ligament Reconstruction. Arthrosc. J. Arthrosc. Relat. Surg. 2000, 16, 151–155. [Google Scholar] [CrossRef]
- Hau, R.; Csongvay, S.; Bartlett, J. Driving reaction time after right knee arthroscopy. Knee Surg. Sports Traumatol. Arthrosc. 2000, 8, 89–92. [Google Scholar] [CrossRef] [PubMed]
- Marecek, G.S.; Schafer, M.F. Driving after orthopaedic surgery. J. Am. Acad. Orthop. Surg. 2013, 21, 696–706. [Google Scholar] [CrossRef] [PubMed]
- Jordan, M.; Hofmann, U.K.; Rondak, I.; Gotze, M.; Kluba, T.; Ipach, I. Brake response time is significantly impaired after total knee arthroplasty: Investigation of performing an emergency stop while driving a car. Am. J. Phys. Med. Rehabil. 2015, 94, 665–676. [Google Scholar] [CrossRef] [PubMed]
- Marques, C.J.; Cabri, J.; Barreiros, J.; Carita, A.I.; Friesecke, C.; Loehr, J.F. The effects of task complexity on brake response time before and after primary right total knee arthroplasty. Arch. Phys. Med. Rehabil. 2008, 89, 851–855. [Google Scholar] [CrossRef]
- Spalding, T.J.; Kiss, J.; Kyberd, P.; Turner-Smith, A.; Simpson, A.H. Driver reaction times after total knee replacement. J. Bone Jt. Surg. Br. 1994, 76, 754–756. [Google Scholar] [CrossRef]
- Sotokawa, T.; Nasu, S.; Ikuta, J.; Sonohara, K. Evaluation of driving fitness using driving simulators in patients with right-hemisphere damage: An unmatched case-control study. Top. Stroke Rehabil. 2024, 31, 167–177. [Google Scholar] [CrossRef]
- Kagino, S.; Tanaka, H.; Miyazaki, N.; Naito, Y. A study on brake-accelerator reaction times in elderly patients after artificial knee joint and hip joint replacement surgery. Traffic Inj. Prev. 2025, 26, 1–8. [Google Scholar] [CrossRef]
- Marques, C.J.; Barreiros, J.; Cabri, J.; Carita, A.I.; Friesecke, C.; Loehr, J.F. Does the brake response time of the right leg change after left total knee arthroplasty? A prospective study. Knee 2008, 15, 295–298. [Google Scholar] [CrossRef]
- Backer, H.C.; Kruger, D.; Spies, S.; Perka, C.; Kirschbaum, S.M.; Hardt, S. Effect of total hip arthroplasty on brake reaction time and braking force. Hip Int. 2022, 32, 51–55. [Google Scholar] [CrossRef]
- Casamento-Moran, A.; Patel, P.; Zablocki, V.; Christou, E.A.; Lodha, N. Sex differences in cognitive-motor components of braking in older adults. Exp. Brain Res. 2022, 240, 1045–1055. [Google Scholar] [CrossRef]
- Lodha, N.; Patel, P.; Casamento-Moran, A.; Christou, E.A. Motor Training After Stroke: A Novel Approach for Driving Rehabilitation. Front. Neurol. 2022, 13, 752880. [Google Scholar] [CrossRef] [PubMed]
- Mehta, S.P.; Bremer, H.; Cyrus, H.; Milligan, A.; Oliashirazi, A. Smartphone goniometer has excellent reliability between novice and experienced physical therapists in assessing knee range of motion. J. Bodyw. Mov. Ther. 2021, 25, 67–74. [Google Scholar] [CrossRef] [PubMed]
- Lienhard, K.; Lauermann, S.P.; Schneider, D.; Item-Glatthorn, J.F.; Casartelli, N.C.; Maffiuletti, N.A. Validity and reliability of isometric, isokinetic and isoinertial modalities for the assessment of quadriceps muscle strength in patients with total knee arthroplasty. J. Electromyogr. Kinesiol. 2013, 23, 1283–1288. [Google Scholar] [CrossRef] [PubMed]
- Kamimura, T.; Takenaka, T. Potentiation of Knee Extensor Contraction by Antagonist Conditioning Contraction at Several Intensities. J. Physiol. Anthropol. 2007, 26, 443–447. [Google Scholar] [CrossRef]
- Kamide, N.; Sato, H.; Shiba, Y.; Sakamoto, M. Agreement between two walking speeds measured by different walkway lengths: Comparison between 5- and 2.4-m walkways. J. Clin. Gerontol. Geriatr. 2018, 9, 99–104. [Google Scholar]
- Murata, K.; Endo, K.; Aihara, T.; Suzuki, H.; Matsuoka, Y.; Nishimura, H.; Takamatsu, T.; Yamamoto, K. The impact of sagittal imbalance on walking in patients with lumbar spinal canal stenosis. J. Orthop. Surg. 2021, 29, 23094990211010522. [Google Scholar] [CrossRef]
- Makino, K.; Makizako, H.; Doi, T.; Tsutsumimoto, K.; Hotta, R.; Nakakubo, S.; Suzuki, T.; Shimada, H. Fear of falling and gait parameters in older adults with and without fall history. Geriatr. Gerontol. Int. 2017, 17, 2455–2459. [Google Scholar] [CrossRef]
- Fraval, A.; Effeney, P.; Fiddelaers, L.; Smith, B.; Towell, B.; Tran, P. OBTAIN A: Outcome Benefits of Tranexamic Acid in Hip Arthroplasty. A Randomized Double-Blinded Controlled Trial. J. Arthroplast. 2017, 32, 1516–1519. [Google Scholar] [CrossRef]
- Miller, R.P.; Kori, S.H.; Todd, D.D. The Tampa Scale: A Measure of Kinisophobia. Clin. J. Pain 1991, 7, 51. [Google Scholar] [CrossRef]
- Cohen, J. A power primer. Psychol. Bull. 1992, 112, 155–159. [Google Scholar] [CrossRef]
- Nizam, I.; Batra, A.; Gogos, S. Early resumption of driving within 3 weeks following patient-specific instrumented total knee arthroplasty: An evaluation of 160 cases. J. Isakos 2019, 4, 88–92. [Google Scholar] [CrossRef]
- Zhou, Z.; Yew, K.S.; Arul, E.; Chin, P.L.; Tay, K.J.; Lo, N.N.; Chia, S.L.; Yeo, S.J. Recovery in knee range of motion reaches a plateau by 12 months after total knee arthroplasty. Knee Surg. Sports Traumatol. Arthrosc. 2015, 23, 1729–1733. [Google Scholar] [CrossRef] [PubMed]
- Koglberger, P.; Wurm, A.; Coraca-Huber, D.; Krismer, M.; Oberaigner, W.; Liebensteiner, M. High range of motion in the first ten postoperative days after TKA does not predict superior outcome in the long run. Arch. Orthop. Trauma Surg. 2022, 142, 2497–2501. [Google Scholar] [CrossRef]
- Oka, T.; Wada, O.; Asai, T.; Maruno, H.; Mizuno, K. Importance of knee flexion range of motion during the acute phase after total knee arthroplasty. Phys. Ther. Res. 2020, 23, 143–148. [Google Scholar] [CrossRef]
- Stevens-Lapsley, J.E.; Balter, J.E.; Wolfe, P.; Eckhoff, D.G.; Kohrt, W.M. Early neuromuscular electrical stimulation to improve quadriceps muscle strength after total knee arthroplasty: A randomized controlled trial. Phys. Ther. 2012, 92, 210–226. [Google Scholar] [CrossRef]
- Skoffer, B.; Maribo, T.; Mechlenburg, I.; Hansen, P.M.; Soballe, K.; Dalgas, U. Efficacy of Preoperative Progressive Resistance Training on Postoperative Outcomes in Patients Undergoing Total Knee Arthroplasty. Arthritis Care Res. 2016, 68, 1239–1251. [Google Scholar] [CrossRef]
- Calatayud, J.; Casana, J.; Ezzatvar, Y.; Jakobsen, M.D.; Sundstrup, E.; Andersen, L.L. High-intensity preoperative training improves physical and functional recovery in the early post-operative periods after total knee arthroplasty: A randomized controlled trial. Knee Surg. Sports Traumatol. Arthrosc. 2017, 25, 2864–2872. [Google Scholar] [CrossRef]
- Nakakubo, S.; Doi, T.; Makizako, H.; Tsutsumimoto, K.; Hotta, R.; Kurita, S.; Kim, M.; Suzuki, T.; Shimada, H. Association of walk ratio during normal gait speed and fall in community-dwelling elderly people. Gait Posture 2018, 66, 151–154. [Google Scholar] [CrossRef]
- Lindemann, U.; Schwickert, L.; Becker, C.; Gross, M.; Nolte, R.; Klenk, J. Estimate of gait speed by using persons’ walk ratio or step-frequency in older adults. Aging Clin. Exp. Res. 2021, 33, 2989–2994. [Google Scholar] [CrossRef]
- Menz, H.B.; Lord, S.R.; Fitzpatrick, R.C. Acceleration patterns of the head and pelvis when walking on level and irregular surfaces. Gait Posture 2003, 18, 35–46. [Google Scholar] [CrossRef]
- McNamara, C.A.; Laurita, J.; Lambert, B.S.; Sullivan, T.C.; Clyburn, T.A.; Incavo, S.J.; Park, K.J. A multimodal intraosseous infusion of morphine and ketorolac decreases early postoperative pain and opioid consumption following total knee arthroplasty. Knee 2023, 43, 129–135. [Google Scholar] [CrossRef] [PubMed]
- Sorel, J.C.; Veltman, E.S.; Honig, A.; Poolman, R.W. The influence of preoperative psychological distress on pain and function after total knee arthroplasty: A systematic review and meta-analysis. Bone Jt. J. 2019, 101-B, 7–14. [Google Scholar] [CrossRef] [PubMed]
- Sekiya, N. The invariant relationship between step length and step rate during free walking. J. Hum. Mov. Stud. 1996, 30, 241–257. [Google Scholar]
- Vlaeyen, J.W.S.; Kole-Snijders, A.M.J.; Boeren, R.G.B.; van Eek, H. Fear of movement/(re)injury in chronic low back pain and its relation to behavioral performance. Pain 1995, 62, 363–372. [Google Scholar] [CrossRef]

| Sex (male/female) | 11 | / | 10 |
| Age (years) | 66.7 | ± | 7.4 |
| Height (cm) | 159.8 | ± | 8.5 |
| Weight (kg) | 72.9 | ± | 13.4 |
| BMI (kg/m2) | 28.5 | ± | 4.3 |
| Measures | |||
|---|---|---|---|
| MT (s) | 0.35 | ± | 0.11 |
| BPF (N) | 137.53 | ± | 34.02 |
| Knee flexion ROM (°) | 116.19 | ± | 12.34 |
| Knee extension ROM (°) | −5.00 | ± | 5.24 |
| Knee flexion muscle strength (Nm/kg) | 0.31 | ± | 0.13 |
| Knee extension muscle strength (Nm/kg) | 0.27 | ± | 0.13 |
| Walking speed (cm/s) | 66.41 | ± | 24.40 |
| Stride length (cm) | 86.36 | ± | 20.27 |
| Walking ratio (cm/steps/min) | 0.48 | ± | 0.11 |
| VAS | 31.53 | ± | 24.07 |
| TSK | 34.24 | ± | 8.07 |
| MT | BPF | |||||
|---|---|---|---|---|---|---|
| r | 95% CI | p-Value | r | 95% CI | p-Value | |
| Knee flexion ROM (°) | −0.40 | −0.79, 0.12 | 0.12 | <0.00 | −0.14, 0.75 | 1.00 |
| Knee extension ROM (°) | −0.12 | −0.66, 0.37 | 0.66 | 0.07 | −0.60, 0.40 | 0.79 |
| Knee flexion muscle strength (Nm/Kg) | −0.40 | −0.78, 0.15 | 0.15 | 0.01 | −0.44, 0.65 | 0.97 |
| Knee extension muscle strength (Nm/Kg) | −0.56 | −0.88, −0.18 | 0.02 * | −0.12 | −0.35, 0.65 | 0.68 |
| Walking speed (cm/s) | 0.29 | −0.47, 0.59 | 0.27 | 0.19 | −0.29, 0.68 | 0.49 |
| Stride length (cm) | 0.20 | −0.29, 0.71 | 0.45 | 0.20 | −0.06, 0.79 | 0.45 |
| Walking ratio (cm/steps/min) | 0.55 | 0.10, 0.86 | 0.03 * | 0.52 | 0.03, 0.82 | 0.04 * |
| VAS | −0.11 | −0.48, 0.58 | 0.68 | −0.54 | −0.92, −0.42 | 0.02 * |
| TSK | −0.30 | −0.80, 0.09 | 0.27 | 0.11 | −0.54, 0.48 | 0.68 |
| Dependent Variables | Independent Variables | Unstandardized Coefficient | 95% CI for B (Lower Limit, Upper Limit) | Standardized Coefficient | 95% CI for β (Lower Limit, Upper Limit) | p-Value | VIF | R2 |
|---|---|---|---|---|---|---|---|---|
| B | β | |||||||
| MT | ||||||||
| Intercept | 0.25 | 0.14, 0.31 | 0.02, 0.02 | 0.44 | ||||
| Knee extension strength (Nm/Kg) | −0.001 | −0.002, −0.0001 | −0.42 | −0.886, 0.044 | 0.07 | 1.00 | ||
| Walking ratio (cm/steps/min) | 241.04 | 32.51, 449.56 | 0.54 | 0.077, 1.004 | 0.02 * | 1.00 | ||
| BPF | ||||||||
| Intercept | 87.79 | 19.62, 155.96 | −3.78, 0.51 | 0.44 | ||||
| Walking ratio (cm/steps/min) | 151,747.48 | 12,271.66, 291,223.3 | 0.49 | 0.0398, 0.9456 | 0.03 * | 1.03 | ||
| VAS | −0.70 | −1.29, −0.12 | −0.54 | −0.9972, −0.0922 | 0.02 * | 1.03 |
Disclaimer/Publisher’s Note: The statements, opinions and data contained in all publications are solely those of the individual author(s) and contributor(s) and not of MDPI and/or the editor(s). MDPI and/or the editor(s) disclaim responsibility for any injury to people or property resulting from any ideas, methods, instructions or products referred to in the content. |
© 2025 by the authors. Licensee MDPI, Basel, Switzerland. This article is an open access article distributed under the terms and conditions of the Creative Commons Attribution (CC BY) license (https://creativecommons.org/licenses/by/4.0/).
Share and Cite
Okazawa, K.; Hamai, S.; Fujita, T.; Nasu, Y.; Kawahara, S.; Nakashima, Y.; Ishikawa, H.; Fujii, H.; Katoh, H. The Relationship Between Driving Performance and Lower Limb Motor Function After Total Knee Arthroplasty Using a Driving Simulator: A Pilot Study on Elucidating Factors Influencing Accelerator and Brake Operations. Life 2025, 15, 768. https://doi.org/10.3390/life15050768
Okazawa K, Hamai S, Fujita T, Nasu Y, Kawahara S, Nakashima Y, Ishikawa H, Fujii H, Katoh H. The Relationship Between Driving Performance and Lower Limb Motor Function After Total Knee Arthroplasty Using a Driving Simulator: A Pilot Study on Elucidating Factors Influencing Accelerator and Brake Operations. Life. 2025; 15(5):768. https://doi.org/10.3390/life15050768
Chicago/Turabian StyleOkazawa, Kazuya, Satoshi Hamai, Tsutomu Fujita, Yuki Nasu, Shinya Kawahara, Yasuharu Nakashima, Hitoshi Ishikawa, Hiromi Fujii, and Hiroshi Katoh. 2025. "The Relationship Between Driving Performance and Lower Limb Motor Function After Total Knee Arthroplasty Using a Driving Simulator: A Pilot Study on Elucidating Factors Influencing Accelerator and Brake Operations" Life 15, no. 5: 768. https://doi.org/10.3390/life15050768
APA StyleOkazawa, K., Hamai, S., Fujita, T., Nasu, Y., Kawahara, S., Nakashima, Y., Ishikawa, H., Fujii, H., & Katoh, H. (2025). The Relationship Between Driving Performance and Lower Limb Motor Function After Total Knee Arthroplasty Using a Driving Simulator: A Pilot Study on Elucidating Factors Influencing Accelerator and Brake Operations. Life, 15(5), 768. https://doi.org/10.3390/life15050768