
A New Class of BRCA1 Mimetics for ERα-Positive Breast Cancer Therapy: Design, Synthesis, In Silico Screening, In Vitro Assay, and Gene Expression Analysis

 , , ,
, , ,  and
and
Abstract
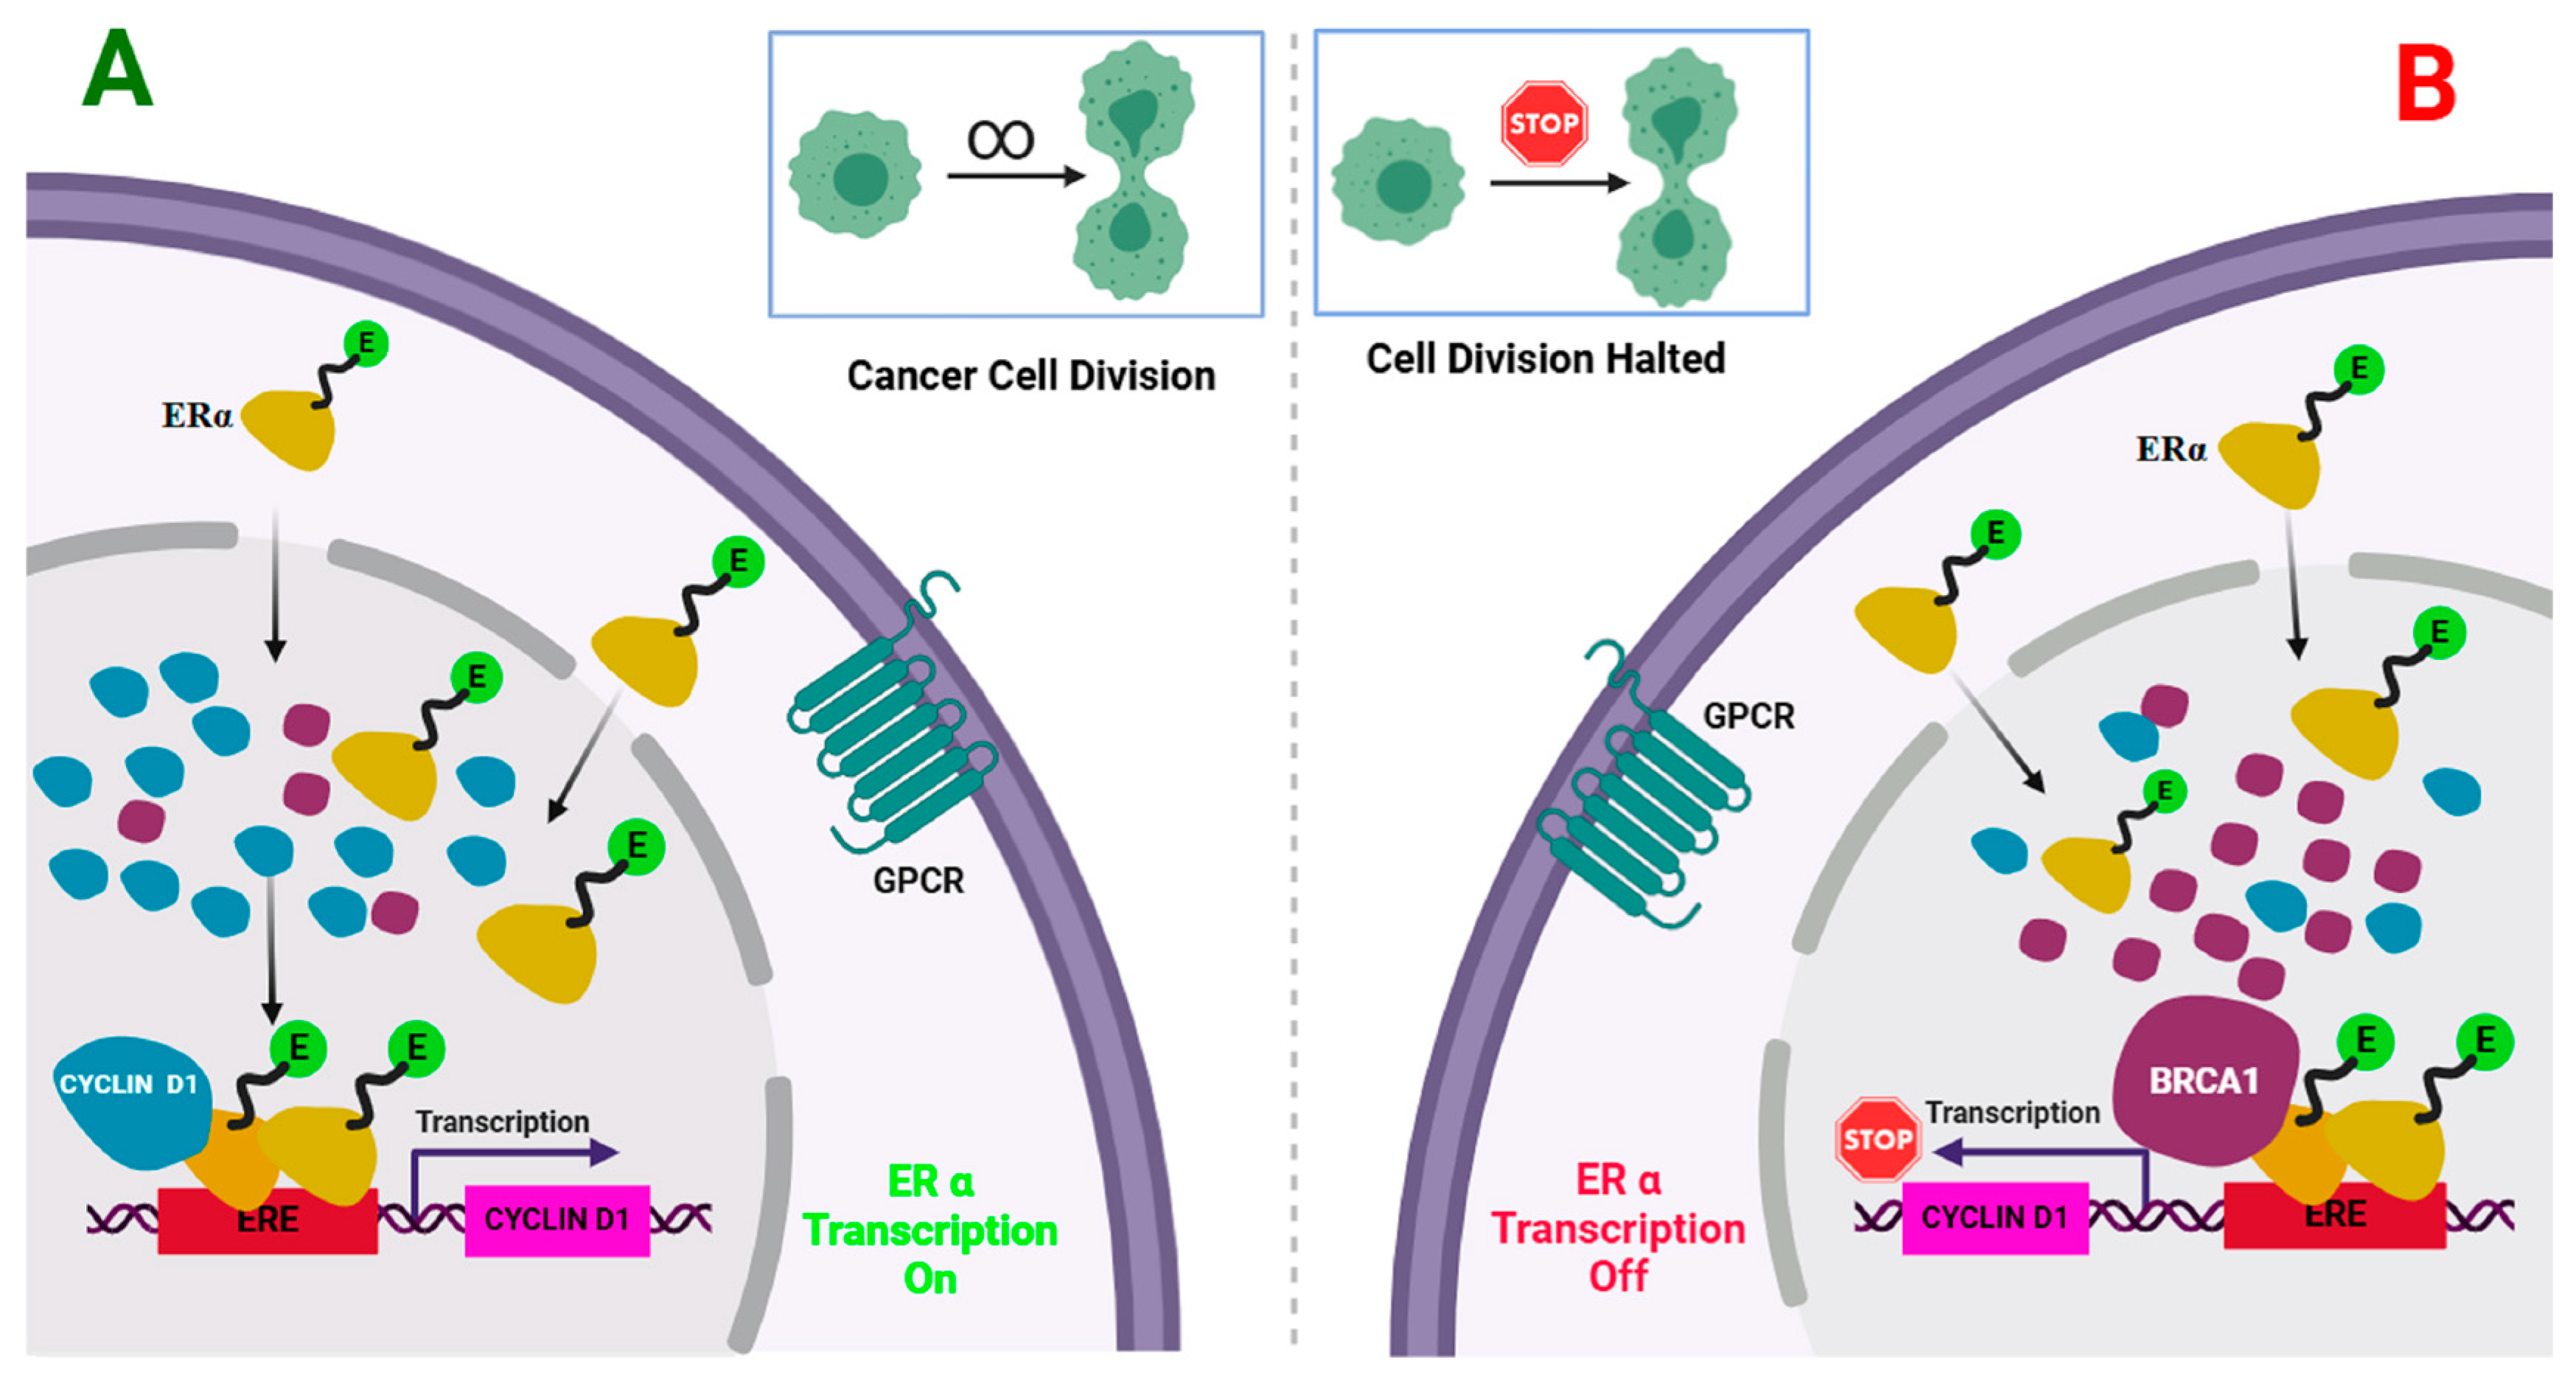
:1. Introduction
2. Experimental Section
2.1. Materials
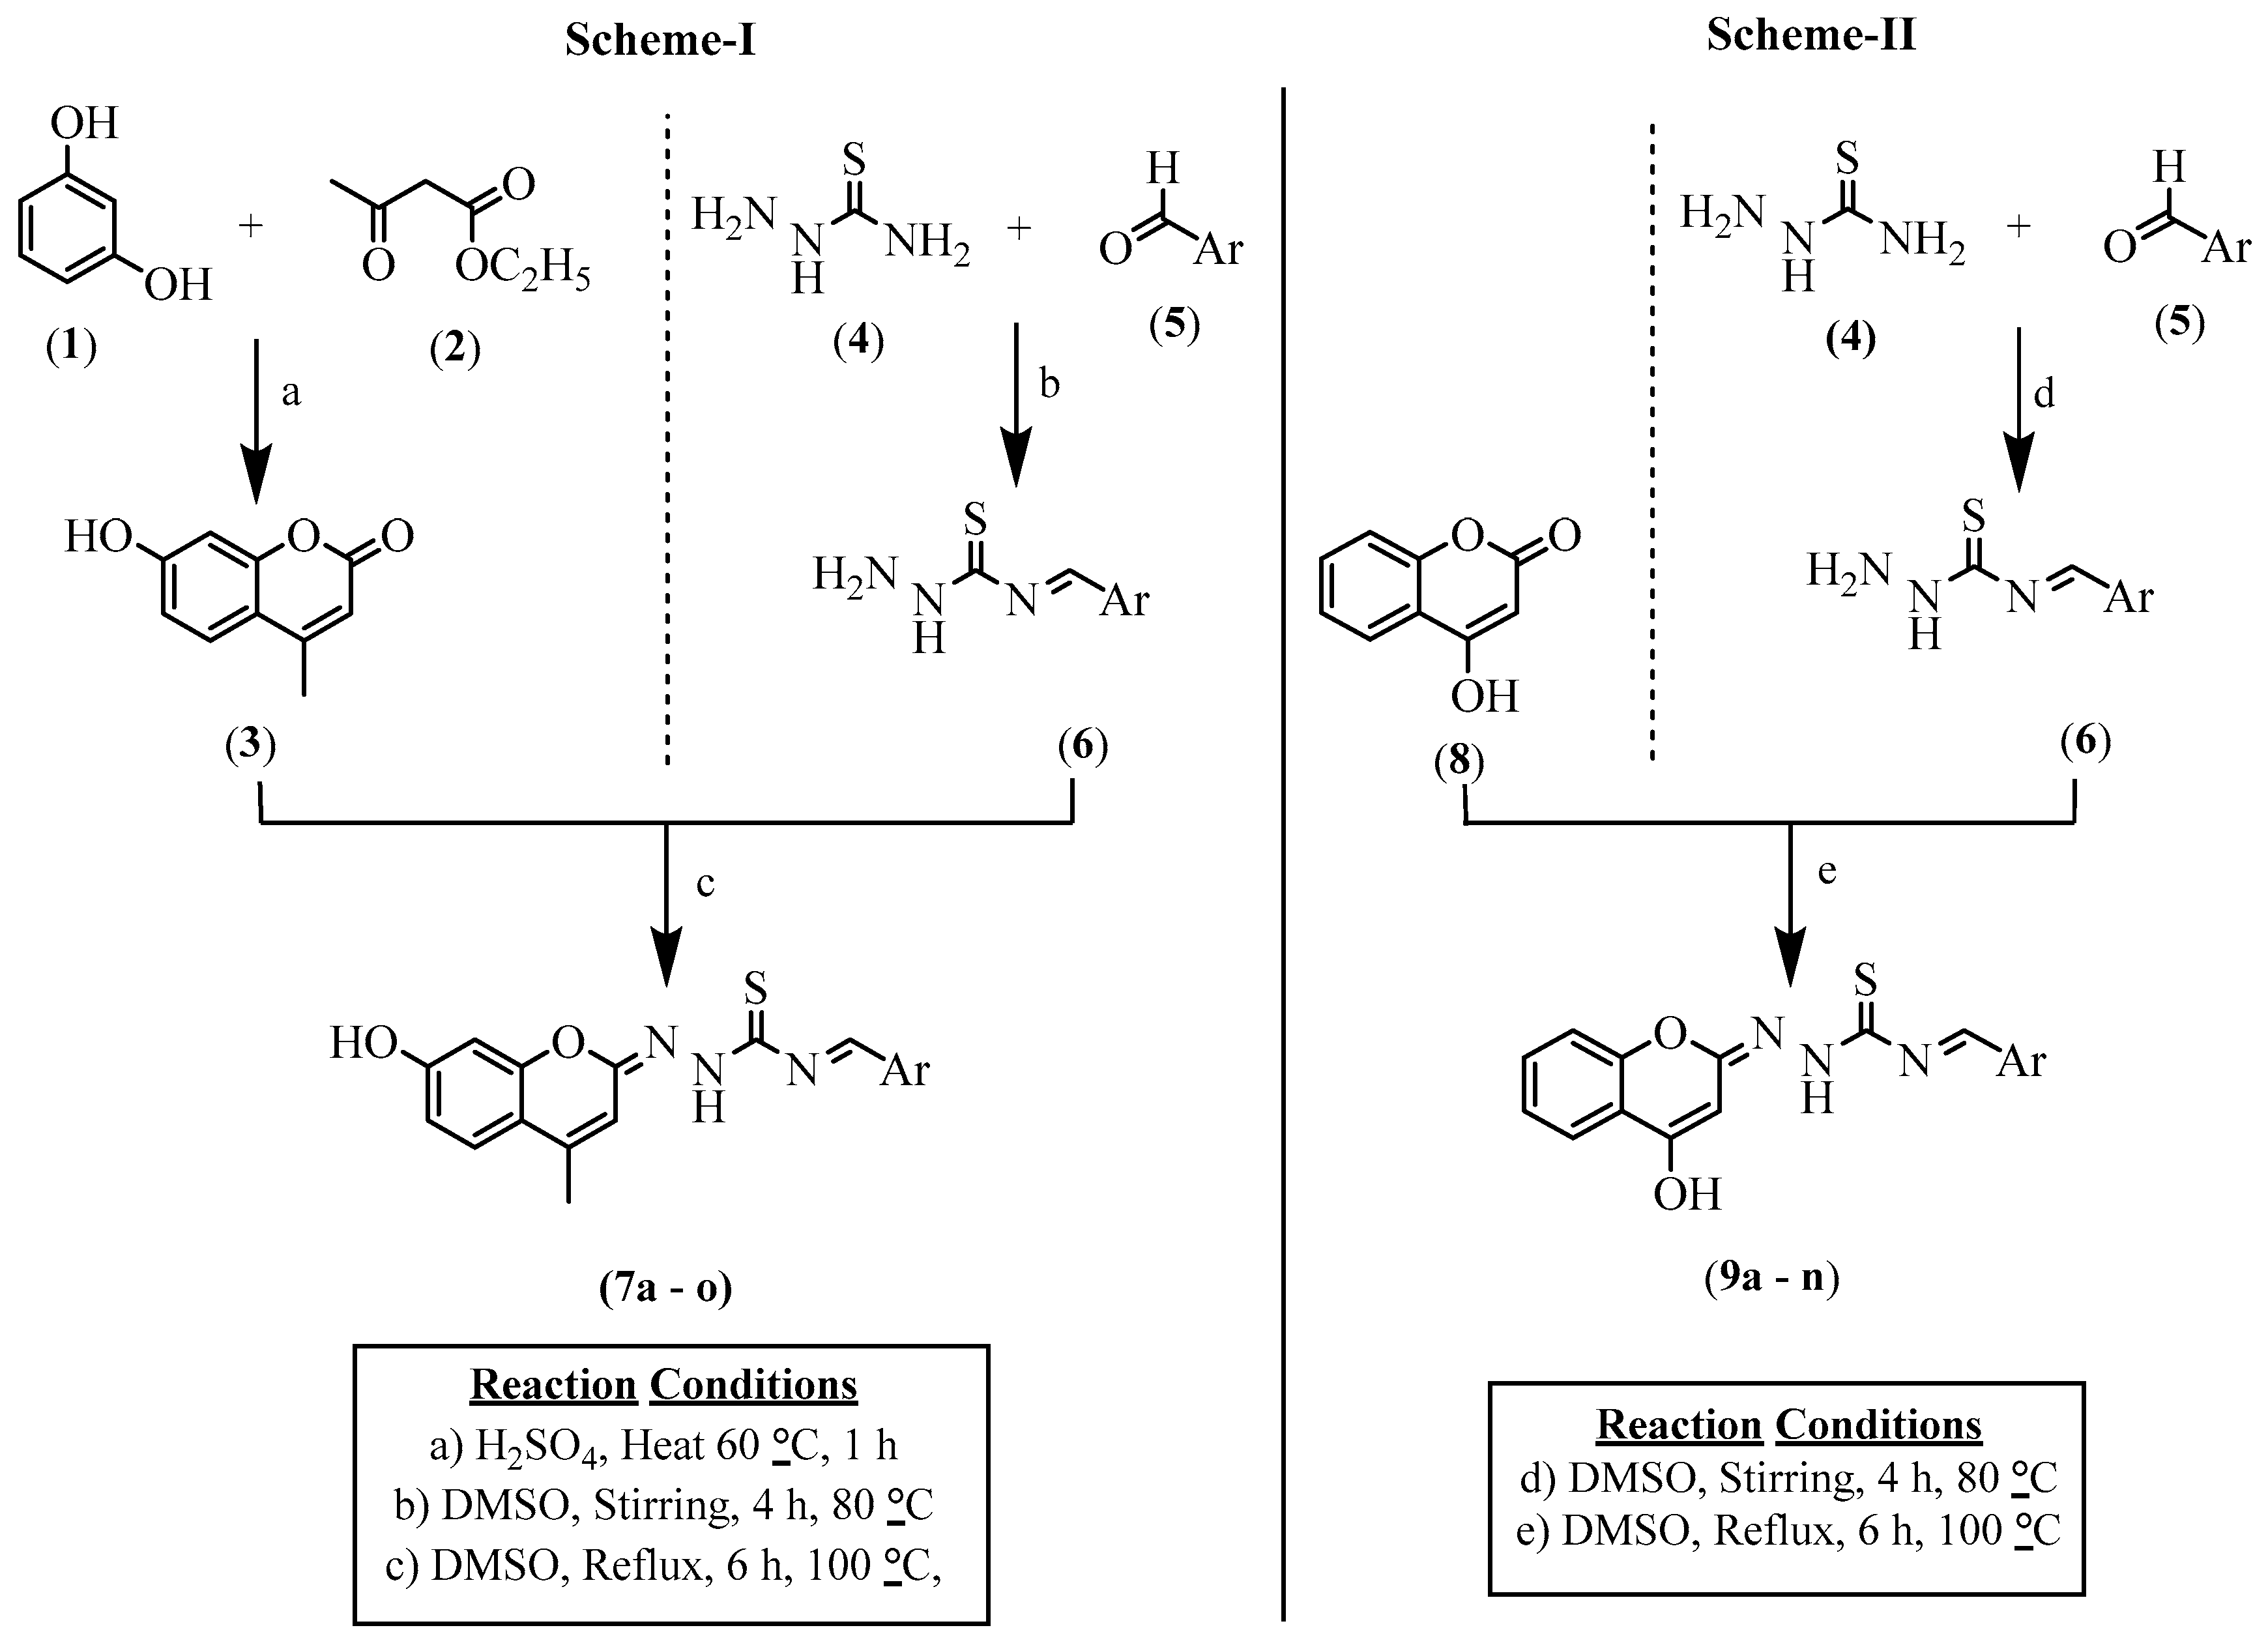
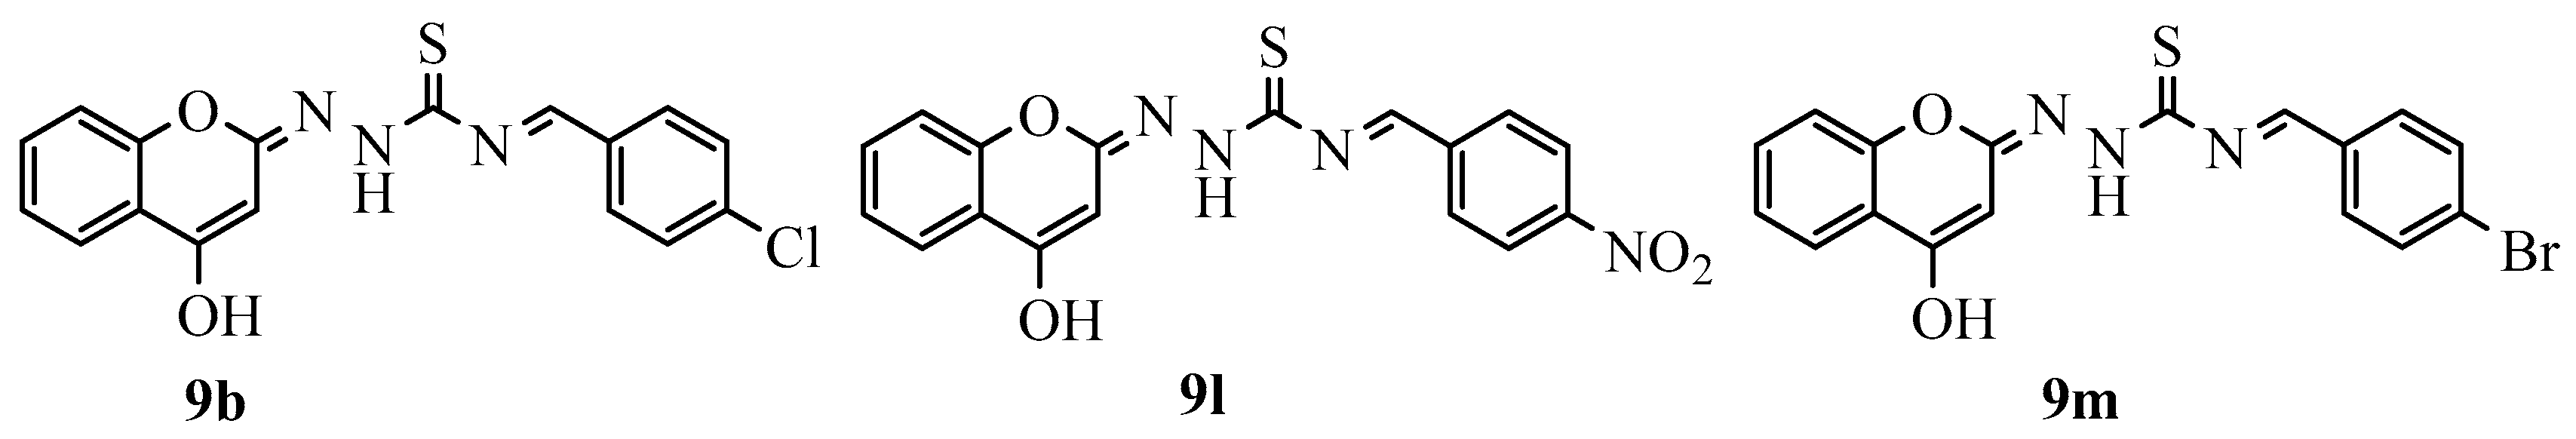
Synthesis of N-(Substitute Benzylidene)-2-((E)-7-hydroxy-4-methyl-2H-chromen-2-ylidene) Hydrazine-1-carbothioamide (7) (Scheme-I)/N-(Substitute Benzylidene)-2-((E)-4-hydroxy-2H-chromen-2-ylidene)hydrazine-1-carbothioamide (9) (Scheme-II)
2.2. Pharmacology
2.2.1. Cytotoxicity Screening
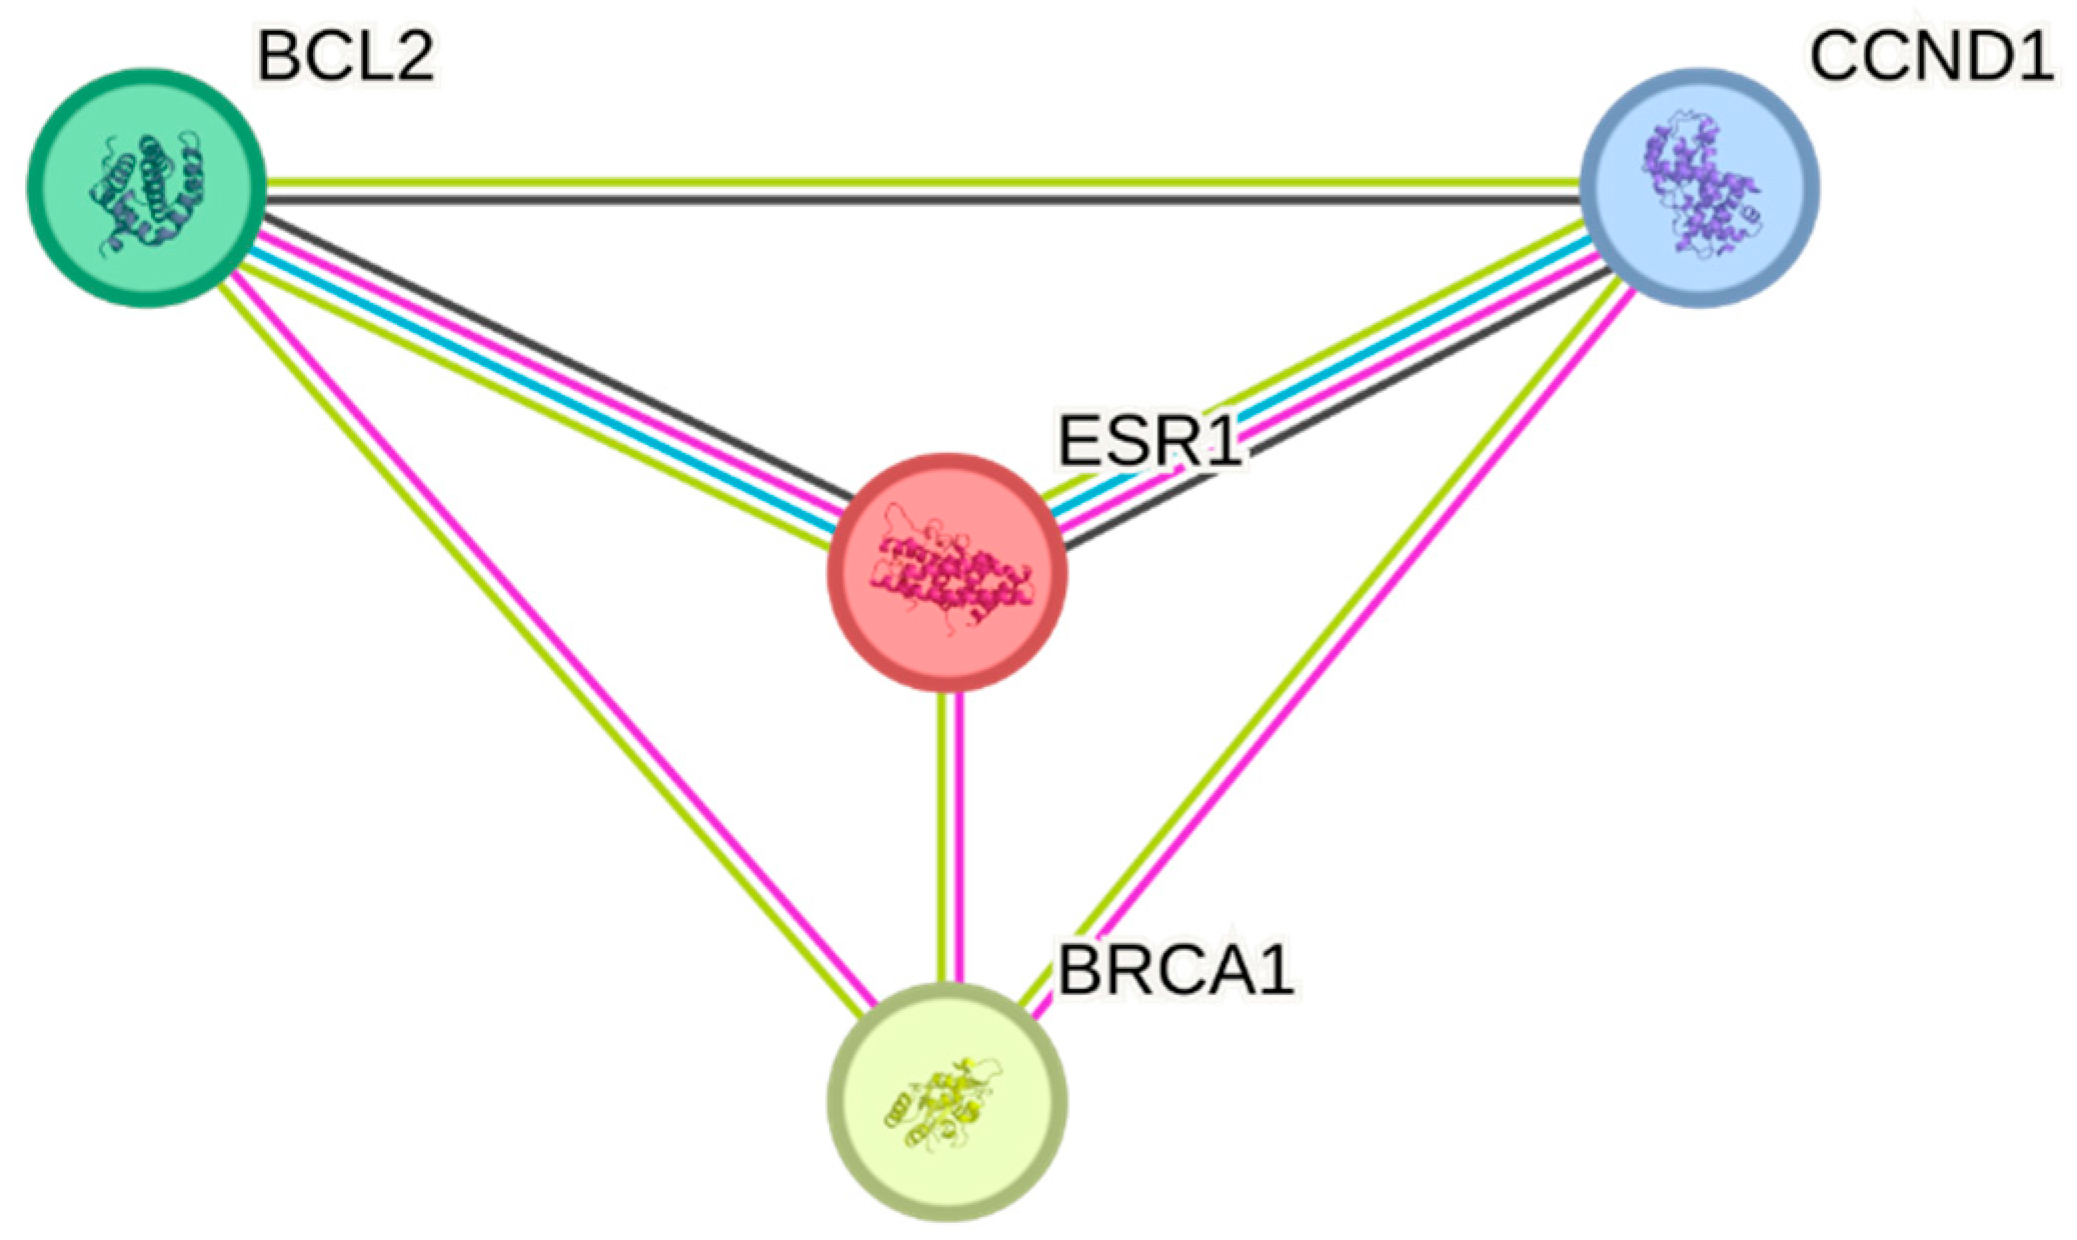
2.2.2. The Construction of Protein–Protein Interaction Network (PPI) Associated with ESR1
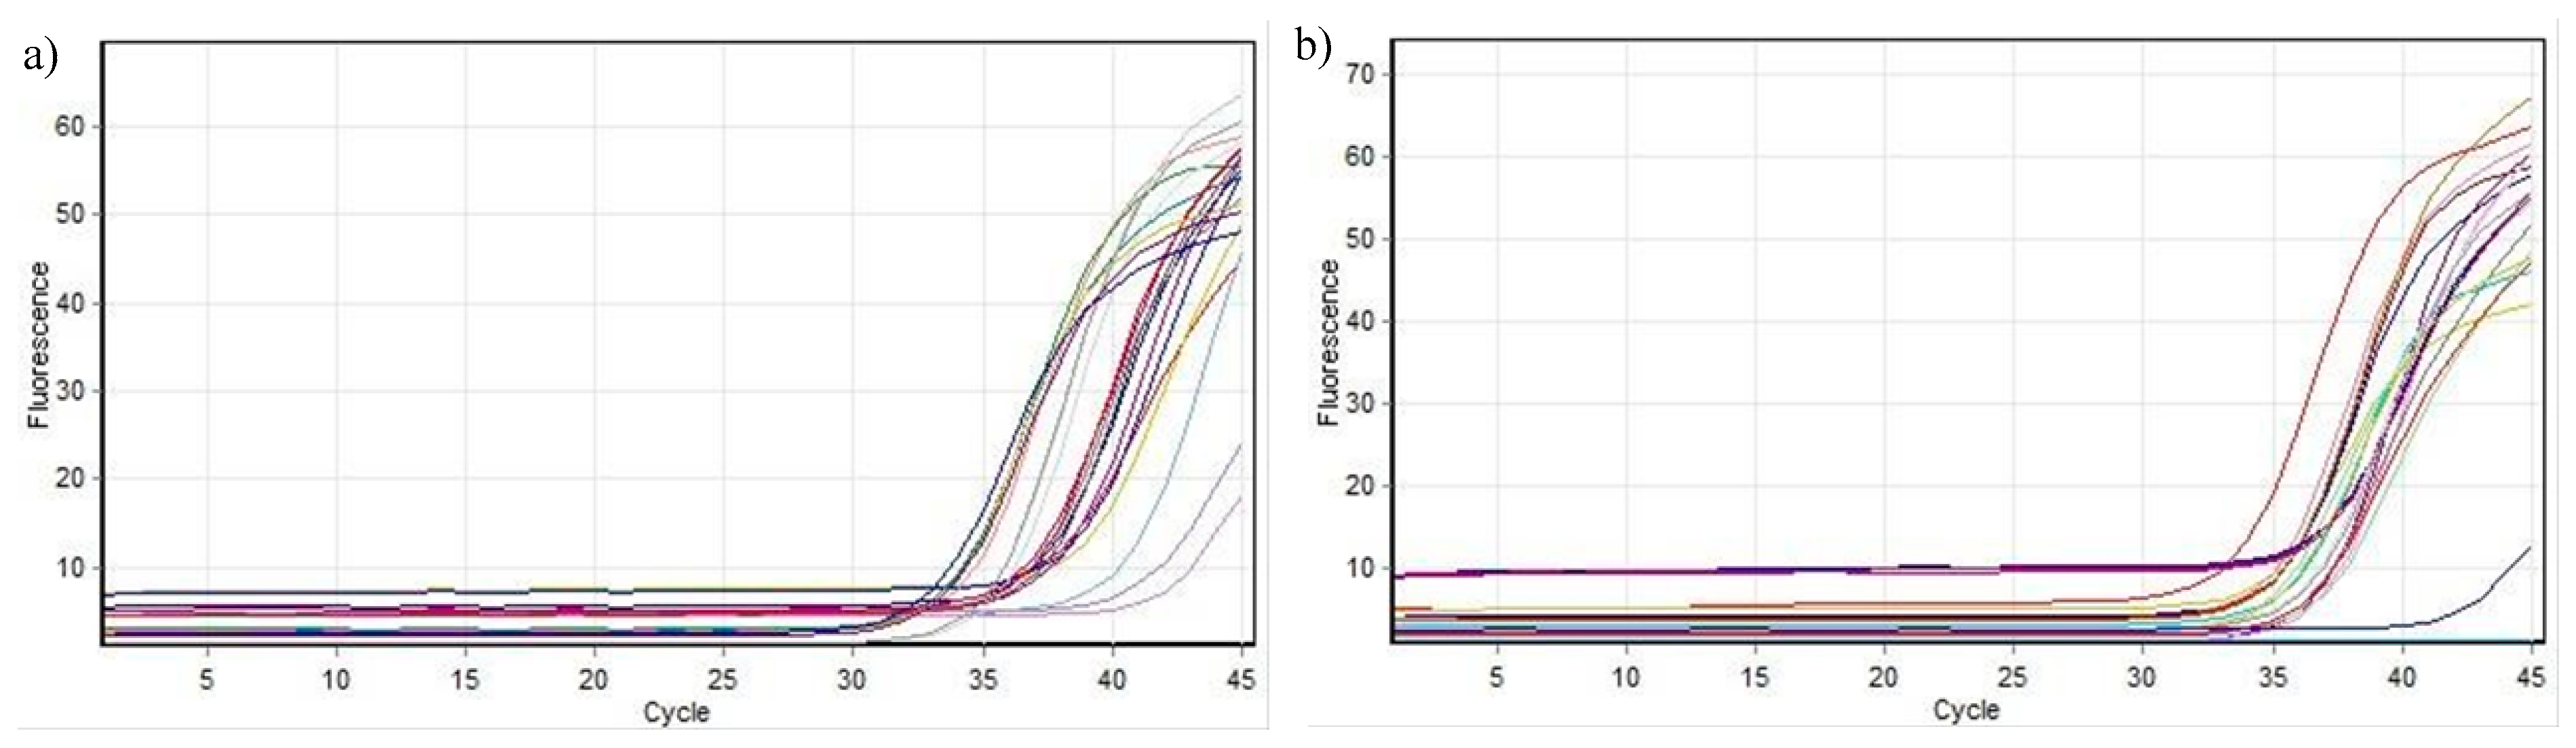
2.2.3. Analysis of Gene Expression for Cyclin D1 and BCL2 with RT-qPCR
Real-Time PCR by ΔΔCt Method
2.3. In Silico Studies: Molecular Docking, MMGBSA, and ADME Studies
3. Results and Discussion
3.1. Chemistry
N-((E)-Benzylidene)-2-((E)-7-hydroxy-4-methyl (Scheme-I)/4-Hydroxy-2H-chromen-2-ylidene) Hydrazine-1-carbothioamides (Scheme-II) Derivatives
3.2. Pharmacology
3.2.1. In Vitro Cytotoxicity Assay
3.2.2. The Construction of Protein–Protein Interaction Network (PPI) Associated with ESR1
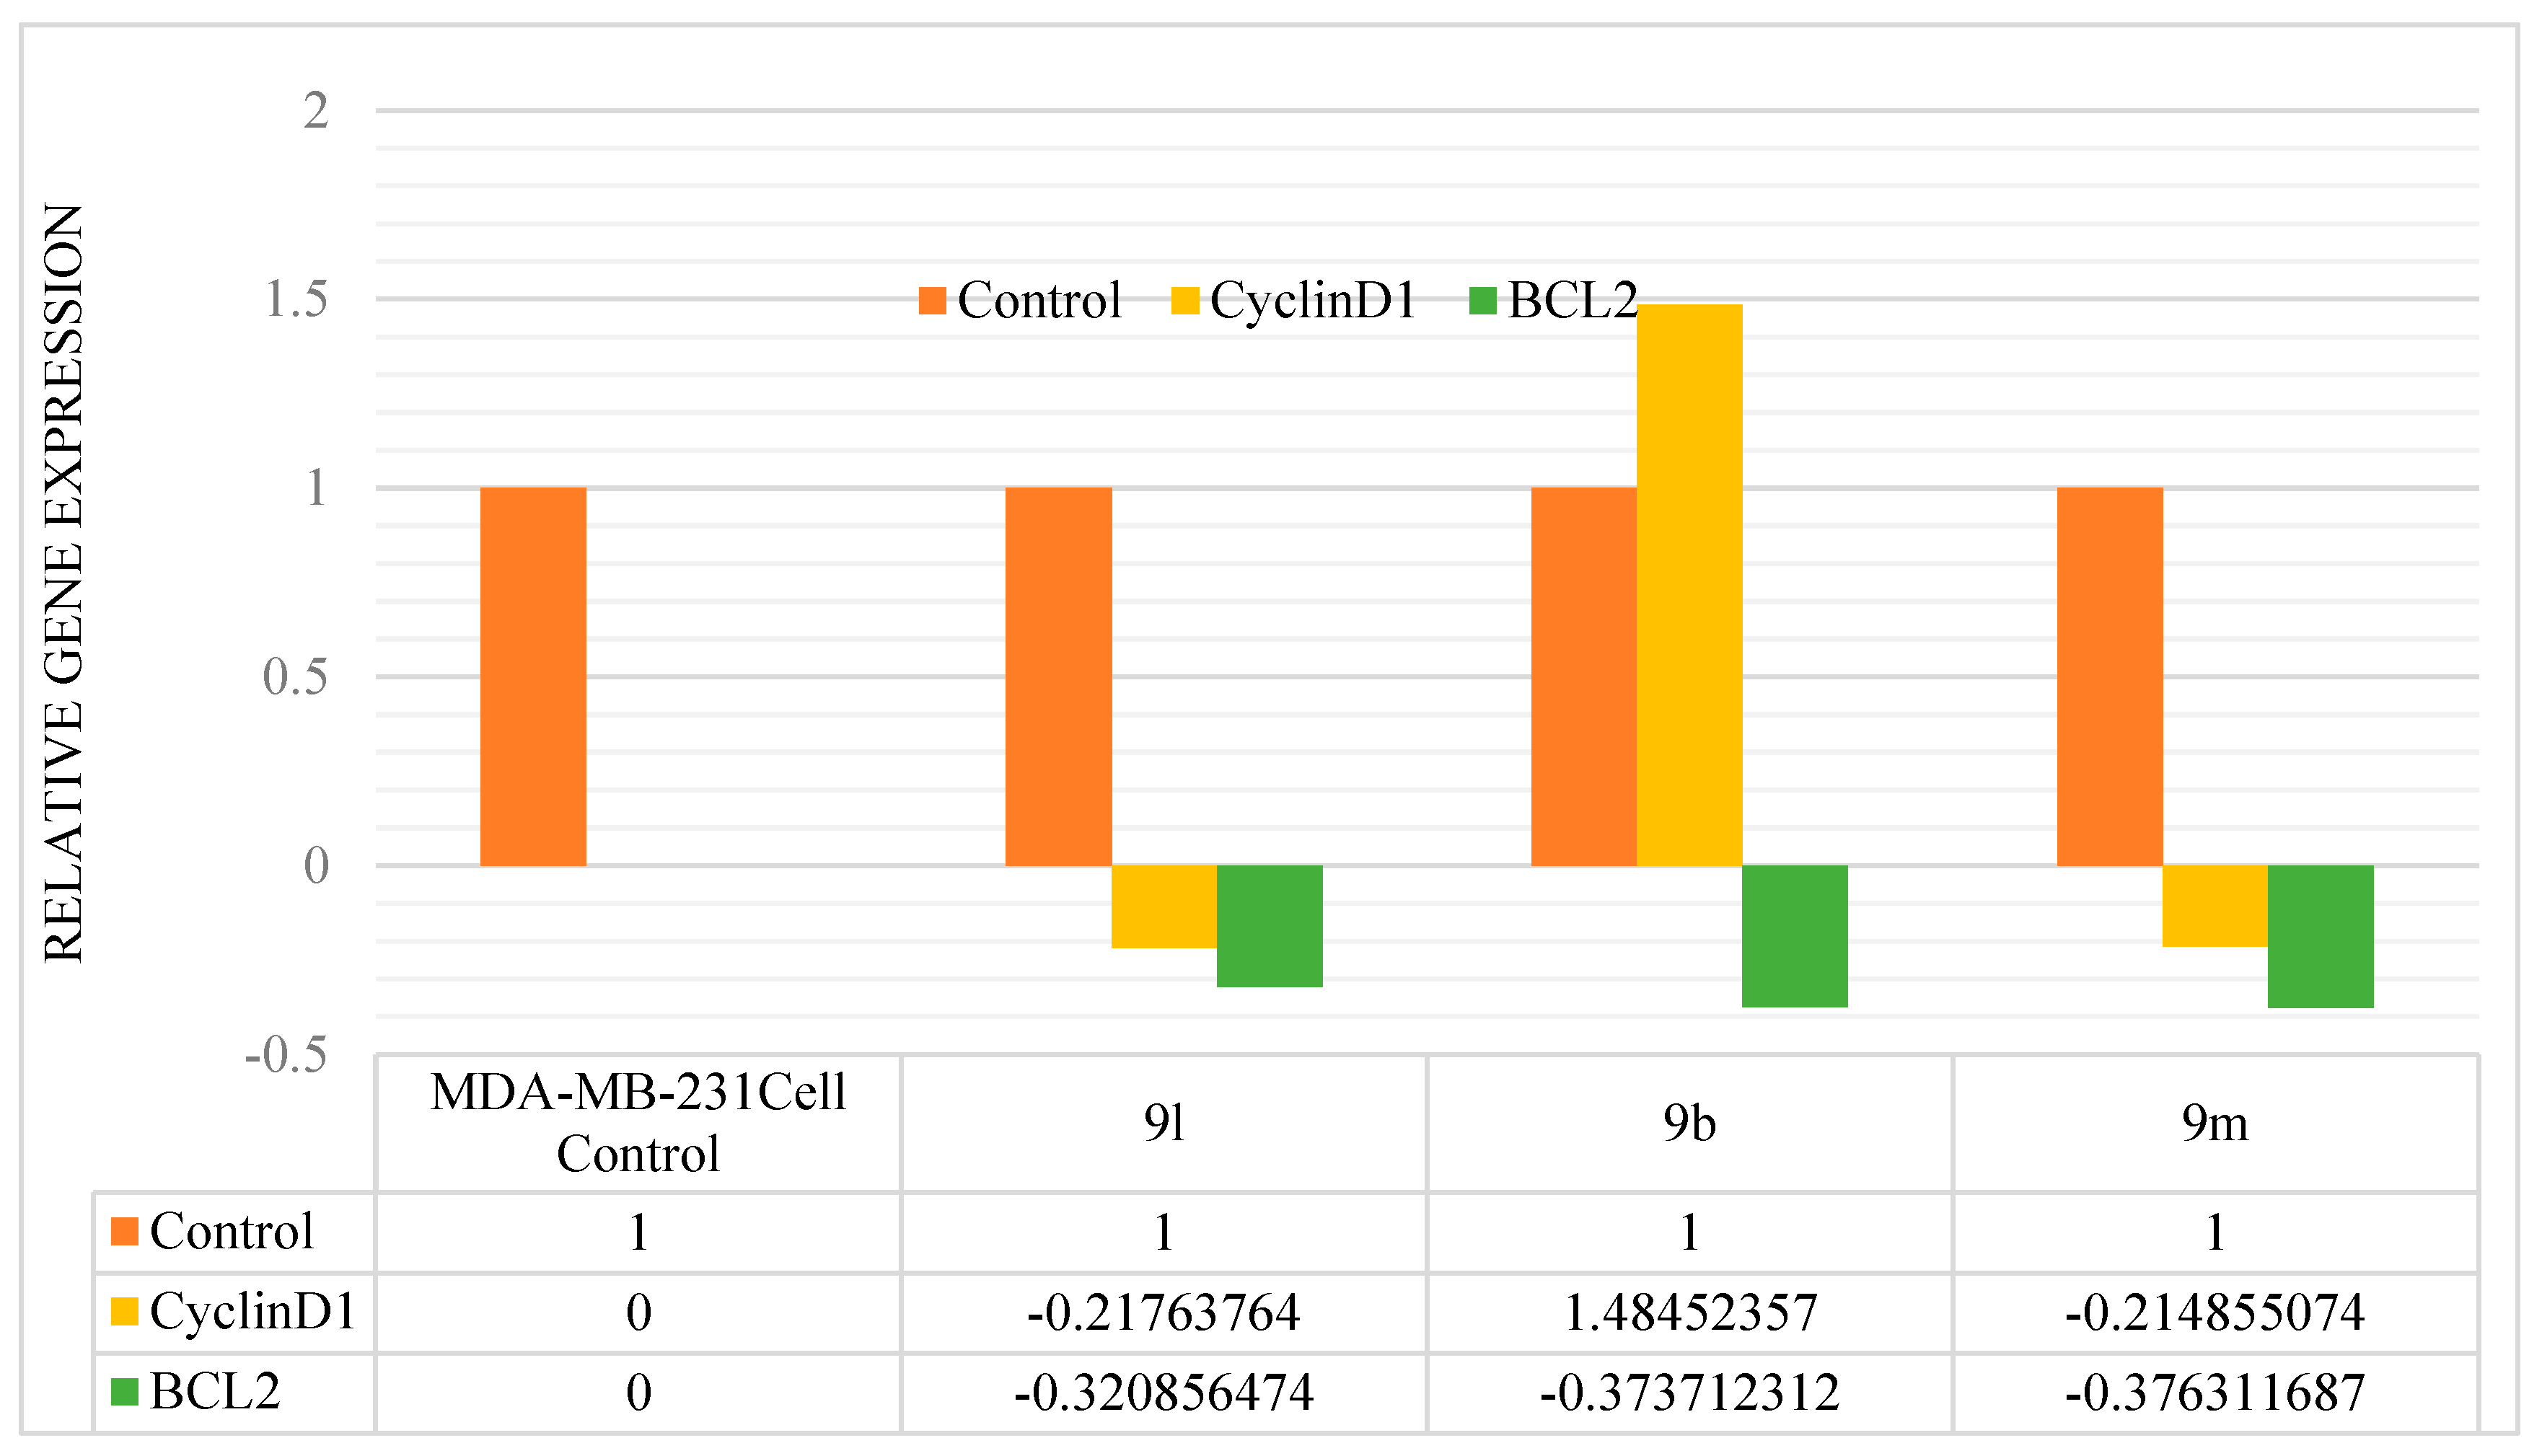
3.2.3. Gene Expression Studies

| S. No. | Gene | Forward Primer (5′-3′) Reverse Primer (3′-5′) | Primer Conc. (µM) | Annealing Temp. (°C) | Amplicon Size (bp) |
|---|---|---|---|---|---|
| 1 | Cyclin D1 | 5′-CGGGATCCCCAGCCATGGAACACCAGC-3′ 3′-CGGAATTCGCGCCCTCAGATGTCCACG-5′ | 0.05 | 58 | 75 |
| 2 | BCL2 | 5′-CTGGTCCAAGAGGATTTCCA-3′ 3′-TCATTGCCTTGCACGTAGAG-5′ | 0.05 | 58 | 100 |
| 3 | GAPDH | 5′-ATGGCATTCCGTGTTCCTAC-3′ 3′-CCTTCAACTTGCCCTCTGAC-5′ | 0.05 | 58 | 117 |
| S. No | Sample | A260/280 | RNA Concentration (µg/mL) | A260/280 | cDNA Concentration (µg/mL) |
|---|---|---|---|---|---|
| 1 | 9l | 2.04 | 311.8 | 1.82 | 637.4 |
| 2 | 9b | 2.11 | 297.2 | 1.77 | 595.6 |
| 3 | 9m | 1.89 | 428.3 | 1.71 | 629.3 |
| 4 | MDA-MB-231 Cell Control | 2.16 | 521.4 | 1.82 | 552.8 |
| S. No | Cyclin D1 | GAPDH | ||||
|---|---|---|---|---|---|---|
| Ct Mean | Ct Mean | Δ Ct | ΔΔCt | 2(−ΔΔCt) | ||
| 1 | MDA-MB-231 Cell Control | 27.82 | 33.38 | −5.56 | 0 | 0 |
| 2 | 9l | 31.62 | 34.98 | −3.36 | 2.2 | −0.217637640 |
| 3 | 9b | 28.85 | 34.98 | −6.13 | −0.57 | 1.484523570 |
| 4 | 9m | 31.45 | 34.98 | −3.53 | 2.03 | −0.214855074 |
| S. No | BCL 2 | GAPDH | ||||
|---|---|---|---|---|---|---|
| Ct Mean | Ct Mean | Δ Ct | ΔΔCt | 2(−ΔΔCt) | ||
| 1 | MDA-MB-231 Cell Control | 30.13 | 31.2 | −1.08 | 0 | 0 |
| 2 | 9l | 33.42 | 30.7 | 2.72 | 1.64 | −0.320856473907 |
| 3 | 9b | 31.04 | 30.7 | 0.34 | 1.42 | −0.3737123121587 |
| 4 | 9m | 31.03 | 30.7 | 0.33 | 1.41 | −0.3763116868527 |
3.3. In Silico Studies: Molecular Docking, MMGBSA, and ADMET Studies
4. Conclusions
Supplementary Materials
Author Contributions
Funding
Institutional Review Board Statement
Informed Consent Statement
Data Availability Statement
Conflicts of Interest
Abbreviations
References
- Ginsburg, O.; Yip, C.H.; Brooks, A.; Cabanes, A.; Caleffi, M.; Yataco, J.A.D.; Gyawali, B.; McCormack, V.; de Anderson, M.M.L.; Mehrotra, R.; et al. Breast Cancer Early Detection: A Phased Approach to Implementation. Cancer 2020, 126, 2379–2393. [Google Scholar] [CrossRef]
- Sung, H.; Ferlay, J.; Siegel, R.L.; Laversanne, M.; Soerjomataram, I.; Jemal, A.; Bray, F. Global Cancer Statistics 2020: GLOBOCAN Estimates of Incidence and Mortality Worldwide for 36 Cancers in 185 Countries. CA. Cancer J. Clin. 2021, 71, 209–249. [Google Scholar] [CrossRef]
- Mutebi, M.; Anderson, B.O.; Duggan, C.; Adebamowo, C.; Agarwal, G.; Ali, Z.; Bird, P.; Bourque, J.M.; DeBoer, R.; Gebrim, L.H.; et al. Breast Cancer Treatment: A Phased Approach to Implementation. Cancer 2020, 126, 2365–2378. [Google Scholar] [CrossRef] [PubMed]
- WHO Launches New Roadmap on Breast Cancer. Available online: https://www.who.int/news/item/03-02-2023-who-launches-new-roadmap-on-breast-cancer (accessed on 14 August 2024).
- BRCA: The Breast Cancer Gene-BRCA Mutations & Risks. Available online: https://www.nationalbreastcancer.org/what-is-brca/ (accessed on 14 August 2024).
- ElShamy, W.M.; Livingston, D.M. Identification of BRCA1-IRIS, a BRCA1 Locus Product. Nat. Cell Biol. 2004, 6, 954–967. [Google Scholar] [CrossRef]
- Wilson, C.A.; Ramos, L.; Villaseñor, M.R.; Anders, K.H.; Press, M.F.; Clarke, K.; Karlan, B.; Chen, J.-J.; Scully, R.; Livingston, D.; et al. Localization of Human BRCA1 and Its Loss in High-Grade, Non-Inherited Breast Carcinomas. Nat. Genet. 1999, 21, 236–240. [Google Scholar] [CrossRef] [PubMed]
- Miki, T.; Bottaro, D.P.; Fleming, T.P.; Smith, C.L.; Burgess, W.H.; Chan, A.M.L.; Aaronson, S.A. Determination of Ligand-Binding Specificity by Alternative Splicing: Two Distinct Growth Factor Receptors Encoded by a Single Gene. Proc. Natl. Acad. Sci. USA 1992, 89, 246–250. [Google Scholar] [CrossRef] [PubMed]
- Struewing, J.P.; Hartge, P.; Wacholder, S.; Baker, S.M.; Berlin, M.; McAdams, M.; Timmerman, M.M.; Brody, L.C.; Tucker, M.A. The Risk of Cancer Associated with Specific Mutations of BRCA1 and BRCA2 among Ashkenazi Jews. N. Engl. J. Med. 1997, 336, 1401–1408. [Google Scholar] [CrossRef]
- Deng, C.X. BRCA1: Cell Cycle Checkpoint, Genetic Instability, DNA Damage Response and Cancer Evolution. Nucleic Acids Res. 2006, 34, 1416–1426. [Google Scholar] [CrossRef]
- Yarden, R.I.; Papa, M.Z. BRCA1 at the Crossroad of Multiple Cellular Pathways: Approaches for Therapeutic Interventions. Mol. Cancer Ther. 2006, 5, 1396–1404. [Google Scholar] [CrossRef]
- Dine, J.; Deng, C.X. Mouse Models of BRCA1 and Their Application to Breast Cancer Research. Cancer Metastasis Rev. 2013, 32, 25–37. [Google Scholar] [CrossRef]
- Buckley, N.E.; Mullan, P.B. BRCA1-Conductor of the Breast Stem Cell Orchestra: The Role of BRCA1 in Mammary Gland Development and Identification of Cell of Origin of BRCA1 Mutant Breast Cancer. Stem Cell Rev. Rep. 2012, 8, 982–993. [Google Scholar] [CrossRef]
- Deng, C.X.; Wang, R.H. Roles of BRCA1 in DNA Damage Repair: A Link between Development and Cancer. Hum. Mol. Genet. 2003, 12, R113–R123. [Google Scholar] [CrossRef]
- Cao, L.; Li, W.; Kim, S.; Brodie, S.G.; Deng, C.-X. Senescence, Aging, and Malignant Transformation Mediated by P53 in Mice Lacking the Brca1 Full-Length Isoform. Genes Dev. 2003, 17, 201. [Google Scholar] [CrossRef]
- Wang, C.; Fan, S.; Li, Z.; Fu, M.; Rao, M.; Ma, Y.; Lisanti, M.P.; Albanese, C.; Katzenellenbogen, B.S.; Kushner, P.J.; et al. Cyclin D1 Antagonizes BRCA1 Repression of Estrogen Receptor α Activity. Cancer Res. 2005, 65, 6557–6567. [Google Scholar] [CrossRef]
- Fan, S.; Ma, Y.X.; Wang, C.; Yuan, R.Q.; Meng, Q.; Wang, J.A.; Erdos, M.; Goldberg, I.D.; Webb, P.; Kushner, P.J.; et al. Role of Direct Interaction in BRCA1 Inhibition of Estrogen Receptor Activity. Oncogene 2001, 20, 77–87. [Google Scholar] [CrossRef]
- Ma, Y.X.; Tomita, Y.; Fan, S.; Wu, K.; Tong, Y.; Zhao, Z.; Song, L.N.; Goldberg, I.D.; Rosen, E.M. Structural Determinants of the BRCA1: Estrogen Receptor Interaction. Oncogene 2005, 24, 1831–1846. [Google Scholar] [CrossRef]
- Sundar, P.S.; Naresh, P.; Antony, J.; Wadhwani, A.; Mohankumar, S.; Jubie, S. Dual Modulators of P53 and Cyclin D in ER Alpha Signaling by Albumin Nanovectors Bearing Zinc Chaperones for ER-Positive Breast Cancer Therapy. Mini-Rev. Med. Chem. 2020, 21, 792–802. [Google Scholar] [CrossRef]
- Jameera Begam, A.; Jubie, S.; Nanjan, M.J. Estrogen Receptor Agonists/Antagonists in Breast Cancer Therapy: A Critical Review. Bioorg. Chem. 2017, 71, 257–274. [Google Scholar]
- Jubie, S.; Sundar, S.; Yadav, N.; Naresh, P.; Wadhwani, A.; Natarajan, J. A New Class of Coumate Benzimidazole Hybrids as BRCA 1 Mimetics Through Unconventional Binding Mode; Synthesis and Preliminary Cytotoxicity Screening. Curr. Comput. Aided. Drug Des. 2019, 16, 786–801. [Google Scholar] [CrossRef]
- Shyam Sundar, P.; Naresh, P.; Natarajan, J.; Wadhwani, A.; Jubie, S. Potential Coumarin Thiosemicarbazone Hybrids as BRCA-1 Mimetics for ER Positive Breast Cancer Therapy: An In-Silico Approach. J. Med. Pharm. Allied Sci. 2021, 10, 3484–3493. [Google Scholar] [CrossRef]
- Ranade, D.S.; Bapat, A.M.; Ramteke, S.N.; Joshi, B.N.; Roussel, P.; Tomas, A.; Deschamps, P.; Kulkarni, P.P. Thiosemicarbazone Modification of 3-Acetyl Coumarin Inhibits Aβ Peptide Aggregation and Protect against Aβ-Induced Cytotoxicity. Eur. J. Med. Chem. 2016, 121, 803–809. [Google Scholar] [CrossRef]
- Shivakumar, L.; Minna, J.; Sakamaki, T.; Pestell, R.; White, M.A. The RASSF1A Tumor Suppressor Blocks Cell Cycle Progression and Inhibits Cyclin D1 Accumulation. Mol. Cell. Biol. 2002, 22, 4309–4318. [Google Scholar] [CrossRef]
- Matsumura, I.; Kitamura, T.; Wakao, H.; Tanaka, H.; Hashimoto, K.; Albanese, C.; Downward, J.; Pestell, R.G.; Kanakura, Y. Transcriptional Regulation of the Cyclin D1 Promoter by STAT5: Its Involvement in Cytokine-dependent Growth of Hematopoietic Cells. EMBO J. 1999, 18, 1367–1377. [Google Scholar] [CrossRef]
- Wang, T.C.; Cardiff, R.D.; Zukerberg, L.; Lees, E.; Arnold, A.; Schmidt, E.V. Mammary Hyperplasia and Carcinoma in MMTV-Cyclin D1 Transgenic Mice. Nature 1994, 369, 669–671. [Google Scholar] [CrossRef]
- Guo, Z.Y.; Hao, X.H.; Tan, F.F.; Pei, X.; Shang, L.M.; Jiang, X.L.; Yang, F. The Elements of Human Cyclin D1 Promoter and Regulation Involved. Clin. Epigenetics 2011, 2, 63–76. [Google Scholar] [CrossRef]
- Prall, O.W.J.; Rogan, E.M.; Musgrove, E.A.; Watts, C.K.W.; Sutherland, R.L. C-Myc or Cyclin D1 Mimics Estrogen Effects on Cyclin E-Cdk2 Activation and Cell Cycle Reentry. Mol. Cell. Biol. 1998, 18, 4499–4508. [Google Scholar] [CrossRef]
- Inducible Overexpression of Cyclin D1 in Breast Cancer Cells Reverses the Growth-Inhibitory Effects of Antiestrogens.|Clinical Cancer Research|American Association for Cancer Research. Available online: https://aacrjournals.org/clincancerres/article/3/6/849/7941/Inducible-overexpression-of-cyclin-D1-in-breast (accessed on 2 December 2024).
- Garson, J.A.; Grant, P.R.; Ayliffe, U.; Ferns, R.B.; Tedder, R.S. Real-Time PCR Quantitation of Hepatitis B Virus DNA Using Automated Sample Preparation and Murine Cytomegalovirus Internal Control. J. Virol. Methods 2005, 126, 207–213. [Google Scholar] [CrossRef]
- Ginzinger, D.G. Gene Quantification Using Real-Time Quantitative PCR: An Emerging Technology Hits the Mainstream. Exp. Hematol. 2002, 30, 503–512. [Google Scholar] [CrossRef]
- Wong, M.L.; Medrano, J.F. Real-Time PCR for MRNA Quantitation. Biotechniques 2018, 39, 75–85. [Google Scholar] [CrossRef]
- Bustin, S.A. Absolute Quantification of MRNA Using Real-Time Reverse Transcription Polymerase Chain Reaction Assays. J. Mol. Endocrinol. 2000, 25, 169–193. [Google Scholar] [CrossRef]
- Pfaffl, M.W.; Tichopad, A.; Prgomet, C.; Neuvians, T.P. Determination of Stable Housekeeping Genes, Differentially Regulated Target Genes and Sample Integrity: BestKeeper–Excel-Based Tool Using Pair-Wise Correlations. Biotechnol. Lett. 2004, 26, 509–515. [Google Scholar] [CrossRef]
- Vandesompele, J.; De Preter, K.; Pattyn, F.; Poppe, B.; Van Roy, N.; De Paepe, A.; Speleman, F. Accurate Normalization of Real-Time Quantitative RT-PCR Data by Geometric Averaging of Multiple Internal Control Genes. Genome Biol. 2002, 3, research0034.1. [Google Scholar] [CrossRef]
- Bao, Z.; Huang, Y.; Chen, J.; Wang, Z.; Qian, J.; Xu, J.; Zhao, Y. Validation of Reference Genes for Gene Expression Normalization in RAW264.7 Cells under Different Conditions. BioMed Res. Int. 2019, 2019, 6131879. [Google Scholar] [CrossRef]
- Radonić, A.; Thulke, S.; Mackay, I.M.; Landt, O.; Siegert, W.; Nitsche, A. Guideline to Reference Gene Selection for Quantitative Real-Time PCR. Biochem. Biophys. Res. Commun. 2004, 313, 856–862. [Google Scholar] [CrossRef]
- Rao, X.; Huang, X.; Zhou, Z.; Lin, X. An Improvement of the 2ˆ(–Delta Delta CT) Method for Quantitative Real-Time Polymerase Chain Reaction Data Analysis. Biostat. Bioinforma. Biomath. 2013, 3, 71. [Google Scholar]
- Stark, C.; Breitkreutz, B.J.; Reguly, T.; Boucher, L.; Breitkreutz, A.; Tyers, M. Biogrid: A General Repository for Interaction Datasets. Nucleic Acids. Res. 2006, 34, 535–539. [Google Scholar] [CrossRef]
- Kawai, H.; Li, H.; Chun, P.; Avraham, S.; Avraham, H.K. Direct Interaction between BRCA1 and the Estrogen Receptor Regulates Vascular Endothelial Growth Factor (VEGF) Transcription and Secretion in Breast Cancer Cells. Oncogene 2002, 21, 7730–7739. [Google Scholar] [CrossRef]
- Fan, S.; Ma, Y.X.; Yuan, R.Q.; Meng, Q.; Wang, J.A.; Goldberg, I.D.; Rosen, E.M.; Wang, C.; Pestell, R.G.; Erdos, M.; et al. P300 Modulates the BRCA1 Inhibition of Estrogen Receptor Activity. Cancer Res. 2002, 62, 141–151. [Google Scholar]
- Nakuci, E.; Xu, M.; Pujana, M.A.; Valls, J.; ElShamy, W.M. Geminin Is Bound to Chromatin in G2/M Phase to Promote Proper Cytokinesis. Int. J. Biochem. Cell Biol. 2006, 38, 1207–1220. [Google Scholar] [CrossRef]
- Hsu, M.-F.; Kuo, C.-J.; Chang, K.-T.; Chang, H.-C.; Chou, C.-C.; Ko, T.-P.; Shr, H.-L.; Chang, G.-G.; Wang, A.H.-J.; Liang, P.-H. Mechanism of the Maturation Process of SARS-CoV 3CL Protease. J. Biol. Chem. 2005, 280, 31257–31266. [Google Scholar] [CrossRef]
- Dizin, E.; Irminger-Finger, I. Negative Feedback Loop of BRCA1-BARD1 Ubiquitin Ligase on Estrogen Receptor Alpha Stability and Activity Antagonized by Cancer-Associated Isoform of BARD1. Int. J. Biochem. Cell Biol. 2010, 42, 693–700. [Google Scholar] [CrossRef]
- Ma, Y.; Fan, S.; Hu, C.; Meng, Q.; Fuqua, S.A.; Pestell, R.G.; Tomita, Y.A.; Rosen, E.M. BRCA1 Regulates Acetylation and Ubiquitination of Estrogen Receptor-Alpha. Mol. Endocrinol. 2010, 24, 76–90. [Google Scholar] [CrossRef]
- Ma, Y.; Hu, C.; Riegel, A.T.; Fan, S.; Rosen, E.M. Growth Factor Signaling Pathways Modulate BRCA1 Repression of Estrogen Receptor-Alpha Activity. Mol. Endocrinol. 2007, 21, 1905–1923. [Google Scholar] [CrossRef]
- Jung, Y.S.; Chun, H.Y.; Yoon, M.H.; Park, B.J. Elevated Estrogen Receptor-α in VHL-Deficient Condition Induces Microtubule Organizing Center Amplification via Disruption of BRCA1/Rad51 Interaction. Neoplasia 2014, 16, 1070–1081. [Google Scholar] [CrossRef]
- Stewart, M.D.; Duncan, E.D.; Coronado, E.; DaRosa, P.A.; Pruneda, J.N.; Brzovic, P.S.; Klevit, R.E. Tuning BRCA1 and BARD1 Activity to Investigate RING Ubiquitin Ligase Mechanisms. Protein Sci. 2017, 26, 475–483. [Google Scholar] [CrossRef]
- Zheng, L.; Annab, L.A.; Afshari, C.A.; Lee, W.H.; Boyer, T.G. BRCA1 Mediates Ligand-Independent Transcriptional Repression of the Estrogen Receptor. Proc. Natl. Acad. Sci. USA 2001, 98, 9587–9592. [Google Scholar] [CrossRef]
- Gerlier, D.; Thomasset, N. Use of MTT Colorimetric Assay to Measure Cell Activation. J. Immunol. Methods 1986, 94, 57–63. [Google Scholar] [CrossRef]
- Berridge, M.V.; Tan, A.S. Characterization of the Cellular Reduction of 3-(4,5-Dimethylthiazol-2-Yl)-2,5-Diphenyltetrazolium Bromide (MTT): Subcellular Localization, Substrate Dependence, and Involvement of Mitochondrial Electron Transport in MTT Reduction. Arch. Biochem. Biophys. 1993, 303, 474–482. [Google Scholar] [CrossRef]
- Singh, M.; Patra, S.; Singh, R.K. Common Techniques and Methods for Screening of Natural Products for Developing of Anticancer Drugs. In Evolutionary Diversity as a Source for Anticancer Molecules; Academic Press: Cambridge, MA, USA, 2021; pp. 323–353. [Google Scholar] [CrossRef]
- Szklarczyk, D.; Morris, J.H.; Cook, H.; Kuhn, M.; Wyder, S.; Simonovic, M.; Santos, A.; Doncheva, N.T.; Roth, A.; Bork, P.; et al. The STRING Database in 2017: Quality-Controlled Protein-Protein Association Networks, Made Broadly Accessible. Nucleic Acids Res. 2017, 45, D362–D368. [Google Scholar] [CrossRef]
- Szklarczyk, D.; Franceschini, A.; Wyder, S.; Forslund, K.; Heller, D.; Huerta-Cepas, J.; Simonovic, M.; Roth, A.; Santos, A.; Tsafou, K.P.; et al. STRING V10: Protein-Protein Interaction Networks, Integrated over the Tree of Life. Nucleic Acids Res. 2015, 43, D447–D452. [Google Scholar] [CrossRef]
- Suganya, J.; Radha, M.; Naorem, D.L.; Nishandhini, M. In Silico Docking Studies of Selected Flavonoids-Natural Healing Agents Against Breast Cancer. Asian Pacific J. Cancer Prev. 2014, 15, 8155–8159. [Google Scholar] [CrossRef]
- Nutho, B.; Mahalapbutr, P. Hengphasatporn Using PyMOL as a Platform for Computational Drug Design. Science 2020, 9, e1298. [Google Scholar] [CrossRef]
- Ertl, P.; Rohde, B.; Selzer, P. Fast Calculation of Molecular Polar Surface Area as a Sum of Fragment-Based Contributions and Its Application to the Prediction of Drug Transport Properties. J. Med. Chem. 2000, 43, 3714–3717. [Google Scholar] [CrossRef]
- Daina, A.; Michielin, O.; Zoete, V. ILOGP: A Simple, Robust, and Efficient Description of n-Octanol/Water Partition Coefficient for Drug Design Using the GB/SA Approach. J. Chem. Inf. Model. 2014, 54, 3284–3301. [Google Scholar] [CrossRef]
- Lipinski, C.A.; Lombardo, F.; Dominy, B.W.; Feeney, P.J. Experimental and Computational Approaches to Estimate Solubility and Permeability in Drug Discovery and Development Settings. Adv. Drug Deliv. Rev. 1997, 23, 3–25. [Google Scholar] [CrossRef]
- Ali, J.; Camilleri, P.; Brown, M.B.; Hutt, A.J.; Kirton, S.B. Revisiting the General Solubility Equation: In Silico Prediction of Aqueous Solubility Incorporating the Effect of Topographical Polar Surface Area. J. Chem. Inf. Model. 2012, 52, 420–428. [Google Scholar] [CrossRef]
- Daina, A.; Zoete, V. A BOILED-Egg to Predict Gastrointestinal Absorption and Brain Penetration of Small Molecules. ChemMedChem 2016, 11, 1117–1121. [Google Scholar] [CrossRef]
- Chang, B.Y.; Kim, S.A.; Malla, B.; Kim, S.Y. The Effect of Selective Estrogen Receptor Modulators (Serms) on the Tamoxifen Resistant Breast Cancer Cells. Toxicol. Res. 2011, 27, 85–93. [Google Scholar] [CrossRef]
- PyMOL|Pymol.Org. Available online: https://pymol.org/2/ (accessed on 24 December 2022).
| S. No | Experimental Evidence Code | Direction of Interaction | Dataset |
|---|---|---|---|
| 1 | Affinity Capture-Western | BAIT/HIT | Fan S (2001) [17] |
| BAIT/HIT | Kawai H (2002) [40] | ||
| BAIT/HIT | Fan S (2002) [41] | ||
| HIT | Nakuci E (2006) [42] | ||
| BAIT | Wang C (2005) [43] | ||
| BAIT/HIT | Dizin E (2010) [44] | ||
| BAIT/HIT | Ma Y (2010) [45] | ||
| BAIT/HIT | Ma YX (2005) [18] | ||
| BAIT/HIT | Ma Y (2007) [46] | ||
| HIT | Jung YS (2014) [47] | ||
| 2 | Biochemical Activity | BAIT | Stewart MD (2017) [48] |
| 3 | Co-localization | BAIT | Zheng L (2001) [49] |
| 4 | Reconstituted Complex | BAIT | Fan S (2001) [17] |
| HIT | Wang C (2005) [16] | ||
| HIT | Ma YX (2005) [18] | ||
| BAIT/HIT | Kawai H (2002) [40] |
| S. No | Compound | VERO (µM) | MDA MB 231 (µM) |
|---|---|---|---|
| 1 | 7a | 513.18 | 357.31 |
| 2 | 7b | 165.31 | 70.46 |
| 3 | 7c | 1631.29 | 307.69 |
| 4 | 7e | 775.56 | 409.09 |
| 5 | 7h | 148.69 | 80.30 |
| 6 | 7i | 291.55 | 237.05 |
| 7 | 7j | 213.64 | 151.33 |
| 8 | 7k | 234.80 | 151.93 |
| 9 | 7l | 293.44 | 353.27 |
| 10 | 7m | 149.32 | 90.49 |
| 11 | 7n | 405.19 | 189.61 |
| 12 | 7o | 257.53 | 136.98 |
| 13 | 9a | 293.36 | 250.00 |
| 14 | 9b | 60.86 | 14.49 |
| 15 | 9c | 87.37 | 61.48 |
| 16 | 9e | 135.29 | 79.41 |
| 17 | 9f | 200.96 | 239.70 |
| 18 | 9g | 283.42 | 342.24 |
| 19 | 9i | 450.49 | 222.77 |
| 20 | 9j | 429.79 | 232.09 |
| 21 | 9k | 252.63 | 278.94 |
| 22 | 9l | 87.719 | 35.08 |
| 23 | 9m | 68.73 | 42.12 |
| 24 | 9n | 119.30 | 47.72 |
| Standard | Raloxifene [62] | - | 13.7 |
| S. No | Compound | Control | CyclinD1 | BCL2 |
|---|---|---|---|---|
| 1 | MDA-MB-231Cell Control | 1 | - | - |
| 2 | 9l | 1 | −0.217637640 | −0.3208564740 |
| 3 | 9b | 1 | 1.484523570 | −0.3737123121 |
| 4 | 9m | 1 | −0.214855074 | −0.3763116868 |
| S. No | Compound | Glide g Score | XP G Score | Glide vdW | Glide Columb | Glide Energy |
|---|---|---|---|---|---|---|
| 1 | 9b | −10.268 | −10.268 | −45.316 | −2.369 | −47.685 |
| 2 | 9l | −9.854 | −9.854 | −38.549 | −3.247 | −41.796 |
| 3 | 9m | −10.569 | −10.569 | −46.786 | −2.648 | −49.434 |
| S. No | Compound | MMGBSA dG Bind | MMGBSA dG Bind Coloumb | MMGBSA dG Bind Covalent | MMGBSA dG Bind H Bond | MMGBSA dG Bind vdW |
| 1 | 9b | −52.99 | 10.36 | 7.56 | 0.45 | −71.36 |
| 2 | 9l | −42.58 | 9.54 | 9.21 | 1.26 | −62.59 |
| 3 | 9m | −48.47 | 10.72 | 6.32 | 1.05 | −66.56 |
| Compound | QPlogPw | QPlogPo/w | QPlogS | QPlogBB | QPlogKp | IP(eV) | HOA | TPSA | RoF |
|---|---|---|---|---|---|---|---|---|---|
| 9b | 12.74 | 3.574 | −5.454 | −0.297 | −1.415 | 8.524 | 3 | 80.213 | 0 |
| 9l | 13.687 | 2.745 | −4.466 | −0.411 | −1.909 | 8.244 | 3 | 79.027 | 0 |
| 9m | 11.95 | 3.744 | −4.696 | −0.281 | −1.973 | 8.426 | 3 | 71.469 | 0 |
| Std Range | 4 to 45 | 2 to 6.5 | −6.5 to 0.5 | −3 to 1.2 | −8 to −1 | −7.9 to 10.5 | −1.5 to 1.5 | 7 to 200 | 0 to 4 |
| Compound | Predicted LD50 (mg/Kg) | Hepatotoxicity | Immuno Toxicity | Mutagenicity |
|---|---|---|---|---|
| 9b | 560 (Class IV) | 0.76 (Active) | 0.90 (Active) | 0.51 |
| 9l | 500 (Class IV) | 0.60 | 0.98 (Active) | 0.64 |
| 9m | 826 (Class IV) | 0.56 | 0.96 (Active) | 0.50 |
Disclaimer/Publisher’s Note: The statements, opinions and data contained in all publications are solely those of the individual author(s) and contributor(s) and not of MDPI and/or the editor(s). MDPI and/or the editor(s) disclaim responsibility for any injury to people or property resulting from any ideas, methods, instructions or products referred to in the content. |
© 2025 by the authors. Licensee MDPI, Basel, Switzerland. This article is an open access article distributed under the terms and conditions of the Creative Commons Attribution (CC BY) license (https://creativecommons.org/licenses/by/4.0/).
Share and Cite
Shyam Sundar, P.; Selvaraj, J.; Alagarsamy, V.; Solomon, V.R.; Natarajan, J. A New Class of BRCA1 Mimetics for ERα-Positive Breast Cancer Therapy: Design, Synthesis, In Silico Screening, In Vitro Assay, and Gene Expression Analysis. Life 2025, 15, 581. https://doi.org/10.3390/life15040581
Shyam Sundar P, Selvaraj J, Alagarsamy V, Solomon VR, Natarajan J. A New Class of BRCA1 Mimetics for ERα-Positive Breast Cancer Therapy: Design, Synthesis, In Silico Screening, In Vitro Assay, and Gene Expression Analysis. Life. 2025; 15(4):581. https://doi.org/10.3390/life15040581
Chicago/Turabian StyleShyam Sundar, Pottabathula, Jubie Selvaraj, Veerachamy Alagarsamy, Viswas Raja Solomon, and Jawahar Natarajan. 2025. "A New Class of BRCA1 Mimetics for ERα-Positive Breast Cancer Therapy: Design, Synthesis, In Silico Screening, In Vitro Assay, and Gene Expression Analysis" Life 15, no. 4: 581. https://doi.org/10.3390/life15040581
APA StyleShyam Sundar, P., Selvaraj, J., Alagarsamy, V., Solomon, V. R., & Natarajan, J. (2025). A New Class of BRCA1 Mimetics for ERα-Positive Breast Cancer Therapy: Design, Synthesis, In Silico Screening, In Vitro Assay, and Gene Expression Analysis. Life, 15(4), 581. https://doi.org/10.3390/life15040581