
Acute Effects of Rest Redistribution Training on Physical and Physiological Responses in Anxious Female College Students

Abstract
1. Introduction
2. Materials and Methods
2.1. Participants
2.2. Study Design
2.3. Training Protocol
2.4. Measurements
2.4.1. Vertical Jump Testing
2.4.2. HRV Indicator Evaluation
2.4.3. Ratings of Perceived Exertion Testing
2.4.4. One-Repetition Maximum Testing
2.4.5. Measurement of Anxiety Level
2.5. Statistical Analysis
3. Results
3.1. Vertical Jump
3.2. Heart Rate Variability
3.3. Ratings of Perceived Exertion
4. Discussion
4.1. Comparative Analysis of Vertical Jump Changes
4.2. Comparative Analysis of Heart Rate Variability Changes
4.3. Comparative Analysis of Ratings of Perceived Exertion Changes
4.4. Limitations
4.5. Future Directions
5. Conclusions
Author Contributions
Funding
Institutional Review Board Statement
Informed Consent Statement
Data Availability Statement
Conflicts of Interest
Abbreviations
| RR | Rest Redistribution Training |
| TS | Traditional Set Structure Training |
| VJ | Vertical Jump |
| HRV | Heart Rate Variability |
| RPE | Perceived Exertion Rating |
| SJ | Squat Jump |
| CMJ | Countermovement Jump |
| SDNN | Standard Deviation of Normal-to-Normal Intervals |
| RMSSD | Root Mean Square of Successive Differences |
| ANS | Autonomic Nervous System |
| RT | Resistance Training |
| 1RM | One-Repetition Maximum |
| LF | Low-Frequency Power |
| HF | High-Frequency Power |
| RIR | Repetitions in Reserve-Based Rating of Perceived Exertion Scale for Resistance Training |
| SAS | Self-Rating Anxiety Scale |
| MCID | Minimal Clinically Important Difference |
| SSC | Stretch-Shortening Cycle |
References
- Remes, O.; Brayne, C.; Van Der Linde, R.; Lafortune, L. A Systematic Review of Reviews on the Prevalence of Anxiety Disorders in Adult Populations. Brain Behav. 2016, 6, e00497. [Google Scholar] [CrossRef]
- Guo, X.; Meng, Z.; Huang, G.; Fan, J.; Zhou, W.; Ling, W.; Jiang, J.; Long, J.; Su, L. Meta-Analysis of the Prevalence of Anxiety Disorders in Mainland China from 2000 to 2015. Sci. Rep. 2016, 6, 28033. [Google Scholar] [CrossRef]
- Oyola, M.G.; Handa, R.J. Hypothalamic–Pituitary–Adrenal and Hypothalamic–Pituitary–Gonadal Axes: Sex Differences in Regulation of Stress Responsivity. Stress 2017, 20, 476–494. [Google Scholar] [CrossRef]
- Paniccia, M.; Paniccia, D.; Thomas, S.; Taha, T.; Reed, N. Clinical and Non-Clinical Depression and Anxiety in Young People: A Scoping Review on Heart Rate Variability. Auton. Neurosci. 2017, 208, 1–14. [Google Scholar] [CrossRef]
- Chang, H.-A.; Fang, W.-H.; Wan, F.-J.; Tzeng, N.-S.; Liu, Y.-P.; Shyu, J.-F.; Chang, T.-C.; Huang, S.-Y.; Chang, C.-C. Attenuated Vagally-Mediated Heart Rate Variability at Rest and in Response to Postural Maneuvers in Patients with Generalized Anxiety Disorder. Psychol. Med. 2020, 50, 1433–1441. [Google Scholar] [CrossRef]
- Westcott, W.L. Resistance Training Is Medicine: Effects of Strength Training on Health. Curr. Sports Med. Rep. 2012, 11, 209–216. [Google Scholar] [CrossRef]
- Ruegsegger, G.N.; Booth, F.W. Health Benefits of Exercise. Cold Spring Harb. Perspect. Med. 2018, 8, a029694. [Google Scholar] [CrossRef]
- Manresa-Rocamora, A.; Sarabia, J.M.; Javaloyes, A.; Flatt, A.A.; Moya-Ramón, M. Heart Rate Variability-Guided Training for Enhancing Cardiac-Vagal Modulation, Aerobic Fitness, and Endurance Performance: A Methodological Systematic Review with Meta-Analysis. Int. J. Environ. Res. Public Health 2021, 18, 10299. [Google Scholar] [CrossRef]
- Bhati, P.; Moiz, J.A.; Menon, G.R.; Hussain, M.E. Does Resistance Training Modulate Cardiac Autonomic Control? A Systematic Review and Meta-Analysis. Clin. Auton. Res. 2019, 29, 75–103. [Google Scholar] [CrossRef]
- Li, R.; Yan, R.; Cheng, W.; Ren, H. Effect of Resistance Training on Heart Rate Variability of Anxious Female College Students. Front. Public Health 2022, 10, 1050469. [Google Scholar] [CrossRef]
- Athanasiou, N.; Bogdanis, G.C.; Mastorakos, G. Endocrine Responses of the Stress System to Different Types of Exercise. Rev. Endocr. Metab. Disord. 2023, 24, 251–266. [Google Scholar] [CrossRef]
- Kingsley, J.; Hochgesang, S.; Brewer, A.; Buxton, E.; Martinson, M.; Heidner, G. Autonomic Modulation in Resistance-Trained Individuals after Acute Resistance Exercise. Int. J. Sports Med. 2014, 35, 851–856. [Google Scholar] [CrossRef]
- Kingsley, J.D.; Figueroa, A. Acute and Training Effects of Resistance Exercise on Heart Rate Variability. Clin. Physiol. Funct. Imaging 2016, 36, 179–187. [Google Scholar] [CrossRef]
- Mcleod, J.C.; Currier, B.S.; Lowisz, C.V.; Phillips, S.M. The Influence of Resistance Exercise Training Prescription Variables on Skeletal Muscle Mass, Strength, and Physical Function in Healthy Adults: An Umbrella Review. J. Sport Health Sci. 2024, 13, 47–60. [Google Scholar] [CrossRef]
- Kraemer, W.J.; Ratamess, N.A. Fundamentals of Resistance Training: Progression and Exercise Prescription. Med. Sci. Sports Exerc. 2004, 36, 674–688. [Google Scholar] [CrossRef]
- Izquierdo, M.; González-Badillo, J.; Häkkinen, K.; Ibáñez, J.; Kraemer, W.; Altadill, A.; Eslava, J.; Gorostiaga, E. Effect of Loading on Unintentional Lifting Velocity Declines During Single Sets of Repetitions to Failure During Upper and Lower Extremity Muscle Actions. Int. J. Sports Med. 2006, 27, 718–724. [Google Scholar] [CrossRef]
- Hooper, D.R.; Szivak, T.K.; Comstock, B.A.; Dunn-Lewis, C.; Apicella, J.M.; Kelly, N.A.; Creighton, B.C.; Flanagan, S.D.; Looney, D.P.; Volek, J.S.; et al. Effects of Fatigue from Resistance Training on Barbell Back Squat Biomechanics. J. Strength Cond. Res. 2014, 28, 1127–1134. [Google Scholar] [CrossRef]
- González-Hernández, J.M.; García-Ramos, A.; Castaño-Zambudio, A.; Capelo-Ramírez, F.; Marquez, G.; Boullosa, D.; Jiménez-Reyes, P. Mechanical, Metabolic, and Perceptual Acute Responses to Different Set Configurations in Full Squat. J. Strength Cond. Res. 2020, 34, 1581–1590. [Google Scholar] [CrossRef]
- Lea, J.W.D.; O’Driscoll, J.M.; Hulbert, S.; Scales, J.; Wiles, J.D. Convergent Validity of Ratings of Perceived Exertion During Resistance Exercise in Healthy Participants: A Systematic Review and Meta-Analysis. Sports Med. Open 2022, 8, 2. [Google Scholar] [CrossRef]
- Davies, T.B.; Kuang, K.; Orr, R.; Halaki, M.; Hackett, D. Effect of Movement Velocity During Resistance Training on Dynamic Muscular Strength: A Systematic Review and Meta-Analysis. Sports Med. 2017, 47, 1603–1617. [Google Scholar] [CrossRef]
- Bibeau, W.S.; Moore, J.B.; Mitchell, N.G.; Vargas-Tonsing, T.; Bartholomew, J.B. Effects of Acute Resistance Training of Different Intensities and Rest Periods on Anxiety and Affect. J. Strength Cond. Res. 2010, 24, 2184–2191. [Google Scholar] [CrossRef]
- Tufano, J.J.; Brown, L.E.; Haff, G.G. Theoretical and Practical Aspects of Different Cluster Set Structures: A Systematic Review. J. Strength Cond. Res. 2017, 31, 848–867. [Google Scholar] [CrossRef]
- Jukic, I.; Ramos, A.G.; Helms, E.R.; McGuigan, M.R.; Tufano, J.J. Acute Effects of Cluster and Rest Redistribution Set Structures on Mechanical, Metabolic, and Perceptual Fatigue During and After Resistance Training: A Systematic Review and Meta-Analysis. Sports Med. 2020, 50, 2209–2236. [Google Scholar] [CrossRef]
- Cuevas-Aburto, J.; Jukic, I.; Chirosa-Ríos, L.J.; González-Hernández, J.M.; Janicijevic, D.; Barboza-González, P.; Guede-Rojas, F.; García-Ramos, A. Effect of Traditional, Cluster, and Rest Redistribution Set Configurations on Neuromuscular and Perceptual Responses During Strength-Oriented Resistance Training. J. Strength Cond. Res. 2022, 36, 1490–1497. [Google Scholar] [CrossRef]
- Kassiano, W.; De Vasconcelos Costa, B.D.; Lima-Júnior, D.; Gantois, P.; De Souza Fonseca, F.; Da Cunha Costa, M.; De Sousa Fortes, L. Parasympathetic Nervous Activity Responses to Different Resistance Training Systems. Int. J. Sports Med. 2021, 42, 82–89. [Google Scholar] [CrossRef]
- Servant, D.; Logier, R.; Mouster, Y.; Goudemand, M. La variabilité de la fréquence cardiaque. Intérêts en psychiatrie. L’Encéphale 2009, 35, 423–428. [Google Scholar] [CrossRef]
- Jukic, I.; Van Hooren, B.; Ramos, A.G.; Helms, E.R.; McGuigan, M.R.; Tufano, J.J. The Effects of Set Structure Manipulation on Chronic Adaptations to Resistance Training: A Systematic Review and Meta-Analysis. Sports Med. 2021, 51, 1061–1086. [Google Scholar] [CrossRef]
- Davies, T.B.; Tran, D.L.; Hogan, C.M.; Haff, G.G.; Latella, C. Chronic Effects of Altering Resistance Training Set Configurations Using Cluster Sets: A Systematic Review and Meta-Analysis. Sports Med. 2021, 51, 707–736. [Google Scholar] [CrossRef]
- Silva, B.L.; Alves De Oliveira, L.; Costa, C.M.; Guimarães, C.Q.; Vieira, L.S.; Pernambuco, A.P. A Pilot Study of the Effects of Suboccipital Fascial Release on Heart Rate Variability in Workers in the Clothing Industry: Randomized Clinical Trial. J. Bodyw. Mov. Ther. 2021, 25, 223–229. [Google Scholar] [CrossRef]
- Gavi, M.B.R.O.; Vassalo, D.V.; Amaral, F.T.; Macedo, D.C.F.; Gava, P.L.; Dantas, E.M.; Valim, V. Strengthening Exercises Improve Symptoms and Quality of Life but Do Not Change Autonomic Modulation in Fibromyalgia: A Randomized Clinical Trial. PLoS ONE 2014, 9, e90767. [Google Scholar] [CrossRef]
- Davies, R.; Carson, B.; Jakeman, P. The Effect of Whey Protein Supplementation on the Temporal Recovery of Muscle Function Following Resistance Training: A Systematic Review and Meta-Analysis. Nutrients 2018, 10, 221. [Google Scholar] [CrossRef]
- Davies, R.W.; Carson, B.P.; Jakeman, P.M. Sex Differences in the Temporal Recovery of Neuromuscular Function Following Resistance Training in Resistance Trained Men and Women 18 to 35 Years. Front. Physiol. 2018, 9, 1480. [Google Scholar] [CrossRef] [PubMed]
- Krzysztofik, M.; Wilk, M.; Wojdała, G.; Gołaś, A. Maximizing Muscle Hypertrophy: A Systematic Review of Advanced Resistance Training Techniques and Methods. Int. J. Environ. Res. Public Health 2019, 16, 4897. [Google Scholar] [CrossRef] [PubMed]
- Zourdos, M.C.; Klemp, A.; Dolan, C.; Quiles, J.M.; Schau, K.A.; Jo, E.; Helms, E.; Esgro, B.; Duncan, S.; Garcia Merino, S.; et al. Novel Resistance Training–Specific Rating of Perceived Exertion Scale Measuring Repetitions in Reserve. J. Strength Cond. Res. 2016, 30, 267–275. [Google Scholar] [CrossRef]
- Guo, W.; Liang, M.; Lin, J.; Zhou, R.; Zhao, N.; Aidar, F.J.; Oliveira, R.; Badicu, G. Time Duration of Post-Activation Performance Enhancement (PAPE) in Elite Male Sprinters with Different Strength Levels. Children 2022, 10, 53. [Google Scholar] [CrossRef]
- Sánchez-Medina, L.; González-Badillo, J.J. Velocity Loss as an Indicator of Neuromuscular Fatigue during Resistance Training. Med. Sci. Sports Exerc. 2011, 43, 1725–1734. [Google Scholar] [CrossRef]
- Tarvainen, M.P.; Niskanen, J.-P.; Lipponen, J.A.; Ranta-aho, P.O.; Karjalainen, P.A. Kubios HRV—Heart Rate Variability Analysis Software. Comput. Methods Programs Biomed. 2014, 113, 210–220. [Google Scholar] [CrossRef]
- Helms, E.R.; Cronin, J.; Storey, A.; Zourdos, M.C. Application of the Repetitions in Reserve-Based Rating of Perceived Exertion Scale for Resistance Training. Strength Cond. J. 2016, 38, 42–49. [Google Scholar] [CrossRef]
- LeSuer, D.A.; McCormick, J.H.; Mayhew, J.L.; Wasserstein, R.L.; Arnold, M.D. The Accuracy of Prediction Equations for Estimating 1-RM Performance in the Bench Press, Squat, and Deadlift. J. Strength Cond. Res. 1997, 11, 211. [Google Scholar] [CrossRef]
- Dunstan, D.A.; Scott, N. Norms for Zung’s Self-Rating Anxiety Scale. BMC Psychiatry 2020, 20, 90. [Google Scholar] [CrossRef]
- Coventry, E.; O’Connor, K.M.; Hart, B.A.; Earl, J.E.; Ebersole, K.T. The Effect of Lower Extremity Fatigue on Shock Attenuation during Single-Leg Landing. Clin. Biomech. 2006, 21, 1090–1097. [Google Scholar] [CrossRef] [PubMed]
- Chappell, J.D.; Herman, D.C.; Knight, B.S.; Kirkendall, D.T.; Garrett, W.E.; Yu, B. Effect of Fatigue on Knee Kinetics and Kinematics in Stop-Jump Tasks. Am. J. Sports Med. 2005, 33, 1022–1029. [Google Scholar] [CrossRef] [PubMed]
- Washif, J.; Hébert-Losier, K.; Gill, N.; Zainuddin, M.; Nasruddin, N.; Zakaria, A.; Beaven, C. Reliability, Interrelationships, and Minimal Detectable Changes in Strength and Power Metrics among Well-Trained Rugby Sevens Players. Biol. Sport 2024, 41, 231–241. [Google Scholar] [CrossRef]
- Hardee, J.P.; Travis Triplett, N.; Utter, A.C.; Zwetsloot, K.A.; Mcbride, J.M. Effect of Interrepetition Rest on Power Output in the Power Clean. J. Strength Cond. Res. 2012, 26, 883–889. [Google Scholar] [CrossRef]
- Merrigan, J.J.; Tufano, J.J.; Oliver, J.M.; White, J.B.; Fields, J.B.; Jones, M.T. Reducing the Loss of Velocity and Power in Women Athletes via Rest Redistribution. Int. J. Sports Physiol. Perform. 2020, 15, 255–261. [Google Scholar] [CrossRef]
- Gorostiaga, E.M.; Navarro-Amézqueta, I.; Calbet, J.A.L.; Hellsten, Y.; Cusso, R.; Guerrero, M.; Granados, C.; González-Izal, M.; Ibañez, J.; Izquierdo, M. Energy Metabolism during Repeated Sets of Leg Press Exercise Leading to Failure or Not. PLoS ONE 2012, 7, e40621. [Google Scholar] [CrossRef]
- Tufano, J.J.; Conlon, J.A.; Nimphius, S.; Brown, L.E.; Seitz, L.B.; Williamson, B.D.; Haff, G.G. Maintenance of Velocity and Power with Cluster Sets During High-Volume Back Squats. Int. J. Sports Physiol. Perform. 2016, 11, 885–892. [Google Scholar] [CrossRef]
- Engel, L.; Beaton, D.E.; Touma, Z. Minimal Clinically Important Difference. Rheum. Dis. Clin. N. Am. 2018, 44, 177–188. [Google Scholar] [CrossRef]
- Thorpe, R.T.; Atkinson, G.; Drust, B.; Gregson, W. Monitoring Fatigue Status in Elite Team-Sport Athletes: Implications for Practice. Int. J. Sports Physiol. Perform. 2017, 12, S2-27–S2-34. [Google Scholar] [CrossRef]
- Van Hooren, B.; Zolotarjova, J. The Difference Between Countermovement and Squat Jump Performances: A Review of Underlying Mechanisms with Practical Applications. J. Strength Cond. Res. 2017, 31, 2011–2020. [Google Scholar] [CrossRef]
- Marasingha-Arachchige, S.U.; Rubio-Arias, J.Á.; Alcaraz, P.E.; Chung, L.H. Factors That Affect Heart Rate Variability Following Acute Resistance Exercise: A Systematic Review and Meta-Analysis. J. Sport Health Sci. 2022, 11, 376–392. [Google Scholar] [CrossRef] [PubMed]
- Avela, J.; Komi, P.V.; Santos, P.M. Effects of Differently Induced Stretch Loads on Neuromuscular Control in Drop Jump Exercise. Eur. J. Appl. Physiol. 1996, 72, 553–562. [Google Scholar] [CrossRef] [PubMed]
- Luo, Q.; Li, X.; Zhao, J.; Jiang, Q.; Wei, D. The Effect of Slow Breathing in Regulating Anxiety. Sci. Rep. 2025, 15, 8417. [Google Scholar] [CrossRef]
- Mayo, X.; Iglesias-Soler, E.; Carballeira-Fernández, E.; Fernández-Del-Olmo, M. A Shorter Set Reduces the Loss of Cardiac Autonomic and Baroreflex Control after Resistance Exercise. Eur. J. Sport Sci. 2016, 16, 996–1004. [Google Scholar] [CrossRef]
- Hackett, D.A.; Johnson, N.A.; Halaki, M.; Chow, C.-M. A Novel Scale to Assess Resistance-Exercise Effort. J. Sports Sci. 2012, 30, 1405–1413. [Google Scholar] [CrossRef]
- Genner, K.M.; Weston, M. A Comparison of Workload Quantification Methods in Relation to Physiological Responses to Resistance Exercise. J. Strength Cond. Res. 2014, 28, 2621–2627. [Google Scholar] [CrossRef]
- Lins-Filho, O.D.L.; Robertson, R.J.; Farah, B.Q.; Rodrigues, S.L.; Cyrino, E.S.; Ritti-Dias, R.M. Effects of Exercise Intensity on Rating of Perceived Exertion During a Multiple-Set Resistance Exercise Session. J. Strength Cond. Res. 2012, 26, 466–472. [Google Scholar] [CrossRef]
- Merrigan, J.J.; Tufano, J.J.; Fields, J.B.; Oliver, J.M.; Jones, M.T. Rest Redistribution Does Not Alter Hormone Responses in Resistance-Trained Women. J. Strength Cond. Res. 2020, 34, 1867–1874. [Google Scholar] [CrossRef]
- Merrigan, J.J.; Jones, M.T.; Padecky, J.; Malecek, J.; Omcirk, D.; Scott, B.R.; Tufano, J.J. Impact of Rest-Redistribution on Fatigue During Maximal Eccentric Knee Extensions. J. Hum. Kinet. 2020, 74, 205–214. [Google Scholar] [CrossRef]
- Santos, A.; Braaten, K.; MacPherson, M.; Vasconcellos, D.; Vis-Dunbar, M.; Lonsdale, C.; Lubans, D.; Jung, M.E. Rates of Compliance and Adherence to High-Intensity Interval Training: A Systematic Review and Meta-Analyses. Int. J. Behav. Nutr. Phys. Act. 2023, 20, 134. [Google Scholar] [CrossRef]
- Mahdaviani, B.; Selk-Ghaffari, M.; Sarzaeim, M.; Thornton, J.S. Barriers and Enablers of Adherence to High-Intensity Interval Training among Patients with Cancer: A Systematic Review and Meta-Analysis. Br. J. Sports Med. 2024, 58, 1285–1294. [Google Scholar] [CrossRef] [PubMed]


| Parameter | RR Protocol | TS Protocol |
|---|---|---|
| Repetitions per set | 8 (4 + 30 s intra-set rest + 4) | 8 consecutive |
| Inter-set rest | 90 s | 120 s |
| Total sets per exercise | 5 | 5 |
| Total session volume | 120 reps (3 exercises) | 120 reps (3 exercises) |
| Protocol | Post-Test/Pre-Test | TS-RR (Between-Group Comparison) | ||||||
|---|---|---|---|---|---|---|---|---|
| Pre-Test | Post-Test | Rate of Change (%) | 95%CI | T-Value | p-Value | Cohen’s d | ||
| Mean ± SD | Mean ± SD | Mean ± SD | ||||||
| SJ performances | ||||||||
| Height, cm | TS | 21.2 ± 2.1 | 19.3 ± 2.5 ** | −8.6 ± 4.6 | −0.05, 0.05 | −0.132 | 0.896 | 0.059 |
| RR | 21.1 ± 2.7 | 20.2 ± 2.3 ** | −8.6 ± 5.5 | |||||
| Avg Power, w | TS | 344.2 ± 149.8 | 304.7 ± 144.9 ** | −13.1 ± 7.4 | −0.05, 0.10 | 0.683 | 0.503 | 0.305 |
| RR | 362.9 ± 137.4 | 313.4 ± 132.6 ** | −15.5 ± 8.0 | |||||
| Peak Power, w | TS | 1150.4 ± 225.4 | 1391.1 ± 218.3 ** | −7.6 ± 5.8 | 0.00, 0.02 | 0.136 | 0.894 | 0.061 |
| RR | 1561.0 ± 199.1 | 1445.1 ± 217.3 ** | −7.9 ± 5.8 | |||||
| CMJ performances | ||||||||
| Height, cm | TS | 20.9 ± 1.8 | 19.0 ± 2.0 ** | −9.7 ± 6.0 | −0.07,0.02 | −1.023 | 0.320 | 0.457 |
| RR | 21.4 ± 2.6 | 19.8 ± 2.3 ** | −7.4 ± 3.8 | |||||
| Avg Power, w | TS | 338.2 ± 148.5 | 296.8 ± 142.7 ** | −14.4 ± 11.2 | −0.12, 0.12 | −0.027 | 0.979 | 0.012 |
| RR | 347.5 ± 133.4 | 313.4 ± 132.6 ** | −11.5 ± 9.1 | |||||
| Peak Power, w | TS | 1489.0 ± 215.9 | 1368.0 ± 201.1 ** | −8.4 ± 5.1 | −0.02, 0.02 | −0.927 | 0.366 | 0.415 |
| RR | 1516.0 ± 182.6 | 1416.4 ± 173.5 ** | −6.5 ± 3.6 | |||||
| Parameter | Cohen’s d | Current Power | Recommended n |
|---|---|---|---|
| SJH, cm | 0.375 | 22.7% | 56 |
| SJAP, w | 0.063 | 6.1% | 253 |
| SJPP, w | 0.245 | 15.2% | 82 |
| CMJH, cm | 0.370 | 22.3% | 57 |
| CMJAP, w | 0.124 | 7.8% | 179 |
| CMJPP, w | 0.253 | 15.8% | 78 |
| Protocol | Post-Test/Pre-Test | TS-RR (Between-Group Comparison) | ||||||
|---|---|---|---|---|---|---|---|---|
| Pre-Test | Post-Test | Variation Difference | 95%CI | T-Value | p-Value | Cohen’s d | ||
| Mean ± SD | Mean ± SD | Mean ± SD | ||||||
| Time domain | ||||||||
| SDNN, ms | TS | 35.2 ± 8.1 | 28.5 ± 10.0 * | −6.7 ± 10.5 | 1.07,16.13 | 2.348 | 0.027 ## | 0.888 |
| RR | 31.7 ± 7.1 | 32.6 ± 5.7 | −0.8 ± 7.2 | |||||
| RMSSD, ms | TS | 26.7 ± 10.0 | 18.8 ± 8.2 ** | −7.9 ± 11.5 | 8.87,27.63 | 3.999 | 0.000 ### | 1.511 |
| RR | 21.3 ± 8.8 | 20.5 ± 4.4 | 0.8 ± 9.1 | |||||
| PNN50, % | TS | 6.6 ± 8.5 | 2.6 ± 2.7 | 4.24 ± 8.19 | −3.07,8.16 | 0.932 | 0.360 | 0.352 |
| RR | 4.3 ± 5.6 | 2.5 ± 2.2 | 1.8 ± 5.4 | |||||
| Frequency domain | ||||||||
| LF, log | TS | 550.5 ± 359.1 | 554.6 ± 489.5 | 4.1 ± 545.4 | −25.25,783.77 | 1.927 | 0.065 | 0.728 |
| RR | 461.3 ± 323.8 | 800.5 ± 562.6 * | −339.2 ± 511.5 | |||||
| HF, log | TS | 216.4 ± 235.7 | 108.7 ± 94.3 * | 107.6 ± 141.4 | 2.73,379.71 | 2.085 | 0.047 # | 0.788 |
| RR | 141.2 ± 113.5 | 152.1 ± 94.7 | −10.9 ± 118.0 | |||||
| LF/HF | TS | 4.5 ± 4.3 | 6.3 ± 3.7 | −1.8 ± 5.1 | −3.99,2.58 | −0.44 | 0.664 | 0.166 |
| RR | 4.8 ± 3.3 | 6.0 ± 3.9 | −1.2 ± 3.1 | |||||
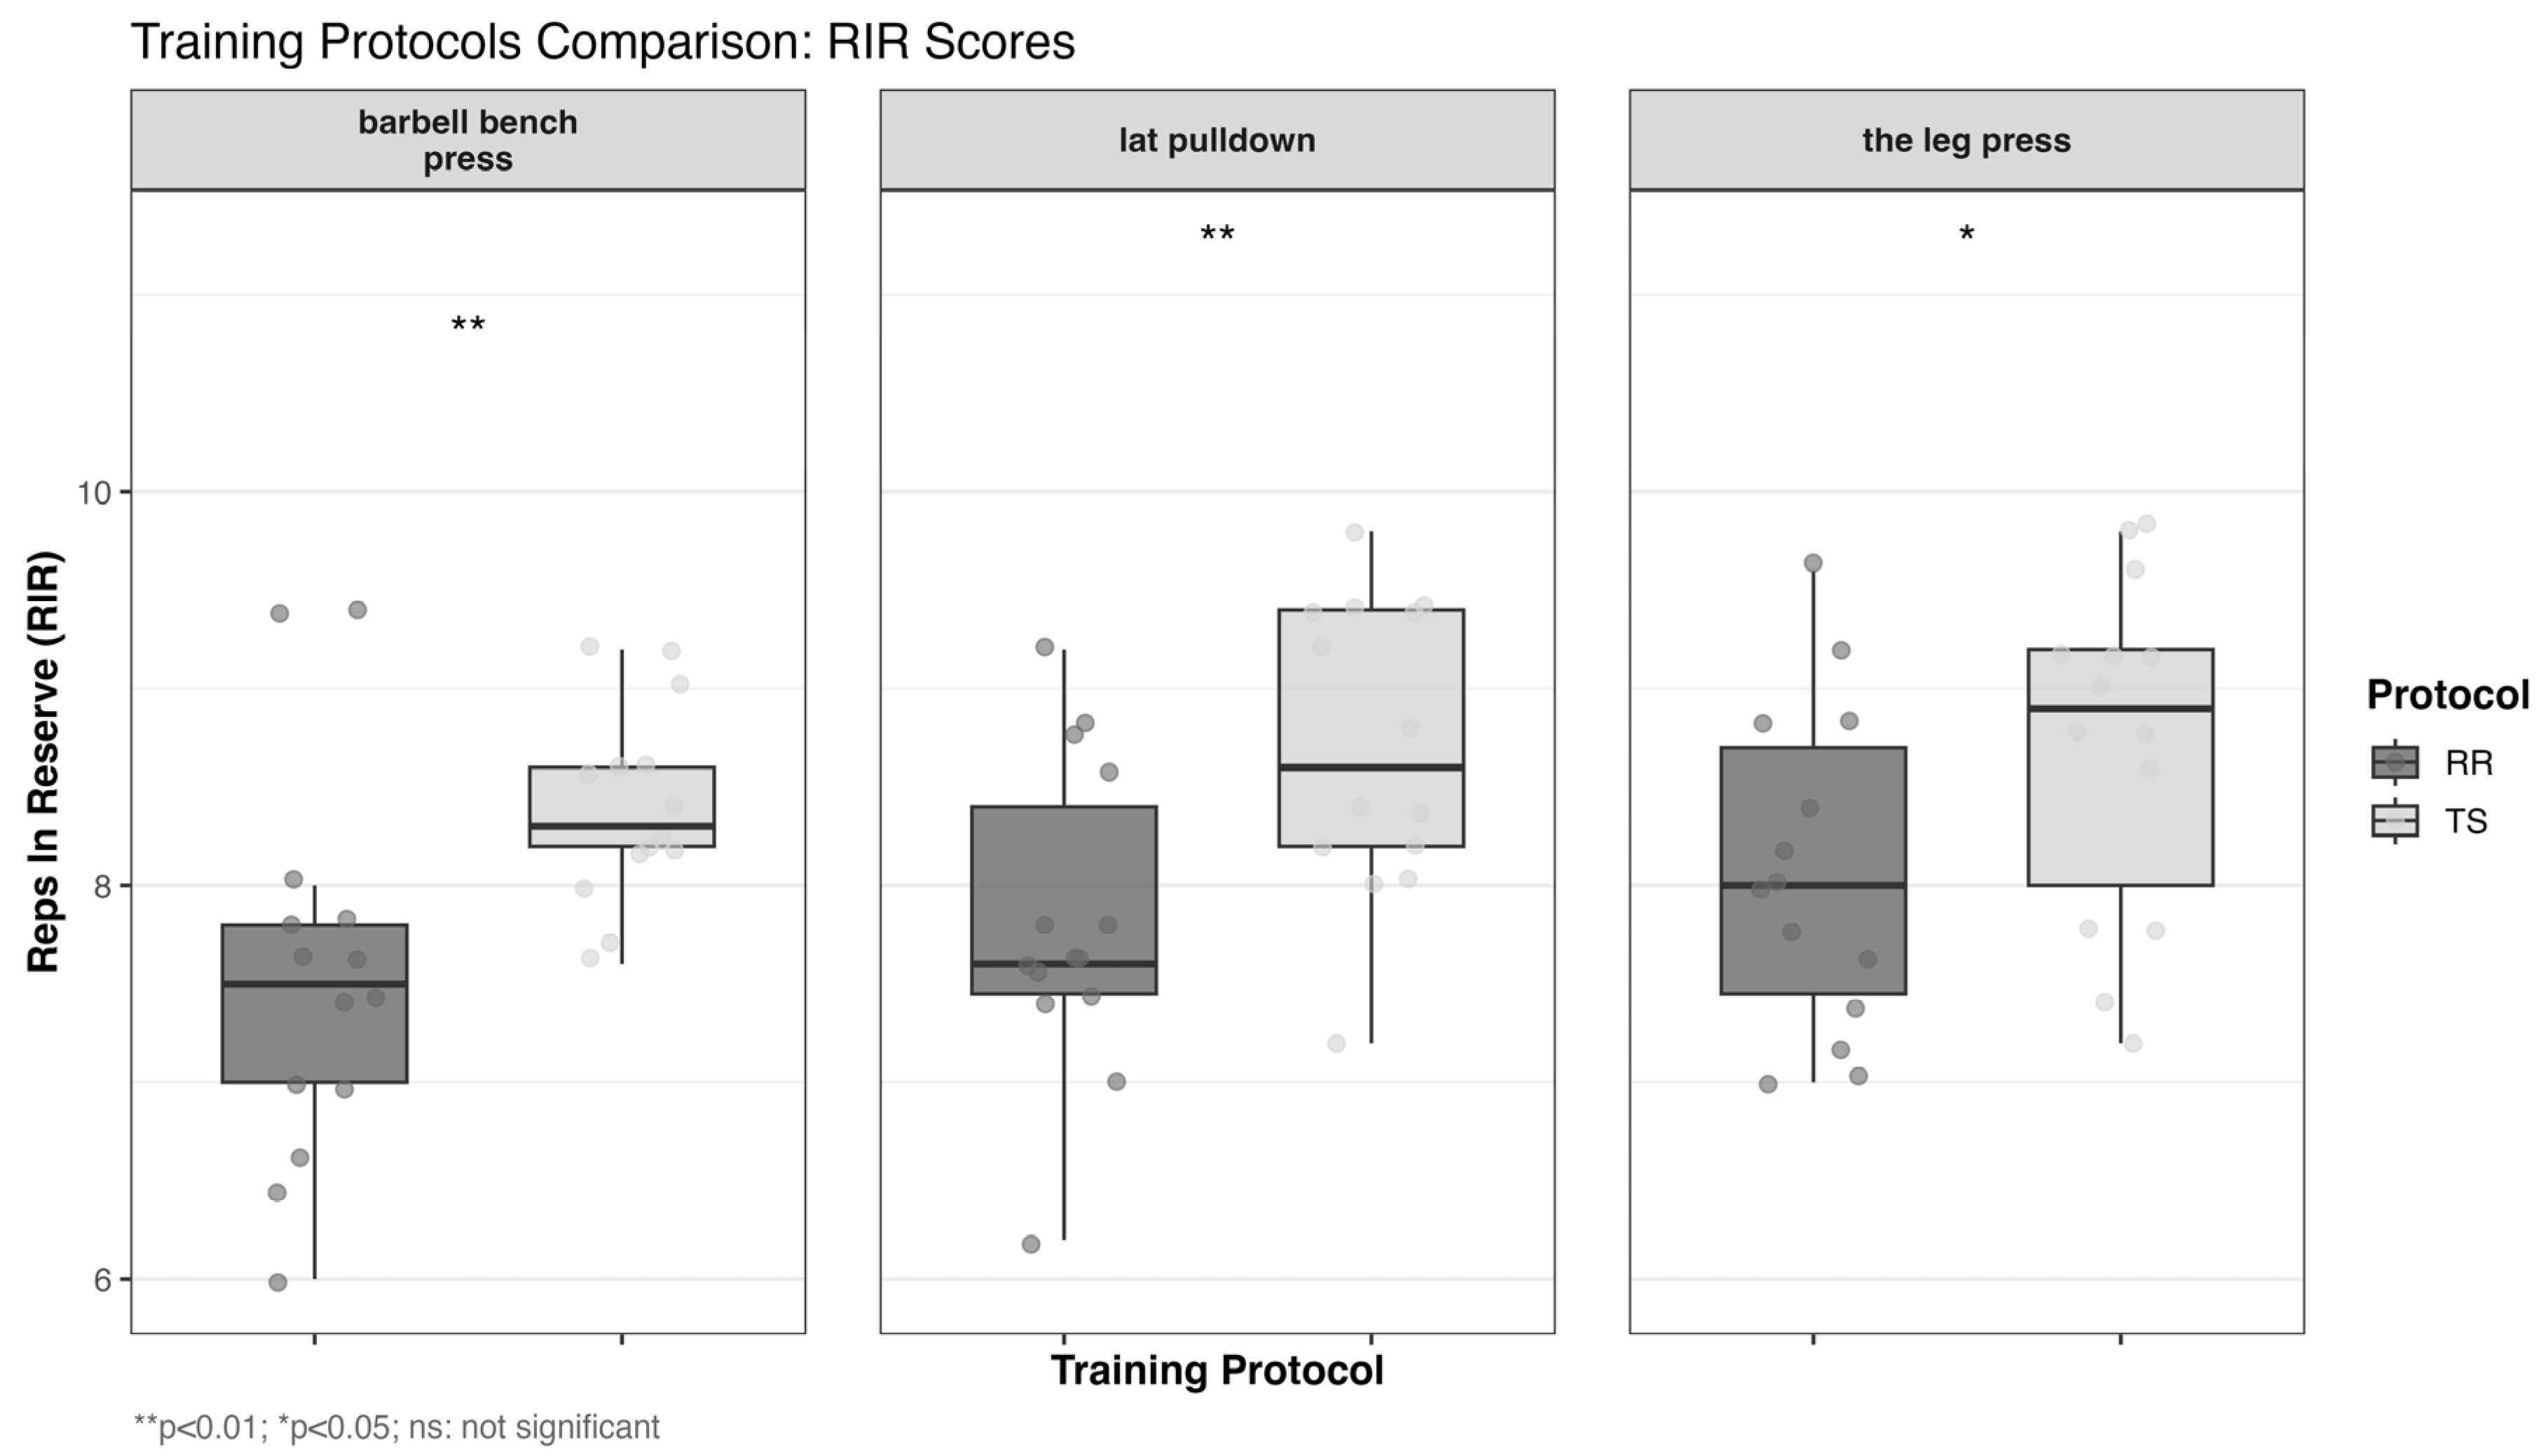
| Exercise | Protocol | Mean ± SD | 95%CI | T-Value | p-Value | Cohen’s d |
|---|---|---|---|---|---|---|
| barbell bench press | TS | 8.4 ± 0.5 | 0.28,1.48 | 2.995 | 0.006 ** | 1.132 |
| RR | 7.5 ± 1.0 | |||||
| lat pulldown | TS | 8.7 ± 0.8 | 0.28,1.49 | 3.024 | 0.006 ** | 1.143 |
| RR | 7.8 ± 0.8 | |||||
| the leg press | TS | 8.7 ± 0.9 | 0.01,1.31 | 2.075 | 0.048 * | 0.784 |
| RR | 8.1 ± 0.8 |
Disclaimer/Publisher’s Note: The statements, opinions and data contained in all publications are solely those of the individual author(s) and contributor(s) and not of MDPI and/or the editor(s). MDPI and/or the editor(s) disclaim responsibility for any injury to people or property resulting from any ideas, methods, instructions or products referred to in the content. |
© 2025 by the authors. Licensee MDPI, Basel, Switzerland. This article is an open access article distributed under the terms and conditions of the Creative Commons Attribution (CC BY) license (https://creativecommons.org/licenses/by/4.0/).
Share and Cite
Cheng, W.; Li, R.; Yan, R.; Liu, R.; Gao, Z. Acute Effects of Rest Redistribution Training on Physical and Physiological Responses in Anxious Female College Students. Life 2025, 15, 555. https://doi.org/10.3390/life15040555
Cheng W, Li R, Yan R, Liu R, Gao Z. Acute Effects of Rest Redistribution Training on Physical and Physiological Responses in Anxious Female College Students. Life. 2025; 15(4):555. https://doi.org/10.3390/life15040555
Chicago/Turabian StyleCheng, Weihao, Ran Li, Runsheng Yan, Ruoya Liu, and Zeyu Gao. 2025. "Acute Effects of Rest Redistribution Training on Physical and Physiological Responses in Anxious Female College Students" Life 15, no. 4: 555. https://doi.org/10.3390/life15040555
APA StyleCheng, W., Li, R., Yan, R., Liu, R., & Gao, Z. (2025). Acute Effects of Rest Redistribution Training on Physical and Physiological Responses in Anxious Female College Students. Life, 15(4), 555. https://doi.org/10.3390/life15040555