Beyond HOMA-IR: Comparative Evaluation of Insulin Resistance and Anthropometric Indices Across Prediabetes and Type 2 Diabetes Mellitus in Metabolic Syndrome Patients

 ,
,  , ,
, ,  , ,
, , 
Abstract
1. Introduction
2. Materials and Methods
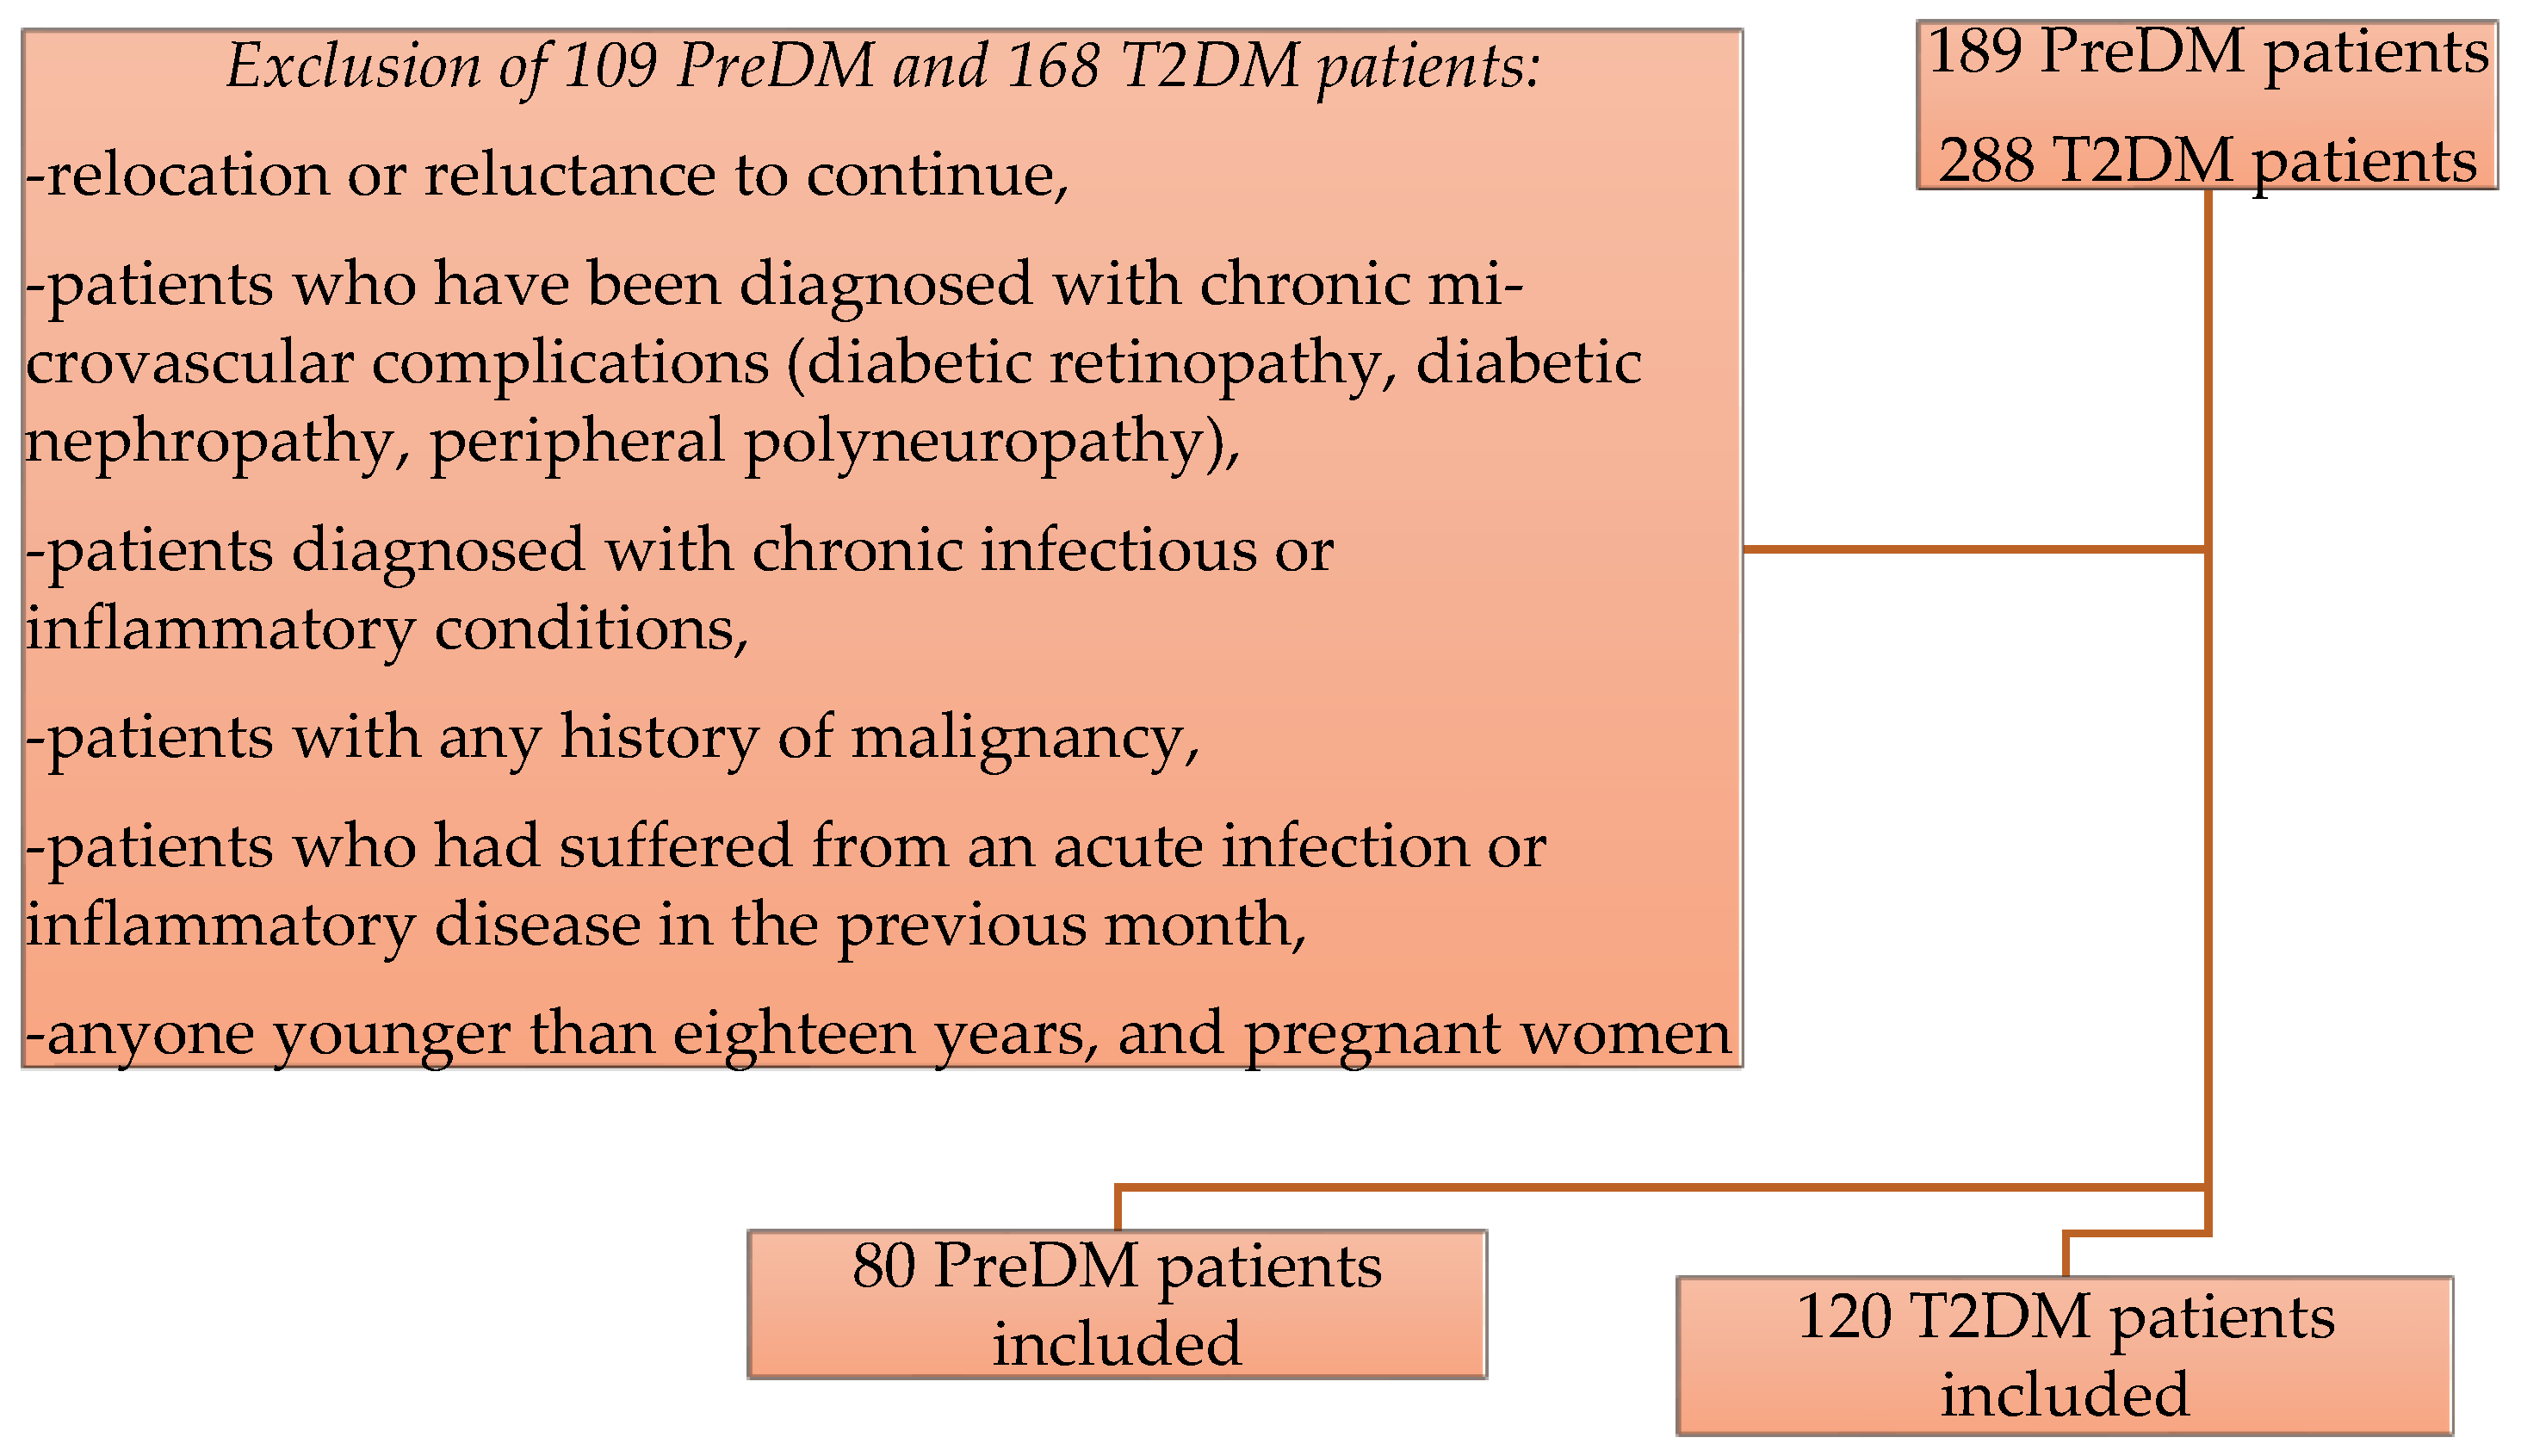
2.1. Study Design and Population
2.2. Diagnostic Framework for Study Populations: PreDM, T2DM, MetS
2.3. Assessment of Anthropometric and Adiposity Indices
- Body Mass Index: BMI = Weight/(Height)2;
- Body Roundness Index: BRI = 364.2–365.5 × (1 − [WC/2π]2/[0.5 × height2)½;
- A Body Shape Index (ABSI): ABSI = WC/[BMI2/3 × Height1/2];
- A Body Shape Index z Score was determined with omniCalculator;
- Weight-Adjusted Waist Index: WWI = WC (cm)/√ Weight (kg);
- Abdominal Volume Index: AVI = [2 × WC2 + 0.7 × (WC − HC)2]/1000;
- Conicity Index: CI = WC (m)/[0.109 × √(Weight (kg)/Height (m))].
2.4. Assessment of Lipemic Spectrum Indices
- Castelli Risk Index I: CRI I = TC/HDL-c;
- Castelli Risk Index II: CRI II = LDL-c/HDL-c;
- TyG Index: TyG = Ln [TG (mg/dL) × FPG (mg/dL)/2];
- TyG to HDL-c ratio = TyG/HDL-c;
- Lipoprotein Combine Index: LCI = TC × TG × LDL-c/HDL-c;
- Lipid adipose product: LAP = (WC − 65) × TG for men; LAP = (WC − 58) × TG for women;
- Triglyceride-total cholesterol-body weight index: TCBI = Triglyceride (mg/dL) × Total Cholesterol (mg/dL) × Body Weight (kg)/1000.
2.5. Assessment of Insulin Resistance
- Homeostatic Model Assessment of Insulin Resistance: HOMA-IR = (Fasting Insulin [μUI/mL] × FPG [mg/dL])/405;
- β-cell Function Index: HOMA%B = (360 × Fasting Insulin (μUI/mL))/(FPG (mg/dL) − 63);
- Metabolic Score for Insulin Resistance: METS-IR = (ln((2 × FPG (mg/dL)) + TG (mg/dL)) × BMI (kg/m2))/(ln(HDL-c (mg/dL))).
2.6. Laboratory-Based Assays
2.7. Statistical Analysis
3. Results
3.1. Clinical and Biochemical Characteristics of Prediabetic and Diabetic Subjects
3.2. Comparison of Insulin Resistance and Anthropometric Indices Across HOMA-IR and METS-IR Categories in Prediabetic and Diabetic Groups
3.2.1. Prediabetic Group
3.2.2. Type 2 Diabetes Group
3.3. Comparison of Insulin Resistance and Cardiometabolic Indices by Hypertension Grade in Prediabetic and Diabetic Individuals
3.4. Correlations Among PreDM and T2DM Cohorts
3.4.1. Correlations of Prediabetic and Diabetic Individuals
- PreDM cohort:
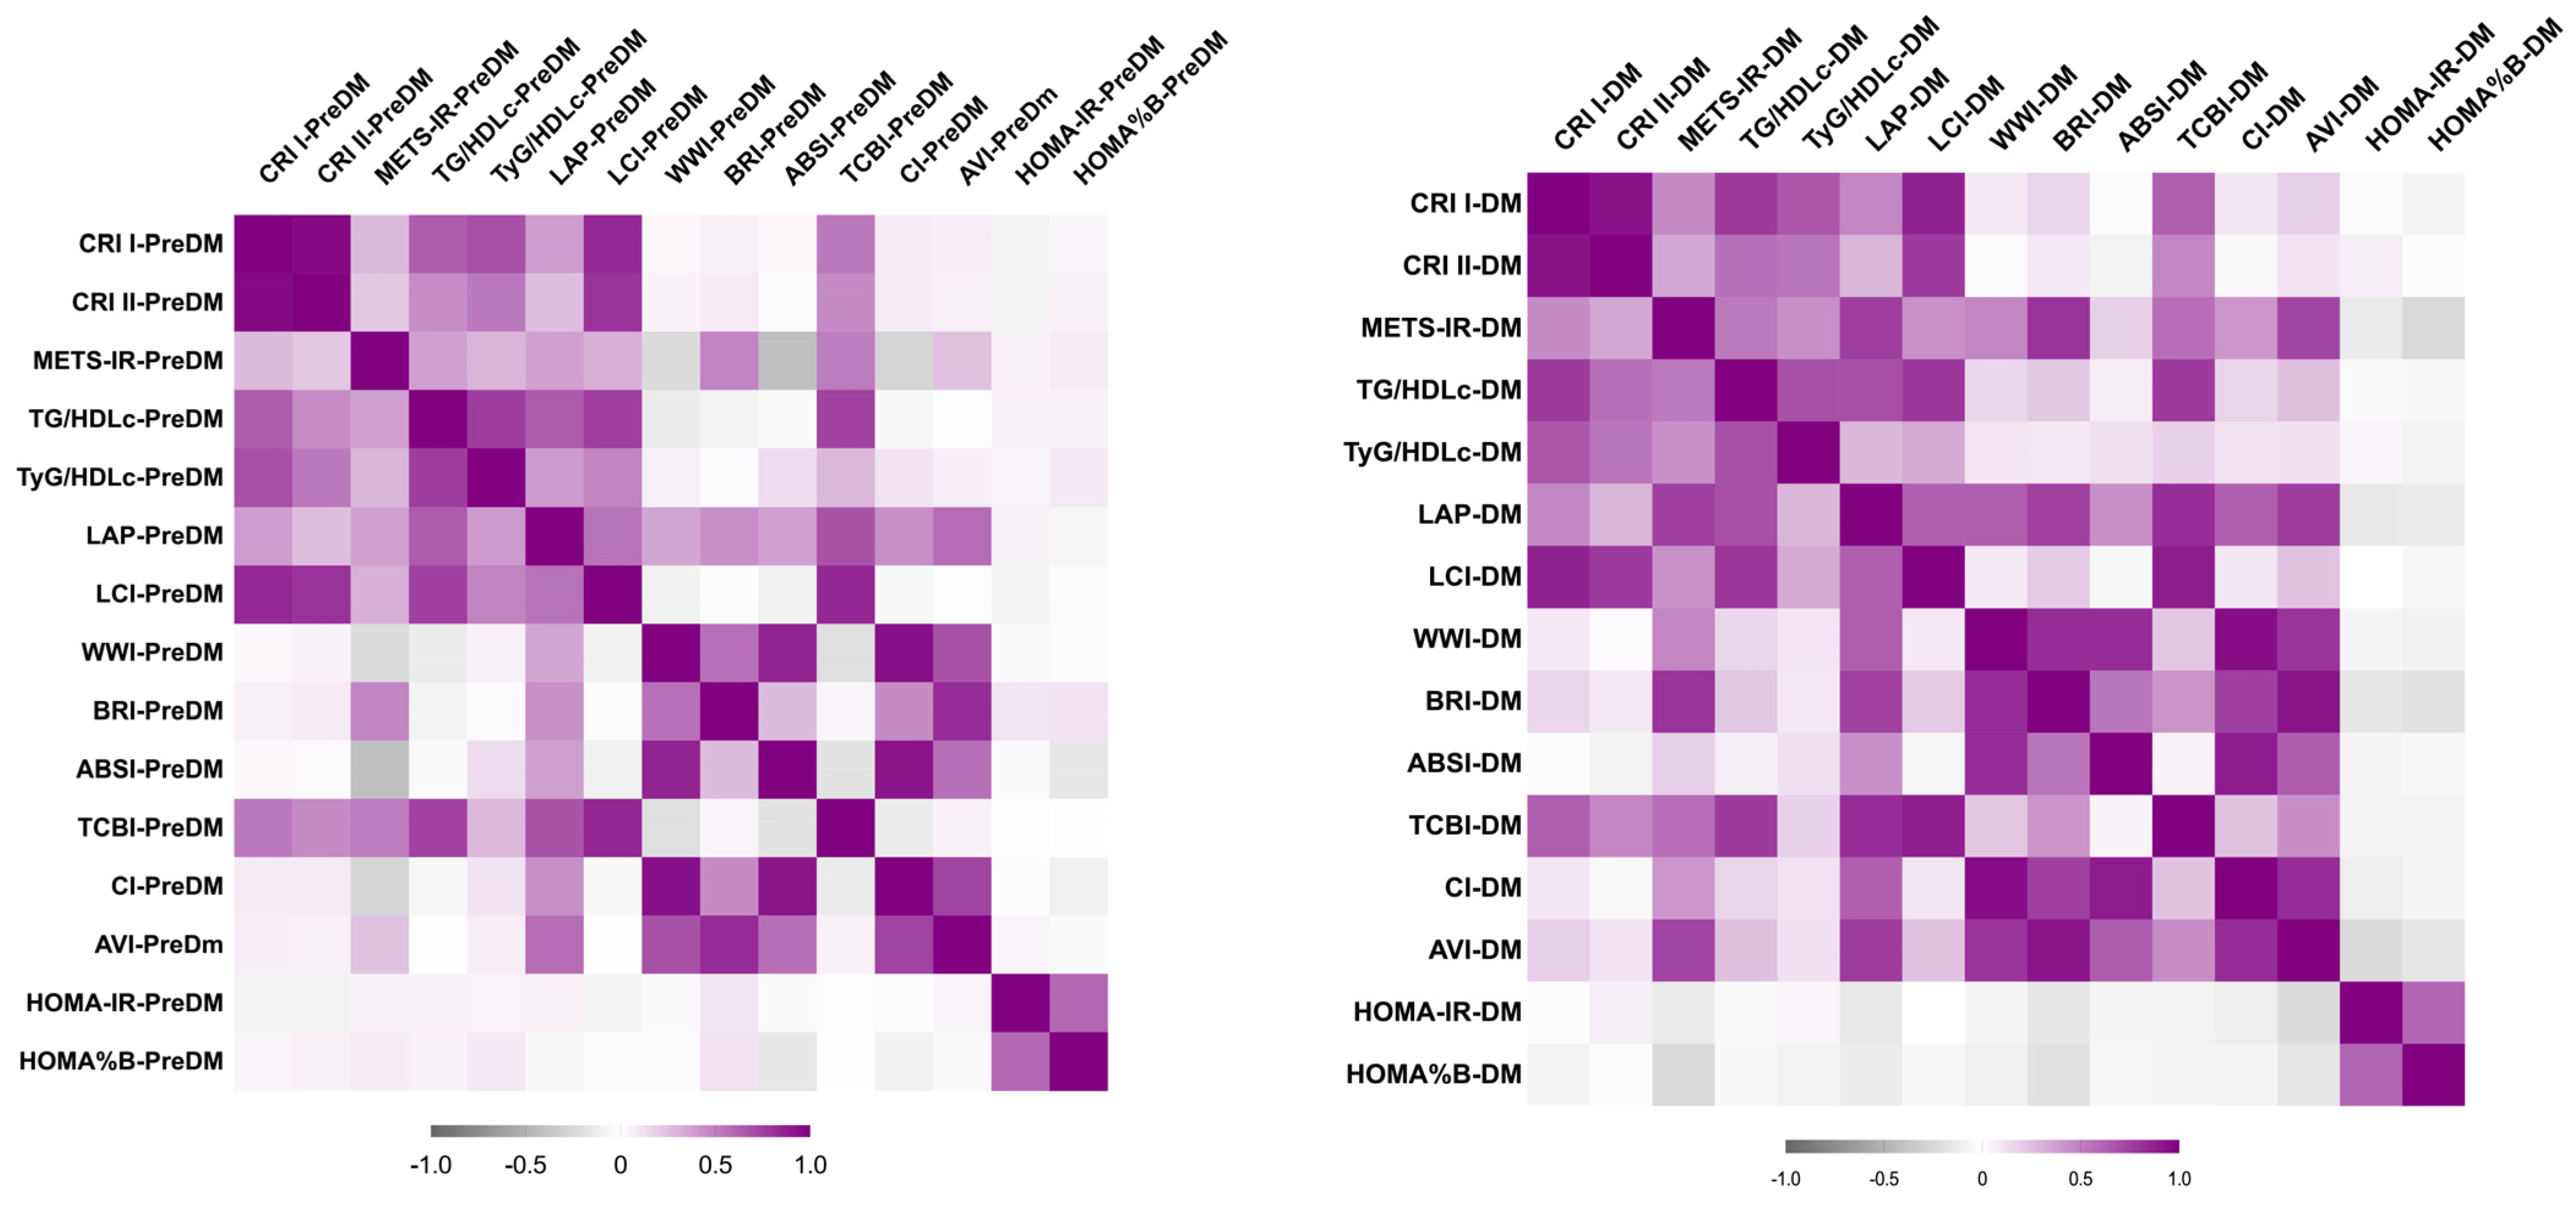
- METS-IR correlated positively and moderately with BRI (r = 0.480), and TCBI (r = 0.510);
- WWI correlated positively and strongly with ABSI (r = 0.860) and CI (r = 0.940);
- LAP correlated positively and moderately with AVI (r = 0.580);
- T2DM cohort:
- METS-IR correlated positively and strongly with BRI (r = 0.800) and AVI (r = 0.730);
- WWI correlated positively and strongly with BRI (r = 0.830), ABSI (r = 0.820) and CI (r = 0.950);
- LAP correlated positively and strongly with AVI (r = 0.764).
3.4.2. Correlation of PreDM and HTN Grade 2 Cohort; Correlation of PreDM and HTN Grade 3 Cohort
PreDM and HTN Grade 2 Cohort
DM and HTN Grade 2 Cohort
3.4.3. Correlation of PreDM and HTN Grade 3 Cohort; Correlation of T2DM and HTN Grade 3 Cohort
PreDM and HTN Grade 3 Cohort
DM and HTN Grade 3 Cohort
3.5. Multiple Linear Regression (MLR)
3.5.1. MLR of PreDM Group
3.5.2. MLR of T2DM Group
4. Discussion
Limitations
5. Conclusions
Author Contributions
Funding
Institutional Review Board Statement
Informed Consent Statement
Data Availability Statement
Acknowledgments
Conflicts of Interest
References
- Quirino-Vela, L.; Mayoral-Chavez, M.; Pérez-Cervera, Y.; Ildefonso-García, O.; Cruz-Altamirano, E.; Ruiz-García, M.; Alpuche, J. Cardiometabolic risk assessment by anthropometric and biochemical indices in mexican population. Front. Endocrinol. 2025, 16, 1588469. [Google Scholar] [CrossRef] [Scilit] [PubMed]
- Rahimi, A.; Rafati, S.; Azarbad, A.; Safa, H.; Shahmoradi, M.; Asl, A.S.; Niazi, M.; Ahi, S.; Tabasi, S.; Kheirandish, M. The predictive power of conventional and novel obesity indices in identifying metabolic syndrome among the southern Iranian populations: Findings from PERSIAN cohort study. J. Health Popul. Nutr. 2024, 43, 198. [Google Scholar] [CrossRef] [Scilit] [PubMed]
- Yoon, J.; Jung, D.; Lee, Y.; Park, B. The Metabolic Score for Insulin Resistance (METS-IR) as a Predictor of Incident Ischemic Heart Disease: A Longitudinal Study Among Korean Without Diabetes. J. Pers. Med. 2021, 11, 742. [Google Scholar] [CrossRef] [Scilit]
- Bai, W.; Chen, H.; Wan, H.; Ye, X.; Ling, Y.; Xu, J.; Guo, X.; He, J. Association between the triglyceride glucose-body roundness index and the incidence of cardiovascular disease among Chinese middle and old-aged adults: A nationwide prospective cohort study. Acta Diabetol. 2025, 62, 1647–1657. [Google Scholar] [CrossRef] [Scilit] [PubMed]
- Chu, X.; Niu, H.; Wang, N.; Wang, Y.; Xu, H.; Wang, H.; Wu, L.; Li, W.; Han, L. Triglyceride–Glucose-Based Anthropometric Indices for Predicting Incident Cardiovascular Disease: Relative Fat Mass (RFM) as a Robust Indicator. Nutrients 2025, 17, 2212. [Google Scholar] [CrossRef] [Scilit]
- Zhou, Y.; Xie, Y.; Du, L.; Dong, J.; He, K. Metabolic score for insulin resistance as a predictor of mortality in heart failure with preserved ejection fraction: Results from a multicenter cohort study. Diabetol. Metab. Syndr. 2024, 16, 220. [Google Scholar] [CrossRef] [Scilit]
- Bansal, N. Prediabetes diagnosis and treatment: A review. World J. Diabetes 2015, 6, 296–303. [Google Scholar] [CrossRef] [Scilit]
- Committee, A.D.A.P.P. 2. Diagnosis and Classification of Diabetes: Standards of Care in Diabetes—2024. Diabetes Care 2023, 47, S20–S42. [Google Scholar] [CrossRef] [Scilit]
- International Diabetes Federation Diabetes Atlas 10th Edition. 2021. Available online: https://diabetesatlas.org/resources/idf-diabetes-atlas-2025/ (accessed on 1 July 2025).
- Assani, M.-Z.; Novac, M.B.; Dijmărescu, A.L.; Văduva, C.-C.; Vladu, I.M.; Clenciu, D.; Mitrea, A.; Ahrițculesei, R.-V.; Stroe-Ionescu, A.-Ș.; Assani, A.-D.; et al. Potential Association Between Atherogenic Coefficient, Prognostic Nutritional Index, and Various Obesity Indices in Diabetic Nephropathy. Nutrients 2025, 17, 1339. [Google Scholar] [CrossRef] [Scilit]
- Ahrițculesei, R.-V.; Boldeanu, L.; Caragea, D.C.; Vladu, I.M.; Clenciu, D.; Mitrea, A.; Ungureanu, A.M.; Văduva, C.-C.; Dijmărescu, A.L.; Popescu, A.I.S.; et al. Association Between Pentraxins and Obesity in Prediabetes and Newly Diagnosed Type 2 Diabetes Mellitus Patients. Int. J. Mol. Sci. 2025, 26, 3661. [Google Scholar] [CrossRef] [Scilit]
- Liu, C.; Liang, D.; Xiang, G.; Zhao, X.; Xiao, K.; Xie, L. Association of the triglyceride glucose index with all cause and CVD mortality in the adults with diabetes aged < 65 years without cardiovascular disease. Sci. Rep. 2025, 15, 2745. [Google Scholar] [CrossRef] [Scilit]
- Roth, G.A.; Mensah, G.A.; Johnson, C.O.; Addolorato, G.; Ammirati, E.; Baddour, L.M.; Barengo, N.C.; Beaton, A.Z.; Benjamin, E.J.; Benziger, C.P.; et al. Global Burden of Cardiovascular Diseases and Risk Factors, 1990–2019: Update From the GBD 2019 Study. J. Am. Coll. Cardiol. 2020, 76, 2982–3021. [Google Scholar] [CrossRef] [Scilit]
- Ştefan, A.G.; Clenciu, D.; Mitrea, A.; Vladu, I.M.; Protasiewicz-Timofticiuc, D.C.; Roşu, M.M.; Maria, D.T.; Dinu, I.R.; Gheonea, T.C.; Vladu, B.E.; et al. Metabolic Syndrome and Insulin Resistance in Romania. Int. J. Mol. Sci. 2025, 26, 2389. [Google Scholar] [CrossRef] [Scilit]
- Jamali, Z.; Ayoobi, F.; Jalali, Z.; Bidaki, R.; Lotfi, M.A.; Esmaeili-Nadimi, A.; Khalili, P. Metabolic syndrome: A population-based study of prevalence and risk factors. Sci. Rep. 2024, 14, 3987. [Google Scholar] [CrossRef] [Scilit]
- Badawy, M.; Elsayes, K.M.; Lubner, M.G.; Shehata, M.A.; Fowler, K.; Kaoud, A.; Pickhardt, P.J. Metabolic syndrome: Imaging features and clinical outcomes. Br. J. Radiol. 2024, 97, 292–305. [Google Scholar] [CrossRef] [Scilit] [PubMed]
- Saklayen, M.G. The Global Epidemic of the Metabolic Syndrome. Curr. Hypertens. Rep. 2018, 20, 12. [Google Scholar] [CrossRef] [Scilit] [PubMed]
- Wilson, P.W.F.; D’Agostino, R.B.; Parise, H.; Sullivan, L.; Meigs, J.B. Metabolic Syndrome as a Precursor of Cardiovascular Disease and Type 2 Diabetes Mellitus. Circulation 2005, 112, 3066–3072. [Google Scholar] [CrossRef] [Scilit] [PubMed]
- Vesa, C.M.; Zaha, D.C.; Bungău, S.G. Molecular Mechanisms of Metabolic Syndrome. Int. J. Mol. Sci. 2024, 25, 5452. [Google Scholar] [CrossRef] [Scilit]
- Tirandi, A.; Carbone, F.; Montecucco, F.; Liberale, L. The role of metabolic syndrome in sudden cardiac death risk: Recent evidence and future directions. Eur. J. Clin. Investig. 2022, 52, e13693. [Google Scholar] [CrossRef] [Scilit]
- Mitroi Sakizlian, D.D.; Boldeanu, L.; Mitrea, A.; Clenciu, D.; Vladu, I.M.; Ciobanu Plasiciuc, A.E.; Șarla, A.V.; Siloși, I.; Boldeanu, M.V.; Assani, M.-Z.; et al. The Interplay of Cardiometabolic Syndrome Phenotypes and Cardiovascular Risk Indices in Patients Diagnosed with Diabetes Mellitus. Int. J. Mol. Sci. 2025, 26, 6227. [Google Scholar] [CrossRef] [Scilit]
- Ma, X.; Ji, B.; Du, W.; Shi, S.; Zhao, H.; Sheng, J.; Jiang, X.; Ban, B.; Gao, G. METS-IR, a Novel Simple Insulin Resistance Index, is Associated with NAFLD in Patients with Type 2 Diabetes Mellitus. Diabetes Metab. Syndr. Obes. 2024, 17, 3481–3490. [Google Scholar] [CrossRef] [Scilit] [PubMed]
- Bello-Chavolla, O.Y.; Almeda-Valdes, P.; Gomez-Velasco, D.; Viveros-Ruiz, T.; Cruz-Bautista, I.; Romo-Romo, A.; Sánchez-Lázaro, D.; Meza-Oviedo, D.; Vargas-Vázquez, A.; Campos, O.A.; et al. METS-IR, a novel score to evaluate insulin sensitivity, is predictive of visceral adiposity and incident type 2 diabetes. Eur. J. Endocrinol. 2018, 178, 533–544. [Google Scholar] [CrossRef] [Scilit] [PubMed]
- Park, M.J.; Hwang, S.Y.; Kim, N.H.; Kim, S.G.; Choi, K.M.; Baik, S.H.; Yoo, H.J. A Novel Anthropometric Parameter, Weight-Adjusted Waist Index Represents Sarcopenic Obesity in Newly Diagnosed Type 2 Diabetes Mellitus. JOMES 2023, 32, 130–140. [Google Scholar] [CrossRef] [Scilit] [PubMed]
- Feng, J.; He, S.; Chen, X. Body Adiposity Index and Body Roundness Index in Identifying Insulin Resistance Among Adults Without Diabetes. Am. J. Med. Sci. 2019, 357, 116–123. [Google Scholar] [CrossRef] [Scilit]
- de Luis, D.; Muñoz, M.; Izaola, O.; Lopez Gomez, J.J.; Rico, D.; Primo, D. Body Roundness Index (BRI) Predicts Metabolic Syndrome in Postmenopausal Women with Obesity Better than Insulin Resistance. Diabetology 2025, 6, 60. [Google Scholar] [CrossRef] [Scilit]
- Yang, Q.; Liu, Y.; Jin, Z.; Liu, L.; Yuan, Z.; Xu, D.; Hong, F. Evaluation of anthropometric indices as a predictor of diabetes in Dong and Miao ethnicities in China: A cross-sectional analysis of China Multi-Ethnic Cohort Study. PLoS ONE 2022, 17, e0265228. [Google Scholar] [CrossRef] [Scilit]
- He, S.; Kuang, Y.; Huang, X.; Jian, Y.; Zhang, J.; Huang, W.; Zou, Y.; Sheng, G.; Wang, W.; Yang, H. Impact of triglyceride glucose-weight adjusted waist index and its cumulative exposure on stroke risk: A nationwide prospective cohort study. Lipids Health Dis. 2025, 24, 243. [Google Scholar] [CrossRef] [Scilit]
- Kim, J.Y.; Choi, J.; Vella, C.A.; Criqui, M.H.; Allison, M.A.; Kim, N.H. Associations Between Weight-Adjusted Waist Index and Abdominal Fat and Muscle Mass: Multi-Ethnic Study of Atherosclerosis. Diabetes Metab. J. 2022, 46, 747–755. [Google Scholar] [CrossRef] [Scilit]
- Li, X.; Zhao, D.; Wang, H. Association between weight-adjusted waist index and risk of diabetes mellitus type 2 in United States adults and the predictive value of obesity indicators. BMC Public Health 2024, 24, 2025. [Google Scholar] [CrossRef] [Scilit]
- Zhao, P.; Du, T.; Zhou, Q.; Wang, Y. Association of weight-adjusted-waist index with all-cause and cardiovascular mortality in individuals with diabetes or prediabetes: A cohort study from NHANES 2005–2018. Sci. Rep. 2024, 14, 24061. [Google Scholar] [CrossRef] [Scilit]
- Risérus, U.; de Faire, U.; Berglund, L.; Hellénius, M.L. Sagittal abdominal diameter as a screening tool in clinical research: Cutoffs for cardiometabolic risk. J. Obes. 2010, 2010, 757939. [Google Scholar] [CrossRef] [Scilit]
- Adegoke, O.; Ozoh, O.B.; Odeniyi, I.A.; Bello, B.T.; Akinkugbe, A.O.; Ojo, O.O.; Agabi, O.P.; Okubadejo, N.U. Prevalence of obesity and an interrogation of the correlation between anthropometric indices and blood pressures in urban Lagos, Nigeria. Sci. Rep. 2021, 11, 3522. [Google Scholar] [CrossRef] [Scilit]
- DeFronzo, R.A. Insulin resistance, lipotoxicity, type 2 diabetes and atherosclerosis: The missing links. The Claude Bernard Lecture 2009. Diabetologia 2010, 53, 1270–1287. [Google Scholar] [CrossRef] [Scilit] [PubMed]
- Duan, M.; Zhao, X.; Li, S.; Miao, G.; Bai, L.; Zhang, Q.; Yang, W.; Zhao, X. Metabolic score for insulin resistance (METS-IR) predicts all-cause and cardiovascular mortality in the general population: Evidence from NHANES 2001–2018. Cardiovasc. Diabetol. 2024, 23, 243. [Google Scholar] [CrossRef] [Scilit] [PubMed]
- Bazyar, H.; Zare Javid, A.; Masoudi, M.R.; Haidari, F.; Heidari, Z.; Hajializadeh, S.; Aghamohammadi, V.; Vajdi, M. Assessing the predictive value of insulin resistance indices for metabolic syndrome risk in type 2 diabetes mellitus patients. Sci. Rep. 2024, 14, 8917. [Google Scholar] [CrossRef] [Scilit] [PubMed]
- Hocking, S.; Samocha-Bonet, D.; Milner, K.-L.; Greenfield, J.R.; Chisholm, D.J. Adiposity and Insulin Resistance in Humans: The Role of the Different Tissue and Cellular Lipid Depots. Endocr. Rev. 2013, 34, 463–500. [Google Scholar] [CrossRef] [Scilit]
- Cheng, H.; Jia, Z.; Li, Y.T.; Yu, X.; Wang, J.J.; Xie, Y.J.; Hernandez, J.; Wang, H.H.X. Metabolic Score for Insulin Resistance and New-Onset Type 2 Diabetes in a Middle-Aged and Older Adult Population: Nationwide Prospective Cohort Study and Implications for Primary Care. JMIR Public Health Surveill. 2024, 10, e49617. [Google Scholar] [CrossRef] [Scilit]
- Assani, M.-Z.; Novac, M.B.; Dijmărescu, A.L.; Stroe-Ionescu, A.-Ș.; Boldeanu, M.V.; Siloși, I.; Boldeanu, L. Intersecting Pathways of Inflammation, Oxidative Stress, and Atherogenesis in the Evaluation of CKD: Emerging Biomarkers PCSK9, EPHX2, AOPPs, and TBARSs. Life 2025, 15, 1287. [Google Scholar] [CrossRef] [Scilit]
- Alberti, K.G.M.M.; Eckel, R.H.; Grundy, S.M.; Zimmet, P.Z.; Cleeman, J.I.; Donato, K.A.; Fruchart, J.-C.; James, W.P.T.; Loria, C.M.; Smith, S.C. Harmonizing the Metabolic Syndrome. Circulation 2009, 120, 1640–1645. [Google Scholar] [CrossRef] [Scilit]
- Weir, C.B.; Jan, A. BMI Classification Percentile and Cut Off Points. In StatPearls; StatPearls Publishing: Treasure Island, FL, USA, 2025. [Google Scholar]
- Liu, B.; Liu, B.; Wu, G.; Yin, F. Relationship between body-roundness index and metabolic syndrome in type 2 diabetes. Diabetes Metab. Syndr. Obes. 2019, 12, 931–935. [Google Scholar] [CrossRef] [Scilit]
- Kajikawa, M.; Maruhashi, T.; Kishimoto, S.; Yamaji, T.; Harada, T.; Saito, Y.; Mizobuchi, A.; Tanigawa, S.; Nakano, Y.; Chayama, K.; et al. A Body Shape Index as a Simple Anthropometric Marker of Abdominal Obesity and Risk of Cardiovascular Events. J. Clin. Endocrinol. Metab. 2024, 109, 3272–3281. [Google Scholar] [CrossRef] [Scilit]
- Moon, S.; Kim, Y.J.; Yu, J.M.; Kang, J.G.; Chung, H.S. Z-score of the log-transformed A Body Shape Index predicts low muscle mass in population with abdominal obesity: The U.S. and Korea National Health and Nutrition Examination Survey. PLoS ONE 2020, 15, e0242557. [Google Scholar] [CrossRef] [Scilit]
- Wu, J.; Guo, J. Is weight-adjusted waist index more strongly associated with diabetes than body mass index and waist circumference?: Results from the database large community sample study. PLoS ONE 2024, 19, e0309150. [Google Scholar] [CrossRef] [Scilit] [PubMed]
- Guerrero-Romero, F.; Rodríguez-Morán, M. Abdominal volume index. An anthropometry-based index for estimation of obesity is strongly related to impaired glucose tolerance and type 2 diabetes mellitus. Arch. Med. Res. 2003, 34, 428–432. [Google Scholar] [CrossRef] [Scilit] [PubMed]
- Martins, C.A.; Ferreira, J.R.S.; Cattafesta, M.; Neto, E.; Rocha, J.L.M.; Salaroli, L.B. Cut points of the conicity index as an indicator of abdominal obesity in individuals undergoing hemodialysis: An analysis of latent classes. Nutrition 2023, 106, 111890. [Google Scholar] [CrossRef] [Scilit]
- ABSI Calculator. Available online: https://www.omnicalculator.com/health/a-body-shape-index (accessed on 1 July 2025).
- Raaj, I.; Thalamati, M.; Gowda, M.N.V.; Rao, A. The Role of the Atherogenic Index of Plasma and the Castelli Risk Index I and II in Cardiovascular Disease. Cureus 2024, 16, e74644. [Google Scholar] [CrossRef] [Scilit]
- Araújo, S.P.; Juvanhol, L.L.; Bressan, J.; Hermsdorff, H.H.M. Triglyceride glucose index: A new biomarker in predicting cardiovascular risk. Prev. Med. Rep. 2022, 29, 101941. [Google Scholar] [CrossRef] [Scilit]
- Ebrahimi, M.; Seyedi, S.A.; Nabipoorashrafi, S.A.; Rabizadeh, S.; Sarzaeim, M.; Yadegar, A.; Mohammadi, F.; Bahri, R.A.; Pakravan, P.; Shafiekhani, P.; et al. Lipid accumulation product (LAP) index for the diagnosis of nonalcoholic fatty liver disease (NAFLD): A systematic review and meta-analysis. Lipids Health Dis. 2023, 22, 41. [Google Scholar] [CrossRef] [Scilit]
- Sudo, M.; Shamekhi, J.; Aksoy, A.; Al-Kassou, B.; Tanaka, T.; Silaschi, M.; Weber, M.; Nickenig, G.; Zimmer, S. A simply calculated nutritional index provides clinical implications in patients undergoing transcatheter aortic valve replacement. Clin. Res. Cardiol. 2024, 113, 58–67. [Google Scholar] [CrossRef] [Scilit]
- Qiu, J.; Huang, X.; Kuang, M.; Yang, R.; Li, J.; Sheng, G.; Zou, Y. Lipoprotein Combine Index as a Better Marker for NAFLD Identification Than Traditional Lipid Parameters. Diabetes Metab. Syndr. Obes. 2024, 17, 2583–2595. [Google Scholar] [CrossRef] [Scilit]
- Çelik, E.; Çora, A.R.; Karadem, K.B. The Effect of Untraditional Lipid Parameters in the Development of Coronary Artery Disease: Atherogenic Index of Plasma, Atherogenic Coefficient and Lipoprotein Combined Index. J. Saudi Heart Assoc. 2021, 33, 244–250. [Google Scholar] [CrossRef] [Scilit] [PubMed]
- Sun, T.; Liu, J. Study on the correlation between triglyceride glucose index, triglyceride glucose index to high-density lipoprotein cholesterol ratio, and the risk of diabetes in nonalcoholic fatty liver disease. Front. Endocrinol. 2025, 16, 1594548. [Google Scholar] [CrossRef] [Scilit] [PubMed]
- Tong, Y.; Wang, Y.; Chen, X.; Qin, B.; Liu, Y.; Cui, Y.; Gao, X.; Wang, J.; Wu, T.; Lv, D.; et al. The triglyceride glucose: High-density lipoprotein cholesterol ratio is associated with coronary artery calcification evaluated via non-gated chest CT. Cardiovasc. Diabetol. 2024, 23, 376. [Google Scholar] [CrossRef] [Scilit] [PubMed]
- Metabolic Score for Insulin Resistance (METS-IR). Available online: https://www.mdcalc.com/calc/10181/metabolic-score-insulin-resistance-mets-ir#evidence (accessed on 1 July 2025).
- Homeostatic Model Assessment for Insulin Resistance. Available online: https://www.mdcalc.com/calc/3120/homa-ir-homeostatic-model-assessment-insulin-resistance#evidence (accessed on 1 July 2025).
- Khalili, D.; Khayamzadeh, M.; Kohansal, K.; Ahanchi, N.S.; Hasheminia, M.; Hadaegh, F.; Tohidi, M.; Azizi, F.; Habibi-Moeini, A.S. Are HOMA-IR and HOMA-B good predictors for diabetes and pre-diabetes subtypes? BMC Endocr. Disord. 2023, 23, 39. [Google Scholar] [CrossRef] [Scilit]
- Kuo, T.-C.; Lu, Y.-B.; Yang, C.-L.; Wang, B.; Chen, L.-X.; Su, C.-P. Association of insulin resistance indicators with hepatic steatosis and fibrosis in patients with metabolic syndrome. BMC Gastroenterol. 2024, 24, 26. [Google Scholar] [CrossRef] [Scilit]
- Peng, H.; Xiang, J.; Pan, L.; Zhao, M.; Chen, B.; Huang, S.; Yao, Z.; Liu, J.; Lv, W. METS-IR/HOMA-IR and MAFLD in U.S. adults: Dose–response correlation and the effect mediated by physical activity. BMC Endocr. Disord. 2024, 24, 132. [Google Scholar] [CrossRef] [Scilit]
- Rusu, E.; Jinga, M.; Cursaru, R.; Enache, G.; Costache, A.; Verde, I.; Nica, A.; Alionescu, A.; Rusu, F.; Radulian, G. Adipose Tissue Dysfunction and Hepatic Steatosis in New-Onset Diabetes. Diabetology 2025, 6, 70. [Google Scholar] [CrossRef] [Scilit]
- Liu, X.-H.; Xu, Q.; Zhang, L.; Liu, H.-J. Association between metabolic score for insulin resistance and regression to normoglycemia from prediabetes in Chinese adults: A retrospective cohort study. PLoS ONE 2024, 19, e0308343. [Google Scholar] [CrossRef] [Scilit]
- Wenxuan, H.; Lingyun, X.; Yujie, T.; Ting, Z.; Zhen, H.; Xiao, L.; Zhao, Y. Association Analysis of Insulin Resistance Metabolic Score (METS-IR) and Gestational Diabetes Mellitus: Based on National Health and Nutrition Examination Survey Database From 2007 to 2018. Endocrinol. Diabetes Metab. 2025, 8, e70062. [Google Scholar] [CrossRef] [Scilit]
- Liu, G. Association between the metabolic score for insulin resistance (METS-IR) and arterial stiffness among health check-up population in Japan: A retrospective cross-sectional study. Front. Endocrinol. 2024, 14, 1308719. [Google Scholar] [CrossRef] [Scilit]
- Cheng, H.; Yu, X.; Li, Y.T.; Jia, Z.; Wang, J.J.; Xie, Y.J.; Hernandez, J.; Wang, H.H.X.; Wu, H.F. Association between METS-IR and Prediabetes or Type 2 Diabetes Mellitus among Elderly Subjects in China: A Large-Scale Population-Based Study. Int. J. Environ. Res. Public Health 2023, 20, 1053. [Google Scholar] [CrossRef] [Scilit]
- Wang, B.; Ma, C.; Wu, J.; Huang, Z. Association between novel adiposity parameters and hyperuricemia: A cross-sectional study. Front. Nutr. 2025, 12, 1536893. [Google Scholar] [CrossRef] [Scilit]
- Liu, Y.; Jiang, H.; Luo, L.; Gao, Z. Relationship between four visceral obesity indices and prediabetes and diabetes: A cross-sectional study in Dalian, China. BMC Endocr. Disord. 2024, 24, 191. [Google Scholar] [CrossRef] [Scilit]
- Fahami, M.; Hojati, A.; Farhangi, M.A. Body shape index (ABSI), body roundness index (BRI) and risk factors of metabolic syndrome among overweight and obese adults: A cross-sectional study. BMC Endocr. Disord. 2024, 24, 230. [Google Scholar] [CrossRef] [Scilit] [PubMed]
- D’Elia, L. Is the triglyceride-glucose index ready for cardiovascular risk assessment? Nutr. Metab. Cardiovasc. Dis. 2025, 35, 103834. [Google Scholar] [CrossRef] [Scilit] [PubMed]
- Li, C.; Zhang, Z.; Luo, X.; Xiao, Y.; Tu, T.; Liu, C.; Liu, Q.; Wang, C.; Dai, Y.; Zhang, Z.; et al. The triglyceride–glucose index and its obesity-related derivatives as predictors of all-cause and cardiovascular mortality in hypertensive patients: Insights from NHANES data with machine learning analysis. Cardiovasc. Diabetol. 2025, 24, 47. [Google Scholar] [CrossRef] [Scilit] [PubMed]
- Huang, P.; Zhang, H.; Ren, G.; Wang, Y.; Fu, S.; Liu, Y.; Zhang, Z.; Guo, L.; Ma, X. Association of the triglyceride glucose index with obesity indicators and hypertension in American adults based on NHANES 2013 to 2018. Sci. Rep. 2025, 15, 2443. [Google Scholar] [CrossRef] [Scilit]
- Shi, C.; Cheng, Y.; Ma, L.; Wu, L.; Shi, H.; Liu, Y.; Ma, J.; Tong, H. Using easy-to-collect indices to develop and validate models for identifying metabolic syndrome and pre-metabolic syndrome. Front. Endocrinol. 2025, 16, 1587354. [Google Scholar] [CrossRef] [Scilit]
- Park, J.; Byun, Y.; Kim, S. Predictive Diagnostic Power of Anthropometric Indicators for Metabolic Syndrome: A Comparative Study in Korean Adults. J. Clin. Med. 2025, 14, 448. [Google Scholar] [CrossRef] [Scilit]
- Kim, C.H.; Kim, H.K.; Kim, E.H.; Bae, S.J.; Choe, J.; Park, J.Y. Longitudinal Changes in Insulin Resistance, Beta-Cell Function and Glucose Regulation Status in Prediabetes. Am. J. Med. Sci. 2018, 355, 54–60. [Google Scholar] [CrossRef] [Scilit]
- Stanciu, S.; Rusu, E.; Miricescu, D.; Radu, A.C.; Axinia, B.; Vrabie, A.M.; Ionescu, R.; Jinga, M.; Sirbu, C.A. Links between Metabolic Syndrome and Hypertension: The Relationship with the Current Antidiabetic Drugs. Metabolites 2023, 13, 87. [Google Scholar] [CrossRef] [Scilit] [PubMed]
- Kechagia, I.; Barkas, F.; Liberopoulos, E.; Chrysohoou, C.; Sfikakis, P.P.; Tsioufis, C.; Pitsavos, C.; Panagiotakos, D. Association between simple, combined lipid markers and 20-year cumulative incidence of type 2 diabetes: The ATTICA cohort study (2002–2022). Lipids Health Dis. 2024, 23, 413. [Google Scholar] [CrossRef] [Scilit] [PubMed]
- Sun, Q.; Ren, Q.; Du, L.; Chen, S.; Wu, S.; Zhang, B.; Wang, B. Cardiometabolic Index (CMI), Lipid Accumulation Products (LAP), Waist Triglyceride Index (WTI) and the risk of acute pancreatitis: A prospective study in adults of North China. Lipids Health Dis. 2023, 22, 190. [Google Scholar] [CrossRef] [Scilit] [PubMed]
- Cheng, W.; Zhuang, J.; Chen, S. Dyslipidemia and the Prevalence of Hypertension: A Cross-Sectional Study Based on Chinese Adults Without Type 2 Diabetes Mellitus. Front. Cardiovasc. Med. 2022, 9, 938363. [Google Scholar] [CrossRef] [Scilit]
- Cai, X.; Hu, J.; Zhu, Q.; Wang, M.; Liu, S.; Dang, Y.; Hong, J.; Li, N. Relationship of the metabolic score for insulin resistance and the risk of stroke in patients with hypertension: A cohort study. Front. Endocrinol. 2022, 13, 1049211. [Google Scholar] [CrossRef] [Scilit]
- Ezhova, N.E.; Shavarova, E.K.; Kobalava, Z.D.; Bazdyreva, E.I.; Shavarov, A.A. Metabolic Score for Insulin Resistance (METS-IR) Associations with Subclinical Left Ventricular and Left Atrial Remodelling in Young Subjects with Hypertension. Ann. Clin. Cardiol. 2024, 6, 82–87. [Google Scholar] [CrossRef] [Scilit]
- Tamehri Zadeh, S.S.; Cheraghloo, N.; Masrouri, S.; Esmaeili, F.; Azizi, F.; Hadaegh, F. Association between metabolic score for insulin resistance and clinical outcomes: Insights from the Tehran lipid and glucose study. Nutr. Metab. 2024, 21, 34. [Google Scholar] [CrossRef] [Scilit]
- Liu, D.; Zhong, J.; Xuan, W.; Chen, W.; Yuan, J.; Zhang, X.; He, L. Predictive value of MetS-IR for the glucose status conversion in prediabetes: A multi-center retrospective cohort study. BMC Endocr. Disord. 2025, 25, 162. [Google Scholar] [CrossRef] [Scilit]
- Chen, Z.; Huang, C.; Zhou, Z.; Zhang, Y.; Xu, M.; Tang, Y.; Fan, L.; Feng, K. A nonlinear associations of metabolic score for insulin resistance index with incident diabetes: A retrospective Chinese cohort study. Front. Clin. Diabetes Healthc. 2023, 3, 1101276. [Google Scholar] [CrossRef] [Scilit]
- Hou, Y.; Li, R.; Xu, Z.; Chen, W.; Li, Z.; Jiang, W.; Meng, Y.; Han, J. Association of METS-IR index with Type 2 Diabetes: A cross-sectional analysis of national health and nutrition examination survey data from 2009 to 2018. PLoS ONE 2024, 19, e0308597. [Google Scholar] [CrossRef] [Scilit]
- Unger, G.; Benozzi, S.F.; Perruzza, F.; Pennacchiotti, G.L. Triglycerides and glucose index: A useful indicator of insulin resistance. Endocrinol. Nutr. 2014, 61, 533–540. [Google Scholar] [CrossRef] [Scilit]
- Caragea, D.C.; Boldeanu, L.; Assani, M.-Z.; Caragea, M.-E.; Stroe-Ionescu, A.-Ș.; Popa, R.; Maria, D.-T.; Pădureanu, V.; Vere, C.C.; Boldeanu, M.V. Assessment of AOPP, TBARS, and Inflammatory Status in Diabetic Nephropathy and Hemodialyzed Patients. Int. J. Mol. Sci. 2025, 26, 10670. [Google Scholar] [CrossRef] [Scilit]



| Variables | PreDM (n = 80) | T2DM (n = 120) | p-Value | Variables | PreDM (n = 80) | T2DM (n = 120) | p-Value |
|---|---|---|---|---|---|---|---|
| Age (years) (Mean ± SD) | 58.40 ± 11.79 | 64.17 ± 10.80 | 0.0005 * | AST/ALT [median(range)] | 1.03 (0.47–2.70) | 0.98 (0.35–3.89) | 0.11 |
| SBP (mmHg) (Mean ± SD) | 137.90 ± 18.76 | 137.50 ± 18.10 | 0.88 | CREATININE (mg/dL) [median(range)] | 0.76 (0.36–1.75) | 0.81 (0.40–7.42) | 0.932 |
| DBP (mmHg) (Mean ± SD) | 79.91 ± 14.68 | 80.52 ± 10.97 | 0.73 | CRP (mg/dL) [median(range)] | 0.51 (0.10–12.80) | 8.50 (3.20–48.50) | <0.0001 * |
| BMI (kg/m2) [median(range)] | 29.17 (16.72–41.76) | 29.37 (18.21–46.84) | 0.159 | ESR (mm/1st hour) [median(range)] | 27.50 (5.00–115.00) | 30.00 (4.00–140.00) | 0.466 |
| Insulin (μIU/mL) [median(range)] | 10.35 (1.60–52.80) | 11.60 (0.50–131.80) | 0.874 | WBC (×103/μL) [median(range)] | 7.34 (3.67–12.66) | 7.95 (4.54–18.74) | 0.033 * |
| HbA1c (%) [median(range)] | 5.90 (4.70–6.70) | 9.09 (5.40–15.50) | <0.0001 * | HGB (g/dL) [median(range)] | 12.75 (7.70–17.20) | 13.30 (8.10–20.00) | 0.167 |
| FPG (mg/dL) [median(range)] | 100.50 (56.00–122.00) | 161.00 (110.00–273.00) | <0.0001 * | PLT (×103/μL) [median(range)] | 261.00 (116.00–513.00) | 240.50 (116.00–573.00) | 0.575 |
| 2 h-PG (mg/dL) [median(range)] | 158.50 (141.00–196.00) | 249.50 (147.00–475.00) | <0.0001 * | Gender male/female (n) | 40/40 | 59/61 | 0.511 |
| TC (mg/dL) [median(range)] | 205.50 (130.00–464.60) | 182.50 (86.00–365.00) | 0.0002 | Residence urban/rural (n) | 46/34 | 69/51 | 0.558 |
| LDL-c (mg/dL) [median(range)] | 119.50 (58.00–368.00) | 100.00 (26.20–261.00) | 0.0001 | Dyslipidemia n (%) | 69 (86%) | 106 (88%) | 0.409 |
| HDL-c (mg/dL) [median(range)] | 54.30 (32.00–86.14) | 44.50 (21.00–84.00) | 0.0001 | AST (IU/L) [median(range)] | 19.14 (9.85–75.08) | 22.59 (10.72–146.20) | 0.011 * |
| TG (mg/dL) [median(range)] | 133.00 (45.00–610.00) | 151.50 (53.00–624.00) | 0.343 | ALT (IU/L) [median(range)] | 18.50 (7.00–90.00) | 23.50 (7.00–261.00) | 0.004 * |
| Alcohol consumption n (%) | 38 (47%) | 54 (45%) | 0.419 | Smoking n (%) | 44 (55%) | 72 (60%) | 0.288 |
| PreDM | |||||
|---|---|---|---|---|---|
| Normal HOMA-IR and METS-IR (n = 26) | Normal HOMA-IR and Altered METS-IR (n = 21) | Altered HOMA-IR and Normal METS-IR (n = 15) | Altered HOMA-IR and METS-IR (n = 18) | p-Value from Ordinary One-Way ANOVA/Kruskal–Wallis Test | |
| HOMA%B [median(range)] | 79.76 (−406.30–261.80) | 87.30 (−1704.00–333.80) | 143.10 (106.20–532.80) | 185.70 (66.86–704.00) | <0.0001 * |
| HbA1c (%) [median(range)] | 5.90 (4.70–6.70) | 5.90 (5.00–6.30) | 5.80 (4.70–6.40) | 5.86 (4.90–6.30) | 0.831 |
| BMI [median(range)] | 24.90 (16.72–33.70) | 31.85 (24.96–58.48) | 24.90 (18.01–29.34) | 33.87 (28.40–46.41) | <0.0001 * |
| WWI [median(range)] | 11.55 (7.14–17.24) | 11.30 (5.99–13.13) | 11.62 (9.42–20.74) | 11.06 (10.40–12.65) | 0.335 |
| BRI [median(range)] | 4.91 (0.84–13.50) | 6.54 (2.61–9.20) | 5.10 (2.13–15.83) | 6.18 (5.26–9.20) | 0.0003 * |
| CI [median(range)] | 1.37 (0.86–2.14) | 1.32 (0.68–1.59) | 1.42 (1.13–2.55) | 1.30 (1.18–1.45) | 0.248 |
| AVI [median(range)] | 19.42 (7.90–38.13) | 22.12 (10.17–34.05) | 18.84 (10.66–61.62) | 22.31 (17.40–34.05) | 0.153 |
| ABSI [median(range)] | 0.09 (0.06–0.15) | 0.08 (0.04–0.10) | 0.09 (0.07–0.17) | 0.08 (0.07–0.09) | 0.035 * |
| ABSI Z score (Mean ± SD) | 0.99 ± 1.83 | 0.12 ± 1.16 | 1.75 ± 2.60 | −0.03 ± 0.51 | 0.007 * |
| T2DM | |||||
|---|---|---|---|---|---|
| Normal HOMA-IR and METS-IR (n = 45) | Normal HOMA-IR and Altered METS-IR (n = 36) | Altered HOMA-IR and Normal METS-IR (n = 27) | Altered HOMA-IR and METS-IR (n = 12) | p-Value from Ordinary One-Way ANOVA/Kruskal–Wallis Test | |
| HOMA%B [median(range)] | 40.54 (2.40–103.10) | 22.94 (8.42–86.18) | 68.19 (21.64–370.70) | 45.12 (15.77–148.70) | <0.0001 * |
| HbA1c (%) [median(range)] | 8.70 (6.30–13.41) | 9.00 (6.10–15.50) | 9.30 (5.40–11.73) | 10.60 (7.50–15.50) | 0.001 * |
| BMI [median(range)] | 25.39 (18.21–34.26) | 28.20 (28.20–46.84) | 27.36 (21.30–32.81) | 33.79 (28.41–40.16) | <0.0001 * |
| WWI [median(range)] | 10.40 (7.95–14.03) | 11.22 (10.00–12.64) | 10.29 (8.19–12.19) | 11.62 (10.42–12.52) | 0.0004 * |
| BRI [median(range)] | 4.26 (1.28–7.91) | 7.29 (4.99–12.43) | 3.94 (1.36–7.73) | 6.65 (5.64–9.58) | <0.0001 * |
| CI [median(range)] | 1.24 (0.88–1.70) | 1.32 (1.19–1.47) | 1.23 (0.94–1.48) | 1.34 (1.20–1.45) | 0.002 * |
| AVI [median(range)] | 17.33 (7.37–31.25) | 25.59 (17.69–35.43) | 16.21 (9.00–24.65) | 23.76 (19.72–32.26) | <0.0001 * |
| ABSI [median(range)] | 0.08 (0.06–0.11) | 0.08 (0.07–0.09) | 0.08 (0.06–0.09) | 0.08 (0.07–0.09) | 0.458 |
| ABSI Z score (Mean ± SD) | 0.83 ± 1.23 | 1.13 ± 0.57 | 0.74 ± 1.08 | 1.24 ± 0.66 | 0.272 |
| PreDM | T2DM | p-Value from Student’s t-Test/ Mann–Whitney Test | PreDM | T2DM | p-Value from Student’s t-Test/ Mann–Whitney Test | |
|---|---|---|---|---|---|---|
| Variables | HTN gr. II (n = 30) | HTN gr. II (n = 30) | HTN gr. III (n = 50) | HTN gr. III (n = 90) | ||
| HOMA-IR [median(range)] | 2.66 (0.80–7.76) | 4.33 (1.25–62.10) | 0.022 * | 2.49 (0.42–11.73) | 4.32 (0.17–18.66) | <0.0001 * |
| HOMA%B [median(range)] | 101.90 (−1704.00–492.00) | 46.74 (12.57–370.70) | 0.0001 * | 111.00 (13.09–704.00) | 40.83 (2.40–342.60) | <0.0001 * |
| METS-IR (Mean ± SD) | 39.88 ± 9.52 | 46.46 ± 10.78 | 0.015 * | 44.49 ± 10.24 | 51.04 ± 11.35 | 0.0009 * |
| TyG (Mean ± SD) | 8.72 ± 0.45 | 9.38 ± 0.61 | <0.0001 * | 8.80 ± 0.58 | 9.33 ± 0.60 | <0.0001 * |
| TyG/HDL-c [median(range)] | 0.16 (0.09–0.24) | 0.19 (0.10–0.48) | 0.016 * | 0.16 (0.09–0.32) | 0.21 (0.11–0.39) | <0.0001 * |
| TG/HDL-c [median(range)] | 2.61 (0.59–6.02) | 3.57 (0.80–15.22) | 0.049 * | 2.51 (0.60–19.06) | 3.06 (1.06–17.83) | 0.179 |
| CRI I [median(range)] | 3.70 (2.28–8.24) | 3.71 (2.33–13.17) | 0.840 | 3.84 (2.07–9.34) | 3.79 (2.06–9.13) | 0.997 |
| CRI II [median(range)] | 2.17 (1.01–6.53) | 1.98 (0.60–5.43) | 0.727 | 2.34 (1.02–6.54) | 2.21 (0.76–6.53) | 0.491 |
| LAP [median(range)] | 62.05 (4.83–190.60) | 67.15 (−5.65–244.60) | 0.900 | 57.26 (0.00–328.50) | 60.18 (0.00–345.20) | 0.565 |
| LCI [median(range)] | 64,233.00 (17,610.00–279,581.00) | 54,906.00 (10,480.00–556,993.00) | 0.783 | 58,212.00 (11,992.00–689,662.00) | 57,601.00 (6742.00–759,738.00) | 0.323 |
| TCBI [median(range)] | 2259.00 (575.10–9463.00) | 2285.00 (612.60–10,726.00) | 0.539 | 1989.00 (575.10–16,780.00) | 2111.00 (386.50–15,834.00) | 0.628 |
| Model 1 | Model 2 | ||||||||||
|---|---|---|---|---|---|---|---|---|---|---|---|
| Analysis of Variance | SS | DF | MS | F (DFn, DFd) | p Value | Analysis of Variance | SS | DF | MS | F (DFn, DFd) | p Value |
| Regression | 1586 | 3 | 528.7 | F (3, 76) = 6.108 | 0.0009 | Regression | 2563 | 3 | 854.3 | F (3, 76) = 11.59 | <0.0001 |
| HOMA-IR-PreDM | 0.188 | 1 | 0.188 | F (1, 76) = 0.002 | 0.962 | HOMA%B-PreDM | 19.09 | 1 | 19.09 | F (1, 76) = 0.259 | 0.612 |
| TyG-PreDM | 1221 | 1 | 1221 | F (1, 76) = 14.10 | 0.0003 | LAP-PreDM | 1338 | 1 | 1338 | F (1, 76) = 18.15 | <0.0001 |
| BRI-PreDM | 605 | 1 | 605 | F (1, 76) = 6.990 | 0.010 | WWI-PreDM | 1698 | 1 | 1698 | F (1, 76) = 23.04 | <0.0001 |
| Parameter estimates | Variable | Estimate | 95% CI (profile likelihood) | |t| | p value | Parameter estimates | Variable | Estimate | 95% CI (profile likelihood) | |t| | p value |
| β0 | Intercept | −30.54 | −66.69 to 5.620 | 1.682 | 0.096 | β0 | Intercept | 66.17 | 53.99 to 78.35 | 10.82 | <0.0001 |
| β1 | HOMA-IR-PreDM | −0.028 | −1.249 to 1.192 | 0.046 | 0.962 | β1 | HOMA%B-PreDM | 0.002 | −0.005 to 0.009 | 0.509 | 0.612 |
| β2 | TyG-PreDM | 7.480 | 3.513 to 11.45 | 3.756 | 0.0003 | β2 | LAP-PreDM | 0.074 | 0.039 to 0.109 | 4.260 | <0.0001 |
| β3 | BRI-PreDM | 1.288 | 0.317 to 2.258 | 2.644 | 0.010 | β3 | WWI-PreDM | −2.501 | −3.539 to −1.463 | 4.800 | <0.0001 |
| Model 1 | Model 2 | ||||||||||
|---|---|---|---|---|---|---|---|---|---|---|---|
| Analysis of Variance | SS | DF | MS | F (DFn, DFd) | p Value | Analysis of Variance | SS | DF | MS | F (DFn, DFd) | p Value |
| Regression | 10544 | 3 | 3515 | F (3, 116) = 85.59 | <0.0001 | Regression | 7620 | 3 | 2540 | F (3, 116) = 38.33 | <0.0001 |
| HOMA-IR-T2DM | 23.14 | 1 | 23.14 | F (1, 116) = 0.563 | 0.454 | HOMA%B-T2DM | 98.78 | 1 | 98.78 | F (1, 116) = 1.491 | 0.224 |
| TyG-T2DM | 1389 | 1 | 1389 | F (1, 116) = 33.82 | <0.0001 | LAP-T2DM | 4551 | 1 | 4551 | F (1, 116) = 68.68 | <0.0001 |
| BRI-T2DM | 6456 | 1 | 6456 | F (1, 116) = 157.2 | <0.0001 | WWI-T2DM | 143.5 | 1 | 143.5 | F (1, 116) = 2.166 | 0.143 |
| Parameter estimates | Variable | Estimate | 95% CI (profile likelihood) | |t| | p value | Parameter estimates | Variable | Estimate | 95% CI (profile likelihood) | |t| | p value |
| β0 | Intercept | −23.41 | −41.66 to −5.160 | 2.541 | 0.012 | β0 | Intercept | 31.79 | 17.70 to 45.89 | 4.467 | <0.0001 |
| β1 | HOMA-IR-T2DM | −0.072 | −0.263 to 0.118 | 0.750 | 0.454 | β1 | HOMA%B-T2DM | −0.018 | −0.048 to 0.011 | 1.221 | 0.224 |
| β2 | TyG-T2DM | 5.947 | 3.922 to 7.973 | 5.815 | <0.0001 | β2 | LAP-T2DM | 0.112 | 0.085 to 0.139 | 8.287 | <0.0001 |
| β3 | BRI-T2DM | 3.316 | 2.792 to 3.839 | 12.54 | <0.0001 | β3 | WWI-T2DM | 1.011 | −0.349 to 2.371 | 1.472 | 0.143 |
Disclaimer/Publisher’s Note: The statements, opinions and data contained in all publications are solely those of the individual author(s) and contributor(s) and not of MDPI and/or the editor(s). MDPI and/or the editor(s) disclaim responsibility for any injury to people or property resulting from any ideas, methods, instructions or products referred to in the content. |
© 2025 by the authors. Licensee MDPI, Basel, Switzerland. This article is an open access article distributed under the terms and conditions of the Creative Commons Attribution (CC BY) license (https://creativecommons.org/licenses/by/4.0/).
Share and Cite
Assani, M.-Z.; Boldeanu, L.; Dijmărescu, A.L.; Caragea, D.C.; Vladu, I.M.; Clenciu, D.; Mitrea, A.; Stroe-Ionescu, A.-Ș.; Caragea, M.-E.; Siloși, I.; et al. Beyond HOMA-IR: Comparative Evaluation of Insulin Resistance and Anthropometric Indices Across Prediabetes and Type 2 Diabetes Mellitus in Metabolic Syndrome Patients. Life 2025, 15, 1845. https://doi.org/10.3390/life15121845
Assani M-Z, Boldeanu L, Dijmărescu AL, Caragea DC, Vladu IM, Clenciu D, Mitrea A, Stroe-Ionescu A-Ș, Caragea M-E, Siloși I, et al. Beyond HOMA-IR: Comparative Evaluation of Insulin Resistance and Anthropometric Indices Across Prediabetes and Type 2 Diabetes Mellitus in Metabolic Syndrome Patients. Life. 2025; 15(12):1845. https://doi.org/10.3390/life15121845
Chicago/Turabian StyleAssani, Mohamed-Zakaria, Lidia Boldeanu, Anda Lorena Dijmărescu, Daniel Cosmin Caragea, Ionela Mihaela Vladu, Diana Clenciu, Adina Mitrea, Alexandra-Ștefania Stroe-Ionescu, Mariana-Emilia Caragea, Isabela Siloși, and et al. 2025. "Beyond HOMA-IR: Comparative Evaluation of Insulin Resistance and Anthropometric Indices Across Prediabetes and Type 2 Diabetes Mellitus in Metabolic Syndrome Patients" Life 15, no. 12: 1845. https://doi.org/10.3390/life15121845
APA StyleAssani, M.-Z., Boldeanu, L., Dijmărescu, A. L., Caragea, D. C., Vladu, I. M., Clenciu, D., Mitrea, A., Stroe-Ionescu, A.-Ș., Caragea, M.-E., Siloși, I., & Boldeanu, M. V. (2025). Beyond HOMA-IR: Comparative Evaluation of Insulin Resistance and Anthropometric Indices Across Prediabetes and Type 2 Diabetes Mellitus in Metabolic Syndrome Patients. Life, 15(12), 1845. https://doi.org/10.3390/life15121845