Article

The Influence of Fine Particulate Matter and Cold Weather on Emergency Room Interventions for Childhood Asthma

1
Department of Nursing, Taoyuan Armed Forces General Hospital, Taoyuan 32549, Taiwan
2
Department of Emergency Medicine, Taoyuan Armed Forces General Hospital, Taoyuan 32549, Taiwan
3
Department of Emergency Medicine, Tri-Service General Hospital, National Defense Medical Center, Taipei 11490, Taiwan
4
Division of Chest Medicine, Department of Internal Medicine, Cheng Hsin General Hospital, Taipei 11220, Taiwan
5
Department of Neurology, Tri-Service General Hospital, National Defense Medical Center, Taipei 11490, Taiwan
*
Authors to whom correspondence should be addressed.
These authors contributed equally to this work.
Life 2024, 14(5), 570; https://doi.org/10.3390/life14050570
Submission received: 5 April 2024 / Revised: 25 April 2024 / Accepted: 27 April 2024 / Published: 29 April 2024

Abstract

:
(1) Background: Children are the most vulnerable to pollution due to their decreased stature, heightened respiratory rate, and frequent outdoor engagement. PM2.5, nitrogen dioxide (NO2), ozone, and cold weather are associated with pediatric asthma. In this study, we investigated the nexus between air pollution, climate factors, and pediatric asthma emergency room visits (ERVs). (2) Method: Pediatric asthma ERV data for healthcare quality from the Taiwanese National Insurance in the Taipei area were obtained from 2015 to 2019. Air pollution and climate factor data were also collected. Poisson regression was employed to determine the relationships with relative risks (RRs). (3) Results: The incidence of pediatric asthma ERVs decreased, with a crude RR of 0.983 (95% CI: 0.98–0.986, p < 0.001). Fine particulate matter (PM2.5) had an adjusted RR of 1.102 (95% CI: 1.037–1.172, p = 0.002) and a 7.7 µg/m3 increase, and air temperature had an adjusted RR of 0.813 (95% CI: 0.745–0.887, p < 0.001) comparing between the highest and lowest quarter air temperature associated with pediatric asthma ERVs. (4) Conclusions: This inquiry underscores the positive associations of PM2.5 and cold weather with pediatric asthma ERVs. The findings could guide the government to establish policies to reduce air pollution and promote children’s health.

1. Introduction

Asthma, a chronic respiratory condition, greatly impacts patients’ quality of life. Various factors contribute to asthma exacerbation, including both outdoor and indoor pollutants, allergens, dust mites, and smoking status. Exacerbation symptoms include shortness of breath and chest tightness, with untreated cases leading to increased airflow obstruction. Severe asthma attacks require emergency department intervention for acute treatment [1].
Children, characterized by a small body mass, frequent outdoor activities, heightened exposure, elevated respiration rates, and reduced nasal protection, are more susceptible to the effects of air pollution than adults. This vulnerability underscores the need for increased attention and governmental efforts to promote children’s health. The highest asthma occurrence rate was noted in individuals aged 1–4 years in 2019 globally [2], emphasizing the importance of targeted interventions and awareness campaigns for this age group. In 2016–2018, 35% of asthma emergency room visits (ERVs) in the United States were attributed to pediatric asthma ERVs [3]. Thus, further research and public health initiatives are warranted to address the underlying factors contributing to pediatric asthma exacerbations and to enhance overall asthma management strategies.
There are negative impacts of air pollutant agents on human cardiopulmonary health. The primary risk factor for chronic respiratory diseases is smoking, and particulate matter (PM) pollution is the second most common risk factor [2]. Air pollution, often described as a silent killer, tends to be underestimated despite its large harmful impact. Air pollutants contribute to oxidative injury in the airways, leading to oxidative stress, chronic inflammation, hyperresponsiveness, remodeling, and increased vulnerability to viral infections, exacerbating asthma [4]. After the adjustment of built-up area indicators and socioeconomic indicators, researchers focused on associations with 5-year mean concentrations of nitrogen dioxide (NO2), fine particles with an aerodynamic diameter of ≤2.5 µm (PM2.5), particles with an aerodynamic diameter of ≤10 µm (PM10), and benzene in the city of Brno, Czech Republic [5]. PM2.5, PM10, and NO2 significantly impact pediatric respiratory events, including pneumonia, asthma, bronchitis, and acute pharyngitis, in southern Taiwan [6]. PM2.5 and O3 were associated with near-fatal/fatal asthma attacks in one study [7]. The meta-analysis found NO2, SO2 and PM2.5 related to asthma exacerbations in high-income cities [8]. Previous research conducted in Taoyuan, Taiwan, revealed that short-term changes in PM2.5, ozone, and cold air temperature influenced the duration of asthma-related ERVs. Additionally, PM2.5 was identified as a factor related to pediatric asthma ERVs in northern Taiwan [9,10] and exacerbation in Thailand [11]. PM2.5, NO2, SO2, and O3 were significantly associated with increased risks of pediatric asthma ERVs in Shanghai, China [12]. An O3-8 h concentration above 80 μg/m3 contributed to an increased risk of asthma attacks in children [13]. PM was related to motor vehicle emissions and industrial production was related to increasing pediatric asthma visits in USA [14]. Taipei city, which has heavy traffic congestion, has the highest urbanization in Taiwan. Cold weather, in particular, can induce bronchial constriction [15] and childhood respiratory problems. The previous study found that mediating effects of PM2.5 increased the severity of chronic obstructive pulmonary disease in cold weather [16]. Thus, investigating the associations between air pollution, climate factors, and pediatric asthma ERVs in Taipei is essential for a comprehensive understanding of the environmental determinants impacting pediatric respiratory health.
The aim of this study was to investigate the potential effects of air pollutants and climate factors on pediatric asthma ERVs in Taipei. Using government-provided open data retrieved from the Taiwan National Insurance Dataset, we aimed to elucidate the potential relationships between asthma exacerbations and childhood asthma exacerbations. The findings may serve as a valuable resource for evidence-based policy development aimed at improving the respiratory health outcomes of the pediatric population in the specified area.

2. Materials and Methods

2.1. Pediatric Asthma Emergency Room Visits and Air Pollution

We utilized healthcare quality reports published by the National Health Insurance Administration every quarter of the year from 2015 to 2019 and used pediatric asthma ERVs as a key indicator of healthcare quality. The numbers of pediatric asthma ERVs and pediatric asthma patients were collected from the Taipei area (Taipei and New Taipei cities) every 3 months. The first quarter was from January to March, the second quarter was from April to June, the third quarter was from July to September, and the fourth quarter was from October to December. Pediatric asthma patients younger than 18 years of age with the ICD10-CM code J45 who had at least four outpatient visits within a year and who used asthma medications were identified from the National Health Insurance Data retrieved from the National Health Insurance Admiration every quarter of year [17]. For the Taipei area, which has a basin topography, we selected the Songshan station in the center of the basin. Air pollutant data were collected from the Songshan station in the center of Taipei, at 25°04′50″ N, 121°58′05″, from the Taiwanese Environment and Weather Administration [18]. The air temperature and relative humidity data were obtained from the Taiwanese Central Weather Administration every month [19]. This study was approved by the Institutional Review Board of Tri-Service General Hospital (protocol code C202405021). The study flowchart is shown in Figure 1. The mean incidence of pediatric asthma ERVs, air pollutant agents and climate factors during the study period are shown in Table 1.
While high correlation coefficients (≥0.8) were noted between each air pollutant, one air pollutant must be excluded. NO2 was related to ozone formation via photochemical reactions on hot days. CO2 levels below 1000 ppm were considered to indicate no respiratory hazard. The highest daily concentration of CO was 0.6 µg/m3, lower than the 4 µg/m3 annual average of the WHO air quality guidelines [20] that were not analyzed.

2.2. Statistical Analysis
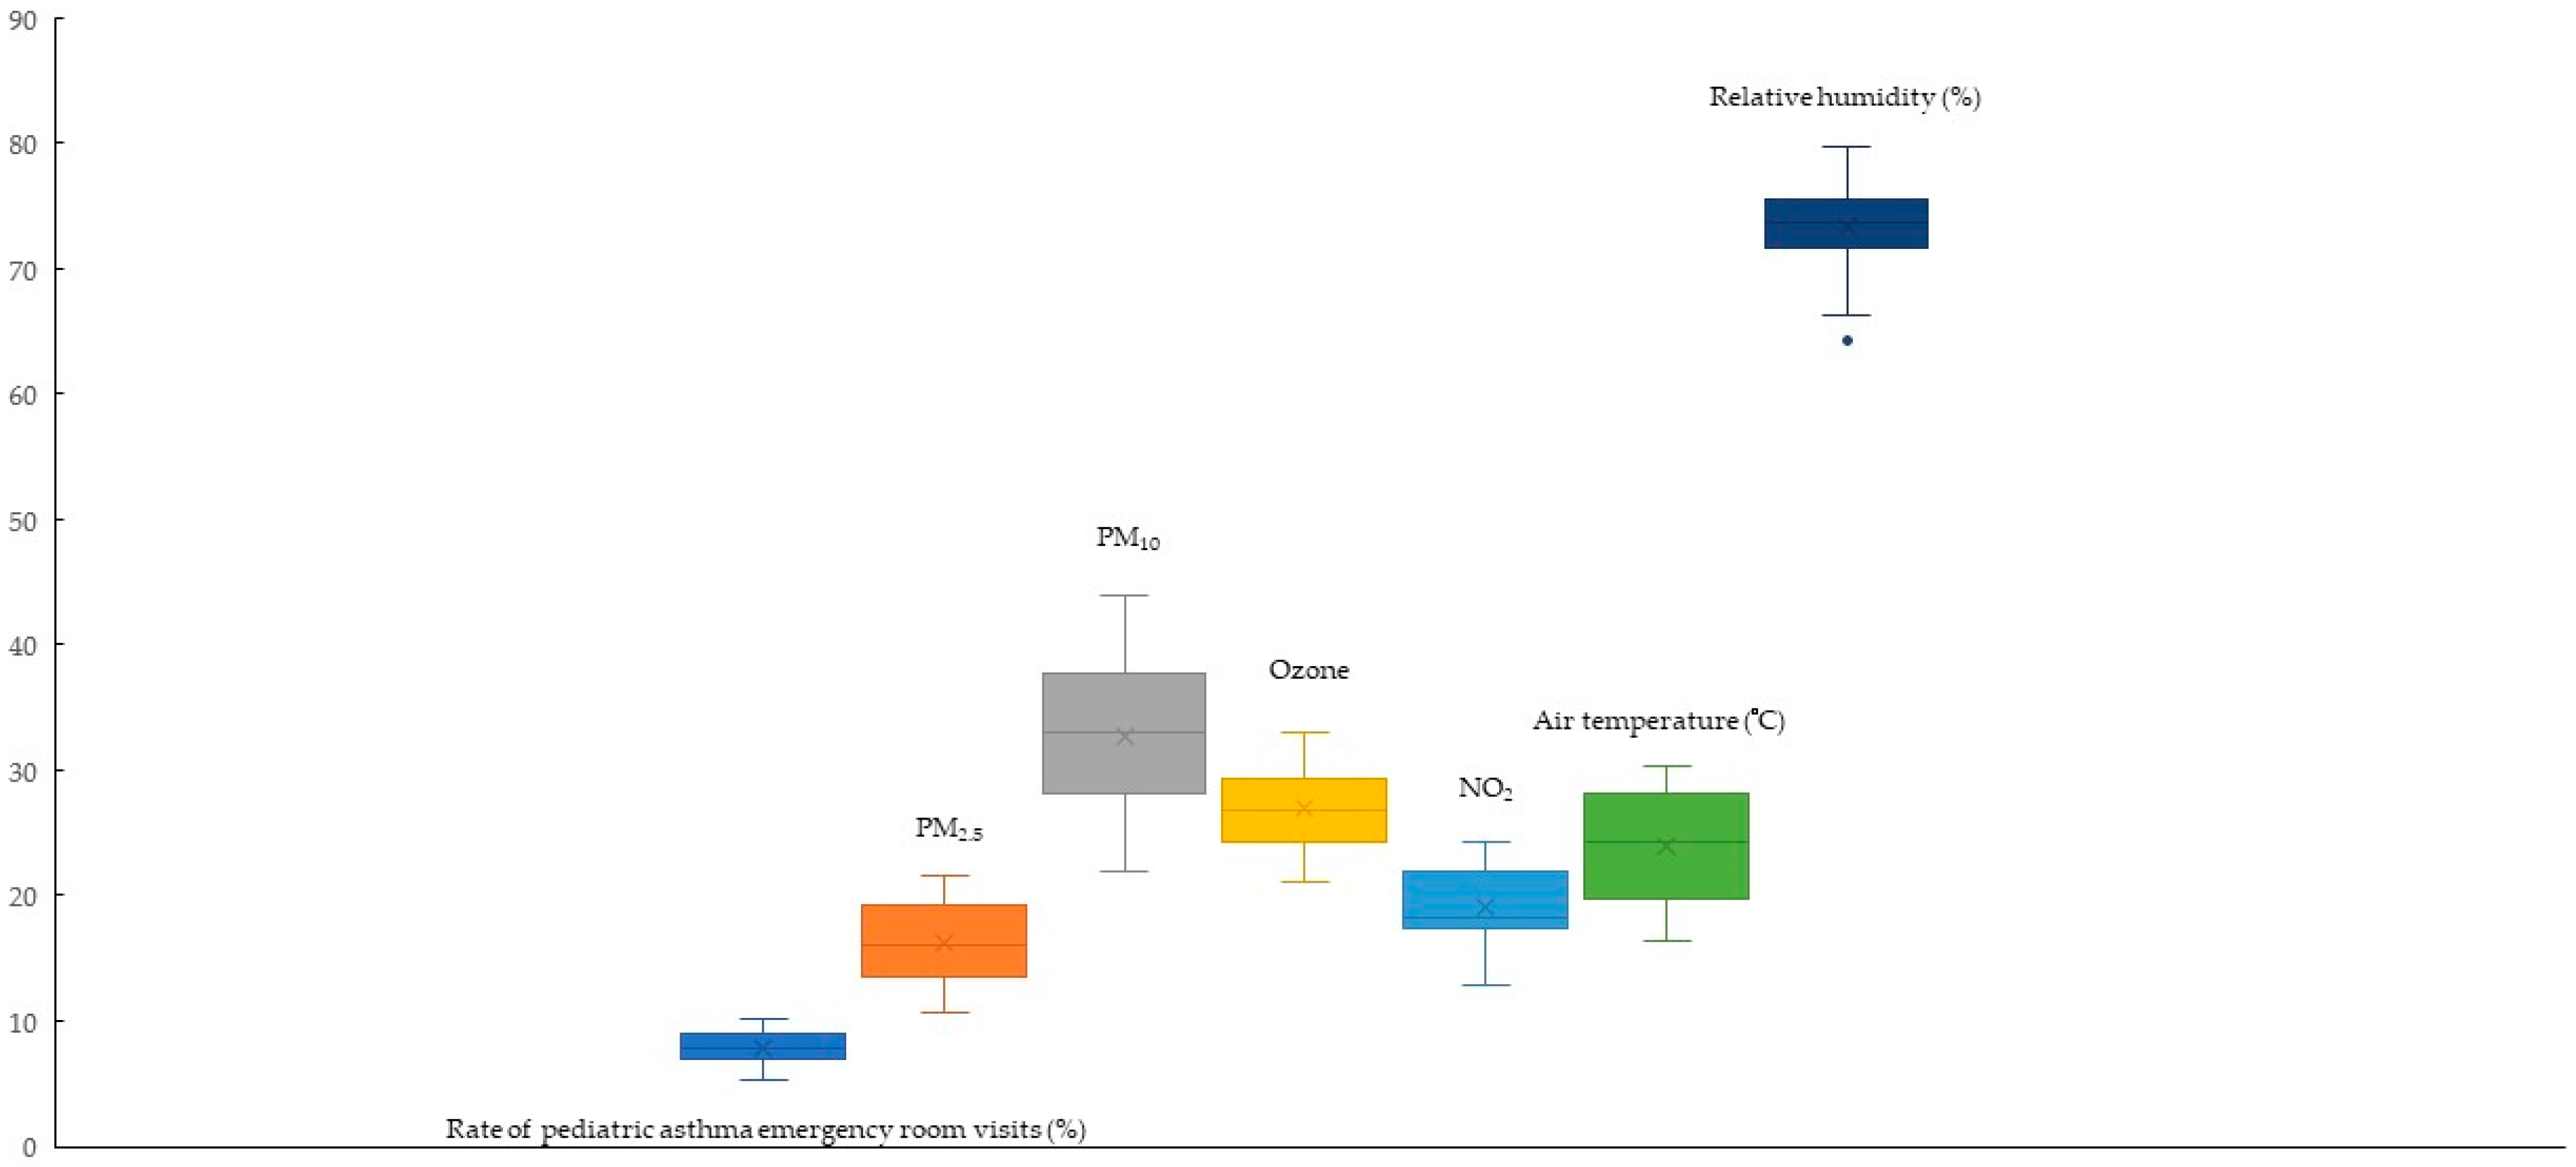
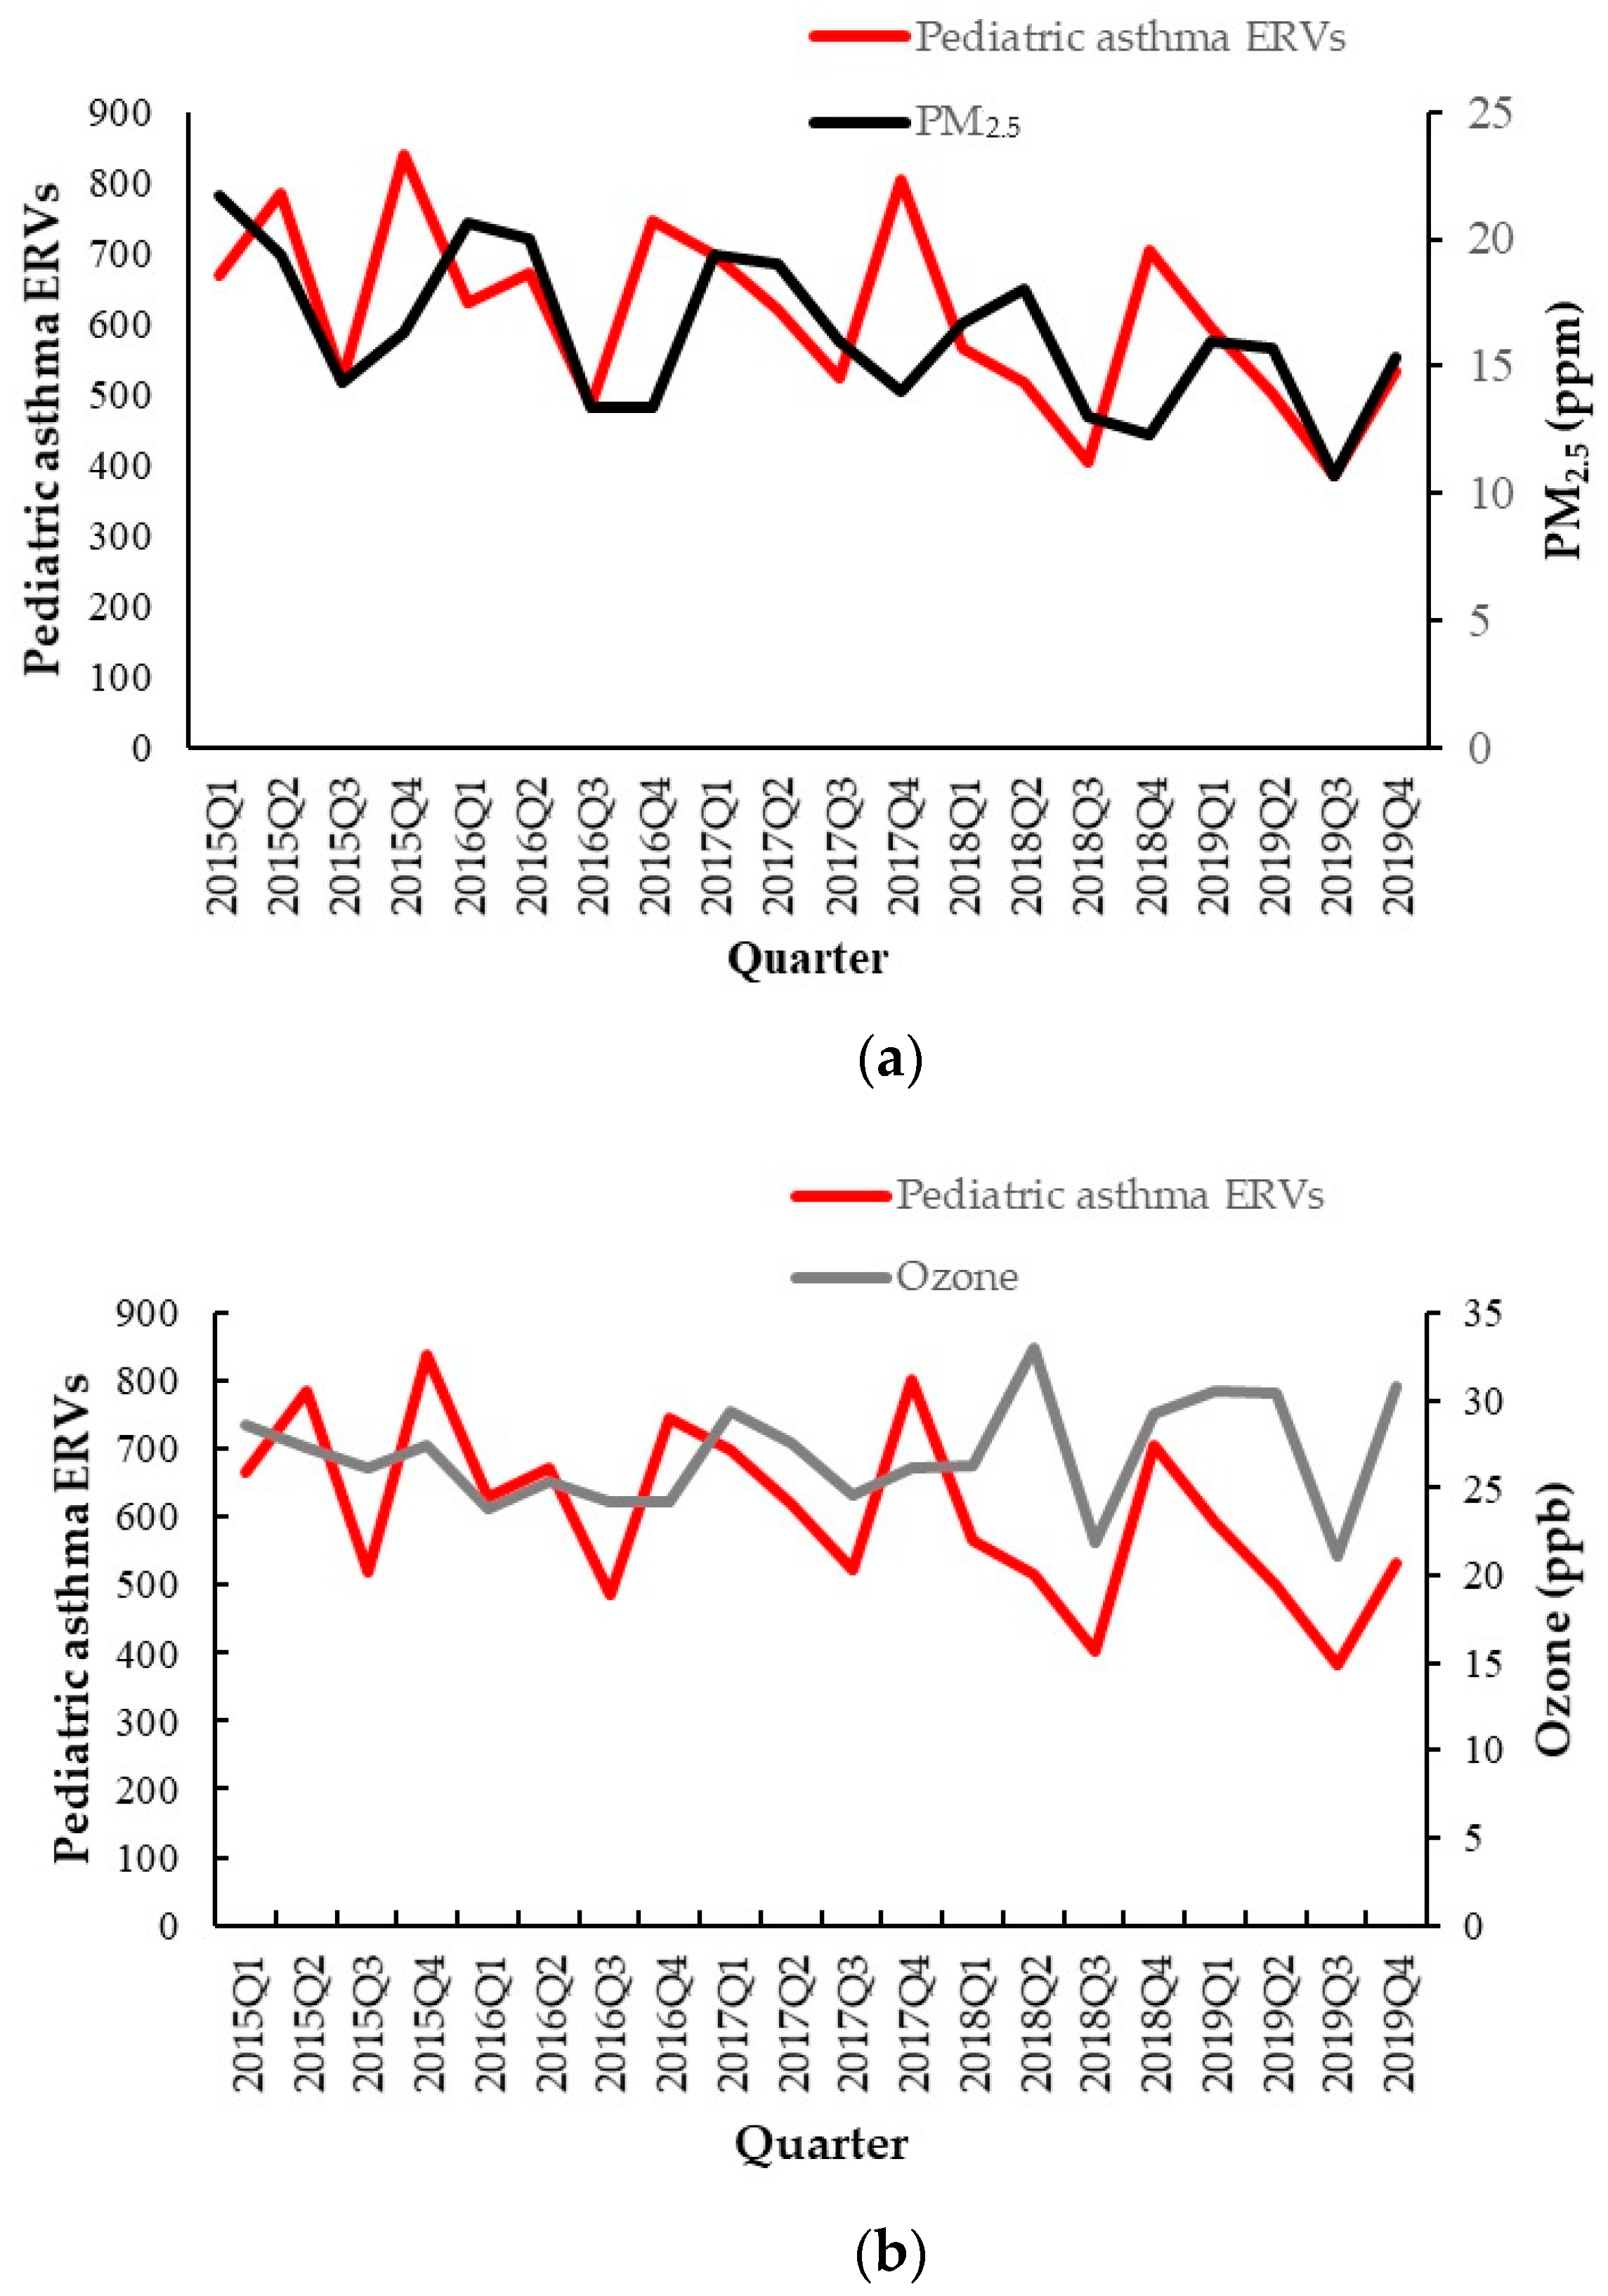
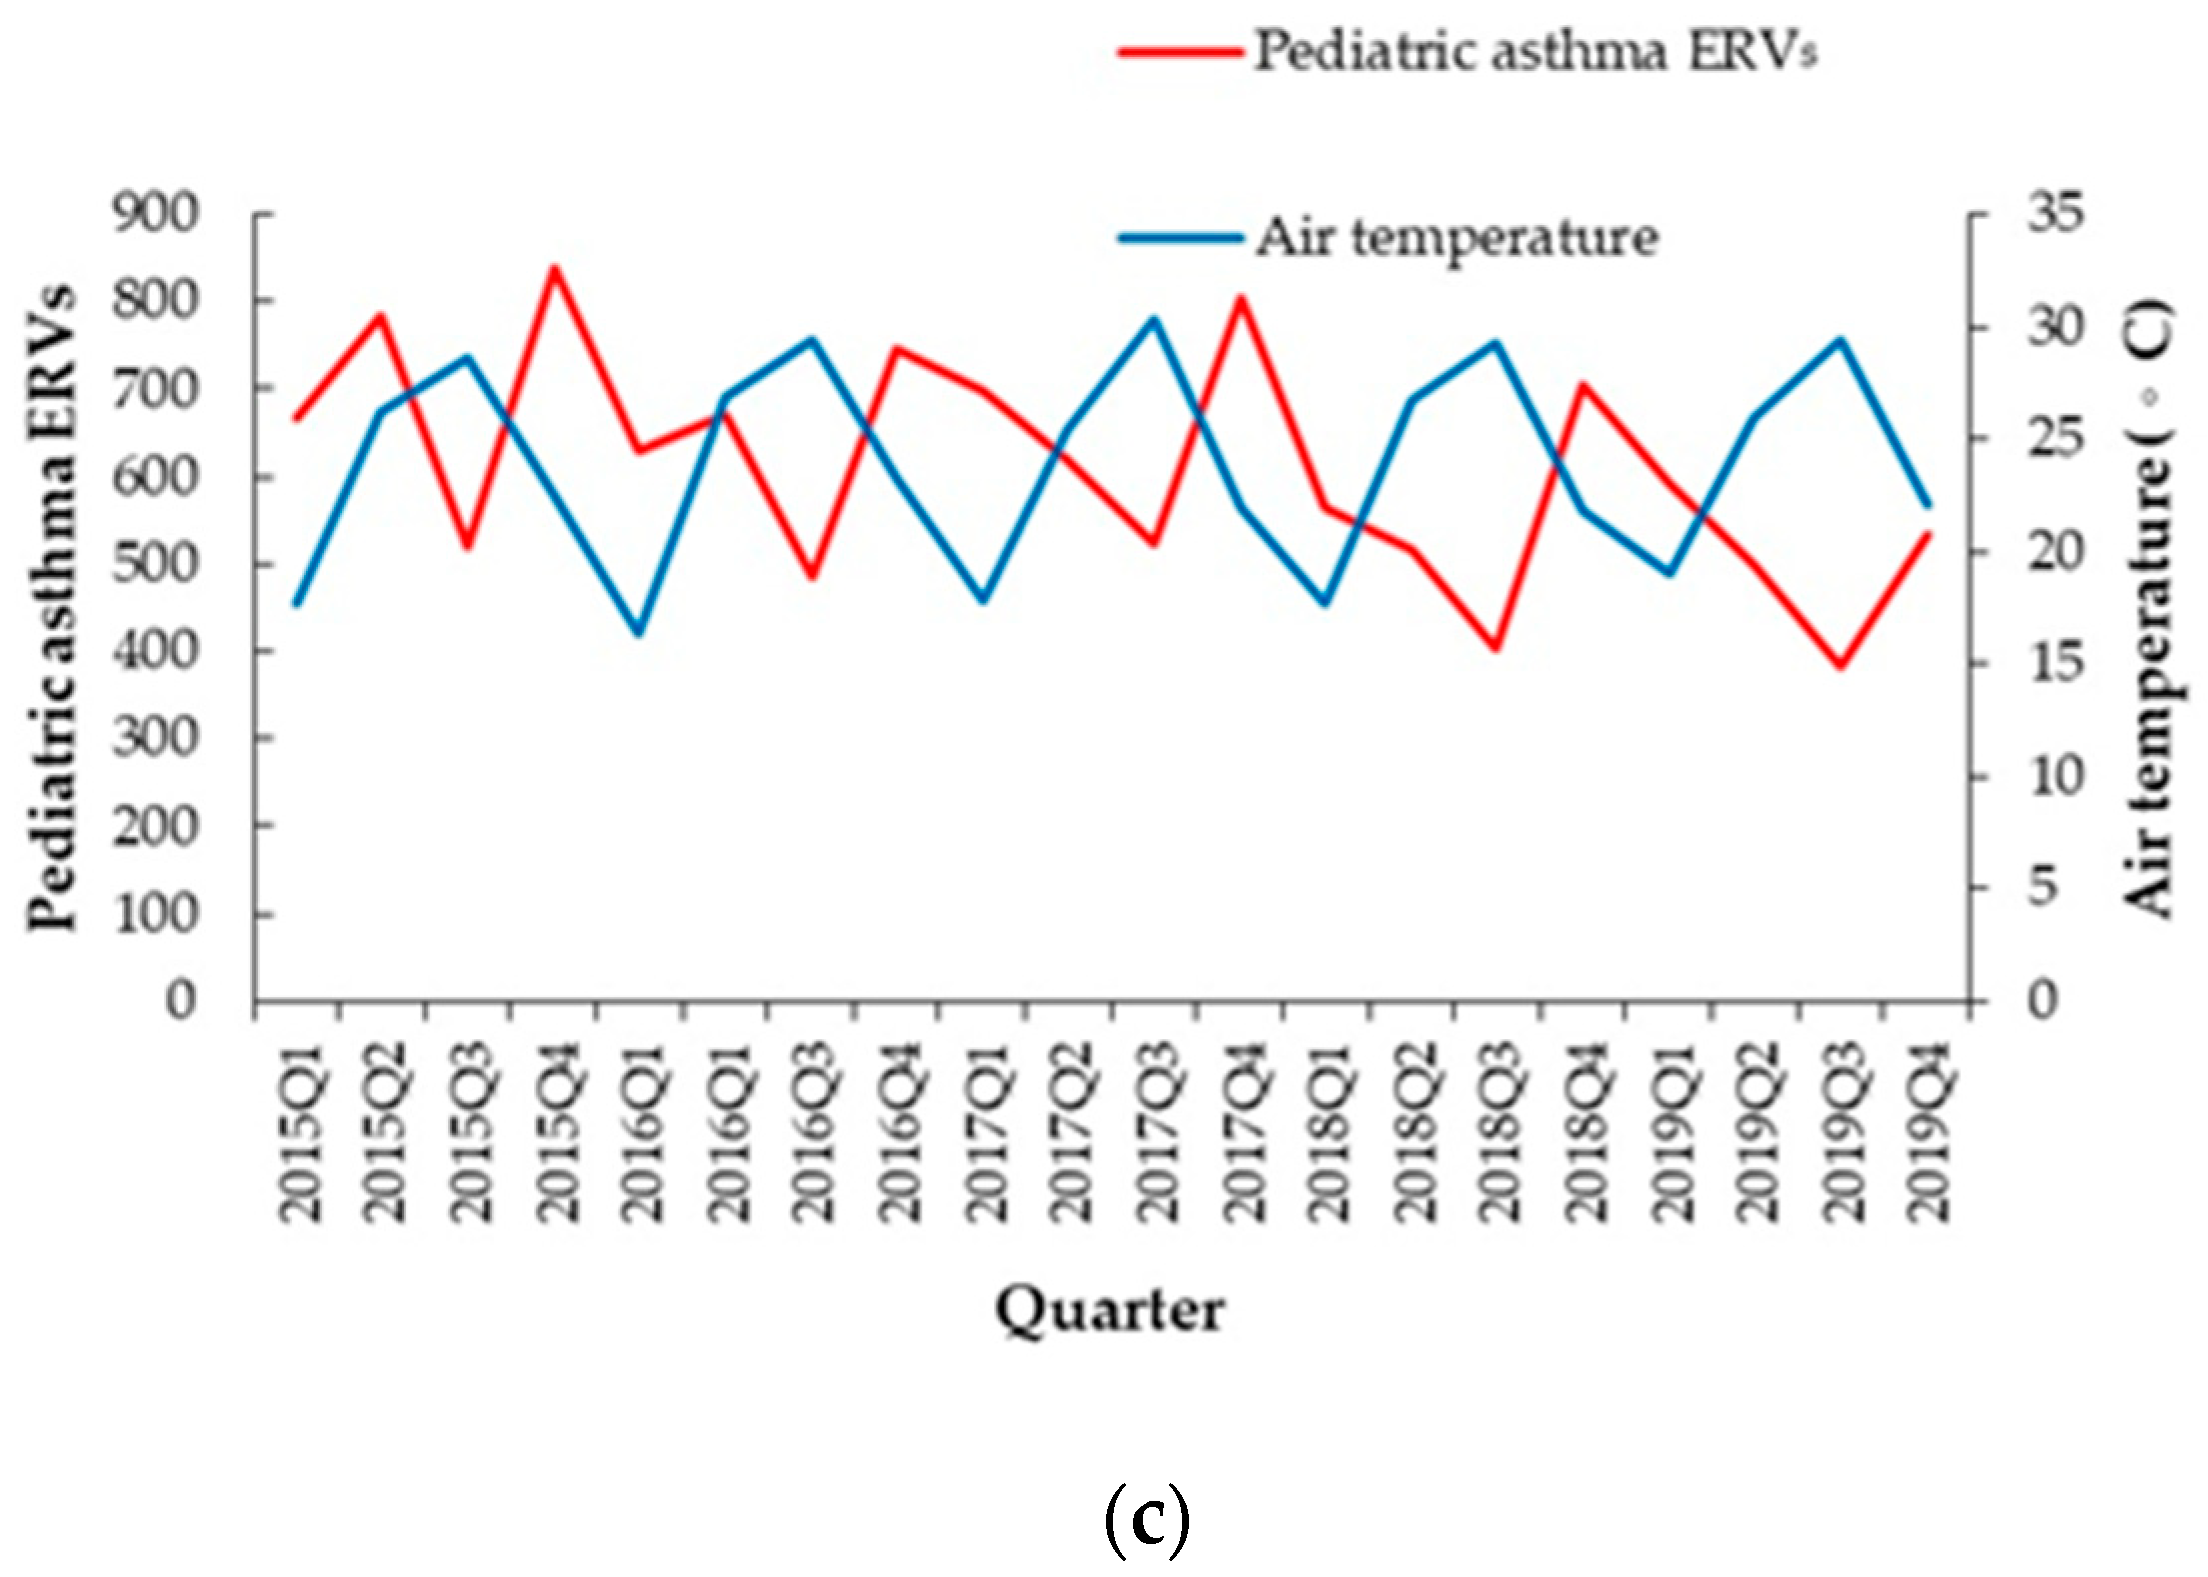
Descriptive statistics, mean pediatric asthma ERVs, air pollutant agents, and climate factors were explored for each quarter. One-way ANOVA tests were conducted to assess the mean values across the four quarters. Poisson regression was used to analyze associations between air pollutant agents, climate factors, and pediatric asthma ERVs by calculating adjusted relative risks (RRs). The PM2.5 and air temperature were captured across four quarters. The pediatric ERVs of the highest quarter PM2.5 and air temperature were compared with the pediatric ERVs of the lowest quarter in PM2.5 and air temperature. Plots were created for the number of pediatric asthma ERVs, air pollutant agents, and meteorological factors each season. Significance was defined at p < 0.05, and all the statistical analyses were performed using SPSS version 21.

3. Results

The mean number of mean pediatric asthma ERVs was 609 ± 129; the mean rate of pediatric asthma ERVs was 7.9 ± 1.35%; the mean PM2.5 was 16.25 ± 3.05 µg/m3; the mean O3 was 26.91 ± 3.12 ppb; the mean NO2 was 19.06 ± 3.04 ppb; the mean air temperature was 23.93 ± 4.53 °C; the mean relative humidity was 73.37 ± 3.76%; the mean CO2 was 429.52 ± 6.51 µg/m3; the mean methane was 1.81 ± 0.07 µg/m3; the mean nonmethane hydrocarbons (NMCHs) was 0.15 ± 0.03 µg/m3; the mean total hydrocarbon (THC) was 1.96 ± 0.09 µg/m3 during study period. A box plot of the rate of pediatric asthma emergency room visits, air pollutants and climate factors is shown in Figure 2.
The correlation coefficient between PM2.5 and CO was 0.9 (p < 0.01); the correlation coefficient between PM2.5 and NO2 was 0.81 (p < 0.01); the correlation coefficient between PM2.5 and CH4 was 0.81 (p < 0.01); the correlation coefficient between PM2.5 and THC was 0.89 (p < 0.01); the correlation coefficient between CO and NO2 was 0.93 (p < 0.01); the correlation coefficient between CO and CH4 was 0.86 (p < 0.01); the correlation coefficient between CO and NMCH was 0.88 (p < 0.01); the correlation coefficient between CO and THC was 0.95 (p < 0.01); the correlation coefficient between NO2 and CH4 was 0.89 (p < 0.01); the correlation coefficient between NO2 and THC was 0.96 (p < 0.01). The correlation of air pollutants is shown in Table 1.
Table 1. The correlation between air pollutants and climate factors.
ATRHPM2.5O3COSO2NO2CH4NMCHsTHC
AT1−0.51−0.44−0.4−0.550.46−0.67−0.69−0.14−0.56
p 0.02 *0.050.080.02 *0.04 *<0.01 *<0.01 *0.570.01 *
RH−0.5110.070.120.22−0.610.290.1−0.020.2
p0.02 * 0.780.620.36<0.01 *0.220.670.940.4
PM2.5−0.440.0710.370.90.340.810.810.790.89
p0.050.78 0.2<0.01 *0.14<0.01 *<0.01 *<0.01 *<0.01 *
O3−0.40.120.310.21−0.040.260.18−0.010.21
p0.080.620.2 0.370.850.260.450.980.37
CO−0.50.220.90.2110.270.930.860.880.95
p0.02 *0.35<0.01 *0.37 0.25<0.01 *<0.01 *<0.01 *<0.01 *
SO20.46−0.610.34−0.040.2710.120.170.490.35
p0.04 *<0.01 *0.140.850.25 0.60.480.03 *0.13
NO2−0.670.290.810.260.930.1210.890.750.96
p<0.01 *0.22<0.01 *0.26<0.01 *0.6 <0.01 *<0.01 *<0.01 *
CH4−0.690.10.80.180.860.170.8910.670.97
p<0.01 *0.67<0.01 *0.45<0.01 *0.48<0.01 * <0.01 *<0.01 *
NMCHs−0.14−0.020.79−0.010.880.490.750.6710.85
p0.5760.94<0.01 *0.98<0.01 *0.03 *<0.01 *<0.01 * <0.01 *
THC−0.560.20.890.210.950.350.960.970.851
p0.01 *0.4<0.01 *0.37<0.01 *0.13<0.01 *<0.01 *<0.01 *
* p < 0.05. AT: air temperature; RH: relative humidity; NMCHs: nonmethane hydrocarbons; THC: total hydrocarbon.
During the study period, the highest mean number of cases of pediatric asthma ERVs was observed in the fourth quarter, at 725 ± 119, while the lowest mean number of cases occurred in the third quarter, at 463 ± 70 (p = 0.004). The highest mean PM2.5 concentration was 18.87 ± 2.47 µg/m3 in the first quarter, and the lowest mean PM2.5 concentration was 13.47 ± 1.95 µg/m3 in the third quarter (p = 0.001). The highest mean O3 concentration was 28.74 ± 2.98 ppb in the second quarter, with the lowest mean of 23.59 ± 2.11 ppb in the third quarter (p = 0.03). The highest mean air temperature was 29.42 ± 0.59 °C in the third quarter, and the lowest was 17.72 ± 0.93 °C in the first quarter (p < 0.001). The highest mean relative humidity was 75.4 ± 2.82% in the first quarter, and the lowest was 70.47 ± 4.26% in the third quarter (p = 0.113) (Table 2). The changes in pediatric ERVs, air pollutants and climate factors are shown in Figure 3.
The adjusted RR of PM2.5 was 1.102 (95% confidence interval (C.I.): 1.037–1.172, p = 0.002) for the highest quarter PM2.5 (mean: 20.2 µg/m3) compared with the lowest quarter PM2.5 (mean: 12.53 µg/m3) in pediatric asthma ERVs. The adjusted RR of ambient temperature was 0.813 (95% C.I.: 0.745–0.887, p < 0.001) for the highest quarter ambient temperature with a mean of 29.42 °C compared with the lowest quarter ambient temperature with a mean of 17.72 °C. The adjusted RR of ozone was 0.981 (95% C.I.: 0.972–0.99, p < 0.001) every 1 ppb increase. The adjusted RR of relative humidity was 0.977 (95% C.I.: 0.99–1.003, p = 0.288) every 1% increase (Table 3). In addition, the adjusted RR of NMCHs was 1.013 (95% C.I.: 1.007–1.019, p < 0.001) for every 10 ppb increase after adjusting the ozone, relative humidity and air temperature.
The RR of O3 was 1.108 (95% C.I.: 1.019–1.205, p = 0.016) and air temperature was 0.726 (95% C.I.: 0.56–0.943, p = 0.016) during the first quarter. The RR of PM2.5 was 1.188 (95% C.I.: 1.114–1.268, p < 0.001), O3 was 1.053 (95% C.I.: 1.012–1.096, p = 0.011) and relative humidity was 1.04 (95% C.I.: 1.018–1.062, p < 0.001) during second quarter. The RR of O3 was 1.157 (95% C.I.: 1.008–1.329, p = 0.038) during the third quarter. The RR of relative humidity was 1.107 (95% C.I.: 1.056–1.16, p < 0.001) during fourth quarter (Table 4).

4. Discussion

Higher fine particle levels and lower ambient temperatures were associated with greater incidences of pediatric asthma exacerbations, leading to ERVs during the study period. The lower ozone carried a protective effect in pediatric asthma exacerbation. A sustained decline in pediatric asthma ERVs was observed over the study duration. The level of fine particles did not reach the recommended level of less than 5 µg/m3 set by the World Health Organization (WHO) [20]. The government should enhance public awareness about the risk effects of air pollution and cold weather on childhood health.
Air pollution reduction policies have been implemented in recent decades, but more efforts have been made to decrease acute childhood asthma attacks [21]. 17.9 percent of ERVs are related to pediatric asthma in the USA [3]. The percentage of pediatric asthma ERVs in Taiwan was lower than that in the USA, decreasing from 10.19% to 6.81% during the study period, with a decreasing trend over time and an RR of 0.98. The potential reason is the availability of qualified asthma care in many clinics and hospitals in Taiwan. The healthcare improvement plan for patients with asthma was implemented by the National Health Insurance Administration several years ago, which has led to a decrease in the incidence of pediatric asthma ERVs in Taiwan [22]. The percentage of patients with mean pediatric asthma ERVs decreased by 28.5% compared with the mean PM2.5 decrease of 19.5% from 2015 to 2019. This means that advanced asthma care seems to provide re-education on the prevention of childhood asthma ERVs, reducing their incidence.
PM2.5, ozone and NO2 cause asthma exacerbations [23]. PM contains inorganic components (carbon, chlorides, nitrates, sulfates, and metals), resulting in potential oxidative stress. The daily number of asthma-related ERVs is related to elemental carbon levels in the summer and winter in adolescents [24]. Local inflammation and persistent free radicals can persist in the ambient environment for 3 weeks [25]. A study revealed that 15% of asthma exacerbations in Europe involved children living close to air pollution sources [26]. PM and NO2 are abundant in heavy traffic in urban environments, and PM and NOx are related to pediatric asthma hospitalization [27]. PM2.5 can reach the deeper region of the alveoli. PM2.5 induced an increase in the levels of kallikreins and the secretion of mucus through barrier activities by epithelial cells [28]. There were primarily transition metals and secondary polar organic compounds with higher free radical stress activity [29]. A previous longitudinal study showed that higher PM2.5 concentrations and severe pollen were associated with poorer asthma control [30]. Daily PM2.5 exposure was associated with reduced peak expiratory flow and increased symptoms of breathing difficulty [31]. A 10 μg/m3 increase in the daily concentration of PM2.5 was associated with an increase in pediatric emergency ERVs for asthma or wheezing, with an OR of 1.013, and upper respiratory infections, with an OR of 1.015 [32]. In addition, higher PM2.5 exposure carries the risk of respiratory virus infections in Italy [33] and China [34]. Rhinoviruses are possibly the predominant viruses involved in pediatric asthma exacerbation in Taiwan [35]. These respiratory viruses in black and Latinx children with asthma contributed to the prevalence of pediatric asthma ERVs before the COVID-19 pandemic [36]. Rhinoviruses cause almost eighty-five percent of pediatric asthma exacerbations; they attenuate smooth muscle relaxation in the airway [37]. PM2.5 and SO2 increased in the cold season on lag day 1 (4.9% and 8.57%, respectively) [38]. Higher quartile PM2.5 values of TRAPs has been associated with pediatric asthma ERVs [14]. A large amount of traffic was noted in the Taipei metropolis, and PM2.5 was difficult to remove from the basin terrain by wind, which resulted in cumulative toxic exposure for several days. Our study found that 10.2% of pediatric asthma ERVs occurred alongside a 7.7 µg/m3 PM2.5 increase. A spike in the concentration of PM2.5 was noted in a past study in Taoyuan due to the burning of Joss paper in April [9]. Our study revealed similar findings with the burning of Joss paper during the Qingming Festival in April, which resulted in a higher PM2.5 concentration in the second quarter every year from 2016 to 2019. In addition, higher PM2.5 concentrations are associated with seasonal winds, which carry air pollutants from mainland China in colder weather every year.
The mortality and morbidity of asthma and chronic obstructive pulmonary disease are associated with the ambient environment in metropolitan areas in Taiwan [39]. The lower air temperature mediated with higher PM2.5 increased the severity of chronic obstructive pulmonary disease in cold weather [16]. A study revealed that short-term cold weather exposure (25% lower in a quarter) related to asthma ERVs at all ages was lower than that related to the mean ambient temperature, with an RR of 1.21 and a 1-day lag [9]. The minimum air temperature in the cold season causes 2.26% of asthma cases and stronger hazard effects for PM2.5 and SO2 in the cold season with a 1-day lag [38]. A study revealed that higher relative humidity and cold air temperature induced exacerbations of pediatric asthmatic children in Iraq [40]. The cumulative risk of acute URIs increased at an ambient average temperature of 15 °C compared with 33 °C [41]. Our study showed similar findings: every decrease of 1 °C increased the incidence of childhood asthma ERVs by 0.9% after adjustments for other factors. Families and patients must be aware of colder weather to prevent asthma exacerbation during childhood, as this risk increases with decreasing temperature. There were higher air temperatures in the third quarter of every year, causing lower pediatric asthma ERVs. Climate change was related to carbon dioxide, nitrogen oxides (NOx) and black carbon [42]. Consequent climate change caused by uncontrolled carbon emissions has been shown to increase the risk of emerging infectious diseases [43]. Global warming has influenced the life cycles of plants, resulting in longer pollen seasons and greater pollen production, causing children to be affected by asthma and allergic rhinitis [44]. Pediatric asthma ERVs are related to PM2.5-bound polycyclic aromatic hydrocarbons, with an RR of 1.6 at a one-day lag in Taipei [10]. NMCHs are associated with a 1.3% risk of pediatric asthma ERVs for every 10 ppb increase.
O3 induces nonallergic responses [28,45]. This was related to a reduced FEV1 with a one-day lag [31]. O3 increased inflammation with nonviral asthma exacerbations in urban areas of the USA [28]. O3 was measured only in the summer with photochemical reactions, and the risk increased by 2% with a 1-day lag in warm weather in New York [38]. Asthma exacerbations are related to O3 within 8 h of exposure rather than to daily O3 [46,47]. O3-8 h showed an OR of 1.0503, 95% CI: 1.0277–1.0733 (O3 ≥ 100 μg/m3) [13]. In addition, ozone is related to good asthma control [22]. O3 was negatively related to hospital visits for asthma at concentrations less than 30 ppb in a previous study [48]. Some studies have shown that lower ozone concentrations with low concentrations of ROS are beneficial to cells and have a protective effect against asthma exacerbation [49]. The maximum O3 concentration was 33 ppb in Taipei during the study period. Our study showed similar findings with low mean ozone concentrations and fewer pediatric asthma ERVs.
NO2 inhaled into alveoli dissolves and produces reactive oxygen species (ROS) and nitrogen substances, inducing oxidative stress and respiratory tract damage [4]. Oxidative stress increased by the generation of ROS and reactive nitrogen species induces chronic inflammation [50]. NO2 levels are strongly associated with an increased risk of asthma exacerbation [51]. The daily increase in 10-unit NO2 was 7.8% during the warm season in New York [38]. NO2 was RR 1.25 at lag 6 days increased pediatric asthma hospitalization Beijing [52]. The NO2 cumulative RR of pediatric asthma hospitalization was 1.58 for lag 0–3 days in northern China [53]. Long-term exposure to NO2 increases acute upper respiratory tract infections (URIs) [41]. Short-term NO2 exposure is not related to pediatric asthma ERVs in Taoyuan. Although there was a 17.5% decrease in the NO2 concentration from 2015 to 2019, our study did not examine this due to the greater correlation with PM2.5.
Higher relative humidity has been associated with pediatric asthma in Iraq [40]. Elevated relative humidity was initially correlated with pediatric asthma ERVs before adjusting for other factors, but the association became nonsignificant after adjusting for other factors. The higher relative humidity difference mediated with lower PM2.5 decreased the severity of chronic obstructive pulmonary disease in warm weather [16]. This observation is attributed to the consistently high mean outside relative humidity exceeding 70% in Taipei compared with 48.03% in Iraq [40], which promoted the growth of dust mites. While families may utilize dehumidifiers to reduce indoor humidity, schools generally lack such equipment. Given that higher relative humidity can stimulate pollen growth and exacerbate childhood asthma [54], we adjusted for relative humidity and found no significant association with pediatric asthma ERVs in the Taipei area. This underscores the complex interplay of environmental factors influencing pediatric asthma outcomes.
Lower air temperature was associated with pediatric asthma ERVs in the first quarter; the potential reasons were bronchial contraction and PM2.5 mediation. Higher ozone was associated with pediatric asthma ERVs in the third quarter; the potential reasons were more photochemical action on warm days. Higher relative humidity was associated with pediatric asthma ERVs in the second and fourth quarters; the potential reasons were rainy seasons causing higher relative humidity.
This study revealed a positive effect of PM2.5 and cold weather on pediatric asthma ERVs. The air pollution and climate factors related to pediatric asthma outcomes of this study and other studies are shown in Table 5. Despite government efforts to reduce the use of these agents, some asthma-afflicted children experience acute exacerbations requiring urgent emergency care. PM2.5 decreased annually (Figure 2). The outlined Sustainable Development Goals encompass objectives such as advancing health and well-being, implementing climate protection measures, and ensuring access to affordable and clean energy [55].

5. Limitation

This study has several limitations that warrant consideration. Firstly, the economic status and smoking status of families may introduce confounding variables in the context of childhood asthma. At higher stress exposures, the effects of air pollution are less apparent, indicating potential socioenvironmental interactions [38]. Additionally, the study did not assess indoor air pollutants, which are also related to respiratory health. The incidence of bronchial asthma among younger school-age children is related to indoor air quality in primary schools [57]. High levels of tree pollen were found to be an important risk factor in asthma exacerbations [56]. Furthermore, the heightened risk associated with allergic diseases, exacerbated by both allergens and air pollution, was not explicitly addressed in this investigation. These limitations underscore the need for further research to comprehensively explore the multifaceted factors influencing childhood asthma [58]. Thus, confounding factors need to be studied in the future. Secondly, a notable limitation in our study arises from the government’s collected open data, which were recorded on a quarterly rather than monthly basis. This frequency of data collection may hinder a more detailed examination of the monthly fluctuations in pediatric asthma ERVs and their potential correlation with changes in air pollutants. Each quarter covered 3 months rather than a season. Other studies have adopted a daily mean approach, capturing short-term effects more comprehensively [9,10]. Future research may benefit from more frequent and granular data collection to enhance the temporal resolution of the analysis and provide a more nuanced understanding of the relationship between pediatric asthma ERVs and air pollutant changes. Third, this study was conducted among Chinese participants; the potential variations in other ethnic groups remain unexplored. This study could provide evidence for future studies of other ethnicities. Fourth, our survey focused on the detrimental impacts of air pollutants and ambient temperature on pediatric asthma ERVs, especially in Taipei. Given that regions with greater industrial activity may exhibit distinct effects, further investigations are warranted to examine these potential variations and contribute to a more comprehensive understanding of the nuanced influences of environmental factors on pediatric asthma across different geographic contexts.

6. Conclusions

Our study revealed the harmful effect of quarterly PM2.5 and cold weather in pediatric asthma ERVs. The pediatric asthma ERVs declined year by year by the government committing to reducing air pollutants and asthma care; however, targeted initiatives to curtail PM2.5 levels are still needed to reach the recommended level outlined by the WHO [20]. The NMCHs were found to be part of PM2.5 and related to the pediatric respiratory events, which must be reduced. Citizens need to take more public transportation, ride bicycles and walk frequently to reduce TRAP emissions; wearing masks for outside activities and using air purifiers would also reduce PM2.5 exposure. Extreme climate conditions are projected to increase the prevalence of pediatric asthma ERVs by 1.9%, coinciding with an 11.7 °C decrease in air temperature. In cold weather, ensuring that children stay warm is crucial for preventing hazards. Lower ozone is associated with fewer pediatric respiratory events; this trend should be continued using aggressive policies. Climate change is intensifying globally and influences human health [59]. Although CO2 and CH4 were not surveyed for air quality in our study, reductions in CO2 and CH4 would reduce global warming [60]. Strategies to mitigate climate change often center on clean carbon footprint reduction technologies in England, such as electric vehicles and solar panels [61].
City authorities need to enact policies aimed at reducing emissions, monitor the levels of air pollutants, and provide timely warning to at-risk populations. It is valuable for vulnerable asthmatics and sensitive children to receive sufficient warning to avoid certain air pollutants. Through government–citizen collaboration to increase the use of clean energy, thus reducing air pollutant levels and the greenhouse effect, we can contribute to health improvement.

Author Contributions

Conceptualization, C.-G.C. and C.-A.C.; data curation, Y.-H.C.; formal analysis, Y.-H.C.; funding acquisition, C.-C.H.; investigation, C.-C.H. and Z.-T.H.; methodology, Y.-H.C. and C.-A.C.; project administration, C.-C.H.; resources, Z.-T.H.; software, C.-A.C.; supervision, Y.-H.C. and C.-A.C.; visualization, C.-G.C.; writing—original draft, C.-C.H., C.-G.C. and Z.-T.H.; writing—review and editing, Y.-H.C. and C.-A.C. All authors have read and agreed to the published version of the manuscript.

Funding

This research received no external funding.

Institutional Review Board Statement

This study was conducted according to the guidelines of the Declaration of Helsinki and approved by the Institutional Review Board of Tri-Service General Hospital (protocol code C202405021, 17 February 2024).

Informed Consent Statement

Patient consent was waived due to the utilization of open government data.

Data Availability Statement

The datasets used in the current study are available from the corresponding authors.

Acknowledgments

The authors are thankful for the support by grant from the Taoyuan Armed Forces General Hospital TYAFGH-E-113048, TYAFGH-E-113049, and from the Cheng Hsin General Hospital CHGH113-N15 for this study.

Conflicts of Interest

The authors declare no conflicts of interest.

References

  1. Castillo, J.R.; Peters, S.P.; Busse, W.W. Asthma Exacerbations: Pathogenesis, Prevention, and Treatment. J. Allergy Clin. Immunol. Pract. 2017, 5, 918–927. [Google Scholar] [CrossRef] [PubMed]
  2. GBD 2019 Chronic Respiratory Diseases Collaborators. Global burden of chronic respiratory diseases and risk factors, 1990–2019: An update from the Global Burden of Disease Study 2019. EClinicalMedicine 2023, 59, 101936. [Google Scholar] [CrossRef]
  3. Pate CA, Zahran HS, Qin X, Johnson C, Hummelman E, Malilay J. Asthma surveillance—United States, 2006–2018. MMWR Surveill. Summ. 2021, 70, 1–32. [CrossRef] [PubMed]
  4. Chatkin, J.; Correa, L.; Santos, U. External Environmental Pollution as a Risk Factor for Asthma. Clin. Rev. Allergy Immunol. 2022, 62, 72–89. [Google Scholar] [CrossRef] [PubMed]
  5. Šulc, L.; Gregor, P.; Kalina, J.; Mikeš, O.; Janoš, T.; Čupr, P. City-scale assessment of long-term air quality impacts on the respiratory and cardiovascular health. Front. Public Health 2022, 10, 1006536. [Google Scholar] [CrossRef] [PubMed]
  6. Cheng, C.Y.; Tseng, Y.L.; Huang, K.C.; Chiu, I.M.; Pan, H.Y.; Cheng, F.J. Association between Ambient Air Pollution and Emergency Room Visits for Pediatric Respiratory Diseases: The Impact of COVID-19 Pandemic. Toxics 2022, 10, 247. [Google Scholar] [CrossRef] [PubMed]
  7. Varghese, D.; Ferris, K.; Lee, B.; Grigg, J.; Pinnock, H.; Cunningham, S. Outdoor air pollution and near-fatal/fatal asthma attacks in children: A systematic review. Pediatr. Pulmonol. 2024. [Google Scholar] [CrossRef]
  8. Orellano, P.; Quaranta, N.; Reynoso, J.; Balbi, B.; Vasquez, J. Effect of outdoor air pollution on asthma exacerbations in children and adults: Systematic review and multilevel meta-analysis. PLoS ONE 2017, 12, e0174050. [Google Scholar] [CrossRef] [PubMed]
  9. Cheng, C.G.; Yen, S.Y.; Hsiao, C.C.; Lin, Y.Y.; Chang, Y.H.; Chen, Y.H.; Cheng, C.A. Short-Term Exposure Effect of Ambient Fine Particulate Matter, Ozone and Cold Temperature on Emergency Room Visits for Asthma Patients. Toxics 2023, 11, 94. [Google Scholar] [CrossRef]
  10. Hsu, S.-C.; Chang, J.-W.; Lee, C.-L.; Huang, W.-C.; Hsu, Y.-P.; Liu, C.-T.; Jean, S.-S.; Huang, S.-K.; Hsu, C.-W. Differential time-lag effects of ambient PM2.5 and PM2.5-PAHs on asthma emergency department visits. Environ. Sci. Pollut. Res. Int. 2020, 27, 43117–43124. [Google Scholar] [CrossRef]
  11. Chankaew, K.; Sinitkul, R.; Manuyakorn, W.; Roekworachai, K.; Kamalaporn, H. Spatial Estimation of PM2.5 Exposure and its Association with Asthma Exacerbation: A Prospective Study in Thai Children. Ann. Glob. Health 2022, 88, 15. [Google Scholar] [CrossRef] [PubMed]
  12. Liu, L.; Liu, C.; Chen, R.; Zhou, Y.; Meng, X.; Hong, J.; Cao, L.; Lu, Y.; Dong, X.; Xia, M.; et al. Associations of short-term exposure to air pollution and emergency department visits for pediatric asthma in Shanghai, China. Chemosphere 2021, 263, 127856. [Google Scholar] [CrossRef] [PubMed]
  13. Huang, W.; Wu, J.; Lin, X. Ozone Exposure and Asthma Attack in Children. Front. Pediatr. 2022, 10, 830897. [Google Scholar] [CrossRef] [PubMed]
  14. Khatri, S.B.; Newman, C.; Hammel, J.P.; Dey, T.; Van Laere, J.J.; Ross, K.A.; Rose, J.A.; Anderson, T.; Mukerjee, S.; Smith, L.; et al. Associations of Air Pollution and Pediatric Asthma in Cleveland, Ohio. Sci. World J. 2021, 2021, 8881390. [Google Scholar] [CrossRef] [PubMed]
  15. Kennedy, M.D.; Steele, A.R.; Parent, E.C.; Steinback, C.D. Cold air exercise screening for exercise induced bronchoconstriction in cold weather athletes. Respir. Physiol. Neurobiol. 2019, 269, 103262. [Google Scholar] [CrossRef] [PubMed]
  16. Tran, H.M.; Lin, Y.C.; Tsai, F.J.; Lee, K.Y.; Chang, J.H.; Chung, C.L.; Chung, K.F.; Chuang, K.J.; Chuang, H.C. Short-term mediating effects of PM2.5 on climate-associated COPD severity. Sci. Total Environ. 2023, 903, 166523. [Google Scholar] [CrossRef] [PubMed]
  17. Taiwanese National Health Insurance Admiration. Healthcare Quality. Available online: https://www.nhi.gov.tw/Content_List.aspx?n=9ABC74CDF4F839F6&topn=23C660CAACAA159D (accessed on 1 September 2023).
  18. Taiwan Ministry of Environment. Air Pollutants Monthly Report. 2024. Available online: https://airtw.moenv.gov.tw/CHT/Query/Month_Value.aspx (accessed on 15 December 2023).
  19. Taipei Weather Administration. Climate Monthly Report in Taipei. 2023. Available online: https://tsis.dbas.gov.taipei/statis/webMain.aspx?k=tpemain. (accessed on 15 December 2023).
  20. WHO. Air Pollution Guideline Values. 2022. Available online: https://apps.who.int/iris/bitstream/handle/10665/345329/9789240034228-eng.pdf (accessed on 1 September 2023).
  21. Dondi, A.; Carbone, C.; Manieri, E.; Zama, D.; Del Bono, C.; Betti, L.; Biagi, C.; Lanari, M. Outdoor Air Pollution and Childhood Respiratory Disease: The Role of Oxidative Stress. Int. J. Mol. Sci. 2023, 24, 4345. [Google Scholar] [CrossRef] [PubMed]
  22. Taiwanese National Health Insurance Admiration. Healthcare Improvement Plan in Asthma. Available online: https://www.nhi.gov.tw/Content_List.aspx?n=3D98B91375362414&topn=5FE8C9FEAE863B46 (accessed on 1 September 2023).
  23. Guarnieri, M.; Balmes, J.R. Outdoor air pollution and asthma. Lancet 2014, 383, 1581–1592. [Google Scholar] [CrossRef] [PubMed]
  24. Mohr, L.B.; Luo, S.; Mathias, E.; Tobing, R.; Homan, S.; Sterling, D. Influence of season and temperature on the relationship of elemental carbon air pollution to pediatric asthma emergency room visits. J. Asthma. 2008, 45, 936–943. [Google Scholar] [CrossRef]
  25. Sly, P.D.; Cormier, S.A.; Lomnicki, S.; Harding, J.N.; Grimwood, K. Environmentally Persistent Free Radicals: Linking Air Pollution and Poor Respiratory Health? Am. J. Respir. Crit. Care Med. 2019, 200, 1062–1063. [Google Scholar] [CrossRef]
  26. Perez, L.; Declercq, C.; Iñiguez, C.; Aguilera, I.; Badaloni, C.; Ballester, F.; Bouland, C.; Chanel, O.; Cirarda, F.B.; Forastiere, F.; et al. Chronic burden of near-roadway traffic pollution in 10 European cities (APHEKOM network). Eur. Respir. J. 2013, 42, 594–605. [Google Scholar] [CrossRef] [PubMed]
  27. Li, M.H.; Fan, L.C.; Mao, B.; Yang, J.W.; Choi, A.M.K.; Cao, W.J.; Xu, J.F. Short-term Exposure to Ambient Fine Particulate Matter Increases Hospitalizations and Mortality in COPD: A Systematic Review and Meta-analysis. Chest 2016, 149, 447–458. [Google Scholar] [CrossRef] [PubMed]
  28. Altman, M.C.; Kattan, M.; O’Connor, G.T.; Murphy, R.C.; Whalen, E.; LeBeau, P.; Calatroni, A.; Gill, M.A.; Gruchalla, R.S.; Liu, A.H.; et al. Associations between outdoor air pollutants and non-viral asthma exacerbations and airway inflammatory responses in children and adolescents living in urban areas in the USA: A retrospective secondary analysis. Lancet Planet Health 2023, 7, e33–e44. [Google Scholar] [CrossRef] [PubMed]
  29. Saffari, A.; Daher, N.; Shafer, M.M.; Schauer, J.J.; Sioutas, C. Global perspective on the oxidative potential of airborne particulate matter: A synthesis of research findings. Environ. Sci. Technol. 2014, 48, 7576–7583. [Google Scholar] [CrossRef]
  30. Li, Z.; Xu, X.; Thompson, L.A.; Gross, H.E.; Shenkman, E.A.; DeWalt, D.A.; Huang, I.C. Longitudinal Effect of Ambient Air Pollution and Pollen Exposure on Asthma Control: The Patient-Reported Outcomes Measurement Information System (PROMIS) Pediatric Asthma Study. Acad. Pediatr. 2019, 19, 615–623. [Google Scholar] [CrossRef] [PubMed]
  31. Hao, H.; Eckel, S.P.; Hosseini, A.; Van Vliet, E.D.S.; Dzubur, E.; Dunton, G.; Chang, S.Y.; Craig, K.; Rocchio, R.; Bastain, T.; et al. Daily Associations of Air Pollution and Pediatric Asthma Risk Using the Biomedical REAI-Time Health Evaluation (BREATHE) Kit. Int. J. Environ. Res. Public Health 2022, 19, 3578. [Google Scholar] [CrossRef] [PubMed]
  32. Strickland, M.J.; Hao, H.; Hu, X.; Chang, H.H.; Darrow, L.A.; Liu, Y. Pediatric Emergency Visits and Short-Term Changes in PM2.5 Concentrations in the U.S. State of Georgia. Environ. Health Perspect. 2016, 124, 690–696. [Google Scholar] [CrossRef] [PubMed]
  33. Nenna, R.; Evangelisti, M.; Frassanito, A.; Scagnolari, C.; Pierangeli, A.; Antonelli, G.; Nicolai, A.; Arima, S.; Moretti, C.; Papoff, P.; et al. Respiratory syncytial virus bronchiolitis, weather conditions and air pollution in an Italian urban area: An observational study. Environ. Res. 2017, 158, 188–193. [Google Scholar] [CrossRef] [PubMed]
  34. Su, W.; Wu, X.; Geng, X.; Zhao, X.; Liu, Q.; Liu, T. The short-term effects of air pollutants on influenza-like illness in Jinan, China. BMC Public Health 2019, 19, 1319. [Google Scholar] [CrossRef]
  35. Su, Y.T.; Lin, Y.T.; Yang, C.C.; Tsai, S.S.; Wang, J.Y.; Huang, Y.L.; Lin, T.I.; Lin, T.M.; Tsai, Y.C.; Yu, H.R.; et al. High correlation between human rhinovirus type C and children with asthma exacerbations in Taiwan. J. Microbiol. Immunol. Infect. 2020, 53, 561–568. [Google Scholar] [CrossRef]
  36. Bhavnani, D.; Wilkinson, M.; Zárate, R.A.; Balcer-Whaley, S.; Katz, D.S.W.; Rathouz, P.J.; Matsui, E.C. Do upper respiratory viruses contribute to racial and ethnic disparities in emergency department visits for asthma? J. Allergy Clin. Immunol. 2023, 151, 778–782.e1. [Google Scholar] [CrossRef]
  37. Gebski, E.B.; Parikh, V.; Lam, H.; Kim, N.; Bochkov, Y.A.; Cao, G.; Panettieri RAJr Kurten, R.; Gern, J.; An, S.S.; Koziol-White, C.J. Rhinovirus C15 Attenuates Relaxation and cAMP Production in Human Airways and Smooth Muscle. Am. J. Respir. Cell Mol. Biol. 2023, 69, 172–181. [Google Scholar] [CrossRef]
  38. Sharma, R.; Humphrey, J.L.; Frueh, L.; Kinnee, E.J.; Sheffield, P.E.; Clougherty, J.E. Neighborhood violence and socioeconomic deprivation influence associations between acute air pollution and temperature on childhood asthma in New York city. Environ. Res. 2023, 231 Pt 3, 116235. [Google Scholar] [CrossRef] [PubMed]
  39. Zafirah, Y.; Lin, Y.K.; Andhikaputra, G.; Deng, L.W.; Sung, F.C.; Wang, Y.C. Mortality and morbidity of asthma and chronic obstructive pulmonary disease associated with ambient environment in metropolitans in Taiwan. PLoS ONE 2021, 16, e0253814. [Google Scholar] [CrossRef] [PubMed]
  40. Kadhim Yousif, M.; Al Muhyi, A.A. Impact of weather conditions on childhood admission for wheezy chest and bronchial asthma. Med. J. Islam. Repub. Iran 2019, 33, 89. [Google Scholar] [CrossRef] [PubMed]
  41. Lin, Y.K.; Chang, C.K.; Chang, S.C.; Chen, P.S.; Lin, C.; Wang, Y.C. Temperature, nitrogen dioxide, circulating respiratory viruses and acute upper respiratory infections among children in Taipei, Taiwan: A population-based study. Environ. Res. 2013, 120, 109–118. [Google Scholar] [CrossRef] [PubMed]
  42. Ming, T.; de Richter, R.; Shen, S.; Caillol, S. Fighting global warming by greenhouse gas removal: Destroying atmospheric nitrous oxide thanks to synergies between two breakthrough technologies. Environ. Sci. Pollut. Res. Int. 2016, 23, 6119–6138. [Google Scholar] [CrossRef] [PubMed]
  43. Boguslavsky, D.V.; Sharova, N.P.; Sharov, K.S. Evolutionary Challenges to Humanity Caused by Uncontrolled Carbon Emissions: The Stockholm Paradigm. Int. J. Environ. Res. Public Health 2022, 19, 16920. [Google Scholar] [CrossRef] [PubMed]
  44. Di Cicco, M.E.; Ferrante, G.; Amato, D.; Capizzi, A.; De Pieri, C.; Ferraro, V.A.; Furno, M.; Tranchino, V.; La Grutta, S. Climate Change and Childhood Respiratory Health: A Call to Action for Paediatricians. Int. J. Environ. Res. Public Health 2020, 17, 5344. [Google Scholar] [CrossRef]
  45. Thurston, G.D.; Balmes, J.R.; Garcia, E.; Gilliland, F.D.; Rice, M.B.; Schikowski, T.; Van Winkle, L.S.; Annesi-Maesano, I.; Burchard, E.G.; Carlsten, C.; et al. Outdoor Air Pollution and New-Onset Airway Disease. An Official American Thoracic Society Workshop Report. Ann. Am. Thorac. Soc. 2020, 17, 387–398. [Google Scholar] [CrossRef]
  46. Zhao, Y.; Hu, J.; Tan, Z.; Liu, T.; Zeng, W.; Li, X.; Huang, C.; Wang, S.; Huang, Z.; Ma, W. Ambient carbon monoxide and increased risk of daily hospital outpatient visits for respiratory diseases in Dongguan, China. Sci. Total Environ. 2019, 668, 254–260. [Google Scholar] [CrossRef] [PubMed]
  47. Ciencewicki, J.; Jaspers, I. Air pollution and respiratory viral infection. Inhal. Toxicol. 2007, 19, 1135–1146. [Google Scholar] [CrossRef] [PubMed]
  48. Lee, S.; Lee, M. Low-to-moderate atmospheric ozone levels are negatively correlated with hospital visits by asthma patients. Medicine 2022, 101, e31737. [Google Scholar] [CrossRef] [PubMed]
  49. Sokolowska, M.; Quesniaux, V.F.J.; Akdis, C.A.; Chung, K.F.; Ryffel, B.; Togbe, D. Acute Respiratory Barrier Disruption by Ozone Exposure in Mice. Front. Immunol. 2019, 10, 2169. [Google Scholar] [CrossRef] [PubMed]
  50. McHugh, E.G.; Grady, S.T.; Collins, C.M.; Moy, M.L.; Hart, J.E.; Coull, B.A.; Schwartz, J.D.; Koutrakis, P.; Zhang, J.; Garshick, E. Pulmonary, inflammatory, and oxidative effects of indoor nitrogen dioxide in patients with COPD. Environ. Epidemiol. 2023, 7, e271. [Google Scholar] [CrossRef] [PubMed]
  51. Solanki, N.; Bruckman, D.; Wang, X.; Tang, A.; Attaway, A.; Khatri, S. Nitrogen dioxide, an EPA parameter, may forecast the incidence of asthma exacerbations across urban areas: An observational study. Pediatr. Pulmonol. 2023, 58, 262–270. [Google Scholar] [CrossRef]
  52. Zhao, Y.; Kong, D.; Fu, J.; Zhang, Y.; Chen, Y.; Liu, Y.; Chang, Z.; Liu, Y.; Liu, X.; Xu, K.; et al. Increased Risk of Hospital Admission for Asthma in Children From Short-Term Exposure to Air Pollution: Case-Crossover Evidence From Northern China. Front. Public Health 2021, 9, 798746. [Google Scholar] [CrossRef] [PubMed]
  53. Zhang, Y.; Ni, H.; Bai, L.; Cheng, Q.; Zhang, H.; Wang, S.; Xie, M.; Zhao, D.; Su, H. The short-term association between air pollution and childhood asthma hospital admissions in urban areas of Hefei City in China: A time-series study. Environ. Res. 2019, 169, 510–516. [Google Scholar] [CrossRef] [PubMed]
  54. Taylor, P.E.; Jacobson, K.W.; House, J.M.; Glovsky, M.M. Links between pollen, atopy and the asthma epidemic. Int. Arch. Allergy Immunol. 2007, 144, 162–170. [Google Scholar] [CrossRef]
  55. WHO. Sustainable Development Goals. Available online: https://www.who.int/data/gho/data/themes/sustainable-development-goals (accessed on 1 September 2023).
  56. Gleason, J.A.; Bielory, L.; Fagliano, J.A. Associations between ozone, PM2.5, and four pollen types on emergency department pediatric asthma events during the warm season in New Jersey: A case-crossover study. Environ. Res. 2014, 132, 421–429. [Google Scholar] [CrossRef]
  57. Juskiene, I.; Prokopciuk, N.; Franck, U.; Valiulis, A.; Valskys, V.; Mesceriakova, V.; Kvedariene, V.; Valiulyte, I.; Poluzioroviene, E.; Sauliene, I.; et al. Indoor air pollution effects on pediatric asthma are submicron aerosol particle-dependent. Eur. J. Pediatr. 2022, 181, 2469–2480. [Google Scholar] [CrossRef] [PubMed]
  58. Huang, H.C.; Zou, M.L.; Chen, Y.H.; Jiang, C.B.; Wu, C.D.; Lung, S.C.; Chien, L.C.; Lo, Y.C.; Chao, H.J. Effects of indoor air quality and home environmental characteristics on allergic diseases among preschool children in the Greater Taipei Area. Sci. Total Environ. 2023, 897, 165392. [Google Scholar] [CrossRef] [PubMed]
  59. Abdelzaher, H.; Tawfik, S.M.; Nour, A.; Abdelkader, S.; Elbalkiny, S.T.; Abdelkader, M.; Abbas, W.A.; Abdelnaser, A. Climate change, human health, and the exposome: Utilizing OMIC technologies to navigate an era of uncertainty. Front. Public Health 2022, 10, 973000. [Google Scholar] [CrossRef] [PubMed]
  60. Abernethy, S.; O’Connor, F.M.; Jones, C.D.; Jackson, R.B. Methane removal and the proportional reductions in surface temperature and ozone. Philos. Trans. A Math. Phys. Eng. Sci. 2021, 379, 20210104. [Google Scholar] [CrossRef] [PubMed]
  61. Cordero, E.C.; Centeno, D.; Todd, A.M. The role of climate change education on individual lifetime carbon emissions. PLoS ONE 2020, 15, e0206266. [Google Scholar] [CrossRef]
Figure 1. Flowchart of this study.
Life 14 00570 g001
Figure 2. Box plot showing the rate of pediatric asthma emergency room visits, air pollutants and climate factors. Dot means outlier and × means mean values.
Life 14 00570 g002
Figure 3. Air pollutants of (a) PM2.5 and (b) ozone; (c) climate factors of air temperature and the change in the number of pediatric asthma emergency room visits from 2015 to 2019.
Life 14 00570 g003aLife 14 00570 g003b
Table 2. The mean number of pediatric asthma emergency room visits, air pollutants and climate factors during different quarters.
Quarter1234p
Pediatric asthma ERVs631 ± 53.83618 ± 117.09463 ± 65.93725 ± 118.870.004 *
PM2.518.87 ± 2.4718.4 ± 1.6913.47 ± 1.9514.27 ± 1.590.001 *
PM1038.47 ± 3.5736.47 ± 3.2326.27 ± 3.1229.8 ± 4.77<0.001 *
NO222.14 ± 1.7820.49 ± 2.2715.57 ± 2.0418.04 ± 0.7<0.001 *
O327.75 ± 2.6628.74 ± 2.9823.59 ± 2.1127.57 ± 2.560.03 *
Ambient temperature17.72 ± 0.9326.22 ± 0.6129.42 ± 0.5922.34 ± 0.56<0.001 *
Relative humidity75.4 ± 2.8272.53 ± 4.0370.47 ± 4.2675.07 ± 2.190.119
* p < 0.05. ERVs: emergency room visits; PM2.5: fine particulate matter with an aerodynamic diameter ≤ 2.5 µm; PM10: particulate matter with an aerodynamic diameter ≤ 10 µm; NO2: nitrogen dioxide; O3: ozone.
Table 3. The relative ratios of air pollutants and climate factors.
Relative RatiopAdjusted Relative Ratiop
PM2.5 highest quarter1.162 (95% C.I.: 1.105–1.221)<0.001 *1.102 (95% C.I.: 1.037–1.172)0.002 *
PM2.5 middle quarter1.051 (95% C.I.: 1.005–1.1)0.03 *1.037 (95% C.I.: 0.982–1.095)0.191
PM2.5 lowest quarterreference reference
Ozone1.006 (1–1.012)0.049 *0.981 (95% C.I.: 0.972–0.99)<0.001 *
Air temperature highest quarter0.844 (95% C.I.: 0.8–0.89)<0.001 *0.813 (95% C.I.: 0.745–0.887)<0.001 *
Air temperature middle quarter1.064 (95% C.I.: 1.02–1.11)0.0041.1 (95% C.I.: 1.049–1.153)<0.001 *
Air temperature lowest quarterreference reference
Relative humidity1.011 (95% C.I.: 1.005–1.016)<0.001 *0.977 (95% C.I.: 0.99–1.003)0.288
* p < 0.05.
Table 4. The relative ratios of air pollutants and climate factors across different quarters.
First QuarterpSecond QuarterpThird QuarterpFourth Quarterp
PM2.50.98 (95% C.I.: 0.939–1.023)0.3561.188 (95% C.I.: 1.114–1.268)<0.001 *0.896 (95% C.I.: 0.727–1.103)0.30.893 (95% C.I.: 0.833–0.957)0.001 *
O31.108 (95% C.I.: 1.019–1.205)0.016 *1.053 (95% C.I.: 1.012–1.096)0.011 *1.157 (95% C.I.: 1.008–1.329)0.038 *0.941 (95% C.I.: 0.92–0.963)<0.001 *
AT0.726 (95% C.I.: 0.56–0.943)0.016 *0.952 (95% C.I.: 0.885–1.023)0.1811.03 (95% C.I.: 0.88–1.205)0.7140.937 (95% C.I.: 0.849–1.034)0.195
RH1 (95% C.I.: 0.974–1.027)0.9831.04 (95% C.I.: 1.018–1.062)<0.001 *0.96 (95% C.I.: 0.897–1.028)0.2411.107 (95% C.I.: 1.056–1.16)<0.001 *
* p < 0.05; AT: air temperature; RH: relative humidity.
Table 5. Air pollutants and climate factors related to pediatric asthma outcomes.
ReferenceFindingOutcomePlaceYear
Present studyPM2.5: RR of 1.102 (95% C.I.: 1.037–1.1722)
Air temperature: RR of 0.813 (95% CI: 0.745–0.887)
Pediatric asthma emergency room visitsTaipei, Taiwan2015–2019
[8]NO2: OR: 1.04 (95% C.I.: 1.001, 1.081)
SO2: OR 1.047 (95% C.I.: 1.009, 1.086)
PM2.5: OR 1.022 (95% C.I.: 1.000, 1.045)
Pediatric asthma exacerbations in high-income citiesMeta-analysis2000–2016
[9]10 units PM2.5: RR 1.195 (95% C.I.: 1.001–1.426) at a 2-day lagPediatric asthma emergency room visitsTaoyuan, Taiwan2016–2019
[10]10 units PM2.5: RR 1.310 (95% C.I.: 1.069–1.606)
10 units PM2.5-PAH: RR 1.576 (95% C.I.: 1.371–1.810) on 1-day lag
Pediatric asthma emergency room visitsTaipei, Taiwan2012–2015
[11]10 units PM2.5: 0.2 events increasingPediatric asthma exacerbationBangkok and Chiang Mai, Thailand2020–2021
[12]10 units PM2.5: RR 1.011 (95% C.I.: 1.002–1.021),
10 units NO2: 1.030 (95% C.I.: 1.017–1.043),
10 units SO2: 1.106 (95% C.I.: 1.041–1.174),
10 units O3: 1.009 (95% C.I.: 1.001, 1.017)
Pediatric asthma ERVsShanghai, China2016–2018
[13]10 units O3-8 h increased 6.33% in ≥100 μg/m3 O3-8 h
10 units O3-8 h increased 2.36% in 80–99 μg/m3 O3-8 h
PM2.5: OR: 1.0503 (95% C.I.: 1.0277–1.073) in ≥100 μg/m3 O3-8 h
Pediatric asthma attacksXiamen, China2016–2019
[14]Higher quartile TRAPs-PM2.5: RR 1.789 (1.517–2.109)
Higher quartile TRAPs-NO2:1.893 (1.589–2.256)
Pediatric asthma emergency room visitsCleveland, OH, USA2009–2010
[31]O3: rate ratio 1.52 (95% C.I.: 1.02–2.27)
NOx: rate ratio 1.61 (95% C.I.: 1.23–2.11)
NO: rate ratio 1.80 (95%C.I.: 1.37–2.35)
Rescue inhaler useLos Angeles, CA, USA2019
[38]Cold season
PM2.5: 4.90% (95% C.I.: 3.77–6.04) on 1-day lag
SO2: 8.57% (5.99–11.21) on 1-day lag
Warm season
NO2: 7.86% (95% C.I.: 6.66–9.07) on 1-day lag
O3: 4.75% (95% C.I.: 3.53–5.97) on 2 days lag
Minimum air temperature: 2.26% (95% C.I.: 1.25–3.28) in the cold season
Pediatric asthma emergency room visitsNew York, NY, USA2005–2011
[32]10 units PM2.5: OR 1.013 (95% C.I.: 1.003–1.023)Pediatric asthma or wheezeGA, USA2002–2010
[40]Relative humidity: correlation coefficients of 0.795
Rain days: 0.890
Wind speed: −0.763
Air temperature: −0.837
Pediatric asthma hospitalizationBasra, Iraq2014–2016
[51]NO2 correlation coefficient: 0.4619 in Buffalo; −0.543 in Detroit, 0.1924–0.3113 Phoenix, 0.2244 in TucsoPediatric asthma hospitalizationBuffalo, NY, Detroit, MI, Phoenix, AZ and Tucson, AZ, USA2009–2011
[52]NO2: RR 1.25 (95% C.I.: 1.06–1.48) at lag06
SO2: RR 1.17 (95% C.I.: 1.05–1.31) at lag05
Pediatric asthma hospitalization,Beijing, China2013–2016
[53]NO2: cumulative effects 1.580 (95% C.I.: 1.315–1.899, lag 0–3 daysPediatric asthma hospitalizationHefei, China2015–2016
[56]O3: rate ratio 1.05 (95% C.I.: 1.04–1.06)
PM2.5: rate ratio 1.03 (95% C.I.: 1.02–1.04)
The 5-day average values of tree and weed pollen: rate ratio 1.23 (95% C.I.: 1.21–1.25)
Pediatric asthma emergency room visitsNJ, USA2004–2007
RR: relative risk; OR: odds ratio; C.I.: confidence interval.
Disclaimer/Publisher’s Note: The statements, opinions and data contained in all publications are solely those of the individual author(s) and contributor(s) and not of MDPI and/or the editor(s). MDPI and/or the editor(s) disclaim responsibility for any injury to people or property resulting from any ideas, methods, instructions or products referred to in the content.

