
Infrared Spectroscopy of RNA Nucleosides in a Wide Range of Temperatures


Abstract
1. Introduction
2. Materials and Methods
2.1. Materials
2.2. Preparation of Laboratory Apparatus and Pellets for Measuring the Integrated Molar Absorptivity in the Mid- and Far-Infrared Regions
3. Results and Discussion
3.1. Mid-Infrared Emissions of Ado, Guo, Cyd, and Urd and Their Molar Extinction Coefficients and Integrated Molar Absorptivity
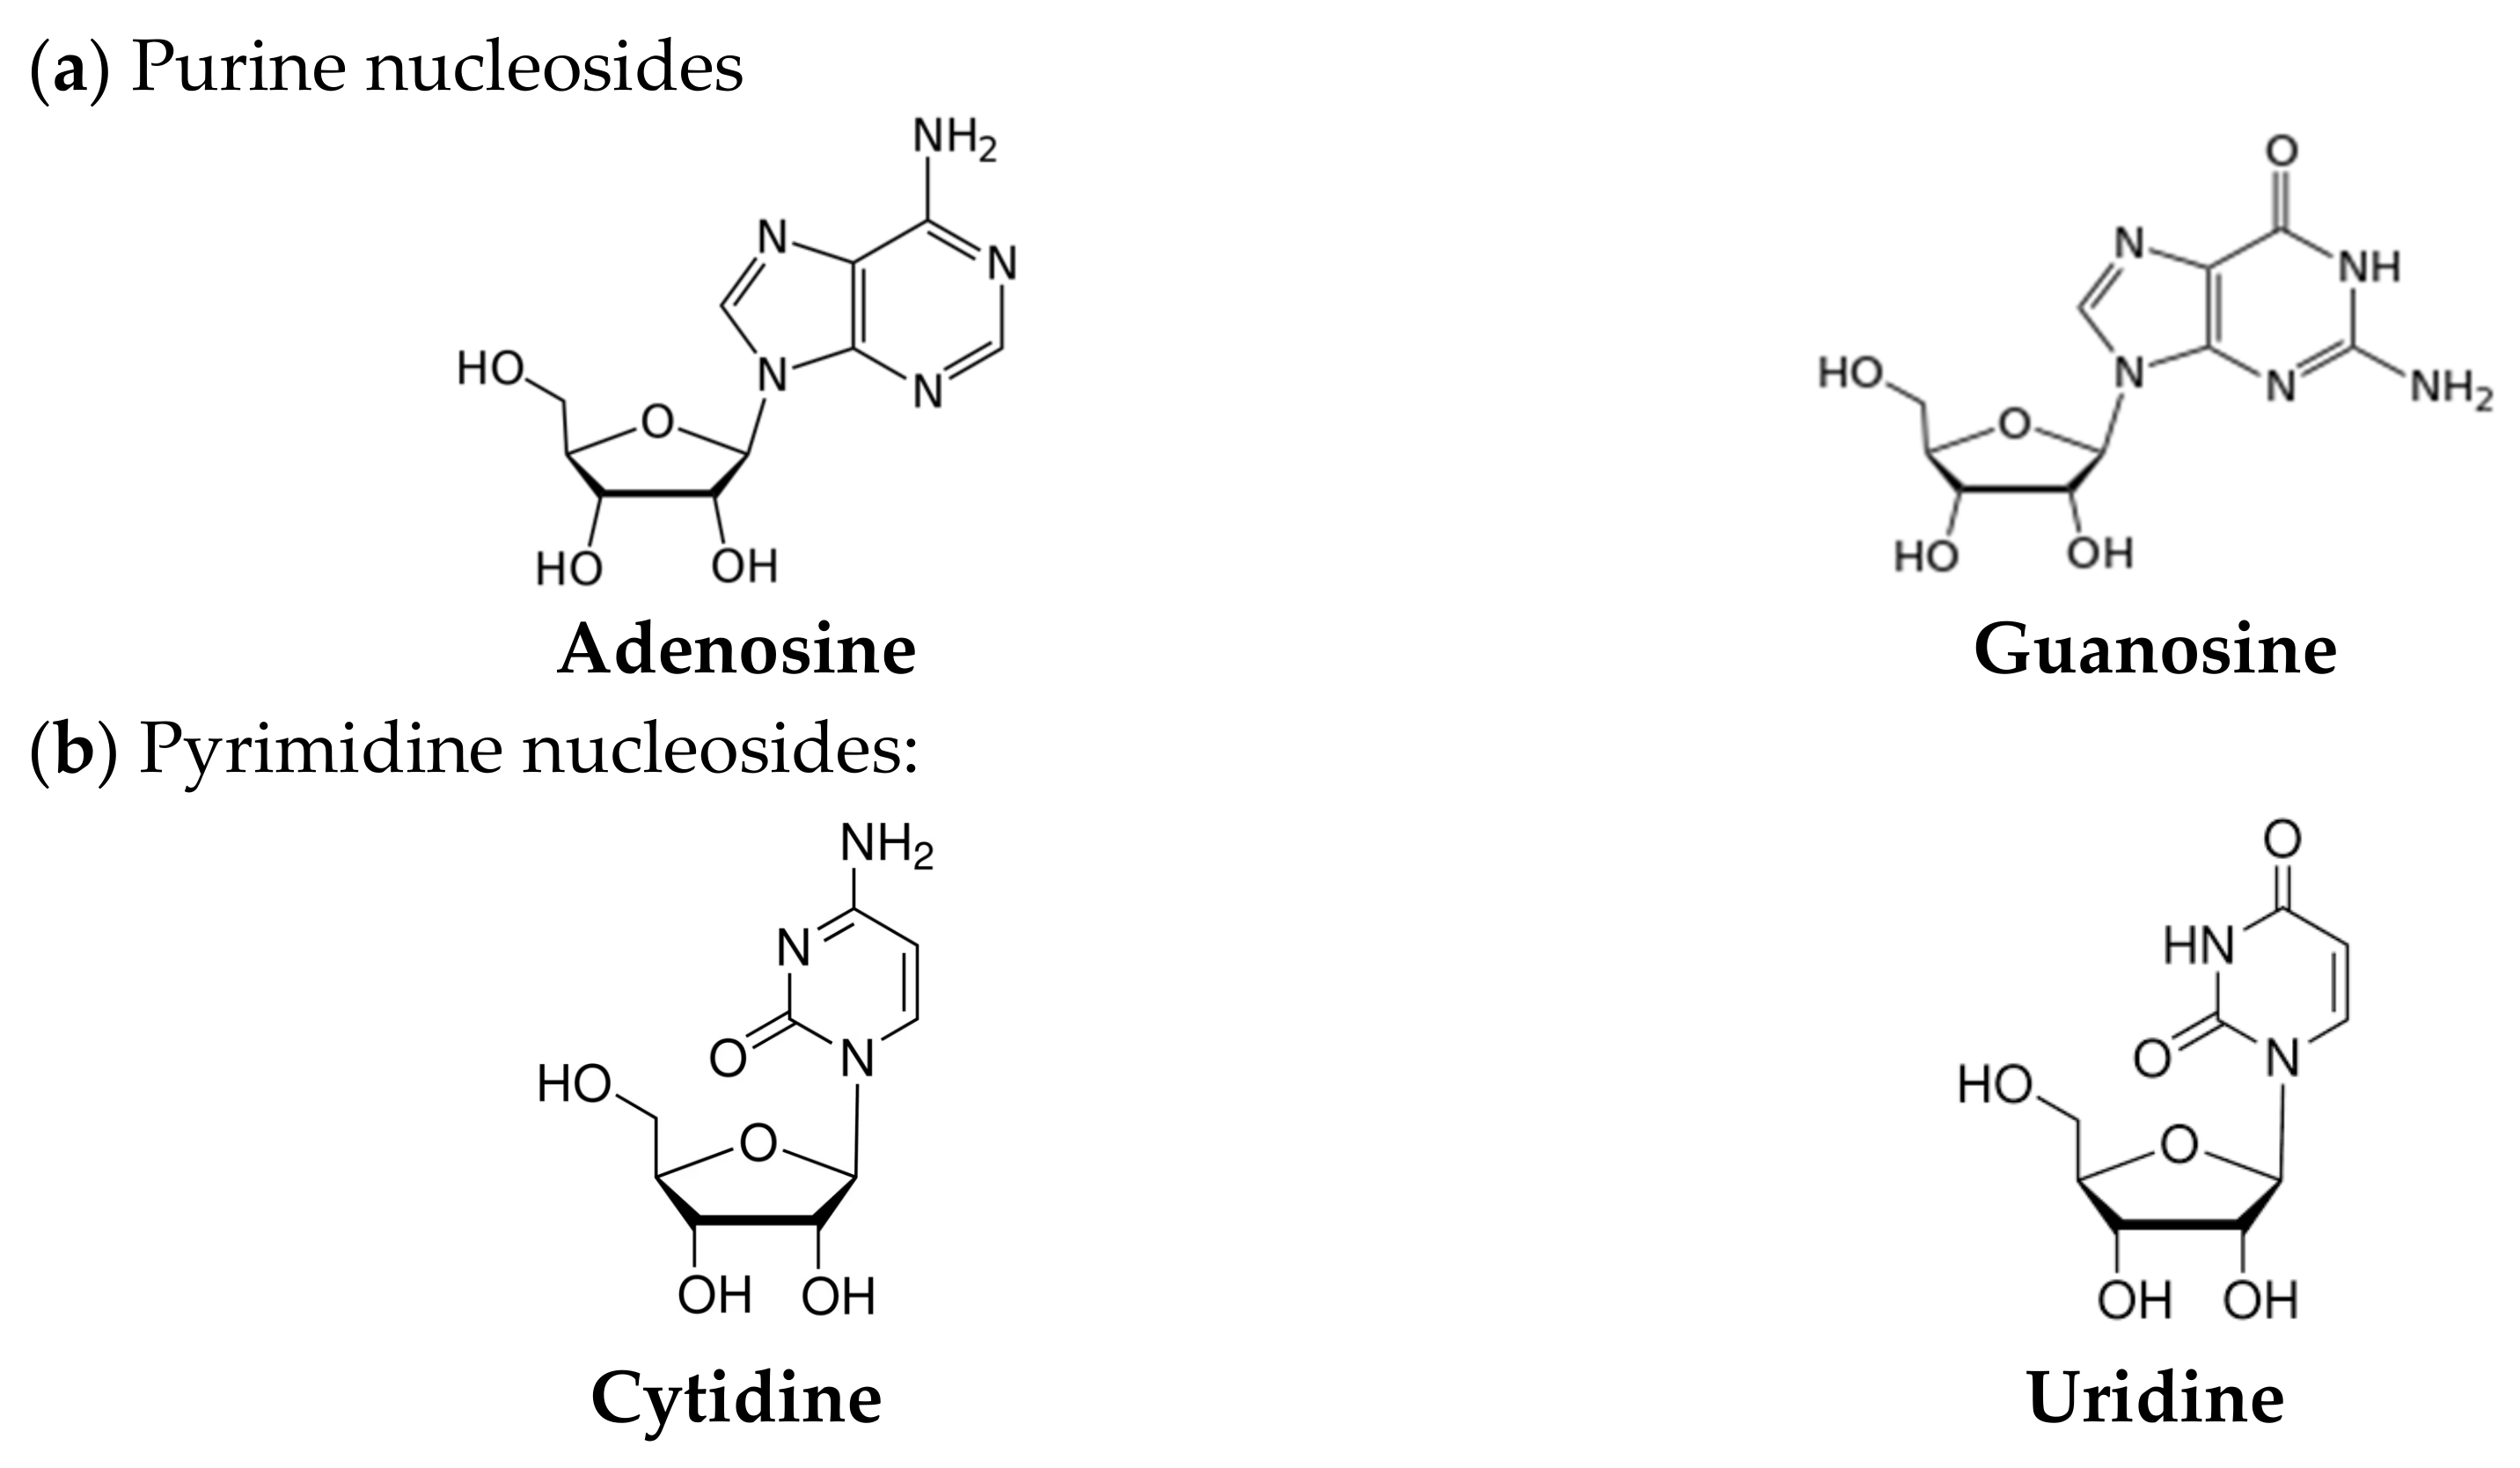
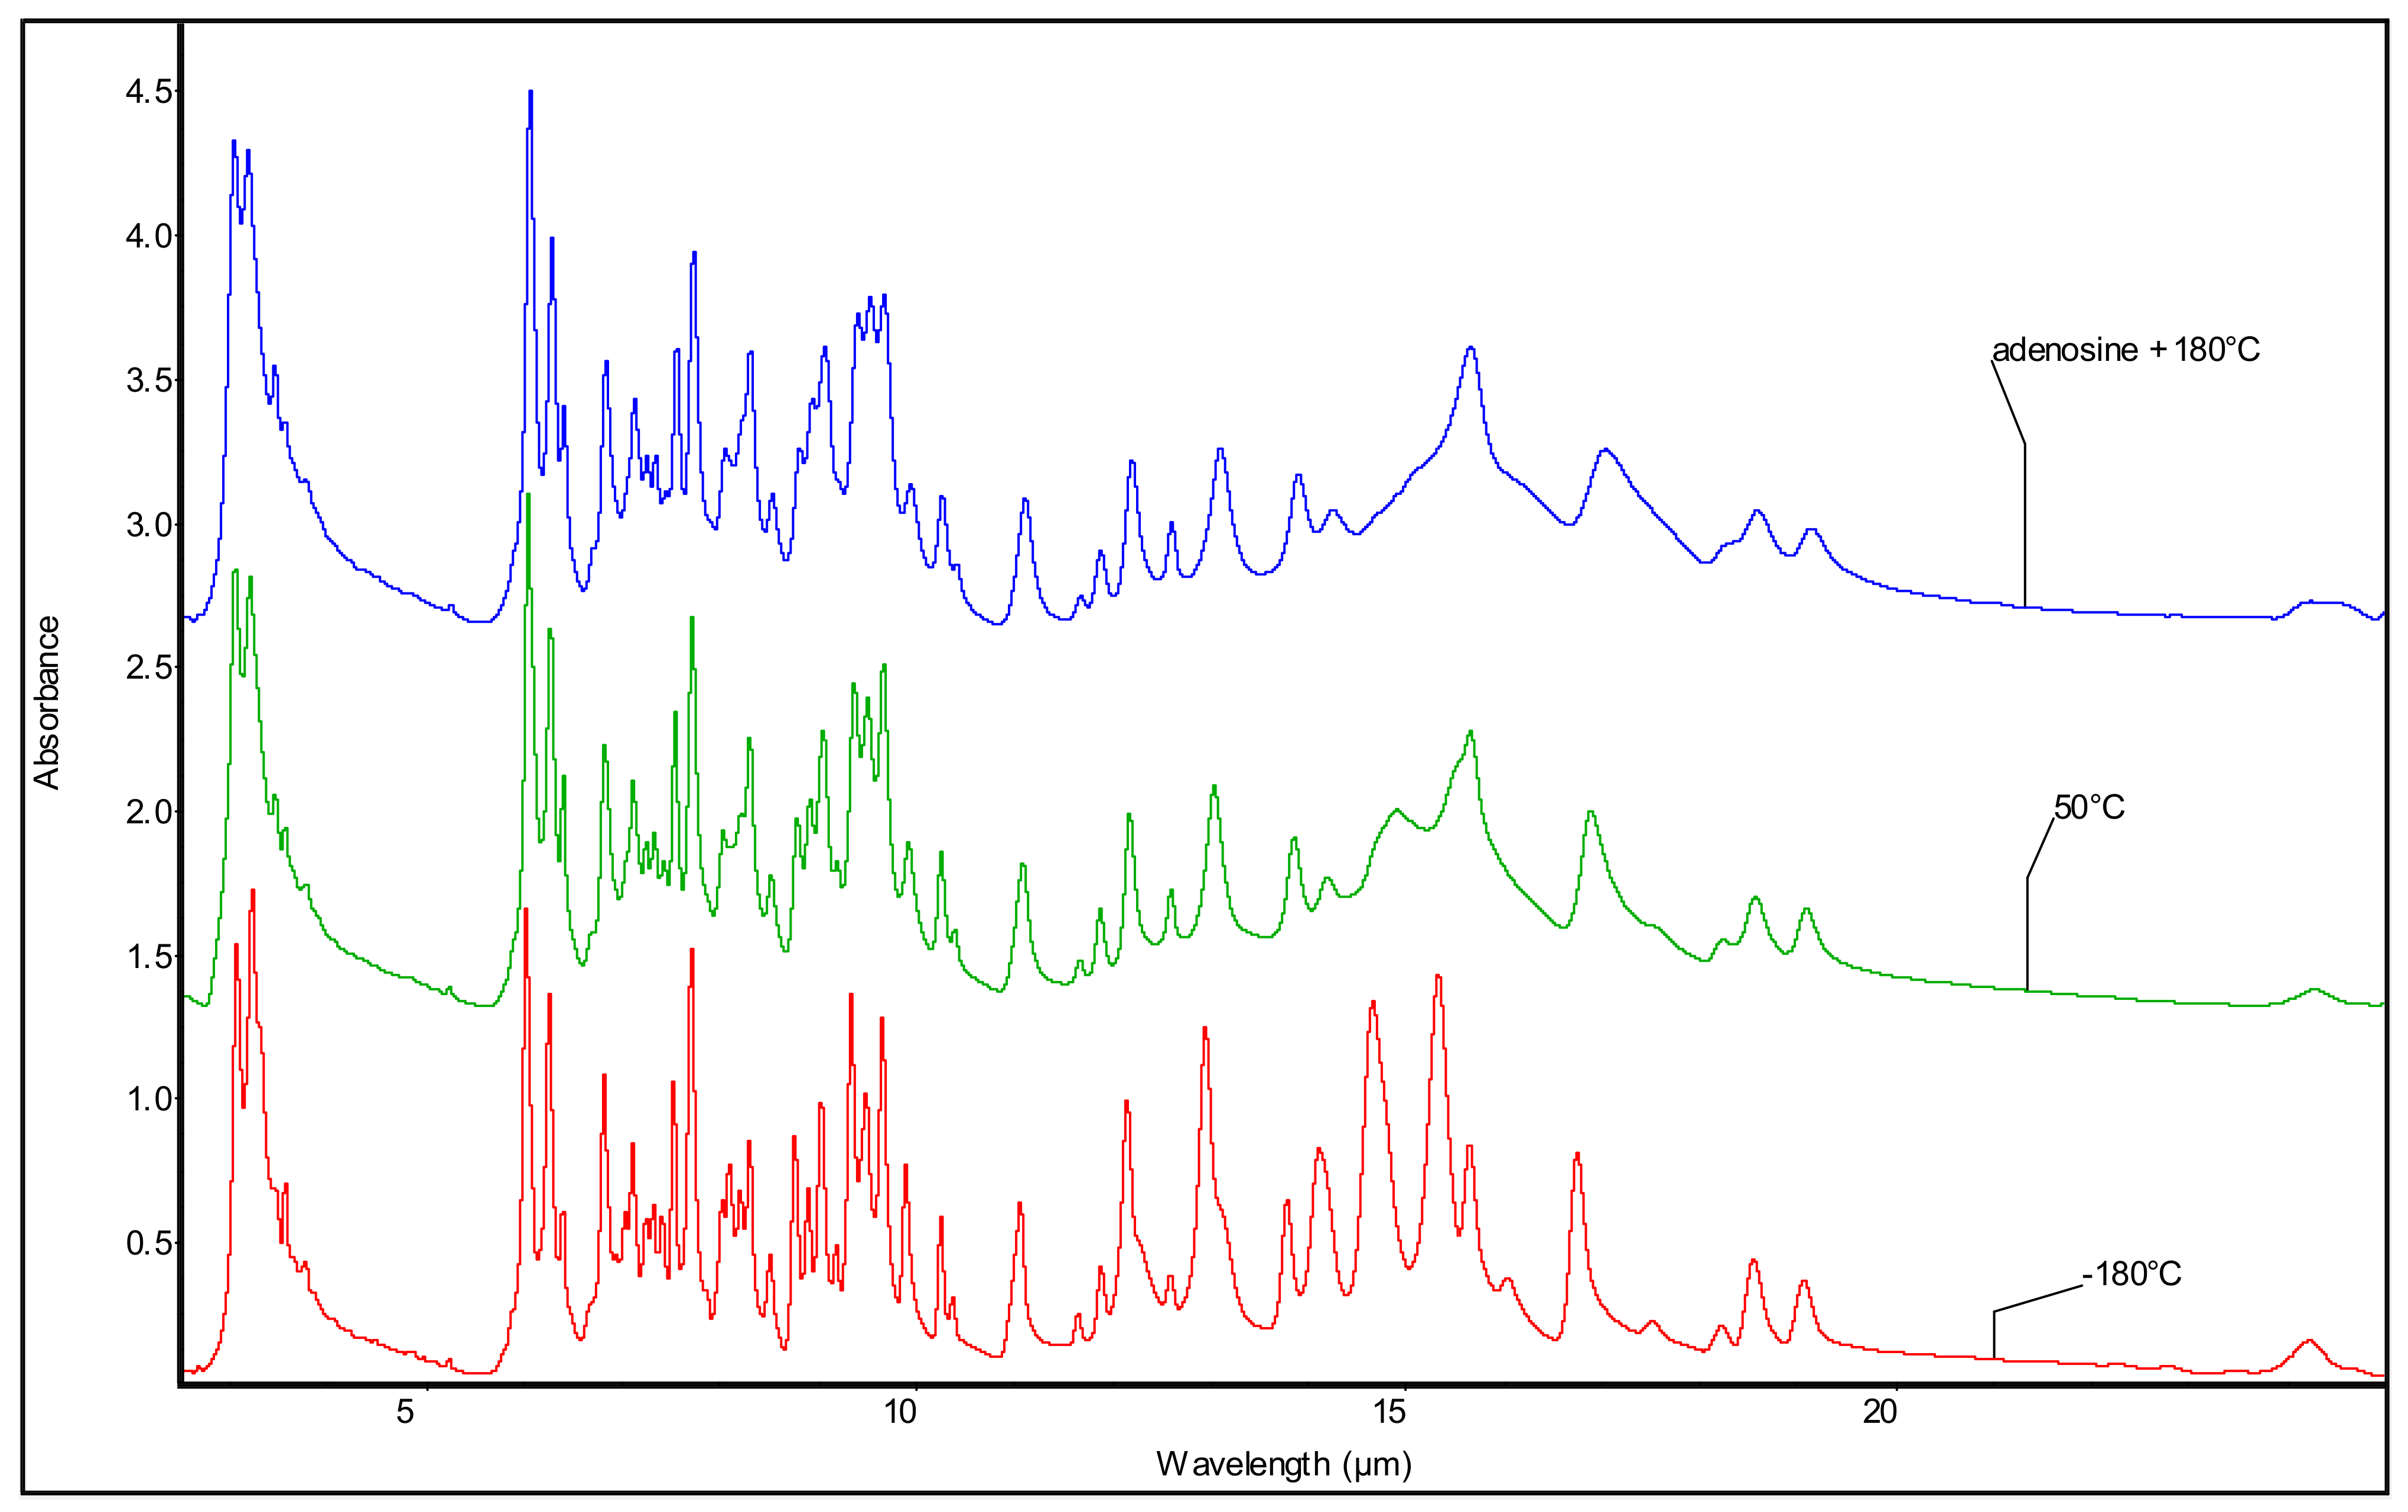
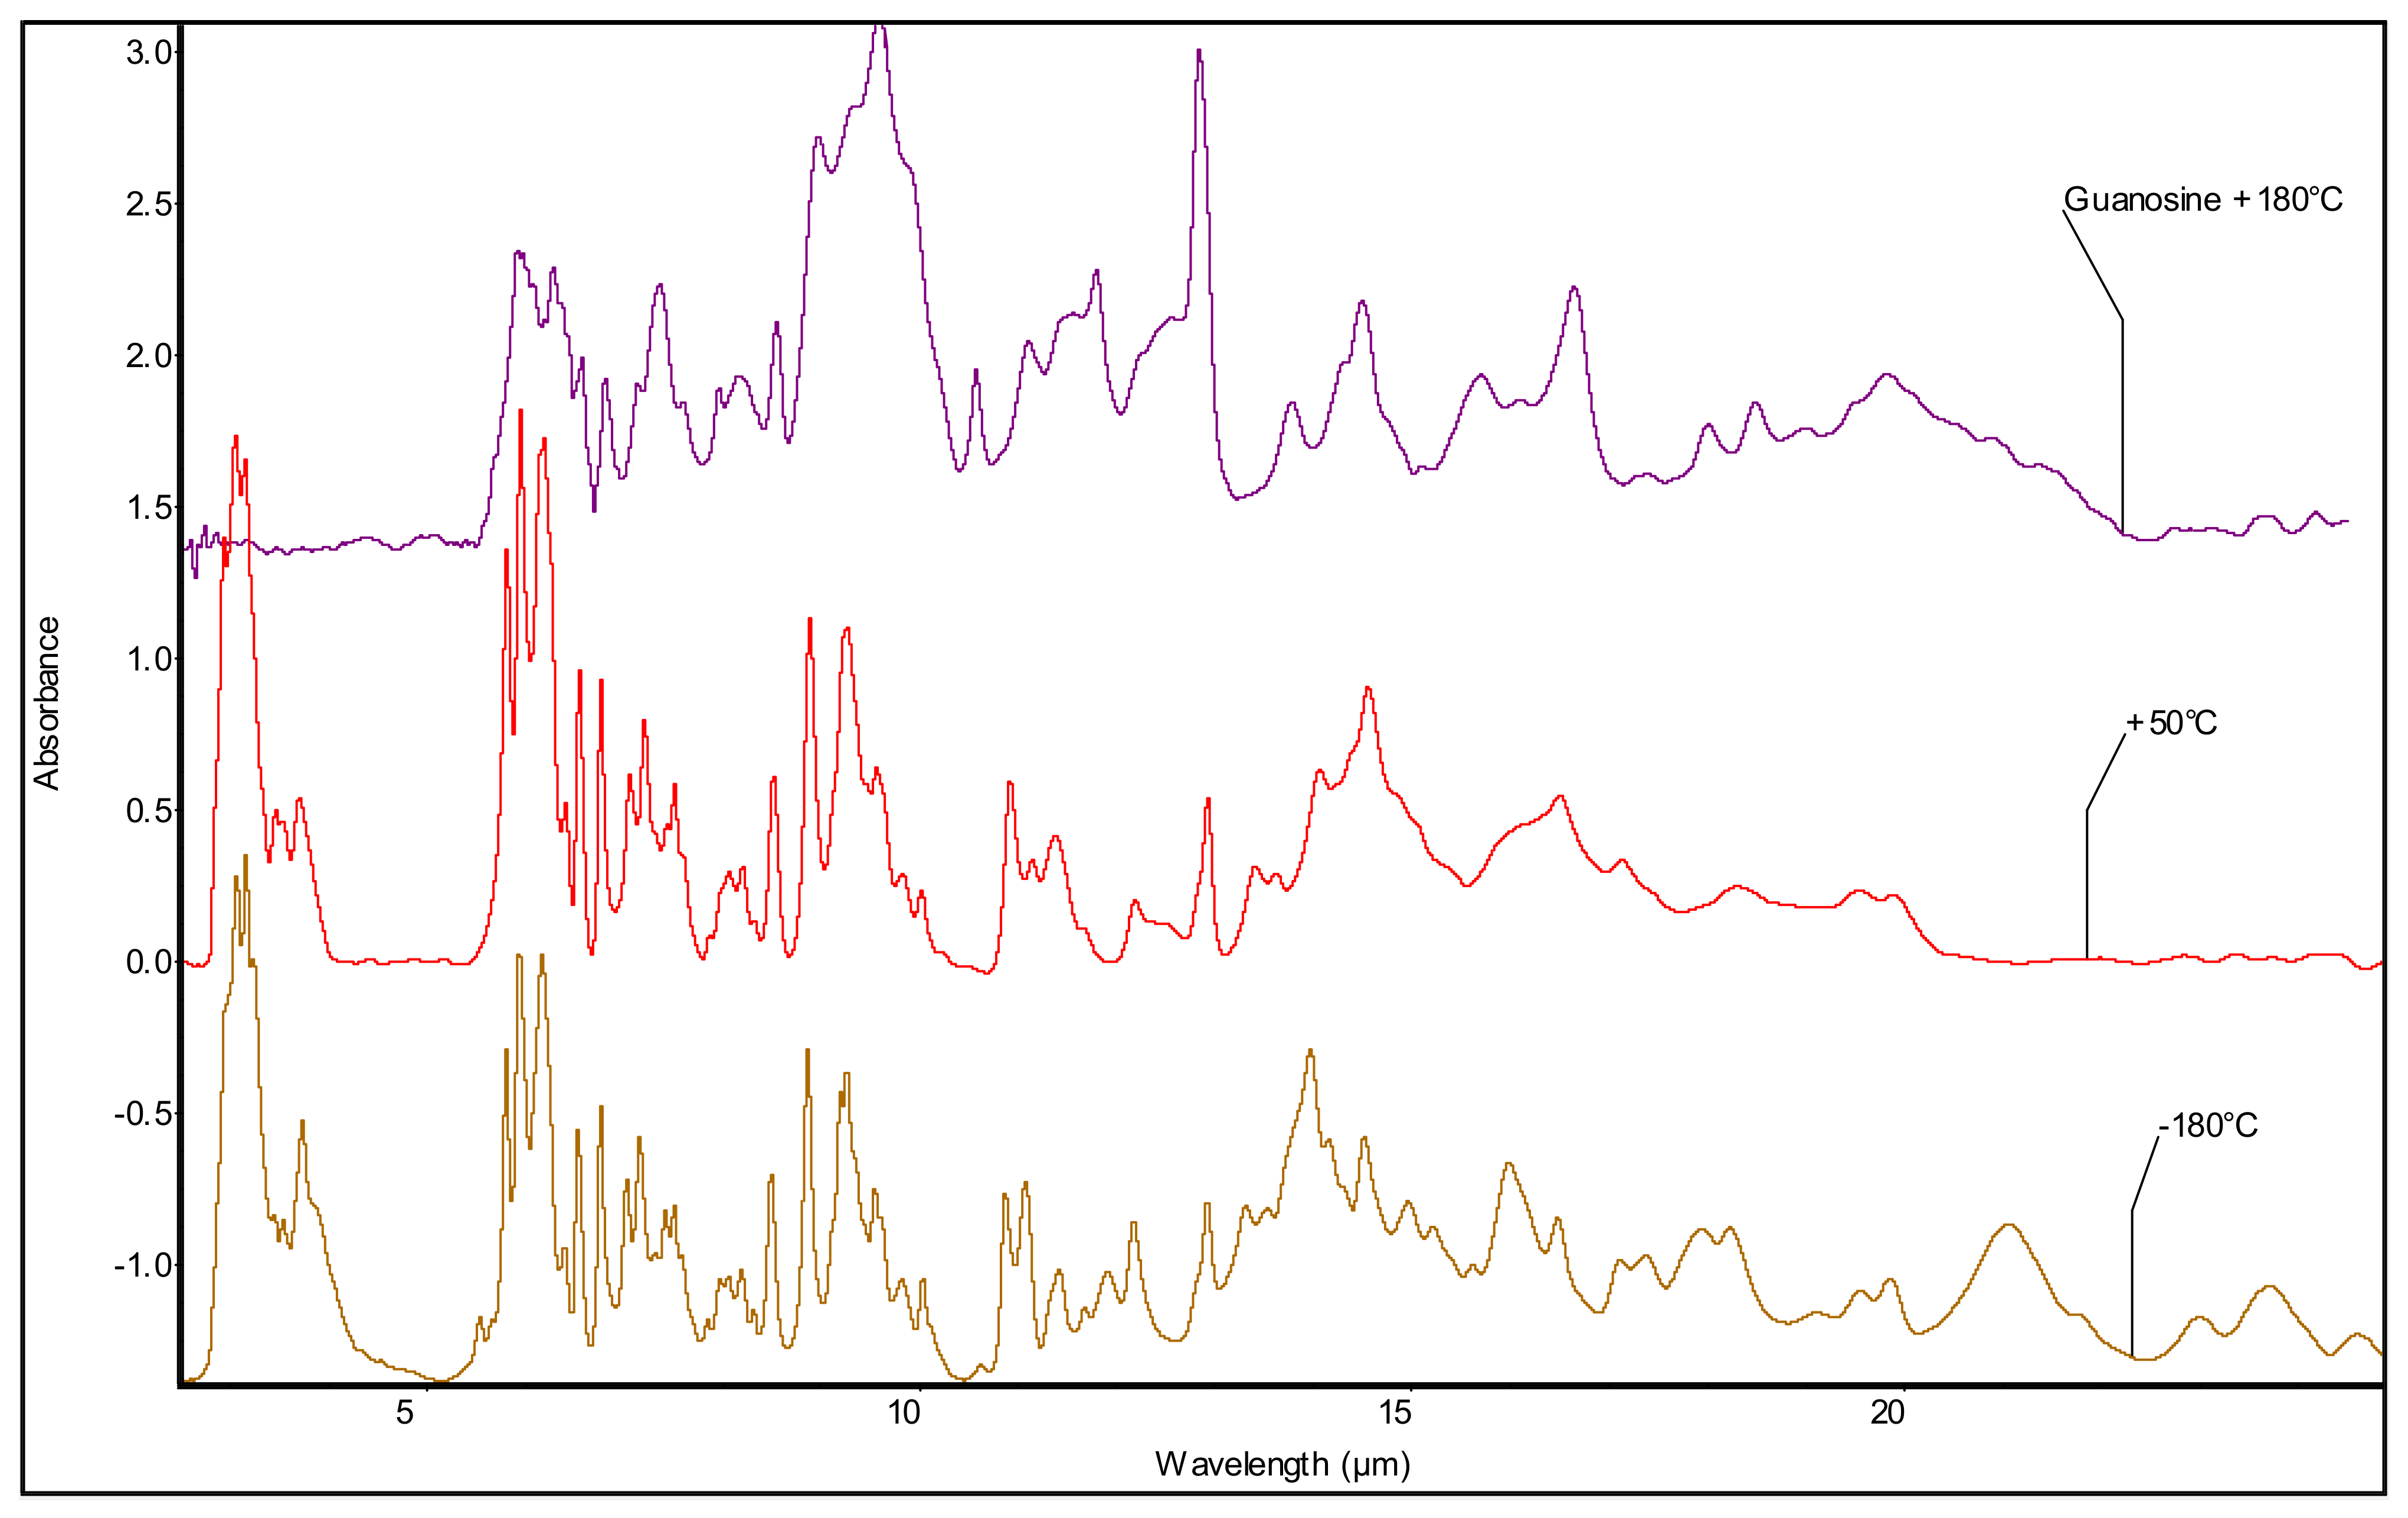
3.2. Mid-Infrared Spectroscopy of the Purine Nucleosides: Ado and Guo
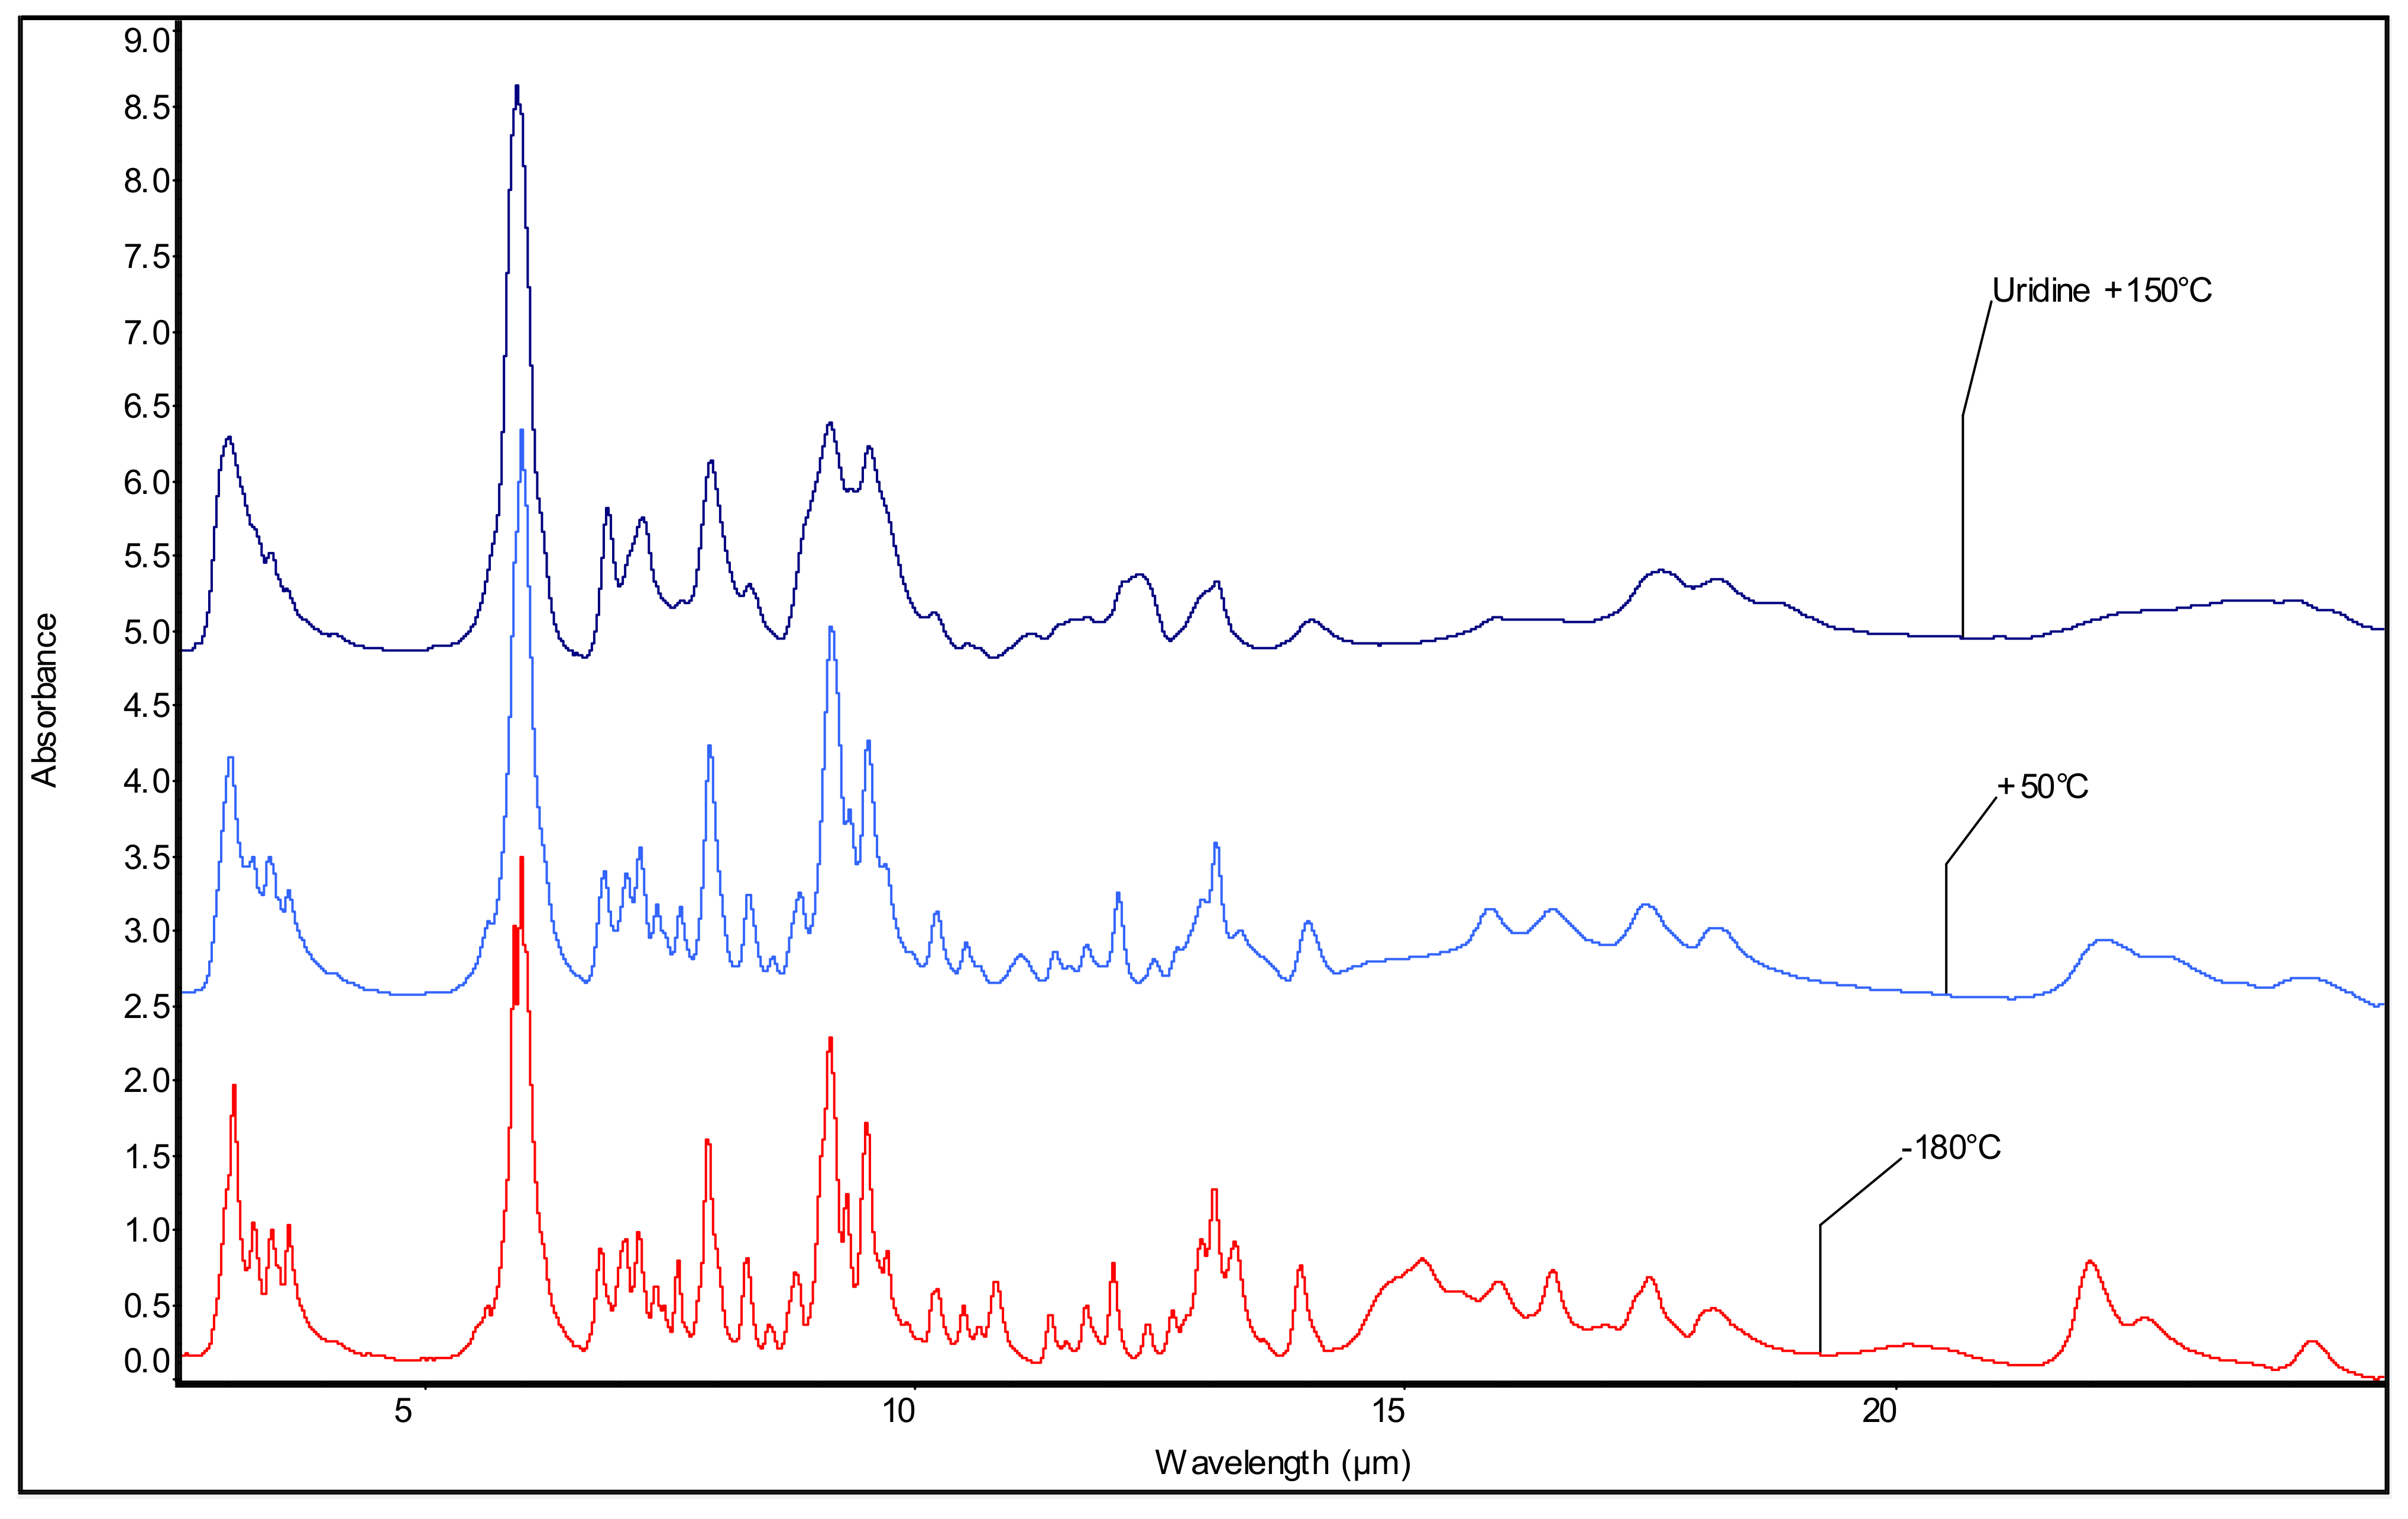
3.3. The Emissions of the Pyrimidine Nucleosides: Cyd and Urd in Mid-IR
4. Conclusions
Author Contributions
Funding
Data Availability Statement
Conflicts of Interest
References
- Chalmers, J.H. Nucleoside. In Encyclopedia of Astrobiology; Gargaud, M., Amils, R., Quintanilla, J.C., Cleaves, H.J., Irvine, W.M., Pinti, D.L., Viso, M., Eds.; Springer: Berlin/Heidelberg, Germany, 2011; pp. 1147–1148. [Google Scholar]
- Müller, F.; Escobar, L.; Xu, F.; Węgrzyn, E.; Nainytė, M.; Amatov, T.; Chan, C.Y.; Pichler, A.; Carell, T. A prebiotically plausible scenario of an RNA–peptide world. Nature 2022, 605, 279–284. [Google Scholar] [CrossRef]
- Horning, D.P. RNA World. In Encyclopedia of Astrobiology; Gargaud, M., Amils, R., Quintanilla, J.C., Cleaves, H.J., Irvine, W.M., Pinti, D.L., Viso, M., Eds.; Springer: Berlin/Heidelberg, Germany, 2011; pp. 1466–1478. [Google Scholar]
- Kruse, F.M.; Teichert, J.S.; Trapp, O. Prebiotic Nucleoside Synthesis: The Selectivity of Simplicity. Chem. Eur. J. 2020, 26, 14776–14790. [Google Scholar] [CrossRef]
- Sandford, S.A.; Nuevo, M.; Bera, P.P.; Lee, T.J. Prebiotic astrochemistry and the formation of molecules of astrobiological interest in interstellar clouds and protostellar disks. Chem. Rev. 2020, 120, 4616–4659. [Google Scholar] [CrossRef]
- Sutherland, J.D. The origin of life—Out of the blue. Angew. Chem. Int. Ed. 2016, 55, 104–121. [Google Scholar] [CrossRef]
- Oba, Y.; Takano, Y.; Naraoka, H.; Watanabe, N.; Kouchi, A. Nucleobase synthesis in interstellar ices. Nat. Commun. 2019, 10, 4413. [Google Scholar] [CrossRef]
- Yadav, M.; Kumar, R.; Krishnamurthy, R. Chemistry of abiotic nucleotide synthesis. Chem. Rev. 2020, 120, 4766–4805. [Google Scholar] [CrossRef]
- Oba, Y.; Takano, Y.; Furukawa, Y.; Koga, T.; Glavin, D.P.; Dworkin, J.P.; Naraoka, H. Identifying the wide diversity of extraterrestrial purine and pyrimidine nucleobases in carbonaceous meteorites. Nat. Commun. 2022, 13, 2008. [Google Scholar] [CrossRef]
- Furukawa, Y.; Chikaraishi, Y.; Ohkouchi, N.; Ogawa, N.O.; Glavin, D.P.; Dworkin, J.P.; Abe, C.; Nakamura, T. Extraterrestrial ribose and other sugars in primitive meteorites. Proc. Natl. Acad. Sci. USA 2019, 116, 24440–24445. [Google Scholar] [CrossRef]
- Bizzarri, B.M.; Fanelli, A.; Kapralov, M.; Krasavin, E.; Saladino, R. Meteorite-catalyzed intermolecular trans-glycosylation produces nucleosides under proton beam irradiation. RSC Adv. 2021, 11, 19258–19264. [Google Scholar] [CrossRef]
- Fialho, D.M.; Roche, T.P.; Hud, N.V. Prebiotic syntheses of noncanonical nucleosides and nucleotides. Chem. Rev. 2020, 120, 4806–4830. [Google Scholar] [CrossRef]
- Cataldo, F.; Iglesias-Groth, S. Radiation chemical aspects of the origins of life. J. Radioanal. Nucl. Chem. 2017, 311, 1081–1097. [Google Scholar] [CrossRef]
- Cataldo, F. Radiolysis and radioracemization of RNA ribonucleosides: Implications for the origins of life. J. Radioanal. Nucl. Chem. 2018, 318, 1649–1661. [Google Scholar] [CrossRef]
- Iglesias-Groth, S.; Cataldo, F. Mid-and far-infrared spectroscopy of nucleobases: Molar extinction coefficients, integrated molar absorptivity, and temperature dependence of the main bands. MNRAS 2023, 523, 1756–1771. [Google Scholar] [CrossRef]
- Iglesias-Groth, S.; Cataldo, F. Integrated Molar Absorptivity of Mid-and Far-Infrared Spectra of Alanine and a Selection of Other Five Amino Acids of Astrobiological Relevance. Astrobiology 2022, 22, 462–480. [Google Scholar] [CrossRef]
- Iglesias-Groth, S.; Cataldo, F. Integrated molar absorptivity of mid-and far-infrared spectra of glycine and other selected amino acids. Astrobiology 2021, 21, 526–540. [Google Scholar] [CrossRef]
- Mifsud, D.V.; Hailey, P.A.; Traspas Muiña, A.; Auriacombe, O.; Mason, N.J.; Ioppolo, S. The role of terahertz and far-IR spectroscopy in understanding the formation and evolution of interstellar prebiotic molecules. Front. Astron. Space Sci. 2021, 8, 757619. [Google Scholar] [CrossRef]
- Linz, H.; Beuther, H.; Gerin, M.; Goicoechea, J.R.; Helmich, F.; Krause, O.; Liu, Y.; Molinari, S.; Ossenkopf-Okada, V.; Pineda, J. Bringing high spatial resolution to the far-infrared: A giant leap for astrophysics. ExA 2021, 51, 661–697. [Google Scholar] [CrossRef]
- Cataldo, F.; Iglesias-Groth, S. Fulleranes: The Hydrogenated Fullerenes; Springer Science & Business Media: Berlin/Heidelberg, Germany, 2010; Volume 2. [Google Scholar]
- Tsuboi, M. Application of infrared spectroscopy to structure studies of nucleic acids. ApSRv 1970, 3, 45–90. [Google Scholar] [CrossRef]
- Mathlouthi, M.; Seuvre, A.-M.; Koenig, J.L. Ft-ir and laser-Raman spectra of adenine and adenosine. Carbohydr. Res. 1984, 131, 1–15. [Google Scholar] [CrossRef]
- Mathlouthi, M.; Seuvre, A.M.; Koenig, J.L. FT-IR and laser-Raman spectra of guanine and guanosine. Carbohydr. Res. 1986, 146, 15–27. [Google Scholar] [CrossRef]
- Gaigeot, M.-P.; Leulliot, N.; Ghomi, M.; Jobic, H.; Coulombeau, C.; Bouloussa, O. Analysis of the structural and vibrational properties of RNA building blocks by means of neutron inelastic scattering and density functional theory calculations. Chem. Phys. 2000, 261, 217–237. [Google Scholar] [CrossRef]
- Lee, S.; Anderson, A.; Smith, W.; Griffey, R.; Mohan, V. Temperature-dependent Raman and infrared spectra of nucleosides. Part I—Adenosine. JRSp 2000, 31, 891–896. [Google Scholar] [CrossRef]
- Rozenberg, M.; Jung, C.; Shoham, G. Ordered and disordered hydrogen bonds in adenosine, cytidine and uridine studied by low temperature FT infrared spectroscopy. Phys. Chem. Chem. Phys. 2003, 5, 1533–1535. [Google Scholar] [CrossRef]
- Rozenberg, M.; Jung, C.; Shoham, G. Low-temperature FTIR spectra and hydrogen bonds in polycrystalline adenosine and uridine. Spectrochim. Acta Part A Mol. Biomol. Spectrosc. 2005, 61, 733–741. [Google Scholar] [CrossRef]
- Ivanov, A.Y.; Rubin, Y.V.; Egupov, S.; Belous, L.; Karachevtsev, V. The conformational structure of adenosine molecules, isolated in low-temperature Ar matrices. LTP 2015, 41, 936–941. [Google Scholar] [CrossRef]
- Ivanov, A.Y.; Stepanian, S. Molecular structure and vibrational spectra of isolated nucleosides at low temperatures. LTP 2021, 47, 181–198. [Google Scholar]
- Iglesias-Groth, S.; Cataldo, F. Far-infrared spectroscopy of proteinogenic and other less common amino acids. MNRAS 2018, 478, 3430–3437. [Google Scholar] [CrossRef]
- Gilli, G.; Gilli, P. The Nature of the Hydrogen Bond: Outline of a Comprehensive Hydrogen Bond Theory; Oxford University Press: Oxford, UK, 2009; Volume 23. [Google Scholar]
- Zeegers-Huyskens, T.; Huyskens, P. Intermolecular forces. In Intermolecular Forces: An Introduction to Modern Methods and Results; Springer: Berlin/Heidelberg, Germany, 1991; pp. 1–30. [Google Scholar]
- Mathlouthi, M.; Seuvre, A.M.; Koenig, J.L. FT-IR and laser-Raman spectra of cytosine and cytidine. Carbohydr. Res. 1986, 146, 1–13. [Google Scholar] [CrossRef]
- Leulliot, N.; Ghomi, M.; Jobic, H.; Bouloussa, O.; Baumruk, V.; Coulombeau, C. Ground state properties of the nucleic acid constituents studied by density functional calculations. 2. Comparison between calculated and experimental vibrational spectra of uridine and cytidine. J. Phys. Chem. B 1999, 103, 10934–10944. [Google Scholar] [CrossRef]
- Lee, S.; Li, J.; Anderson, A.; Smith, W.; Griffey, R.; Mohan, V. Temperature-dependent Raman and infrared spectra of nucleosides. II—Cytidine. JRSp 2001, 32, 795–802. [Google Scholar] [CrossRef]
- Xu, Z.H.; Butler, I.S. Fourier transform infrared and laser Raman microprobe spectra of uridine. JRSp 1987, 18, 351–356. [Google Scholar] [CrossRef]


| Wavelength at 50 °C | Wavenumber at 50 °C | Band Shift Δνa −180 °C to +180 °C | Integration Region | [ε] | [ψ] |
|---|---|---|---|---|---|
| μm | cm−1 | cm−1 | μm | M−1 cm−1 | km/mol |
| 2.99 | 3335 | −19 | 3706–2301 | 320 | 1404 |
| 3.04 | * 3289 | ||||
| 3.15 | 3167 | −38 | 3420–2972 | 301 | 447 |
| 3.19 | 3135 | 3 | 286 | ||
| 3.19 | * 3127 | ||||
| 3.26 | * 3061 | ||||
| 3.38 | 2958 | 6 | 139 | ||
| 3.40 | 2933 | 1 | 155 | ||
| 3.42 | 2919 | −3 | 162 | ||
| 3.51 | 2843 | 2 | 135 | ||
| 3.61 | 2770 | 92 | |||
| 3.68 | * 2712 | ||||
| 3.73 | 2676 | 7 | 86 | ||
| 3.80 | * 2627 | ||||
| 5.20 | 1923 | 10 | 20 | ||
| 5.84 | 1711 | 3 | 1776–1523 | 161 | 224 |
| 5.99 | 1667 | 10 | 1723–1630 | 409 | 72 |
| 6.01 | 1664 | 379 | |||
| 6.03 | 1656 | 263 | |||
| 6.06 | 1648 | 200 | |||
| 6.23 | 1605 | 9 | 1630–1581 | 302 | 33 |
| 6.35 | 1573 | 5 | 1581–1558 | 197 | 10 |
| 6.63 | 1508 | 9 | 52 | ||
| 6.78 | 1474 | 4 | 1522–1440 | 201 | 31 |
| 6.90 | * 1448 | ||||
| 7.00 | 1427 | 6 | 107 | ||
| 7.07 | 1414 | 4 | 1440–1396 | 164 | 14 |
| 7.21 | 1387 | 4 | 1396–1379 | 123 | 2,6 |
| 7.29 | 1371 | 4 | 1379–1361 | 133 | 3,4 |
| 7.39 | 1353 | 8 | 1361–1343 | 102 | 2,0 |
| 7.50 | 1333 | 6 | 1343–1318 | 233 | 14 |
| 7.68 | 1302 | 3 | 1318–1266 | 285 | 32 |
| 7.83 | * 1277 | ||||
| 7.99 | 1251 | 5 | 125 | ||
| 8.05 | * 1242 | ||||
| 8.17 | 1224 | 4 | 136 | ||
| 8.27 | 1209 | 1 | 1266–1187 | 203 | 40 |
| 8.48 | 1178 | 3 | 1187–1157 | 95 | 4.3 |
| 8.74 | 1143 | 7 | 1157–1134 | 136 | 6.0 |
| 8.88 | 1126 | 5 | 1134–1119 | 149 | 3.2 |
| 9.02 | 1108 | 5 | 1119–1097 | 195 | 10 |
| 9.16 | 1091 | 3 | 1157–1085 | 102 | 40 |
| 9.32 | 1072 | 8 | 230 | ||
| 9.47 | 1055 | 5 | 215 | ||
| 9.63 | 1038 | 2 | 1085–1020 | 251 | 55 |
| 9.89 | 1011 | 5 | 1020–990 | 113 | 5,5 |
| 10.22 | 978 | 1 | 988–950 | 112 | 7.8 |
| 10.37 | 964 | 4 | 56 | ||
| 11.06 | 904 | 4 | 924–870 | 102 | 13 |
| 11.64 | 859 | 2 | 870–853 | 32 | 0.7 |
| 11.84 | 844 | −1 | 853–835 | 67 | 2.9 |
| 12.15 | 823 | 4 | 835–806 | 136 | 8.7 |
| 12.57 | 795 | 806–787 | 82 | 1.9 | |
| 13.02 | 768 | 9 | 787–738 | 151 | 13 |
| 13.10 | * 763 | ||||
| 13.83 | 723 | 6 | 735–713 | 116 | 4,5 |
| 14.16 | 706 | 6 | 88 | ||
| 14.88 | 672 | 133 | |||
| 15.31 | * 653 | ||||
| 15.62 | 640 | 1 | 714–603 | 187 | 51 |
| 16.00 | * 625 | ||||
| 16.86 | 593 | 10 | 603–554 | 133 | 12 |
| 17.48 | * 572 | ||||
| 18.21 | 549 | 1 | 46 | ||
| 18.55 | 539 | 554–496 | 75 | 8.8 | |
| 19.08 | 524 | 2 | 67 | ||
| 24.27 | 412 | 422–405 | 11 | 0.7 |
| Wavelength at 50 °C | Wavenumber at 50 °C | Band Shift Δνa −180 °C to +180 °C | Integration Region | [ε] | [ψ] |
|---|---|---|---|---|---|
| μm | cm−1 | cm−1 | μm | M−1 cm−1 | km/mol |
| 2.80 | 3570 | 2 *** | 141 | ||
| 2.84 | * 3523 | ||||
| 2.87 | * 3483 | ||||
| 2.89 | 3466 | −6 *** | 310 | ||
| 2.93 | * 3417 | 0 | |||
| 3.00 | 3333 | 4 *** | 3625–2985 | 375 | 1259 |
| 3.00 | * 3330 | ||||
| 3.01 | 3318 | 4 *** | 377 | ||
| 3.02 | * 3314 | ||||
| 3.03 | * 3299 | ||||
| 3.04 | * 3292 | ||||
| 3.05 | * 3283 | ||||
| 3.11 | 3220 | 3 *** | 353 | ||
| 3.12 | * 3210 | ||||
| 3.12 | 3209 | −9 *** | 350 | ||
| 3.18 | 3143 | 2 *** | 259 | ||
| 3.19 | 3130 | 249 | |||
| 3.21 | * 3111 | ||||
| 3.22 | * 3106 | ||||
| 3.37 | * 2964 | ||||
| 3.38 | 2958 | −2 *** | 3625–2447 | 99 | 1806 |
| 3.42 | 2924 | −3 *** | 2985–2502 | 120 | 205 |
| 3.45 | 2896 | 115 | |||
| 3.50 | 2860 | 2 *** | 102 | ||
| 3.53 | 2830 | 7 *** | 84 | ||
| 3.56 | * 2809 | ||||
| 3.65 | 2737 | −27 *** | 114 | ||
| 5.13 | 1950 | ||||
| 5.50 | * 1819 | ||||
| 5.61 | * 1781 | ||||
| 5.77 | 1733 | 3 *** | 1784–1713 | 320 | 39 |
| 5.89 | * 1697 | 1850–1554 | 434 | ||
| 5.91 | 1693 | 7 | 1713–1663 | 406 | 47 |
| 6.10 | 1639 | 355 | |||
| 6.15 | 1625 | 1663–1591 | 376 | 89 | |
| 6.22 | 1609 | 12 | 298 | ||
| 6.37 | 1569 | 1598–1553 | 118 | 7.1 | |
| 6.50 | 1538 | 6 | 1553–1507 | 223 | 34 |
| 6.72 | 1487 | 1507–1456 | 225 | 30 | |
| 1455–1289 | 107 | ||||
| 7.02 | 1425 | 22 | 1450–1407 | 134 | 10 |
| 7.16 | 1396 | 1407–1379 | 177 | 11 | |
| 7.11 | * 1406 | ||||
| 7.26 | 1377 | ||||
| 7.29 | 1372 | 8 | |||
| 7.40 | 1352 | 97 | |||
| 7.47 | 1338 | 1636–1317 | 132 | 11 | |
| 7.56 | 1323 | 4 | 77 | ||
| 7.66 | * 1305 | ||||
| 7.83 | 1277 | 19 | |||
| 7.94 | 1259 | −2 | 48 | ||
| 8.03 | 1245 | 63 | |||
| 8.17 | 1224 | −5 | 1289–1198 | 68 | 27 |
| 8.29 | 1207 | 30 | |||
| 8.45 | 1179 | 9 | 1198–1157 | 128 | 19 |
| 1157–940 | 178 | ||||
| 8.85 | 1130 | 13 | 1154–1111 | 247 | 31 |
| 9.10 | 1099 | ||||
| 9.16 | * 1092 | ||||
| 9.23 | 1083 | 1111–1030 | 233 | 65 | |
| 9.31 | * 1074 | −2 | |||
| 9.42 | 1062 | 123 | |||
| 9.52 | 1050 | 4 | 135 | ||
| 9.60 | 1042 | ||||
| 9.79 | 1021 | 9 | 1030–1009 | 60 | 2.1 |
| 9.98 | 1002 | 1009–987 | 50 | 2.4 | |
| 10.21 | 979 | 5.6 | |||
| 10.47 | 955 | −4 | 939–841 | 50 | |
| 10.89 | 918 | 128 | |||
| 11.11 | 900 | 2 | 70 | ||
| 11.35 | 881 | 9 | 86 | ||
| 11.64 | 859 | 9 | 22 | ||
| 11.88 | * 842 | ||||
| 12.15 | 823 | 837–789 | 41 | 7.5 | |
| 12.50 | ** 800 | ||||
| 12.89 | 776 | −4 | 789–765 | 115 | 8.7 |
| 13.37 | 748 | 65 | |||
| 765–644 | 73 | ||||
| 13.59 | 736 | 61 | |||
| 14.03 | 713 | −11 | 131 | ||
| 14.12 | * 708 | 7 | |||
| 14.29 | * 700 | ||||
| 14.53 | 688 | −1 | 730–644 | 189 | 49 |
| 14.93 | * 670 | ||||
| 15.17 | * 659 | ||||
| 15.60 | * 641 | 3 | |||
| 15.95 | * 627 | 4 | |||
| 16.47 | 607 | 6 | 644–590 | 113 | 15 |
| 17.09 | 585 | 644–565 | 69 | 25 | |
| 17.33 | * 577 | 1 | |||
| 17.92 | * 558 | 2 | |||
| 18.25 | 548 | 7 | 564–524 | 50 | 2.6 |
| 19.08 | * 524 | −3 | |||
| 19.49 | 513 | 48 | |||
| 19.88 | 503 | −1 | 45 | ||
| 21.05 | * 475 | −5 | |||
| 21.98 | 455 | −9 | |||
| 22.83 | 438 | −5 | 2.7 | ||
| 23.36 | 428 | 4.4 | |||
| 23.70 | 422 | −1 | |||
| 24.33 | 411 | −7 | 4.2 |
| Wavelength at 50 °C | Wavenumber at 50 °C | Band Shift Δνa −180 °C to +180 °C | Integration Region | [ε] | [ψ] |
|---|---|---|---|---|---|
| μm | cm−1 | cm−1 | μm | M−1 cm−1 | km/mol |
| 2.90 | 3448 | −24 | 3800–2354 | 227 | 1106 |
| 2.99 | 3349 | −1 | 266 | ||
| 3.05 | 3278 | 5 | 3512–2978 | 225 | 444 |
| 3.09 | 3232 | 6 | 237 | ||
| 3.12 | * 3203 | ||||
| 3.24 | 3087 | 2 | 166 | ||
| 3.37 | 2963 | −2 | 113 | ||
| 3.39 | 2952 | 123 | |||
| 3.42 | 2920 | 1 | 2891–2801 | 131 | 41 |
| 3.45 | 2896 | −3 | 115 | ||
| 3.51 | 2850 | −2 | 85 | ||
| 3.67 | * 2727 | ||||
| 5.10 | 1960 | 12 | 1788–1552 | 12 | 273 |
| 6.00 | * 1667 | ||||
| 6.02 | 1660 | 7 | 1726–1620 | 330 | 80 |
| 6.05 | * 1652 | 2 | |||
| 6.08 | 1646 | −8 | 1620–1559 | 354 | 55 |
| 6.24 | 1603 | 1 | 371 | ||
| 6.33 | 1581 | 7 | 186 | ||
| 6.51 | * 1537 | ||||
| 6.53 | 1531 | 6 | 1552–1515 | 247 | 21 |
| 6.67 | 1500 | 11 | 1515–1442 | 360 | 55 |
| 6.85 | 1460 | 96 | |||
| 6.98 | 1432 | −2 | 1439–1419 | 90 | 2,3 |
| 7.10 | * 1409 | 9 | |||
| 7.12 | 1404 | 111 | |||
| 7.27 | 1376 | 4 | 1419–1352 | 108 | 24 |
| 7.27 | * 1375 | ||||
| 7.45 | 1343 | 55 | |||
| 7.64 | 1309 | 1 | 1322–1230 | 90 | 41 |
| 7.75 | 1291 | 7 | 209 | ||
| 7.79 | * 1283 | ||||
| 7.90 | * 1266 | ||||
| 8.01 | 1248 | 2 | 76 | ||
| 8.24 | 1213 | 5 | 1230–1176 | 117 | 16 |
| 8.33 | * 1200 | 11 | |||
| 8.39 | 1192 | 71 | |||
| 8.67 | 1153 | 9 | 1174–1001 | 91 | 152 |
| 8.80 | 1136 | 10 | 123 | ||
| 8.97 | * 1115 | ||||
| 9.08 | 1101 | 5 | 1124–1078 | 242 | 30 |
| 9.13 | * 1095 | ||||
| 9.35 | * 1070 | ||||
| 9.43 | * 1061 | ||||
| 9.48 | 1055 | 3 | 1078–1001 | 295 | 54 |
| 9.66 | 1035 | 1 | 157 | ||
| 10.16 | 984 | 998–957 | 107 | 13 | |
| 10.60 | 943 | 4 | 957–896 | 104 | 12 |
| 11.48 | 871 | 3 | 885–863 | 53 | 3.9 |
| 11.71 | 854 | 4 | 863–832 | 63 | 5.5 |
| 11.90 | 840 | 5 | 25 | ||
| 12.25 | 816 | 12 | 839–806 | 121 | 7.9 |
| 12.64 | 791 | 4 | 806–769 | 229 | 21 |
| 13.00 | * 769 | ||||
| 13.23 | 756 | 49 | |||
| 13.61 | 735 | −9 | 62 | ||
| 13.99 | 715 | 15 | 769–639 | 140 | 48 |
| 14.10 | * 709 | ||||
| 15.11 | 662 | 49 | |||
| 15.80 | 633 | 37 | |||
| 16.08 | 622 | 5 | 639–607 | 101 | 6.7 |
| 16.69 | 599 | 2 | 607–579 | 96 | 4.2 |
| 17.39 | * 575 | 10 | |||
| 17.73 | * 564 | 21 | |||
| 18.02 | 555 | 17 | 579–480 | 103 | 23 |
| 21.32 | ** 469 | ||||
| 21.65 | * 462 | 29 | |||
| 22.99 | 435 | −2 | 461–425 | 20 | 3.1 |
| 22.57 | ** 443 | ||||
| 23.75 | 421 | −9 | |||
| 24.10 | 415 | −4 | |||
| 24.63 | 406 | −1 |
| Wavelength at 50 °C | Wavenumber at 50 °C | Band Shift Δνa −180 °C to +180 °C | Integration Region | [ε] | [ψ] |
|---|---|---|---|---|---|
| μm | cm−1 | cm−1 | μm | M−1 cm−1 | km/mol |
| 2.93 | * 3413 | ||||
| 2.99 | 3346 | 195 | |||
| 3.02 | * 3315 | ||||
| 3.21 | 3114 | 3714–2286 | 117 | 1030 | |
| 3.22 | 3104 | 3 | 2460–2534 | 126 | 25 |
| 3.28 | 3051 | −9 | 93 | ||
| 3.37 | 2964 | 128 | |||
| 3.42 | 2926 | 1 | 129 | ||
| 3.47 | 2878 | 9 | 91 | ||
| 3.57 | 2801 | −1 | 99 | ||
| 3.59 | * 2785 | ||||
| 5.61 | 1781 | 56 | |||
| 5.88 | * 1701 | ||||
| 5.95 | 1681 | −15 | 1977–1513 | 246 | 303 |
| 5.96 | * 1677 | ||||
| 5.98 | * 1673 | ||||
| 6.00 | * 1668 | ||||
| 6.79 | 1472 | 1506–1447 | 102 | 17 | |
| 6.85 | * 1460 | −3 | |||
| 6.97 | * 1435 | ||||
| 7.03 | 1422 | 1446–1410 | 97 | 5.7 | |
| 7.16 | 1397 | 8 | 1410–1376 | 123 | 10 |
| 7.21 | * 1387 | ||||
| 7.34 | 1363 | 1375–1335 | 75 | 6.5 | |
| 7.41 | 1349 | 52 | |||
| 7.45 | * 1343 | ||||
| 7.58 | 1320 | 6 | 1334–1297 | 74 | 6.7 |
| 7.76 | * 1289 | ||||
| 7.88 | 1269 | 4 | 1297–1225 | 181 | 42 |
| 7.94 | * 1259 | ||||
| 8.26 | 1210 | 4 | 1225–1184 | 83 | 11 |
| 8.51 | 1175 | 1184–1161 | 28 | 1.7 | |
| 8.68 | * 1152 | ||||
| 8.72 | * 1147 | ||||
| 8.80 | 1137 | 1161–1125 | 77 | 7.8 | |
| 9.02 | * 1109 | ||||
| 9.12 | 1097 | 1125–1065 | 203 | 40 | |
| 9.30 | 1075 | 1125–993 | 137 | 97 | |
| 9.49 | 1054 | −1 | 1065–1038 | 173 | 10 |
| 9.68 | 1033 | 100 | |||
| 9.93 | 1007 | 34 | |||
| 10.18 | 982 | 3 | 993–962 | 63 | 6 |
| 10.19 | * 981 | ||||
| 10.49 | 953 | 4 | 962–928 | 39 | 3.6 |
| 10.63 | 941 | 19 | |||
| 10.80 | * 926 | ||||
| 11.03 | 907 | 928–887 | 27 | 4.5 | |
| 11.39 | 878 | −17 | 887–861 | 29 | 2.3 |
| 11.57 | 864 | 14 | |||
| 11.72 | 853 | −3 | 861–840 | 33 | 1.9 |
| 12.03 | 831 | 8 | 840–816 | 73 | 5.1 |
| 12.41 | 806 | −5 | 816–798 | 20 | 1.2 |
| 12.64 | 791 | 28 | |||
| 12.90 | 775 | 3 | 66 | ||
| 13.05 | 766 | 2 | 798–726 | 110 | 26 |
| 13.28 | 753 | 46 | |||
| 13.97 | 716 | 6 | 726–701 | 50 | 5,1 |
| 14.81 | * 675 | ||||
| 15.15 | * 660 | ||||
| 15.53 | * 644 | ||||
| 15.82 | 632 | −1 | 650–619 | 61 | 2.1 |
| 16.47 | 607 | −1 | 619–587 | 61 | 3.4 |
| 17.42 | 574 | 5 | 587–559 | 64 | 4.6 |
| 18.15 | 551 | 1 | 559–529 | 45 | 3.0 |
| 20.12 | * 497 | ||||
| 18.76 | ** 533 | ||||
| 22.12 | 452 | 472–421 | 57 | 10 | |
| 22.73 | 440 | 43 | |||
| 23.75 | ** 421 | ||||
| 24.15 | 414 | 420–400 | 25 | 1.8 |
Disclaimer/Publisher’s Note: The statements, opinions and data contained in all publications are solely those of the individual author(s) and contributor(s) and not of MDPI and/or the editor(s). MDPI and/or the editor(s) disclaim responsibility for any injury to people or property resulting from any ideas, methods, instructions or products referred to in the content. |
© 2024 by the authors. Licensee MDPI, Basel, Switzerland. This article is an open access article distributed under the terms and conditions of the Creative Commons Attribution (CC BY) license (https://creativecommons.org/licenses/by/4.0/).
Share and Cite
Iglesias-Groth, S.; Cataldo, F.; Marin-Dobrincic, M. Infrared Spectroscopy of RNA Nucleosides in a Wide Range of Temperatures. Life 2024, 14, 436. https://doi.org/10.3390/life14040436
Iglesias-Groth S, Cataldo F, Marin-Dobrincic M. Infrared Spectroscopy of RNA Nucleosides in a Wide Range of Temperatures. Life. 2024; 14(4):436. https://doi.org/10.3390/life14040436
Chicago/Turabian StyleIglesias-Groth, Susana, Franco Cataldo, and Martina Marin-Dobrincic. 2024. "Infrared Spectroscopy of RNA Nucleosides in a Wide Range of Temperatures" Life 14, no. 4: 436. https://doi.org/10.3390/life14040436
APA StyleIglesias-Groth, S., Cataldo, F., & Marin-Dobrincic, M. (2024). Infrared Spectroscopy of RNA Nucleosides in a Wide Range of Temperatures. Life, 14(4), 436. https://doi.org/10.3390/life14040436