

Impact of Baseline Clinical Variables on SGLT2i’s Antiproteinuric Effect in Diabetic Kidney Disease


 , , , and
Abstract
1. Introduction
2. Materials and Methods
2.1. Study Design and Population
2.2. Study Aim
2.3. Statistical Analysis
3. Results
4. Discussion
5. Study Limits
6. Conclusions
Author Contributions
Funding
Institutional Review Board Statement
Informed Consent Statement
Data Availability Statement
Conflicts of Interest
Abbreviations
References
- Basi, S.; Lewis, J.B. Microalbuminuria as a target to improve cardiovascular and renal outcomes. Am. J. Kidney Dis. 2006, 47, 927–946. [Google Scholar] [CrossRef]
- Liu, D.; Lv, L.L. New Understanding on the Role of Proteinuria in Progression of Chronic Kidney Disease. Adv. Exp. Med. Biol. 2019, 1165, 487–500. [Google Scholar] [CrossRef] [PubMed]
- Jiang, W.; Chen, Z.; Xu, J.; Luo, Z.; Teng, J.; Ding, X.; Zhao, S.; Xu, X. Proteinuria is a risk factor for acute kidney injury after cardiac surgery in patients with stages 3-4 chronic kidney disease: A case control study. BMC Cardiovasc. Disord. 2023, 23, 77. [Google Scholar] [CrossRef]
- Abbate, M.; Zoja, C.; Morigi, M.; Rottoli, D.; Angioletti, S.; Tomasoni, S.; Zanchi, C.; Longaretti, L.; Donadelli, R.; Remuzzi, G. Transforming growth factor-beta1 is up-regulated by podocytes in response to excess intraglomerular passage of proteins: A central pathway in progressive glomerulosclerosis. Am. J. Pathol. 2002, 161, 2179–2193. [Google Scholar] [CrossRef]
- Remuzzi, G.; Bertani, T. Is glomerulosclerosis a consequence of altered glomerular permeability to macromolecules? Kidney Int. 1990, 38, 384–394. [Google Scholar] [CrossRef]
- Ruggenenti, P.P.; Cravedi, P.; Remuzzi, G. Mechanisms and treatment of CKD. J. Am. Soc. Nephrol. JASN 2012, 23, 1917–1928. [Google Scholar] [CrossRef] [PubMed]
- Zeisberg, M.; Neilson, E.G. Mechanisms of tubulointerstitial fibrosis. J. Am. Soc. Nephrol. JASN 2010, 21, 1819–1834. [Google Scholar] [CrossRef]
- Minutolo, R.; Gabbai, F.B.; Provenzano, M.; Chiodini, P.; Borrelli, S.; Garofalo, C.; Sasso, F.C.; Santoro, D.; Bellizzi, V.; Conte, G.; et al. Cardiorenal prognosis by residual proteinuria level in diabetic chronic kidney disease: Pooled analysis of four cohort studies. Nephrol. Dial. Transplant. 2018, 33, 1942–1949. [Google Scholar] [CrossRef] [PubMed]
- Alicic, R.Z.; Rooney, M.T.; Tuttle, K.R. Diabetic Kidney Disease: Challenges, Progress, and Possibilities. Clin. J. Am. Soc. Nephrol. CJASN 2017, 12, 2032–2045. [Google Scholar] [CrossRef]
- Gerstein, H.C.; Mann, J.F.; Yi, Q.; Zinman, B.; Dinneen, S.F.; Hoogwerf, B.; Hallé, J.P.; Young, J.; Rashkow, A.; Joyce, C.; et al. Albuminuria and risk of cardiovascular events, death, and heart failure in diabetic and nondiabetic individuals. JAMA 2001, 286, 421–426. [Google Scholar] [CrossRef]
- Hallan, S.; Astor, B.; Romundstad, S.; Aasarød, K.; Kvenild, K.; Coresh, J. Association of kidney function and albuminuria with cardiovascular mortality in older vs younger individuals: The HUNT II Study. Arch. Intern. Med. 2007, 167, 2490–2496. [Google Scholar] [CrossRef] [PubMed]
- Ruggenenti, P.; Kraus, B.J.; Inzucchi, S.E.; Zinman, B.; Hantel, S.; Mattheus, M.; von Eynatten, M.; Remuzzi, G.; Koitka-Weber, A.; Wanner, C. Nephrotic-range proteinuria in type 2 diabetes: Effects of empagliflozin on kidney disease progression and clinical outcomes. EClinicalMedicine 2021, 43, 101240. [Google Scholar] [CrossRef]
- Rossing, K.K.; Christensen, P.K.; Hovind, P.; Parving, H.H. Remission of nephrotic-range albuminuria reduces risk of end-stage renal disease and improves survival in type 2 diabetic patients. Diabetologia 2005, 48, 2241–2247. [Google Scholar] [CrossRef]
- Coresh, J.; Heerspink HJ, L.; Sang, Y.; Matsushita, K.; Arnlov, J.; Astor, B.C.; Black, C.; Brunskill, N.J.; Carrero, J.J.; Feldman, H.I.; et al. Change in albuminuria and subsequent risk of end-stage kidney disease: An individual participant-level consortium meta-analysis of observational studies. Lancet. Diabetes Endocrinol. 2019, 7, 115–127. [Google Scholar] [CrossRef]
- Heerspink, H.J.; Kröpelin, T.F.; Hoekman, J.; de Zeeuw, D. Drug-Induced Reduction in Albuminuria Is Associated with Subsequent Renoprotection: A Meta-Analysis. J. Am. Soc. Nephrol. JASN 2015, 26, 2055–2064. [Google Scholar] [CrossRef]
- Provenzano, M.; Garofalo, C.; Chiodini, P.; Mancuso, C.; Barbato, E.; De Nicola, L.; Andreucci, M. Role of proteinuria in clinical research: For each old-answer, a new key-question. Recent. Progress. Med. 2020, 111, 74–81. [Google Scholar] [CrossRef]
- Zinman, B.; Lachin, J.M.; Inzucchi, S.E. Empagliflozin, Cardiovascular Outcomes, and Mortality in Type 2 Diabetes. N. Engl. J. Med. 2016, 374, 1094. [Google Scholar] [CrossRef] [PubMed]
- Neal, B.; Perkovic, V.; Mahaffey, K.W.; de Zeeuw, D.; Fulcher, G.; Erondu, N.; Shaw, W.; Law, G.; Desai, M.; Matthews, D.R.; et al. Canagliflozin and Cardiovascular and Renal Events in Type 2 Diabetes. N. Engl. J. Med. 2017, 377, 644–657. [Google Scholar] [CrossRef] [PubMed]
- Wiviott, S.D.; Raz, I.; Bonaca, M.P.; Mosenzon, O.; Kato, E.T.; Cahn, A.; Silverman, M.G.; Zelniker, T.A.; Kuder, J.F.; Murphy, S.A.; et al. Dapagliflozin and Cardiovascular Outcomes in Type 2 Diabetes. N. Engl. J. Med. 2019, 380, 347–357. [Google Scholar] [CrossRef]
- Perkovic, V.; Jardine, M.J.; Neal, B.; Bompoint, S.; Heerspink HJ, L.; Charytan, D.M.; Edwards, R.; Agarwal, R.; Bakris, G.; Bull, S.; et al. Canagliflozin and Renal Outcomes in Type 2 Diabetes and Nephropathy. N. Engl. J. Med. 2019, 380, 2295–2306. [Google Scholar] [CrossRef]
- Heerspink, H.J.; Stefánsson, B.V.; Correa-Rotter, R.; Chertow, G.M.; Greene, T.; Hou, F.F.; Mann, J.F.; McMurray, J.J.; Lindberg, M.; Rossing, P.; et al. Dapagliflozin in Patients with Chronic Kidney Disease. N. Engl. J. Med. 2020, 383, 1436–1446. [Google Scholar] [CrossRef]
- The EMPA-KIDNEY Collaborative Group; Herrington, W.G.; Staplin, N.; Wanner, C.; Green, J.B.; Hauske, S.J.; Emberson, J.R.; Preiss, D.; Judge, P.; Mayne, K.J.; et al. Empagliflozin in Patients with Chronic Kidney Disease. N. Engl. J. Med. 2022; ahead of print. [Google Scholar] [CrossRef]
- Kidney Disease: Improving Global Outcomes (KDIGO) CKD Work Group. KDIGO 2012 Clinical Practice Guideline for the Evaluation and Management of Chronic Kidney Disease. Kidney Int. 2013, 3, 1–150. [Google Scholar]
- Provenzano, M.; Puchades, M.J.; Garofalo, C.; Jongs, N.; D’Marco, L.; Andreucci, M.; De Nicola, L.; Gorriz, J.L.; Heerspink, H.J.L.; ROTATE-3 Study Group. Albuminuria-Lowering Effect of Dapagliflozin, Eplerenone, and Their Combination in Patients with Chronic Kidney Disease: A Randomized Crossover Clinical Trial. J. Am. Soc. Nephrol. 2022, 33, 1569–1580. [Google Scholar] [CrossRef]
- Pollock, C.; Stefánsson, B.; Reyner, D.; Rossing, P.; Sjöström, C.D.; Wheeler, D.C.; Langkilde, A.M.; Heerspink, H.J.L. Albuminuria-lowering effect of dapagliflozin alone and in combination with saxagliptin and effect of dapagliflozin and saxagliptin on glycaemic control in patients with type 2 diabetes and chronic kidney disease (DELIGHT): A randomised, double-blind, placebo-controlled trial. Lancet Diabetes Endocrinol. 2019, 7, 429–441. [Google Scholar] [CrossRef]
- Jongs, N.; Greene, T.; Chertow, G.M.; McMurray JJ, V.; Langkilde, A.M.; Correa-Rotter, R.; Rossing, P.; Sjöström, C.D.; Stefansson, B.V.; Toto, R.D.; et al. Effect of dapagliflozin on urinary albumin excretion in patients with chronic kidney disease with and without type 2 diabetes: A prespecified analysis from the DAPA-CKD trial. Lancet Diabetes Endocrinol. 2021, 9, 755–766. [Google Scholar] [CrossRef]
- Cherney, D.Z.I.; Zinman, B.; Inzucchi, S.E.; Koitka-Weber, A.; Mattheus, M.; von Eynatten, M.; Wanner, C. Effects of empagliflozin on the urinary albumin-to-creatinine ratio in patients with type 2 diabetes and established cardiovascular disease: An exploratory analysis from the EMPA-REG OUTCOME randomised, placebo-controlled trial. Lancet Diabetes Endocrinol. 2017, 5, 610–621. [Google Scholar] [CrossRef] [PubMed]
- Oshima, M.; Neuen, B.L.; Li, J.; Perkovic, V.; Charytan, D.M.; de Zeeuw, D.; Edwards, R.; Greene, T.; Levin, A.; Mahaffey, K.W.; et al. Early Change in Albuminuria with Canagliflozin Predicts Kidney and Cardiovascular Outcomes: A PostHoc Analysis from the CREDENCE Trial. J. Am. Soc. Nephrol. 2020, 31, 2925–2936. [Google Scholar] [CrossRef]
- Wiseman, M.J.; Saunders, A.J.; Keen, H.; Viberti, G. Effect of blood glucose control on increased glomerular filtration rate and kidney size in insulin-dependent diabetes. N. Engl. J. Med. 1985, 312, 617–621. [Google Scholar] [CrossRef] [PubMed]
- Persson, P.; Hansell, P.; Palm, F. Tubular reabsorption and diabetes-induced glomerular hyperfiltration. Acta Physiol. 2010, 200, 3–10. [Google Scholar] [CrossRef]
- Vallon, V.; Komers, R. Pathophysiology of the diabetic kidney. Compr. Physiol. 2011, 1, 1175–1232. [Google Scholar] [CrossRef]
- Tonneijck, L.; Muskiet, M.H.; Smits, M.M.; van Bommel, E.J.; Heerspink, H.J.; van Raalte, D.H.; Joles, J.A. Glomerular Hyperfiltration in Diabetes: Mechanisms, Clinical Significance, and Treatment. J. Am. Soc. Nephrol. 2017, 28, 1023–1039. [Google Scholar] [CrossRef]
- Ravindran, S.; Munusamy, S. Renoprotective mechanisms of sodium-glucose co-transporter 2 (SGLT2) inhibitors against the progression of diabetic kidney disease. J. Cell Physiol. 2022, 237, 1182–1205. [Google Scholar] [CrossRef] [PubMed]
- Cherney, D.Z.; Perkins, B.A.; Soleymanlou, N.; Maione, M.; Lai, V.; Lee, A.; Fagan, N.M.; Woerle, H.J.; Johansen, O.E.; Broedl, U.C.; et al. Renal hemodynamic effect of sodium-glucose cotransporter 2 inhibition in patients with type 1 diabetes mellitus. Circulation 2014, 129, 587–597. [Google Scholar] [CrossRef]
- Oshima, M.; Shimizu, M.; Yamanouchi, M.; Toyama, T.; Hara, A.; Furuichi, K.; Wada, T. Trajectories of kidney function in diabetes: A clinicopathological update. Nat. Rev. Nephrol. 2021, 17, 740–750. [Google Scholar] [CrossRef]
- Yamanouchi, M.; Furuichi, K.; Hoshino, J.; Toyama, T.; Hara, A.; Shimizu, M.; Kinowaki, K.; Fujii, T.; Ohashi, K.; Yuzawa, Y.; et al. Nonproteinuric Versus Proteinuric Phenotypes in Diabetic Kidney Disease: A Propensity Score-Matched Analysis of a Nationwide, Biopsy-Based Cohort Study. Diabetes Care 2019, 42, 891–902. [Google Scholar] [CrossRef] [PubMed]
- Ekinci, E.I.; Jerums, G.; Skene, A.; Crammer, P.; Power, D.; Cheong, K.Y.; Panagiotopoulos, S.; McNeil, K.; Baker, S.T.; Fioretto, P.; et al. Renal structure in normoalbuminuric and albuminuric patients with type 2 diabetes and impaired renal function. Diabetes Care 2013, 36, 3620–3626. [Google Scholar] [CrossRef]
- Yang, Y.; Xu, G. Update on Pathogenesis of Glomerular Hyperfiltration in Early Diabetic Kidney Disease. Front. Endocrinol. 2022, 13, 872918. [Google Scholar] [CrossRef] [PubMed]
- Hung, C.C.; Lin, H.Y.; Lee, J.J.; Lim, L.M.; Chiu, Y.W.; Chiang, H.P.; Hwang, S.J.; Chen, H.C. Glycosuria and Renal Outcomes in Patients with Nondiabetic Advanced Chronic Kidney Disease. Sci. Rep. 2016, 6, 39372. [Google Scholar] [CrossRef]
- Itano, Y.; Sobajima, H.; Ohashi, N.; Shibata, T.; Fujiya, A.; Nagata, T.; Ando, M.; Imaizumi, T.; Kubo, Y.; Ozeki, T.; et al. High urinary glucose is associated with improved renal prognosis in patients with diabetes mellitus. J. Diabetes Investig. 2021, 12, 998–1006. [Google Scholar] [CrossRef]
- Martin-Rodriguez, E.; Guillen-Grima, F.; Martí, A.; Brugos-Larumbe, A. Comorbidity associated with obesity in a large population: The APNA study. Obes. Res. Clin. Pract. 2015, 9, 435–447. [Google Scholar] [CrossRef]
- Chagnac, A.; Weinstein, T.; Korzets, A.; Ramadan, E.; Hirsch, J.; Gafter, U. Glomerular hemodynamics in severe obesity. Am. J. Physiol. Renal Physiol. 2000, 278, F817–F822. [Google Scholar] [CrossRef] [PubMed]
- Henegar, J.R.; Bigler, S.A.; Henegar, L.K.; Tyagi, S.C.; Hall, J.E. Functional and structural changes in the kidney in the early stages of obesity. J. Am. Soc. Nephrol. 2001, 12, 1211–1217. [Google Scholar] [CrossRef]
- Martínez-Montoro, J.I.; Morales, E.; Cornejo-Pareja, I.; Tinahones, F.J.; Fernández-García, J.C. Obesity-related glomerulopathy: Current approaches and future perspectives. Obes. Rev. 2022, 23, e13450. [Google Scholar] [CrossRef]
- Epstein, M.; Freundlich, M. The intersection of mineralocorticoid receptor activation and the FGF23-Klotho cascade: A duopoly that promotes renal and cardiovascular injury. Nephrol. Dial. Transplant. 2022, 37, 211–221. [Google Scholar] [CrossRef] [PubMed]
- Epstein, M.; Kovesdy, C.P.; Clase, C.M.; Sood, M.M.; Pecoits-Filho, R. Aldosterone, Mineralocorticoid Receptor Activation, and CKD: A Review of Evolving Treatment Paradigms. Am. J. Kidney Dis. 2022, 80, 658–666. [Google Scholar] [CrossRef] [PubMed]
- Jardine, M.; Zhou, Z.; Lambers Heerspink, H.J.; Hockham, C.; Li, Q.; Agarwal, R.; Bakris, G.L.; Cannon, C.P.; Charytan, D.M.; Greene, T.; et al. Kidney, Cardiovascular, and Safety Outcomes of Canagliflozin according to Baseline Albuminuria: A CREDENCE Secondary Analysis. Clin. J. Am. Soc. Nephrol. CJASN 2021, 16, 384–395. [Google Scholar] [CrossRef]


| Overall (n = 58) | Non-Responder <30% (n = 26) | Responder ≥30% (n = 32) | p | |
|---|---|---|---|---|
| Age years | 66.1 ± 10.5 | 68.7 ± 10.6 | 64.1 ± 10.1 | 0.094 |
| Male gender. % | 77.6 | 84.6 | 71.8 | 0.247 |
| Diabetes duration. years | 15.0 [7.83–22.2] | 12.1 [7.4–22.37] | 15.5 [8.3–19.1] | 0.580 |
| BMI. Kg/m2 | 28.9 ± 4.4 | 29.1 ± 5.1 | 28.8 ± 3.8 | 0.843 |
| CVD. % | 44.8 | 57.7 | 34.4 | 0.076 |
| Retinopathy. % | 38.0 | 25.0 | 50.0 | 0.069 |
| SBP. mmHg | 130 ± 16 | 131 ± 16 | 130 ± 16 | 0.717 |
| DBP. mmHg | 79 ± 8 | 80 ± 9 | 79 ± 8 | 0.823 |
| eGFR. mL/min/1.73 m2 | 57.8 ± 22.2 | 53.3 ± 18.5 | 61.4 ± 24.5 | 0.165 |
| Glycated haemoglobin. mmol/mol | 56.3 ± 11.0 | 55.2 ± 10.9 | 57.2 ± 11.1 | 0.506 |
| Cholesterol. mg/dL | 178 ± 49 | 173 ± 49 | 182 ± 49 | 0.543 |
| LDL cholesterol. mg/dL | 106 ± 37 | 105 ± 42 | 107 ± 33 | 0.841 |
| Triglycerides. mg/dL | 157 [113–208] | 174 [109–219] | 138 [120–201] | 0.649 |
| uProt. mg/24 h | 1170 [360–2800] | 449 [168–1680] | 1393 [918–2920] | 0.010 |
| SGLT2i. n [%] | 0.144 | |||
| -Dapaglifozin | 35 [60.3] | 13 [37.2] | 22 [62.8] | |
| -Empaglifozin | 11 [19.0] | 8 [72.7] | 3 [27.3] | |
| -Canaglifozin | 10 [17.2] | 5 [50.0] | 5 [50.0] | |
| -Ertuglifozin | 2 [3.4] | 0 [0.0] | 2 [100.0] | |
| RAAS-inhibitors. % pts | 89.7 | 88.5 | 90.6 | 0.788 |
| Insulin, % pts | 37.9 | 34.6 | 40.6 | 0.639 |
| DPP4, % pts | 19.0 | 19.2 | 18.8 | 0.963 |
| GLP1RA, % pts | 31.0 | 34.6 | 28.1 | 0.595 |
| Methformin, % pts | 55.2 | 61.5 | 50.0 | 0.380 |
| BP-lowering drugs, n | 2.1 ± 1.1 | 2.2 ± 1.1 | 2.1 ± 1.1 | 0.750 |
| Univariate | Multivariate | |||||
|---|---|---|---|---|---|---|
| Characteristic | Beta | 95% CI | p-Value | Beta | 95% CI | p-Value |
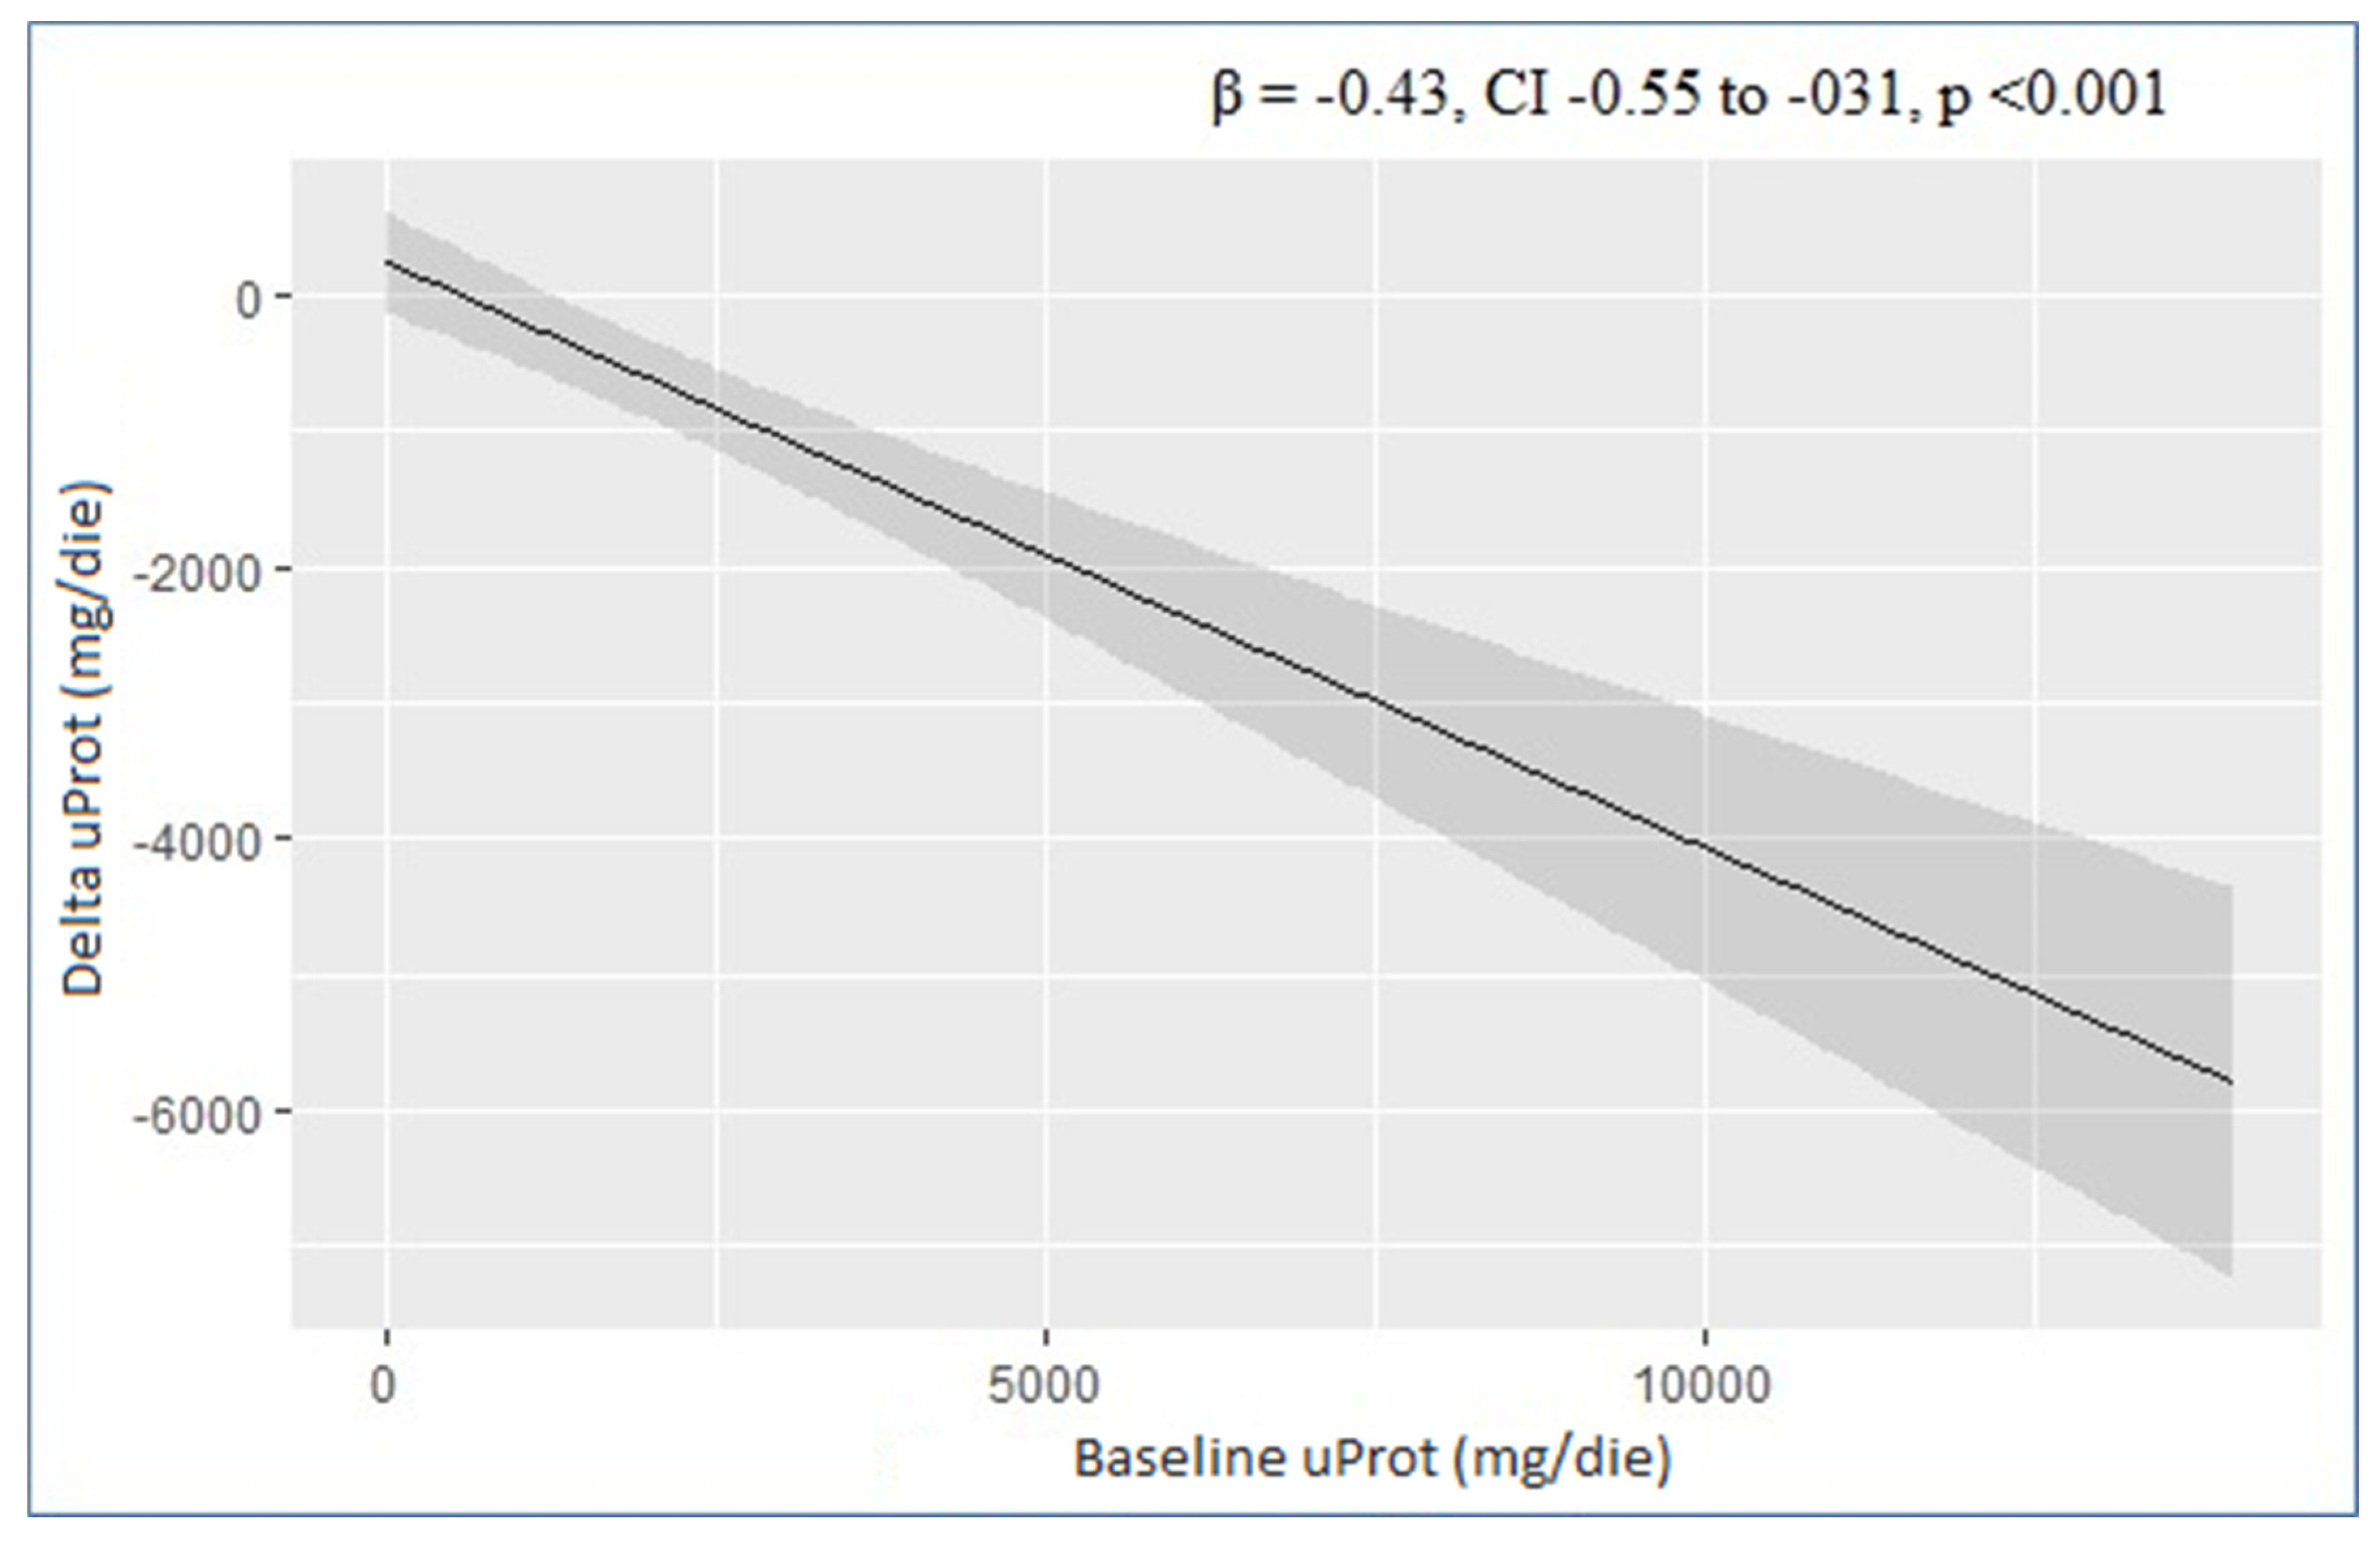
| uProt (mg/24 h) | −0.43 | −0.55, −0.31 | <0.001 | −0.46 | −0.57, −0.35 | <0.001 |
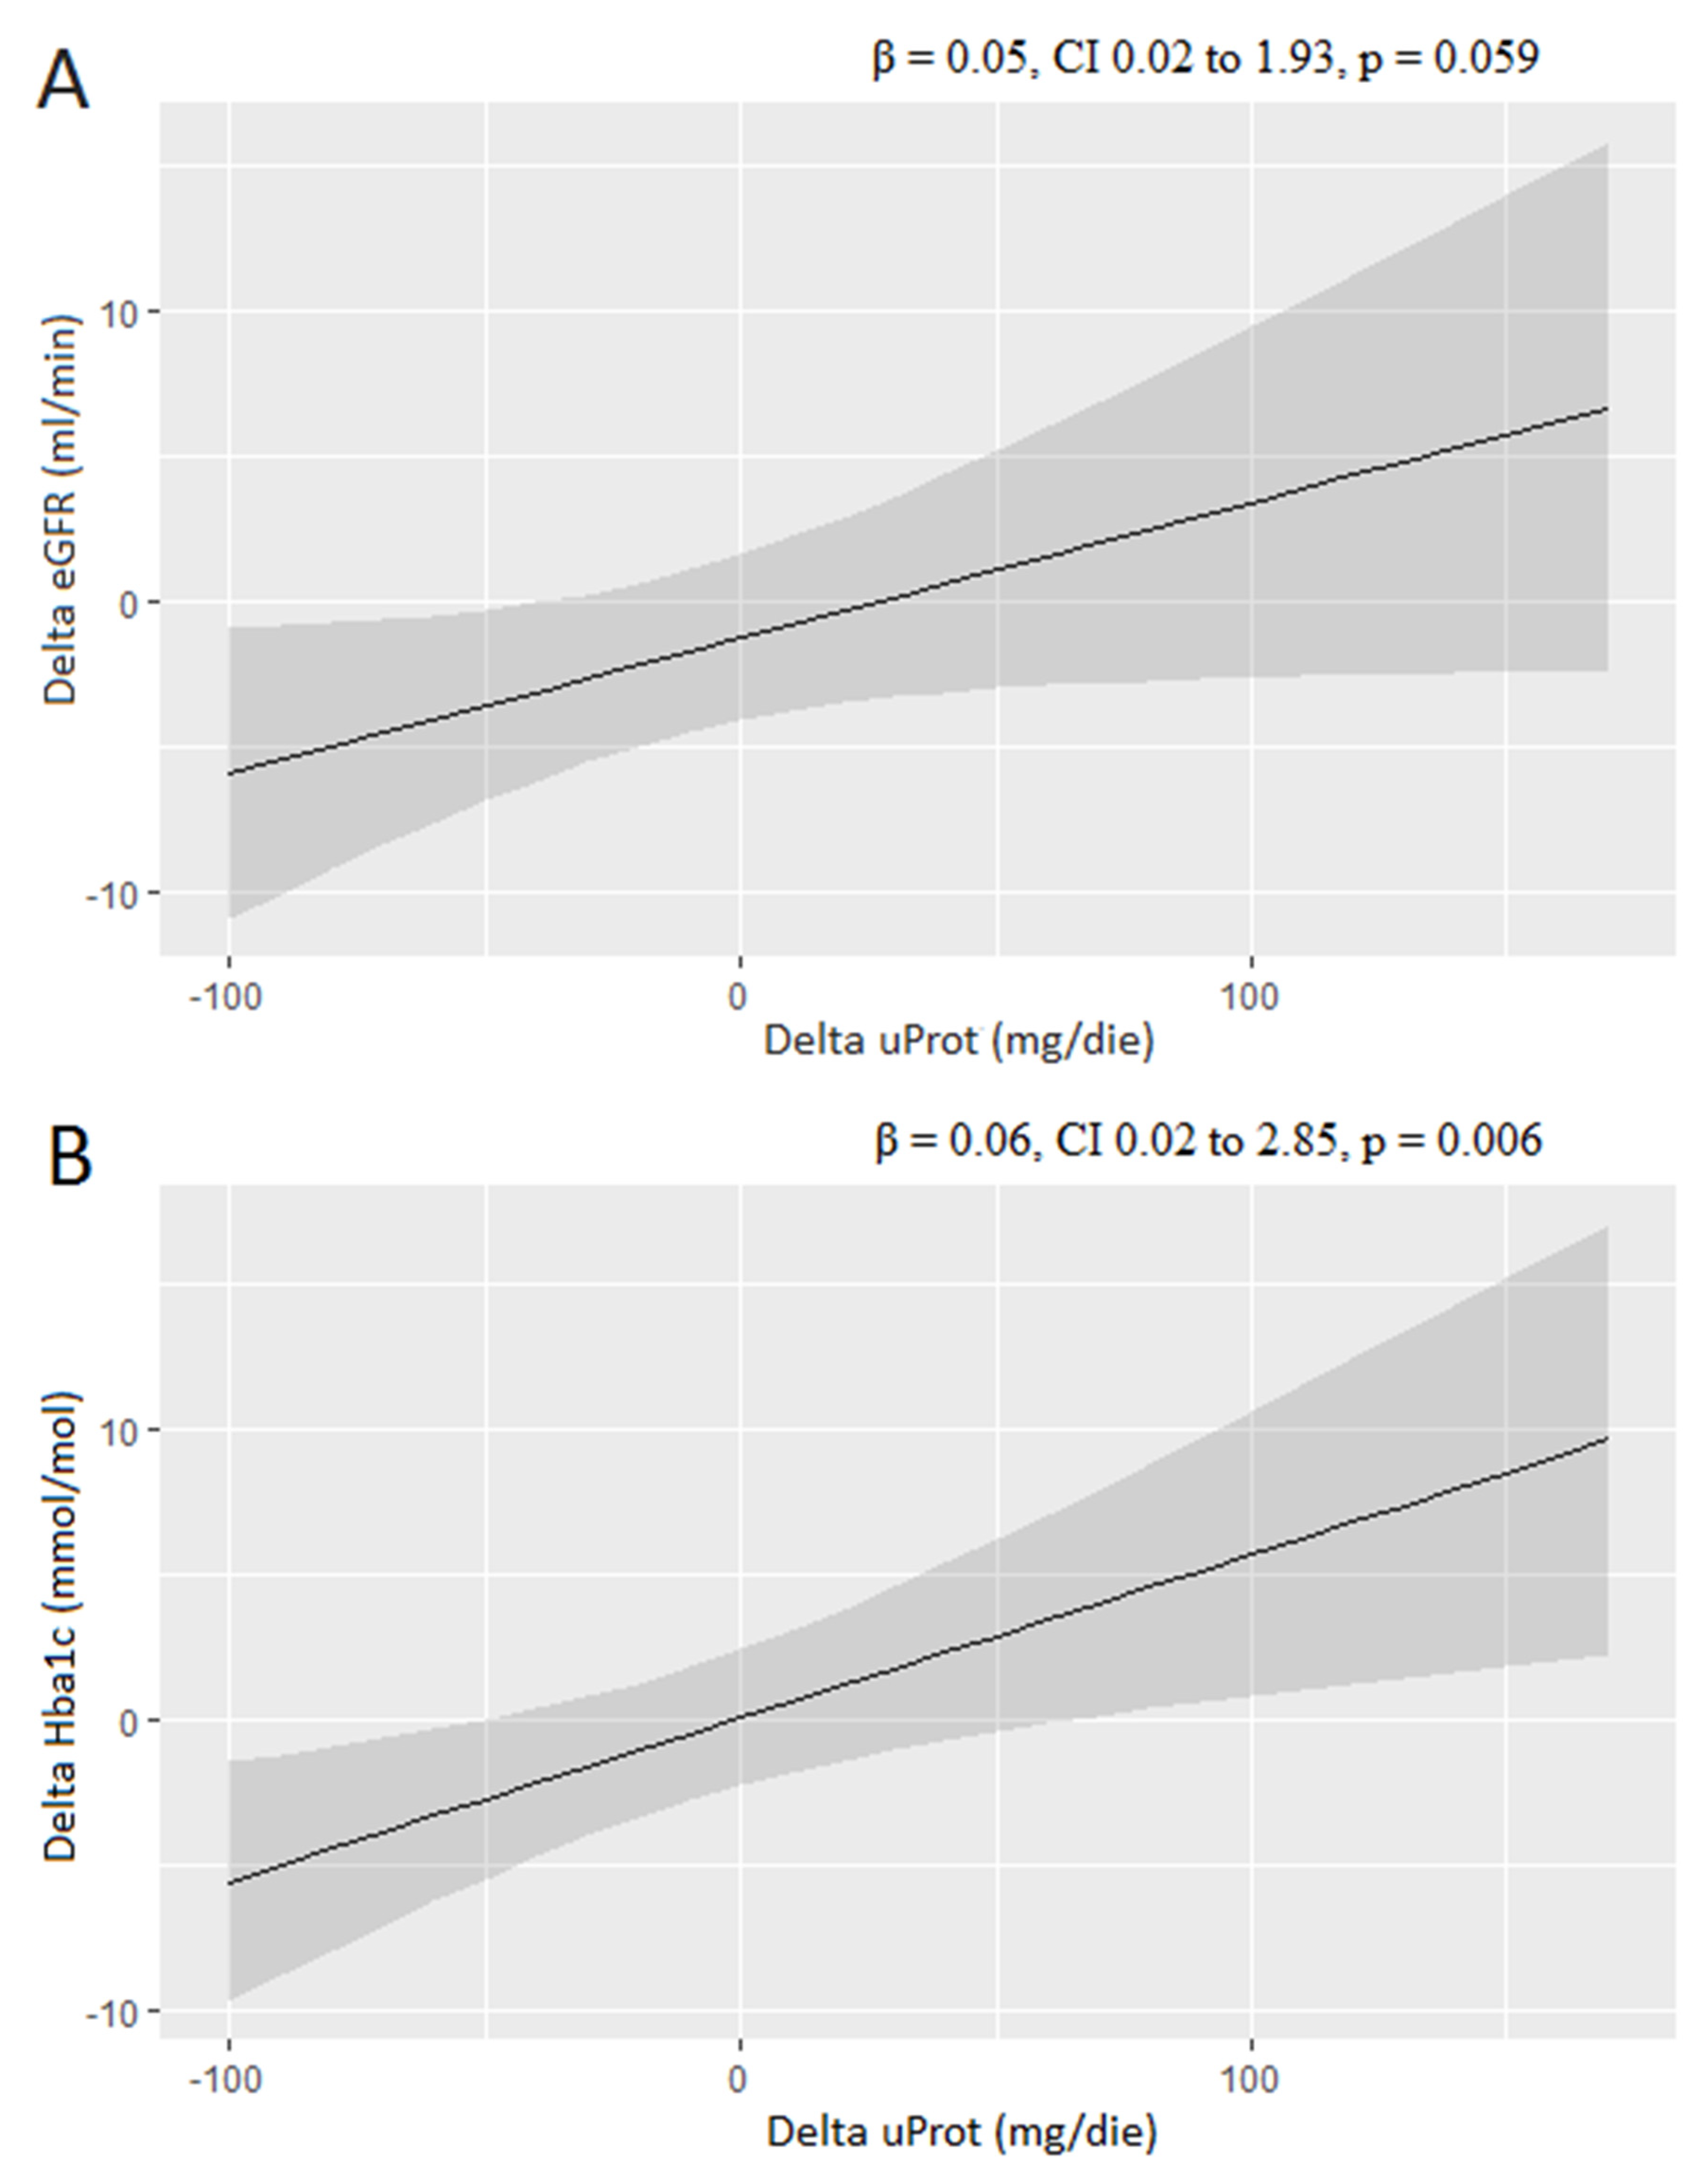
| eGFR (mL/min/1.73 m2) | −10 | −29, 8.5 | 0.3 | −17 | −31, −3.3 | 0.016 |
| BMI (kg/m2) | 50 | −49, 149 | 0.3 | 81 | 13, 150 | 0.021 |
| Hba1c (mmol/mol) | 19 | −19, 58 | 0.3 | 13 | −15, 40 | 0.4 |
| Age (years) | −3.6 | −44, 37 | 0.9 | −14 | −44, 15 | 0.3 |
| Univariate | Multivariate | |||||
|---|---|---|---|---|---|---|
| Characteristic | OR | 95% CI | p-Value | OR | 95% CI | p-Value |
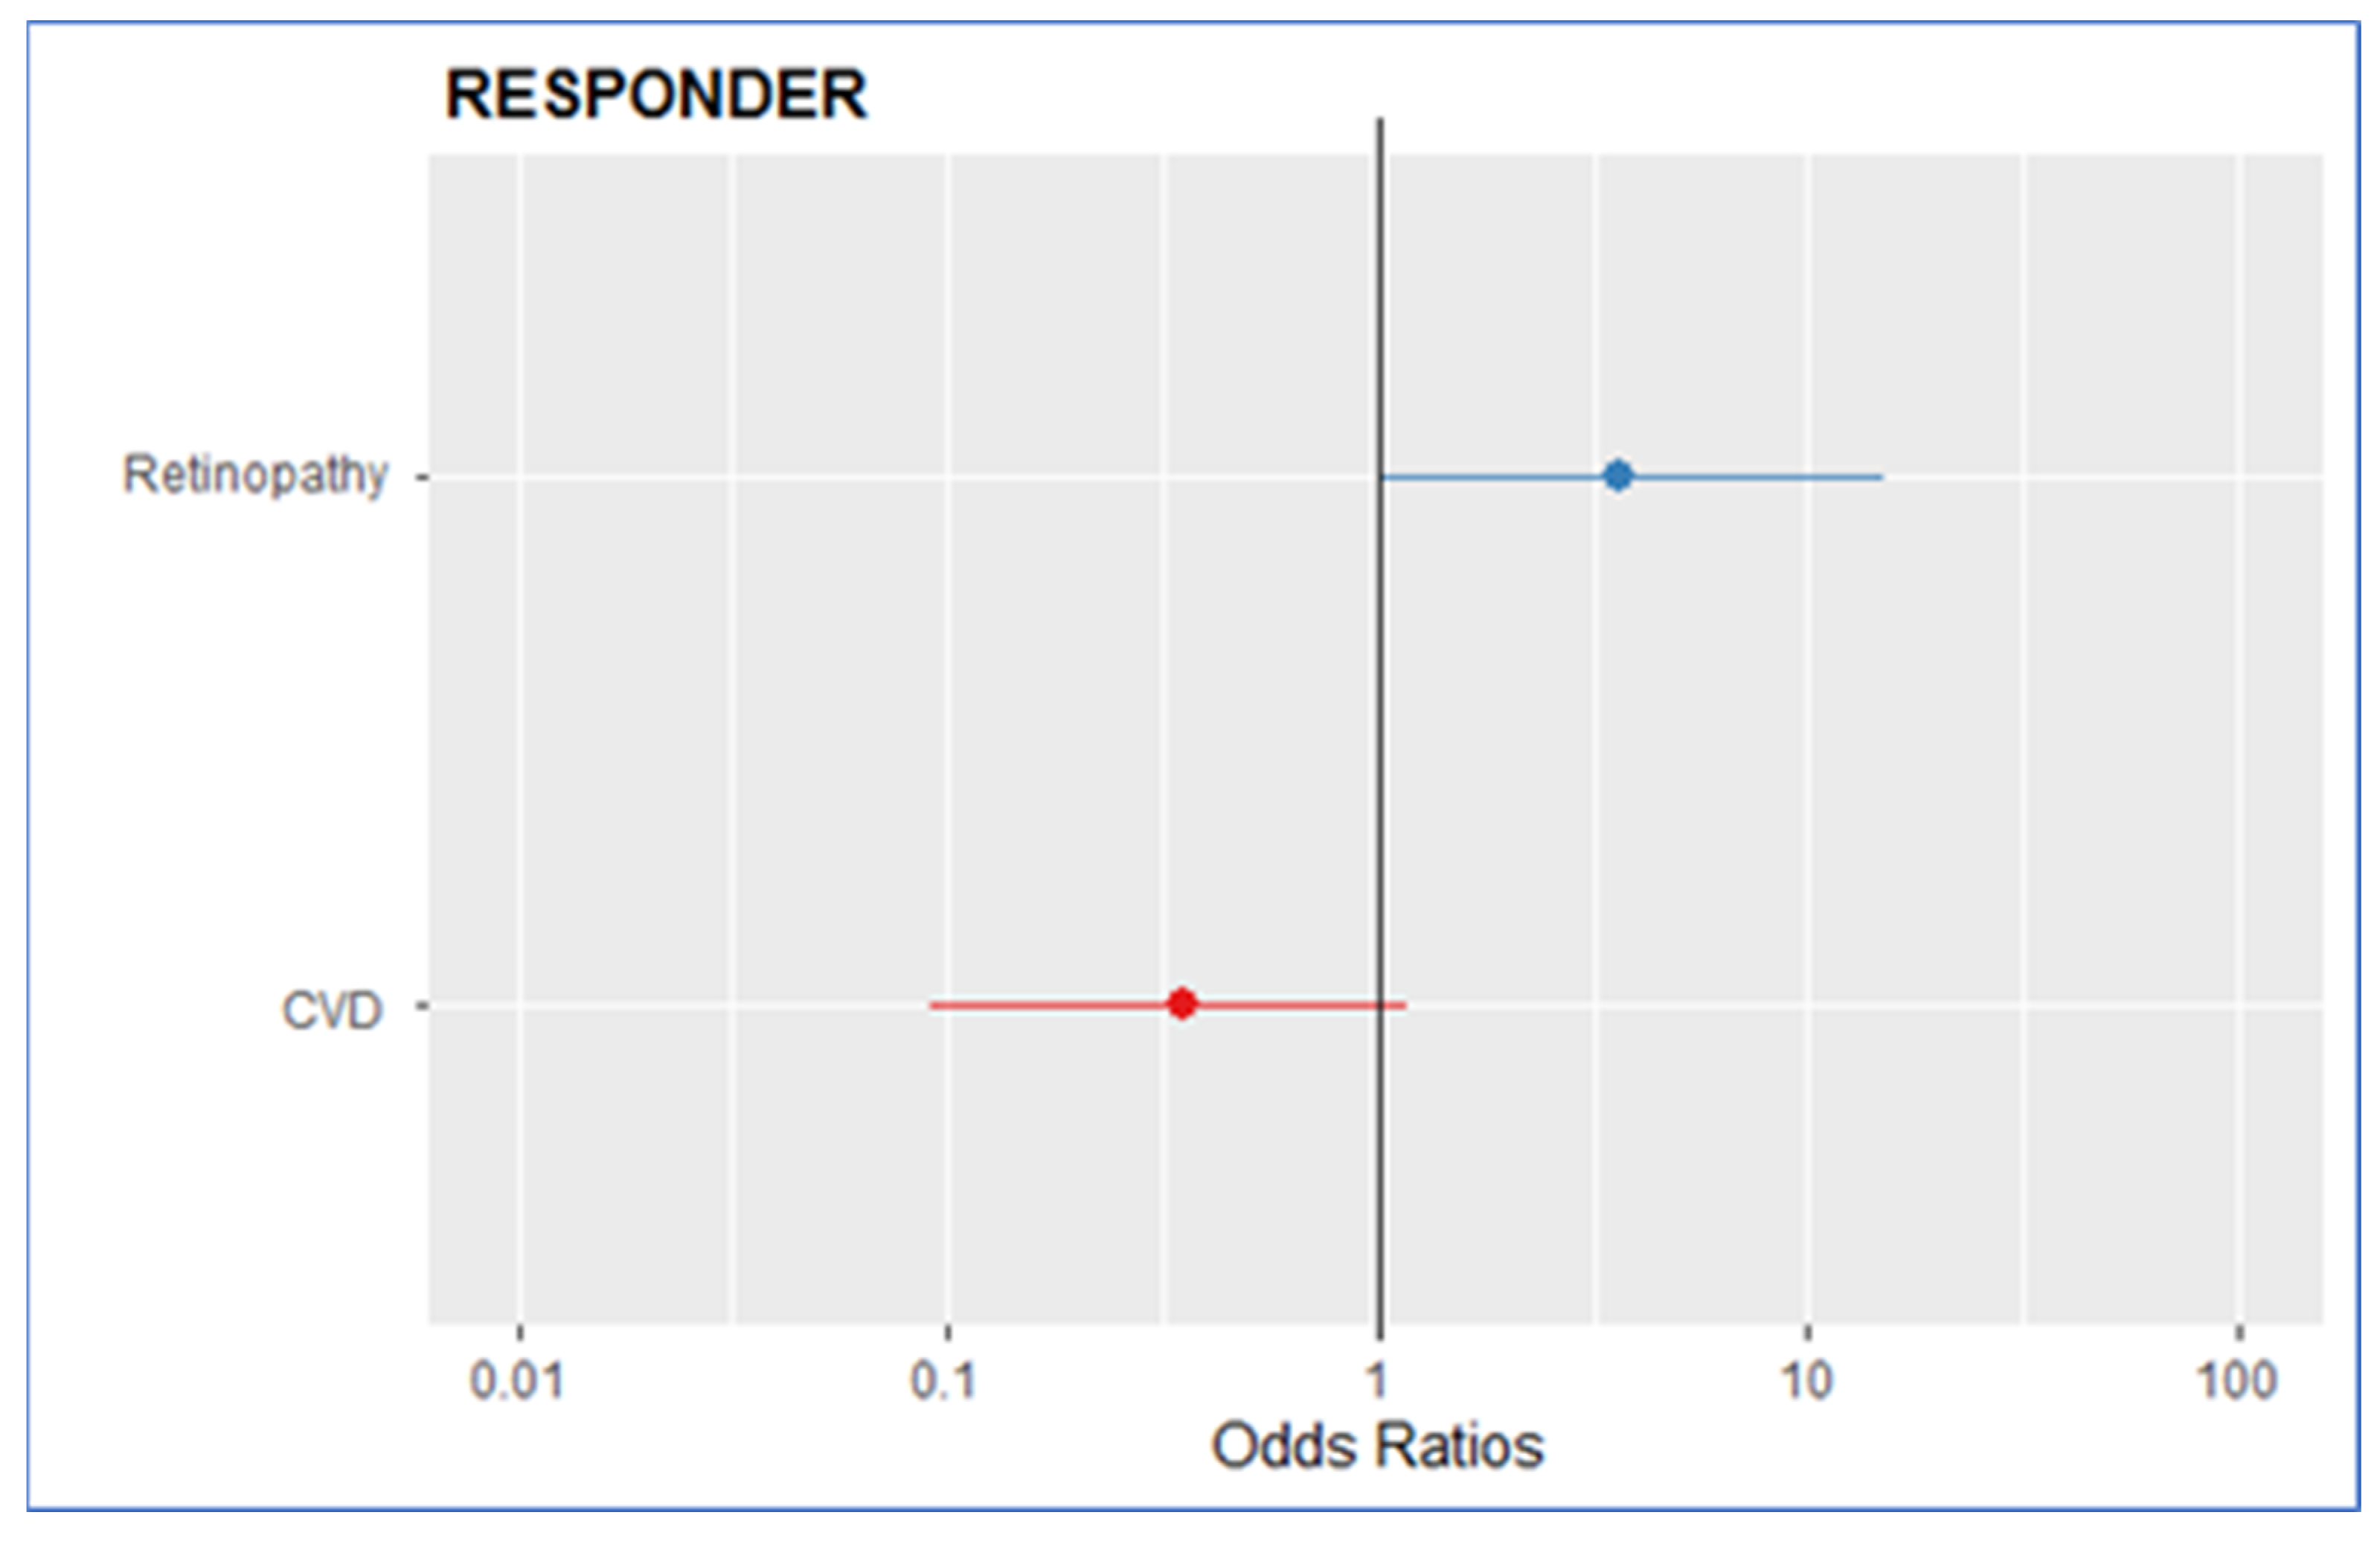
| CVD | 0.40 | 0.13, 1.17 | 0.09 | 0.34 | 0.09, 1.22 | 0.1 |
| Retinopathy | 2.76 | 0.82, 9.30 | 0.09 | 3.65 | 0.97, 13.58 | 0.054 |
| Overall (n = 58) | Non-Responder <30% (n = 26) | Responder ≥30% (n = 32) | p | |
|---|---|---|---|---|
| BMI. Kg/m2 | 29.56 ± 6.56 | 28.10 ± 4.63 | 30.73 ± 7.65 | 0.104 |
| Hba1c. mmol/mol | 55.80 ± 11.41 | 57.54 ± 12.64 | 54.30 ± 10.21 | 0.554 |
| eGFR. mL/min | 55.84 ± 21.38 | 55.09 ± 19.35 | 56.47 ± 23.24 | 0.743 |
| ΔBMI. % | −1.83 [−3.89, 0.53] | −0.64 [−3.54, 0.61] | −2.16 [−4.02, 0.36] | 0.782 |
| ΔHba1c. % | −1.72 [−10.50, 11.11] | 3.70 [−6.39, 13.11] | −5.97 [−10.87, 4.88] | 0.052 |
| ΔeGFR. % | −2.55 [−11.92, 7.89] | 2.31 [−5.93, 8.05] | −10.43 [−16.59, 2.54] | 0.017 |
Disclaimer/Publisher’s Note: The statements, opinions and data contained in all publications are solely those of the individual author(s) and contributor(s) and not of MDPI and/or the editor(s). MDPI and/or the editor(s) disclaim responsibility for any injury to people or property resulting from any ideas, methods, instructions or products referred to in the content. |
© 2023 by the authors. Licensee MDPI, Basel, Switzerland. This article is an open access article distributed under the terms and conditions of the Creative Commons Attribution (CC BY) license (https://creativecommons.org/licenses/by/4.0/).
Share and Cite
Capelli, I.; Ribichini, D.; Provenzano, M.; Vetrano, D.; Aiello, V.; Cianciolo, G.; Vicennati, V.; Tomassetti, A.; Moschione, G.; Berti, S.; et al. Impact of Baseline Clinical Variables on SGLT2i’s Antiproteinuric Effect in Diabetic Kidney Disease. Life 2023, 13, 1061. https://doi.org/10.3390/life13041061
Capelli I, Ribichini D, Provenzano M, Vetrano D, Aiello V, Cianciolo G, Vicennati V, Tomassetti A, Moschione G, Berti S, et al. Impact of Baseline Clinical Variables on SGLT2i’s Antiproteinuric Effect in Diabetic Kidney Disease. Life. 2023; 13(4):1061. https://doi.org/10.3390/life13041061
Chicago/Turabian StyleCapelli, Irene, Danilo Ribichini, Michele Provenzano, Daniele Vetrano, Valeria Aiello, Giuseppe Cianciolo, Valentina Vicennati, Alessandro Tomassetti, Ginevra Moschione, Sabrina Berti, and et al. 2023. "Impact of Baseline Clinical Variables on SGLT2i’s Antiproteinuric Effect in Diabetic Kidney Disease" Life 13, no. 4: 1061. https://doi.org/10.3390/life13041061
APA StyleCapelli, I., Ribichini, D., Provenzano, M., Vetrano, D., Aiello, V., Cianciolo, G., Vicennati, V., Tomassetti, A., Moschione, G., Berti, S., Pagotto, U., & La Manna, G. (2023). Impact of Baseline Clinical Variables on SGLT2i’s Antiproteinuric Effect in Diabetic Kidney Disease. Life, 13(4), 1061. https://doi.org/10.3390/life13041061