Abstract
The ratio of fast- and slow-twitch fibers in human skeletal muscle is variable and largely determined by genetic factors. In this study, we investigated the contribution of microRNA (miRNA) in skeletal muscle fiber type composition. The study involved biopsy samples of the vastus lateralis muscle from 24 male participants with distinct fiber type ratios. The miRNA study included samples from five endurance athletes and five power athletes with the predominance of slow-twitch (61.6–72.8%) and fast-twitch (69.3–80.7%) fibers, respectively. Total and small RNA were extracted from tissue samples. Total RNA sequencing (N = 24) revealed 352 differentially expressed genes between the groups with the predominance of fast- and slow-twitch muscle fibers. Small RNA sequencing showed upregulation of miR-206, miR-501-3p and miR-185-5p, and downregulation of miR-499a-5p and miR-208-5p in the group of power athletes with fast-twitch fiber predominance. Two miRtronic miRNAs, miR-208b-3p and miR-499a-5p, had strong correlations in expression with their host genes (MYH7 and MYH7B, respectively). Correlations between the expression of miRNAs and their experimentally validated messenger RNA (mRNA) targets were calculated, and 11 miRNA–mRNA interactions with strong negative correlations were identified. Two of them belonged to miR-208b-3p and miR-499a-5p, indicating their regulatory links with the expression of CDKN1A and FOXO4, respectively.
1. Introduction
Skeletal muscle is a highly plastic tissue composed of fiber types, which differ in structure, molecular composition and functional properties. Adult skeletal muscle fibers are broadly classified as slow-twitch (type I) and fast-twitch (types IIa and IIx). Type I and IIa fibers primarily use oxidative metabolism, while type IIx are more reliant on glycolytic metabolism [1,2]. The basis of molecular and functional heterogeneity of human muscle fibers can be identified in the diversity of protein composition and gene expression patterns [3]. Distinct mechanical and energetic properties of skeletal muscle fibers are due to differences in the molecular composition of myofibrils, the intracellular structures containing the molecular motor of muscle contraction. Fast and slow muscle fibers have differences in the expression of myofibrillar protein isoforms, myosin binding proteins, thin filament proteins, nebulin and actin-binding proteins [4,5,6,7,8]. Differences are also found in the expression of proteins associated with excitability and excitation–contraction coupling, electrical membrane properties and ion channels, calcium release and energy production systems [7,9]. The main techniques for muscle fiber typing are histochemical staining for myosin ATPase, myosin heavy chain isoform identification and biochemical identification of metabolic enzymes [10].
The heterogeneity of muscle fiber composition is likely to have an impact on individual response to exercise training. The ratio of fast- and slow-twitch fibers in human skeletal muscle tissue is variable and largely determined by genetic factors [11,12]. There are many inherited myopathies and other acquired muscle-related disorders, which preferentially affect specific skeletal muscle fiber types [13]. At the same time, some studies indicate that the type of physical activity as well as its reduction can slightly shift the fiber type composition [13,14,15,16]. The predominance of endurance training induces the transition from fast-twitch to slow-twitch muscle fiber, whereas power training has the opposite effect [2,14,17]. Various components of calcium-dependent signaling pathways and multiple transcription factors, coactivators and corepressors have been shown to be involved in skeletal muscle remodeling [18]. Fiber type shifting is regulated by myogenic regulatory factors (MYF5, MYOD, myogenin and MRF4), myocyte enhancer factor-2 (MEF2), calcineurin and nuclear factor of activated T cells (NFAT), peroxisome proliferator-activated receptor (PPAR)-γ coactivator-1α (PGC-1α), Ca2+-dependent transcription factor and transient receptor potential melastatin (TRPM2)-mediated Ca2+ signaling [2,17,19,20,21,22,23].
Non-coding RNAs are well known to participate in a variety of important regulatory processes in myogenesis. One of the tools for regulating gene expression is post-transcriptional regulation by microRNAs (miRNAs)—a class of highly conserved single-stranded non-coding RNAs with a length of 21–24 nucleotides. Their function is realized by directly degrading messenger RNA (mRNA) of target genes or inhibiting target gene translation. Thus, miRNAs orchestrate the regulation of their targets to control the signaling pathways and common biological functions. In recent years, a number of studies have highlighted the importance of miRNAs in the control of skeletal muscle development and function through their influence on multiple biological signaling pathways, which are important for skeletal muscle homeostasis [24,25]. Alteration of the expression of many miRNAs or genetic mutations of miRNA genes are associated with changes in myogenesis and the progression of several skeletal muscle diseases [26]. A group of miRNAs known as myomiRs includes muscle-specific or muscle-enriched miRNA species, namely miR-1, miR-133a/b, miR-206, miR-208a/b, miR-486 and miR-499, which play a crucial role in myogenesis and muscle function [27,28,29,30]. This role is implemented in various forms of interaction between miRNAs and gene expression. Generally, some miRNAs are seen as playing key roles during myogenesis, e.g., miR-1/miR-206 or miR-133, while others likely constitute a kind of muscle property “fine-tuner”, including, e.g., miR-208a/b, which influences muscle performance by myosin switching [28,31]. The expression of some myomiRs is controlled by a set of muscle-specific transcription factors and cofactors, referred to as myogenic regulatory factors (MRFs) [29,32]. Some myomiRs are intragenic, and their expression rate primarily depends on that of their host gene. Three myosin genes, MYH6, MYH7 and MYH7B, encode related miRNAs (miR-208a, miR-208b and miR-499, respectively) within their introns, which, in turn, control muscle myosin content, myofiber identity and muscle performance [33]. MyomiRs are expressed in both cardiac and skeletal muscle, with the exception of miR-206, which is skeletal-muscle-specific, and miR-208a, which is cardiac-muscle-specific.
Fiber types are a conserved feature of vertebrate muscle, and differential expression of miRNAs has been previously found between fast and slow fibers in various vertebrate species. In fish, the expression of miR-499 was increased in slow fibers of pacu (Piaractus mesopotamicus) [34]. In both fast and slow fibers, the expression of miR-1, miR-133a/b and miR-206 increased during fish growth. At the same time, the expression of their potential target genes involved in myogenesis (hdac4, srf and pax7, respectively) decreased with growth. Analysis of miRNA expression in bovine skeletal muscle by massively parallel sequencing found increased expression of miR-1, miR-133a/b and miR-206, and decreased expression of miR-208a in fast-type muscles compared to slow-type ones [35]. In recent studies, RNA sequencing has been applied to analyze transcriptomic differences and miRNA–mRNA interactions between muscles with a prevalence of fast and slow fibers in chickens, horses and donkeys [36,37,38]. In horses, the expression of miR-499 and miR-206 was elevated in muscles with a predominance of slow fibers. The authors suggest a co-regulatory model of regulating the proportion of fast and slow fiber types based on the interactions of Sox6 with Myh7b and myomiRs [37]. In donkeys, miR-208a and miR-499-3p were among the upregulated miRNAs in muscles with a predominance of slow fibers [38]. The common factor in all of the above vertebrate skeletal muscle miRNA studies is that the expression of either miR-499-3p/5p or miR-208a/b was elevated in muscles with a predominance of slow fibers. This is in agreement with previous research on mice showing a potential role of these myomiRs in the specification of muscle fiber identity by activating slow and repressing fast myofiber gene programs [33]. However, there have been no studies so far on the differences in miRNA profiles in human skeletal muscle with different fiber type composition.
This study first uses integrated miRNome and transcriptome analysis to compare human skeletal muscle tissue samples with different ratios of fast- and slow-twitch fibers. This is a preliminary exploratory study focused on the possible miRNA regulation of muscle transcriptional activity as part of a global multi-omics research project on the regulation of gene expression in human skeletal muscle. We investigated human m. vastus lateralis biopsy samples of athletes with a preference for power or endurance exercise. By obtaining complete miRNA profiles, we showed miRNA diversity in skeletal muscle and found differences in miRNA expression between samples with a predominance of fast- and slow-twitch fibers. We first described the miRNA isoform composition in human skeletal muscle samples. Connecting transcriptomic data to the analysis, we analyzed the expression of key genes specific to different fiber types, showed the association between miRNAs and gene expression in skeletal muscle and suggested the extent to which miRNAs may be involved in regulating the fiber type composition.
2. Materials and Methods
2.1. Participants and Ethical Approval
For this study, physically active male participants of Russian origin with the predominance of slow-twitch or fast-twitch fibers in the vastus lateralis skeletal muscle of more than 60% were selected from the previously reported muscle biopsy study (N = 151) [39]. The study was approved by the local ethics committee, and written informed consent was obtained from each study participant.
2.2. Muscle Biopsy Preparation
Samples of the vastus lateralis muscle were obtained with the Bergström needle biopsy procedure with aspiration under local anesthesia with 2% lidocaine solution. Biopsy samples were placed in screw-cap freezing tubes, immediately snap-frozen in liquid nitrogen and stored at −80 °C. The samples were further divided without thawing into two parts for muscle fiber typing and for RNA isolation.
2.3. Evaluation of Muscle Fiber Composition
Serial cross-sections (7 μm) were obtained from frozen samples using a microtome (Leica Microsystems, Wetzlar, Germany). The sections were thaw-mounted on polylysine glass slides, and myosin heavy chain (MHC) isoforms were identified by immunohistochemical analysis, as previously described [40]. Fibers stained in serial sections with antibodies against slow and fast isoforms were considered as hybrid fibers. The fiber cross-sectional area was evaluated using ImageJ software (version 1.38, NIH, Bethesda, Montgomery County, MD, USA). The percentage of fast and slow muscle fibers was calculated as the ratio of the number of stained fibers to the total fiber number. Examples of images of muscle sections for samples with a predominance of fast- and slow-twitch fibers are shown in Figure A1, Appendix A.
RNeasy Mini Fibrous Tissue Kit (Qiagen, Hilden, Germany) was used to isolate RNA from muscle tissue samples. Frozen tissue samples were placed in a box submerged in liquid nitrogen. Each sample was transferred without thawing on a sterile Petri dish placed on a frozen plastic ice pack. A piece of tissue with a weight of 10 mg was separated with a sterile scalpel and immediately placed in a 2 mL safe-lock microcentrifuge tube containing 300 µL of lysis buffer and one sterile stainless-steel bead with a diameter of 4 mm. Samples were homogenized using the TissueLyser II system (Qiagen, Hilden, Germany) by shaking twice for 2 min at 25 Hz. RNA samples were isolated according to the manufacturer’s guidelines. RNA concentration was measured using the Qubit spectrophotometer (Thermo Fisher Scientific, Waltham, MA, USA). RNA quality was assessed using the BioAnalyzer electrophoresis system and the BioAnalyzer RNA Nano assay (Agilent Technologies, Santa Clara, CA, USA). RNA integrity number (RIN) was calculated for each RNA sample. Only RNA samples with RIN > 7 were included in the study. Samples were stored at −80 °C until sequencing libraries were prepared.
2.4. Small RNA Isolation
MiRNeasy Mini Kit (Qiagen, Hilden, Germany) was used to isolate small RNA from muscle tissue samples. Tissue samples were prepared in the same way as for total RNA isolation. Each sample was immediately placed in a 2 mL safe-lock microcentrifuge tube containing 700 µL of QIAzol buffer and one sterile stainless-steel bead with a diameter of 4 mm. Samples were homogenized using the TissueLyser II system (Qiagen, Hilden, Germany) by shaking twice for 2 min at 25 Hz. RNA samples were isolated according to the miRNeasy Mini Kit guidelines. RNA concentration was measured using the Qubit spectrophotometer (Thermo Fisher Scientific, Waltham, MA, USA). The presence of small RNA fraction was assessed using the BioAnalyzer electrophoresis system and the BioAnalyzer Small RNA assay (Agilent Technologies, Santa Clara, CA, USA). Samples were stored at −80 °C until sequencing libraries were prepared.
2.5. Total RNA Sequencing
Total RNA samples were treated with the DNAse I using Turbo DNA-free Kit (Thermo Fisher Scientific, Waltham, MA, USA) according to the kit guidelines. Libraries for RNA sequencing (RNA-seq) were prepared using the NEBNext Ultra II Directional RNA Library Prep Kit for Illumina with the NEBNext rRNA Depletion Module (New England Biolabs, Ipswich, MA, USA). RNA libraries were sequenced on the HiSeq system (Illumina, San Diego, CA, USA) in a paired-end mode with the read length of 125.
2.6. Small RNA Sequencing
Libraries for small RNA sequencing were prepared using the NEBNext Small RNA Library Prep Set for Illumina (New England Biolabs, Ipswich, MA, USA). The amount of RNA for library preparation varied from ~300 to ~450 ng. Size selection of libraries was performed using the AMPure XP magnetic beads (Beckman Coulter Life Sciences, Brea, CA, USA). The libraries’ size and quantity were assessed using the BioAnalyzer electrophoresis system and the BioAnalyzer DNA HS assay (Agilent Technologies, Santa Clara, CA, USA). Libraries were pooled in an equimolar ratio and sequenced using the MiSeq system (Illumina, San Diego, CA, USA) in a single-end mode with the read length of 50.
2.7. Data Analysis
For the whole transcriptome analysis, quality control by FastQC [41] and MultiQC [42] was performed before and after adapter trimming by Cutadapt (version 3.3) [43] and quality filtering by trimmomatic (version 0.39) [44] for the whole dataset. Pseudoalignment was performed by salmon [45] for GRCh38 reference and Gencode.v37 transcriptome without alt haplotypes. Summarizing of the gene was performed by tximport [46] ignoring the transcripts’ version. The expression and dispersion of genes and transcripts were estimated by edgeR (version 3.28.1) [47] with offset scaling following the tximport approach. Differential expression for the whole transcriptome was realized by the quasi-likelihood F-test with FDR-adjusted p-values < 0.05 and |FC| > 1.5. For further analysis, CPM data from edgeR were used through filtering by maximal mean in any group > 4 CPM. Principal component analysis (PCA) was realized by PCAtools (version 2.6.0) on log2 transformed CPM by removing genes with the lowest 10% variance [48]. Volcano plots were plotted with ggplot2 (version 3.3.3) [49].
For the small RNA sequencing data, quality control by FastQC [41] and MultiQC [42] was performed before and after adapter and quality trimming by Cutadapt (version 1.18) [43]. QuickMIRSeq pipeline was used for miRNA sequencing analysis [50]. Reads with lengths of less than 16 and more than 28 were removed. Reads were mapped to the miRBase version 21 to obtain the read counts and RPM values for each miRNA. An optional “Remapping” step was used to map miRNA sequences with mismatches to the reference human genome to reduce the number of likely false positives. Potentially noisy reads were filtered out by removing reads with an average number per sample of 2 or less and missing in at least 90% of samples. IsomiR analysis was performed based on the QuickMIRSeq data. Differential expression analysis of miRNAs was conducted using EdgeR (version 3.36.0) [51]. The method of the trimmed mean of M-values (TMM) was applied for the normalization of the library sizes. TMM-normalized counts per million (CPM) data from edgeR were used through filtering by maximal mean in any group > 10 CPM. Differentially expressed miRNAs among the study groups were identified using the quasi-likelihood F-test with FDR-adjusted p-values < 0.05 and absolute log2FC values > 1. In all comparisons, the fold change (FC) refers to the ratio of expression in fast fibers relative to slow fibers (type2/type1). PCA was performed by the PCAtools R package (version 2.6.0) [48] using non-scaled TMM-normalized log2CPM values.
Transcription factor analysis was performed with the ChIP-X Enrichment Analysis 3 (ChEA3) online tool [52].
To find correlations between the expression of miRNAs and their host or target genes, Spearman correlations and corresponding two-sided p-values were calculated using matCorr and matCorSig functions of the DGCA R package (version 1.0.2) [53]. The targets for miRNAs were found according to the miRTarBase [54], considering only interactions that were experimentally validated by at least three different methods: reporter assay, Western blot and qPCR. The permutation p-values for the correlations were obtained by means of 1000 permutations between samples and calculating the fraction of the absolute values of correlations, which were at least as extreme as those obtained from the original data.
3. Results
3.1. Muscle Fiber Composition in the Study Groups
The gene expression study cohort collected for the whole transcriptome analysis (N = 24, mean age ± SD: 32.7 ± 8.9 years) included two groups of equal size with a predominance of slow-twitch or fast-twitch fibers in the vastus lateralis skeletal muscle samples. The first group (type1, n = 12; mean age ± SD: 35.0 ± 10.1 years) included physically active individuals or endurance athletes with a predominance of slow-twitch muscle fibers (60.8–94.1%, mean ± SD: 72.5 ± 9.5%). The second group (type2, n = 12; mean age ± SD: 30.9 ± 7.4 years) included physically active individuals or power athletes with a predominance of fast-twitch muscle fibers (64.5–80.7%, mean ± SD: 69.8 ± 4.5%). The metadata for these groups are provided in Table A1, Appendix A.
For the miRNA study, ten male athletes under the age of 40 years were selected from the gene expression study cohort. Five endurance athletes with a predominance of slow-twitch muscle fibers of more than 60% (61.6–72.8%) were selected from the type1 group. Five power athletes with a predominance of fast-twitch muscle fibers of more than 69% (69.3–80.7%) were selected from the type2 group. The age, height, weight and training background of the participants are presented in Table 1. As expected, the proportion of slow-twitch muscle fibers was significantly (p < 0.0001) higher in endurance athletes (68.4 ± 5.0%, range 61.6–72.8%) compared to power athletes (30.3 ± 5.3%, range 22.1–35.4%). On the other hand, power athletes (72.3 ± 4.9%, range 69.3–80.7%) had significantly (p < 0.0001) more fast-twitch muscle fibers than endurance athletes (34.9 ± 4.4%, range 30.0–39.6%).

Table 1.
Characteristics of the participants included in the miRNA study.
3.2. Transcriptomic Differences between Groups with a Predominance of Fast- and Slow-Twitch Muscle Fibers
The whole transcriptome analysis was performed for 24 samples of the gene expression study cohort (GEO accession number GSE200398). Our sample prefixes “s” correspond to prefixes “VL017_” in the GEO dataset version.
One sample (s024) was excluded from the analysis due to a low number of reads compared to the other samples. The number of reads per sample in the transcriptome analysis ranged from 40.8 M to 59.3M (mean 48.4 M, SD 4.8 M, N = 23).
After filtering and quality control (see the Materials and Methods section for details), the total number of protein-coding genes expressed was 9086. PCA based on the expression of protein-coding genes from the RNA-seq data showed clear separation of clusters including samples with a predominance of type I and type II fibers on the PC1-PC2 plot (Figure 1). With the criteria of |log2FC| > 0.585 (changes more than 1.5-fold) and FDR < 0.05, we identified 352 differentially expressed genes, among which 180 were upregulated and 172 were downregulated in the predominance of fast muscle fibers (all genes with FDR < 0.05 are listed in Table S1). Based on studies of transcriptomic and proteomic differences between type I and type II muscle fibers [7,9], we selected 35 protein-coding genes belonging to three groups based on their expression being (1) specific to a particular fiber type, (2) having differences between slow and fast fibers, and being (3) specific for skeletal muscles but without the expected differences between fiber types (Table A2, Appendix A). Genes were classified into three main groups according to their biological origin and role: (1) myofibrillar structural proteins, (2) proteins related to excitability and excitation–contraction (E–C) coupling and (3) proteins related to general enzymatic activity. Mitochondrial protein genes were not included in this list; however, their expression was expectedly elevated (from 1.4- to 1.8-fold, with average 1.6-fold for 12 genes with FDR < 0.05) in slow fibers because of the higher number of mitochondria and increased oxidative activity. Based on this gene list, we built a heatmap of their expression in the study groups (Figure 2). Based on the expression of these 35 genes, the samples were grouped according to the predominance of a particular fiber type, except for a few individual samples. Almost all genes from groups specific to a particular fiber type or prevalent in slow or fast fibers were differentially expressed among the study groups (Figure 3). Genes characteristically expressed in the slow fibers (MYH7, MYH7B, MYL2, MYL3, TNNC1, TNNI1, TNNT1, TPM3, ATP2A2, CASQ2 and LDHB) were upregulated in the slow-fiber-dominated group. Genes characteristically expressed in the fast fibers (MYH1, MYH2, MYLPF, MYBPC2, TNNC2, TNNI2, TNNT3, TPM1, ATP2A1 and LDHA) were upregulated in the fast-fiber-dominated group. Interestingly, two genes for which no differences in expression between muscle fiber types were expected (ACTC1 and MYBPH) were strongly upregulated in the group with a predominance of fast fibers. However, the expression of these genes was very low, and the differences between the groups could be a result of random fluctuations among the samples. Overall, the expression of characteristic proteins associated with muscle fiber type allowed us to clearly separate the two groups with fast and slow fiber predominance based on the transcriptomic data.
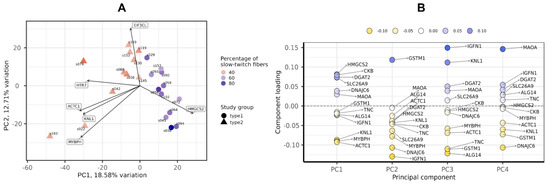
Figure 1.
Principal component analysis of transcriptomic profiles by the PCAtools R package, version 2.2.0. (A) PC1-PC2 plot showing the study groups and the percentage of slow-twitch muscle fibers. (B) Component loadings for the first four PCs. PC, principal component.
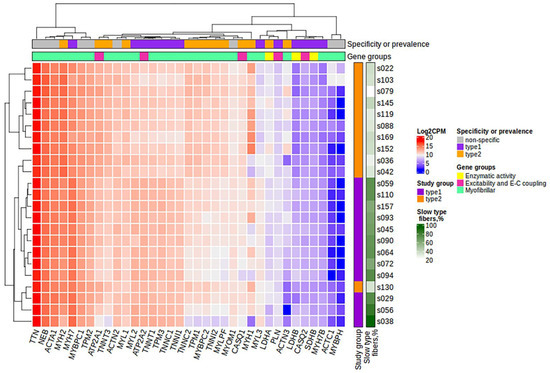
Figure 2.
The heatmap of the expression of 35 protein-coding genes belonging to three groups: (1) those specific to a particular fiber type, (2) those with differences between slow and fast fibers, and (3) those specific or characteristic for skeletal muscles but without the expected differences between fiber types. Specificity or prevalence of the gene expression is marked as “type1” for genes expressed in slow-twitch (type I) fibers, “type2” for genes expressed in fast-twitch (type II) fibers and “non-specific” for genes specific or characteristic for skeletal muscles but without the expected differences between fiber types. The heatmap was built using the log2CPM values. CPM, counts per million; E-C, excitation–contraction.
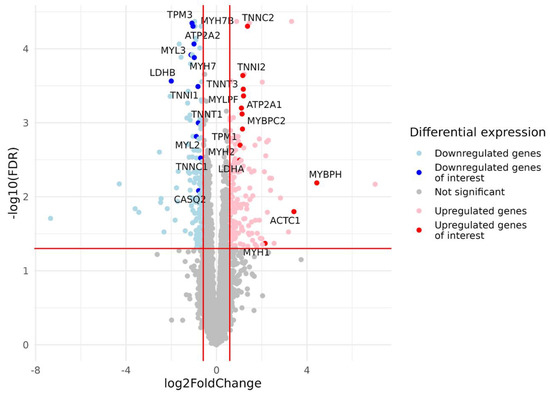
Figure 3.
Volcano plot based on statistical comparison of the gene expression (quasi-likelihood F-test and 5% FDR correction using EdgeR) between the study groups (N = 23). Each dot represents one protein-coding gene. Up- and down-regulated genes are genes with increased and decreased expression in the group with a predominance of fast-twitch fibers (type2) compared to the group with a predominance of slow-twitch fibers (type1). Log2FC value represents type2/type1 CPM ratio. Differentially expressed genes with both FDR < 0.05 and |log2FC| > 0.585 are marked in blue (downregulated genes) or red (upregulated genes). For the genes of interest (Table A2, Appendix A), dots are highlighted, and gene names are provided. Red lines indicate FDR and log2FC thresholds. FDR, false discovery rate; FC, fold change.
To identify the transcription factors (TFs) responsible for the observed changes in gene expression, we submitted the sets of DE up- and down-regulated genes (180 and 172 genes for type2/type1 ratio, respectively) to the online ChEA3 tool and obtained top 10 TFs based on their mean rank (average integrated rank across all TF-target gene set libraries) for each group of genes (Table 2). The lists of TFs for up- and down-regulated genes did not overlap. We observed a high similarity in TF expression levels in skeletal muscle between our data and those from the Genotype-Tissue Expression project (GTEx) (Table 2). Some of the top 10 TFs were not expressed in skeletal muscle either according to our data or according to the GTEx.
Table 2.
Transcriptional factor (TF) analysis for the up- and down-regulated genes: results from ChIP-X Enrichment Analysis 3 (ChEA3). Top 10 TFs by their mean rank are shown for the sets of up- and down-regulated genes. Mean log2CPM is given for the study cohort used for the whole transcriptome analysis (n = 23). N/A indicates that gene expression did not pass the initial filter for low-expressed genes. Median TPM is given for the GTEx data for skeletal muscle tissue (N = 803). CPM, counts per million; TPM, transcripts per million; GTEx, the Genotype-Tissue Expression project.
TF analysis showed that the expression of DE genes characteristic of fast fibers is regulated primarily by MRFs: MYOG, MYF6, MYF5 and MYOD1. Of these, MYF5 was not expressed in skeletal muscle, and MYF6 expression was upregulated 1.5-fold in fast fibers. MRFs govern the key processes during myogenesis and are fundamental for skeletal muscle development [55,56]. Additionally, a number of genes characteristic of fast fibers are possibly regulated by YBX3, the only Y-box (YBX) protein detected in human skeletal muscle. Like other members of the YBX family, YBX3 plays diverse roles in biology, including during development, in spermatogenesis and cellular differentiation and proliferation [57,58,59,60,61]. YBX3 emerges as a regulator of large neutral amino acid homeostasis by stabilizing mRNAs of the solute carrier (SLC) amino acid transporters SLC7A5 and SLC3A2 [62]. TF analysis of the list of genes upregulated in fast fibers revealed a relationship with some other TFs, which play an important role in skeletal muscle differentiation, regeneration and growth: MEF2C, PITX2 and TEAD4 [63,64,65,66]. Recently, it has been discovered that myocyte enhancer factor 2C (MEF2C) alters the expression of muscle-specific miRNAs during skeletal muscle differentiation [67].
Among the TFs linked with the list of DE genes characteristic of slow fibers, CHCHD3 had the highest expression level in skeletal muscle tissue. This inner mitochondrial membrane protein is essential for maintaining crista integrity and mitochondrial function [68,69]. The presence of CHCHD3 among the TF enrichment results is probably due to increased expression of mitochondrial proteins—not only those encoded by mitochondrial DNA but also those that play a key role in mitochondrial function, namely NDUFA9, PPTC7, ATP5PB, HADHB, CKMT2, MLYCD, SDHB, LDHB, COX7B and COX7A2—in the slow fiber type. Among the other top 10 TFs with non-zero expression, RORC is induced during skeletal muscle cell differentiation, while DMRT2 and DPF3 are involved in early muscle development and somite patterning [70,71,72].
3.3. Presence and Diversity of miRNAs in Small RNA Sequencing Data
Raw small RNA sequencing data for ten samples were deposited to NCBI’s Sequencing Read Archive (SRA) with BioProject accession number PRJNA887354. The general data of miRNA sequencing analysis are presented in Figure 4 and are additionally provided in Table A3, Appendix A. The average number of reads per sample considering the settings and filters in QuickMIRSeq tool was 1.09 M (0.91 to 1.53 M), with the mean ratio of miRNA reads being 95% (92.8 to 96.4%). The total number of miRNAs detected within the sample varied from 345 to 395.
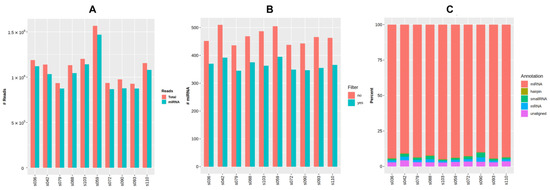
Figure 4.
General output of miRNA sequencing analysis using the QuickMIRSeq pipeline. (A) Total and miRNA reads in each sample. (B) Distribution of small RNA reads by type. (C) Number of detected miRNAs per sample with and without filtering of noisy reads.
The most abundant miRNA was muscle-specific miR-1-3p, which accounted for an average of 79% of all miRNA reads (77 to 81%, Figure 5A). Figure 5B shows the top 15 expressed miRNAs excluding miR-1-3p across all samples based on CPM values.
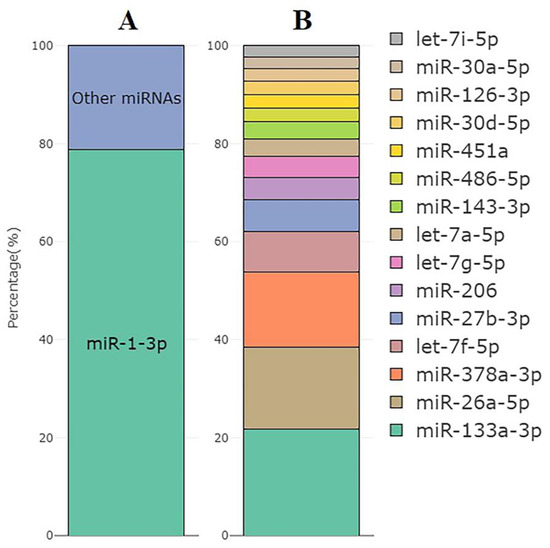
Figure 5.
(A) The mean percentage of miR-1-3p reads within all miRNA reads in the set of samples used for the miRNA analysis (n = 10). (B) Top 15 miRNAs with the highest expression excluding miR-1-3p and their distribution by the CPM values.
Further analysis included 181 miRNAs with a mean TMM-normalized CPM value ≥10 in at least one of the study groups.
Since mature miRNAs are usually presented in various isoforms (isomiRs) resulting from their preprocessing, we analyzed the sequences of miRNA reads to identify the diversity of isoforms in the skeletal muscle tissue samples according to the recent isomiR classification [73]. Isoforms with very low prevalence (mean read count of isoform < 10) were filtered out. After filtering, 1761 isoforms remained for 124 miRNA species. The percentage of reads that matched exactly the canonical mature miRNA sequences was similar to the percentage of isoforms that had modifications on the 3′-end (43 and 45%, respectively, Figure 6A). Among 3′-modifications, the proportion of 3′-trimming and 3′-extension was similar. 5′-end modifications were present in ~5% of the sequences. Polymorphic modifications (i.e., those with single-nucleotide polymorphisms compared to the canonical miRNA sequence) were present in ~15% of the sequences. The percentage distribution of isomiRs was highly similar in the study samples (Figure 6B) and did not differ between the study groups. The sequences and counts of the most commonly represented isoforms accounting for more than 10% of the expression of the corresponding miRNA are listed in Supplementary Materials, Table S2 (207 isoforms for 124 miRNAs, including canonical sequences).
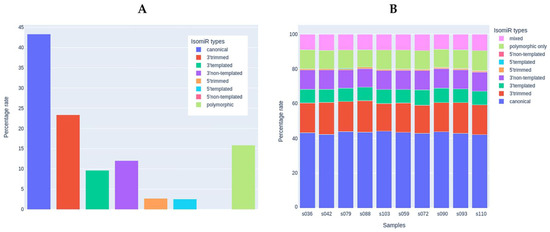
Figure 6.
The analysis of miRNA isoforms (isomiRs). (A) Presence of different isomiR types in the set of samples used for the miRNA analysis (n = 10). (B) Percentage of each isomiR type in each study sample.
3.4. Differential Expression of miRNAs between Groups with Predominance of Fast- and Slow-Twitch Muscle Fibers
PCA showed that the groups with a predominance of fast- and slow-twitch muscle fibers were separated by miRNA profiles in the PC1-PC2 plot (Figure 7A). The main contributors to both PC1 and PC2 were miR-499a-5p, miR-208b-5p, miR-206 and miR-183-5p (Figure 7B).
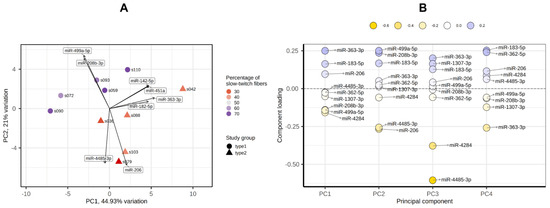
Figure 7.
Principal component analysis of miRNA profiles by the PCAtools R package, version 2.2.0. (A) PC1-PC2 plot showing the study groups and the percentage of slow-twitch muscle fibers. (B) Component loadings for the first four PCs. PC, principal component.
We found five differentially expressed (DE) miRNAs (Table 3 and Figure 8). Upregulation of miR-206, miR-501-3p and miR-185-5p, and downregulation of miR-499a-5p and miR-208-5p was found in the group with fast-twitch fiber prevalence compared to the group with slow-twitch fiber prevalence (Figure 9 and Figure 10).
Table 3.
Differentially expressed miRNAs (both FDR < 0.05 and |log2FC| > 1 in the group comparison using quasi-likelihood F-test with 5% FDR correction performed in EdgeR). Log2FC value represents type2/type1 CPM ratio. FC, fold change; CPM, counts per million; FDR, false discovery rate.
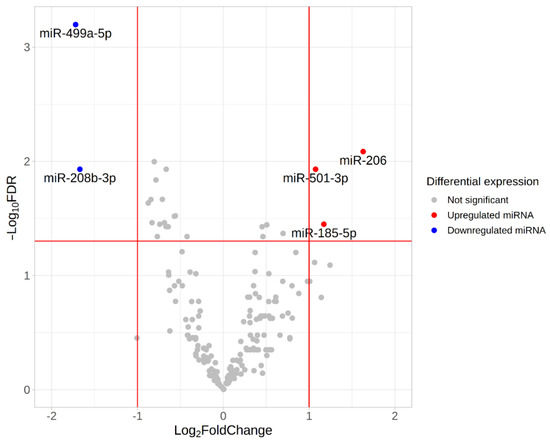
Figure 8.
Volcano plot based on statistical comparison of the miRNA expression (quasi-likelihood F-test and 5% FDR correction using EdgeR) among the study groups (n = 10). Each dot represents one miRNA. Up- and down-regulated genes are genes with increased and decreased expression in the group with a predominance of fast-twitch fibers (type2) compared to the group with a predominance of slow-twitch fibers (type1). Log2FC value represents type2/type1 CPM ratio. Differentially expressed miRNAs with both FDR < 0.05 and |log2FC| > 1 are marked in blue (downregulated miRNAs) or red (upregulated miRNAs). Red lines indicate FDR and log2FC thresholds. FDR, false discovery rate; FC, fold change.

Figure 9.
Boxplots of distribution of TMM-normalized log2CPM values for differentially expressed miRNAs in the study groups. The boxplots represent median and interquartile ranges (IQRs) in the box and values for individual samples in the dots. Adjusted p-values of statistical significance are provided for the pairwise quasi-likelihood F-test comparisons performed in EdgeR.
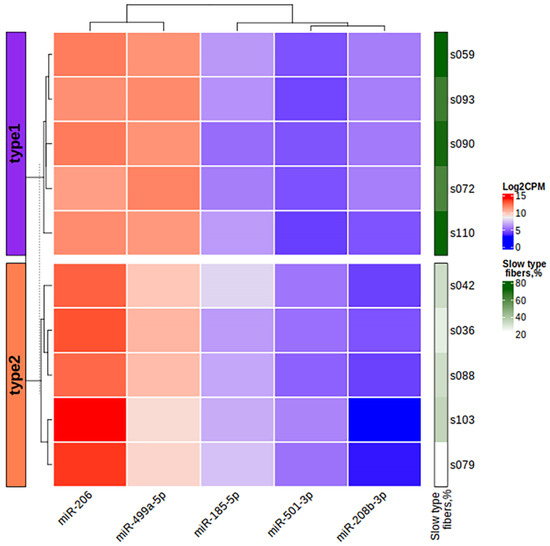
Figure 10.
The heatmap of miRNA expression based on the log2CPM values of differentially expressed miRNAs in the study samples. The left bar chart indicates the study groups. CPM, counts per million.
The first three miRNAs in Table 3 belong to the group of muscle-specific miRNAs known as myomiRs. Among the detected DE miRNAs, only miR-206 belonged to the group with canonical biogenesis. Another four of the DE miRNAs originated from miRtrons, i.e., their expression is linked with the expression of their host genes in the genome (see Table 4). The precursors of these miRNAs originate from the introns of these genes, representing the non-canonical pathway of miRNA biogenesis [74].
Table 4.
Correlations in expression between differentially expressed miRtronic miRNAs and their host genes. For the host gene expression, log2FC values represent type2/type1 CPM ratio, and p-values are provided for differential expression analysis. CPM, counts per million; FC, fold change; FDR, false discovery rate.
3.5. Interactions between MiRNome and Transcriptome
We performed Spearman’s correlation analysis to find the interactions between the transcriptomic and miRNomic data and to link the gene expression patterns for slow-twitch and fast-twitch muscle fibers with the miRNA expression. Since most of the differentially expressed miRNAs originated from miRtrons, we calculated the correlation between the expression of these miRNAs and their host genes based on the total RNA-seq data (Table 4). Two miRNAs (miR-208b-3p and miR-499a-5p) had strong positive correlations with the expression of their host genes (MYH7 and MYH7B, respectively). The expression of both of these genes is characteristic for slow-twitch muscle fibers and was elevated two-fold in samples with a predominance of slow fibers.
We also calculated the correlation between the expression of miRNAs and their potential target genes. Strong positive and negative correlations with the absolute value of correlation coefficient > 0.8 are shown in Table 5. We found 11 strong negative correlations, 2 of which belonged to differentially expressed miRNAs, miR-208b-3p and miR-499a-5p, and indicated their possible regulation of the expression of genes CDKN1A and FOXO4, respectively. Using the MIENTURNET web tool [75], we built the interaction network between miRNAs and their experimentally validated mRNA targets with at least two shared miRNA–target interactions and the adjusted p-value (FDR) ≤ 0.1 (Figure 11). The network shows that the two miRtronic miRNAs specific to slow fibers, miR-208b-3p and miR-499a-5p, share the highest number of common targets and probably have similar regulatory functions, as their seed region sequences are identical in the first six nucleotides.
Table 5.
Correlations between the expression of miRNAs and their potential target genes. CPM, counts per million; FC, fold change; FDR, false discovery rate.
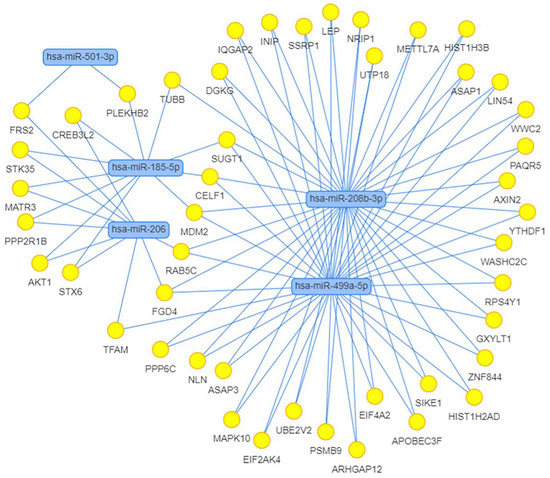
Figure 11.
Network of differentially expressed miRNAs and their target genes obtained using MIENTURNET web tool. Targets were selected in the miRTarBase with at least two shared miRNA–target interactions and the adjusted p-value (FDR) ≤ 0.1.
4. Discussion
This study was the first to describe the differences in miRNA profiles in human skeletal muscle with distinct fiber type composition using high-throughput small RNA sequencing. For this study, a unique set of athlete m. vastus lateralis tissue biopsy samples were collected in which the proportion of fast- and slow-twitch fibers had marginal values, which deviated from the average expected ratio for that muscle type [76,77].
The number and quality of small RNA reads in the sequencing were sufficient to confidently analyze the expression of 181 miRNAs after the low-expression species cutoff. In all samples, miRNAs represented the major fraction of small RNAs. The representation of miRNA isoforms corresponded to the biologically expected distribution [73] and did not differ among the study groups.
To assess the relevance of our results on miRNA composition in human skeletal muscle, we compared our data with previously obtained miRNA sequencing datasets, which included samples from male vastus lateralis muscle. We found four datasets with the ability to download raw sequencing data from the Sequencing Read Archive (SRA) (Table 6). In all datasets, sequencing was performed in a single-end mode using the Illumina platform. Comparison sample sets included only samples from men under 50 years collected before any exercise training. The data were analyzed in the same way as for this study. Each miRNA was ranked according to its representation in muscle tissue based on the mean CPM value in each of the datasets examined. A heatmap visualization of this comparison is presented in Figure 12 for the miRNAs representing the top 25 in this study. In three of the five datasets analyzed, including our study, miR-1-3p and miR-133a-3p were the first and second most represented, with miR-133a-3p being in the top three in all datasets analyzed. The comparison shows that one of the studies (dataset 1) had a similar miRNA profile to our study. Both of these studies used the same protocol to prepare small RNA libraries for sequencing (Table 6). Skeletal muscle miRNA profiles in two other studies (datasets 2 and 3, which used another protocol for small RNA library preparation) were similar but differed from our study. The fourth study (dataset 4) used a custom protocol to prepare miRNA libraries and had a different miRNA profile from all other studies. It can be assumed that the choice of library preparation technique for sequencing influenced the final miRNA ratio. Small RNA library preparation methods may introduce serious bias, mainly during adapter ligation steps followed by reverse transcription and PCR amplification. Read numbers may not reflect actual miRNA expression levels, and different miRNAs may be either over- or under-represented in the library [78]. In addition, miRNA profiles may differ from study to study due to a combination of pre-analytical and biological reasons, such as the methodology of small RNA isolation, the ratio of different cell populations and muscle fibers, as well as the amount of adipose tissue and blood in the biopsy samples.
Table 6.
Datasets used for miRNA sequencing data comparison. In all datasets, single-end Illumina small RNA sequencing was performed, and small RNA was extracted from vastus lateralis muscle biopsy samples from healthy adult participants. Comparison sample sets included samples from male participants under 50 years collected before any exercise training. Manufacturers mentioned: Qiagen, Hilden, Germany; NEB, New England Biolabs, Ipswich, MA, USA; Illumina, San Diego, CA, USA; Thermo Fisher Scientific, Waltham, MA, USA.
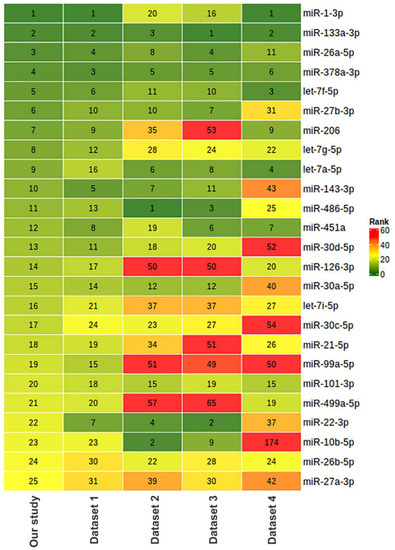
Figure 12.
Comparison of miRNA composition in human vastus lateralis skeletal muscle in our study and five different studies based on miRNA sequencing. The relative abundance of miRNAs is represented as ranks assigned on the basis of counts per million (CPM) values. The characteristics of the datasets and number of samples taken for the comparison are provided in Table 6. Dataset 1: PRJNA276561 [79], n = 5; dataset 2: PRJNA403822 [80], n = 10; dataset 3: PRJNA306562 (FUSION Tissue Biopsy Study dataset) [81], n = 10; dataset 4 [82]: PRJNA524317, n = 3.
By studying the transcriptomic data on an extended set of muscle tissue samples, which included groups with a predominance of fast and slow fibers, we found that most genes characteristic of a particular fiber type have statistically significant differences in expression by more than 1.5-fold. The expression of these genes accounts for the differences in both mechanical and energetic properties of different muscle fiber types. The study groups were clearly distinguishable by the transcriptomic data, even though the samples were not pure type I and type II fibers but always a mixture of these types in different ratios. The results of gene expression analysis are in high concordance with previous transcriptomic and proteomic studies, which revealed gene and protein expression patterns characteristic for each fiber type [7,8,9]. TF analysis showed that the gene expression patterns characteristic of fast and slow fibers are mainly regulated by the distinct non-overlapping sets of TFs associated with skeletal muscle development and differentiation, with MRFs being primarily regulators for genes overexpressed in fast fibers. TF analysis supports the assumption that during muscle development, the primary myoblasts have a slow phenotype, and a fast phenotype is developed in secondary myoblasts under the influence of MRFs [83]. However, this is only a simplification and does not reflect the whole picture of muscle fiber type formation and maintenance, which involves different metabolic pathways and is orchestrated by various regulatory factors, including miRNAs [3,36,83,84,85,86,87].
The main finding of this study is the difference in the miRNA expression between muscle tissue samples with different fiber type composition. We found that the expression of miR-208b-3p and miR-499a-5p was upregulated in samples with a predominance of slow-twitch fibers. This is consistent with some previous studies performed on vertebrate species [33,34,35,36,37,38]. The upregulation of these muscle-specific miRNAs in slow-twitch fibers is most likely due to the increased expression of their host genes MYH7 and MYH7B, which was described earlier [33] and was confirmed by the correlation analysis in this study. MiR-208b and miR-499 belong to the miR-208 family, have similar seed-region sequences, are functionally redundant and play a dominant role in the specification of muscle fiber identity [33,88]. Their actions are mediated by a collection of transcriptional repressors of slow myofiber genes, such as Sox6 [33]. It has been demonstrated that type I muscle fiber proportion is increased via the stimulatory actions of estrogen-related receptor γ (ERRγ) on the expression of miR-499 and miR-208b [89]. These miRNAs share 36 common experimentally validated target genes according to miRTarBase (network in Figure 11). We found that the expression of miR-208b-5p and miR-499-5p was negatively correlated with the expression of their target genes CDKN1A and FOXO4, respectively. It has been shown that miR-208b could regulate cell cycle and promote cattle primary myoblast cell proliferation by targeting CDKN1A [90]. Previously, we found that the CDKN1A gene expression was positively correlated with the percentage of fast-twitch muscle fibers in the human vastus lateralis muscle [39]. In our study, CDKN1A expression was upregulated in samples with a predominance of fast-twitch fibers (log2FC = 2.0, FDR < 0.05). CDKN1A encodes a cyclin-dependent kinase inhibitor 1A (also known as p21), which is involved in cell cycle regulation (including stem cell proliferation), transcription, apoptosis, DNA repair and cell motility [91]. Notably, CDKN1A locus is associated with muscle fiber composition according to a recent genome-wide association study [39]. Moreover, subsequent studies confirmed that miR-208b could mediate skeletal muscle development and energy homoeostasis through specific targeting of TCF12 and FNIP1 [92] and could regulate the conversion of skeletal muscle fiber types by inhibiting METTL8 expression [93]. All these observations indicate that increased expression of miRNAs from the miR-208 family is expected in the predominance of slow fibers. Although the presence of these miRNAs depends on the expression of their host genes, their regulatory functions include activation of slow and repression of fast myofiber gene programs.
We found that the expression of miR-206, miR-501-3p and miR-185-5p was upregulated in samples with a predominance of fast-twitch fibers. MiR-206 is the skeletal muscle-specific myomiR, which had the highest expression level among the DE miRNAs in this study. It performs a variety of regulatory functions in the myoblast proliferation and differentiation by participating in different regulation pathways, in particular by repressing PAX7 or by targeting the Notch3 gene [28,94,95]. Although miR-206 shares close sequence similarity to miR-1, it has been experimentally proven that miR-206 alone is important for differentiation of myoblasts to myotubes [96]. A recent study on mice with triple knockout of miR-206, miR-1a-1 and miR-1a-2 showed that the miR-206 family is not absolutely essential for myogenesis and is instead a modulator of optimal differentiation of skeletal myoblasts [97]. Studies using small RNA sequencing to assess miRNA expression in muscle fibers of different vertebrate species have shown upregulation of miR-206 in both fast and slow fibers [35,37]. The most recent study in mice showed that miR-206 enforces a slow muscle phenotype [98]. In our study, the expression of miR-206 was upregulated about three-fold in samples with a predominance of fast fibers and had negative correlation with the NOTCH3 expression (Spearman’s correlation coefficient −0.782). Thus, there may be differences in miR-206 expression patterns in muscle fibers between humans and other vertebrate species, which could be the subject of further investigation.
MiR-501-3p and miR-185-5p have not been previously mentioned in relation to muscle fiber type composition. MiR-501 is located in an intron of isoform-2 of the CLCN5 gene and is expressed specifically in activated myogenic progenitors and newly formed myofibers [99]. MiR-501-3p has been discovered as a novel muscle-specific miRNA regulating myosin heavy chain during muscle regeneration, and it forms a feedback loop with FOS, MDFI and MYOD to regulate C2C12 myogenesis [99,100]. MiR-185-5p is also an intronic miRNA located within the TANGO2 gene. We found no differential expression of this gene among the study groups, nor did we find a correlation of its expression with miR-185-5p. Recent data have shown that miR-185-5p targets the apelin receptor, induces collagen production and promotes myocardial fibrosis [101]. Therefore, our new data on the relationship between these two miRNAs and the muscle fiber composition have some experimental evidence supporting their potential role in the regulation of muscle function.
The main limitation of the study is the small sample size for miRNA analysis. This is due to the restrictive criteria we used to form a set of samples from the gene expression cohort; only samples from power and endurance athletes up to age 40 with marginal muscle fiber ratios were included. The transcriptome–miRNome pair database from this study will be the second obtained for human muscle biopsy samples along with the FUSION Tissue Biopsy Study (BioProject PRJNA306562) where the percentage of muscle fibers is characterized. However, despite the small sample size, we showed statistically significant differences in miRNA expression between the study groups and substantiated their biological relevance.
Another limitation of the study is that the biological samples obtained are not pure muscle fibers of types I and II; instead, they are always a mixture of them in a certain ratio. In addition, some deviations in the miRNA profiles may be due to contamination of other cell types, adipose tissue or blood. The methodology of this study did not involve additional analysis of the influence of these factors. However, the results of the transcriptome analysis allowed us to clearly separate the groups by gene expression characteristic of each of the two fiber types.
In conclusion, in this study, we used small RNA sequencing to identify five miRNAs, which are associated with the proportion of fast and slow fibers in the human vastus lateralis skeletal muscle. Using transcriptomic data, we showed that the groups of samples with a predominance of fast and slow fibers are clearly differentiated by gene expression. Based on the combined analysis of the miRNome and transcriptome, we can conclude that the differences in miRNA expression are explained to a greater extent by the expression of related genes than vice versa. This is primarily due to the non-canonical miRtronic pathway of miRNA biogenesis and their relationship with the expression of their host genes. However, these miRNAs affect the expression of several genes involved in myogenesis and muscle differentiation, which was also confirmed in our study based on miRNA–mRNA expression correlations. For each of the differentially expressed miRNAs found, a role in the muscle development and function was confirmed by previous studies, which seems to allow us to distinguish them as true biomarkers of skeletal muscle fiber composition.
Supplementary Materials
The following are available online at https://www.mdpi.com/article/10.3390/life13030659/s1, Table S1: The list of differentially expressed genes with FDR < 0.05, Table S2: The most commonly represented miRNA isoforms.
Author Contributions
Conceptualization, A.V.Z., E.I.S., I.I.A. and E.V.G.; methodology, A.V.Z., L.N.I., E.I.S. and E.V.G.; formal analysis, A.V.Z., L.N.I. and E.I.S.; investigation, A.V.Z., L.N.I., E.I.S. and E.V.G.; data curation, A.V.Z., E.I.S. and L.N.I.; writing—original draft preparation, A.V.Z. and L.N.I.; writing—review and editing, E.I.S. and I.I.A.; visualization, A.V.Z., E.I.S. and L.N.I.; supervision, E.I.S. and E.V.G.; project administration, A.V.Z.; funding acquisition, E.V.G. All authors have read and agreed to the published version of the manuscript.
Funding
This research was funded by Russian Science Foundation, grant number 21-15-00362.
Institutional Review Board Statement
The study was conducted according to the guidelines of the Declaration of Helsinki and approved by the Ethics Committee of the Lopukhin Federal Research and Clinical Center of Physical–Chemical Medicine of the Federal Medical and Biological Agency of Russia (protocol no. 2017/04).
Informed Consent Statement
Informed consent was obtained from all subjects involved in the study.
Data Availability Statement
Small RNA sequencing data are available in the Sequencing Read Archive repository (BioProject accession number: PRJNA887354). Total RNA sequencing data are deposited in GEO, accession number GSE200398.
Acknowledgments
The authors wish to thank the Center for Precision Genome Editing and Genetic Technologies for Biomedicine, Lopukhin Federal Research and Clinical Center of Physical-Chemical Medicine of Federal Medical Biological Agency, for technical support. Support for the FUSION Tissue Biopsy Study dataset was contributed by the NHGRI intramural projects ZIAHG000024 and Z1BHG000196, NIDDK grants DK062370, DK072193 and DK099240, NHGRI grant HG003079, American Diabetes Association Pathway to Stop Diabetes Grant 1-14-INI-07, and grants from the Academy of Finland.
Conflicts of Interest
The authors declare no conflict of interest.
Appendix A
Table A1.
Metadata for the gene expression cohort collected for the whole transcriptome analysis.
Table A1.
Metadata for the gene expression cohort collected for the whole transcriptome analysis.
| ID | Study Group | Age | Percentage of Muscle Fibers, % | Sports Category | miRNA Sequencing Data | |
|---|---|---|---|---|---|---|
| Slow | Fast | |||||
| s029 | type1 | 46 | 75.2 | 31.7 | physically active | no |
| s038 | type1 | 44 | 94.1 | 7.8 | endurance | no |
| s045 | type1 | 40 | 66.2 | 36.5 | endurance | no |
| s056 | type1 | 54 | 84.4 | 16.0 | endurance | no |
| s059 | type1 | 24 | 72.8 | 30.8 | endurance | yes |
| s064 | type1 | 31 | 71.9 | 28.9 | endurance | no |
| s072 | type1 | 26 | 61.6 | 39.6 | endurance | yes |
| s090 | type1 | 24 | 70.9 | 35.4 | endurance | yes |
| s093 | type1 | 25 | 64.4 | 38.9 | endurance | yes |
| s094 | type1 | 34 | 75.0 | 32.7 | endurance | no |
| s110 | type1 | 29 | 72.1 | 30.0 | endurance | yes |
| s157 | type1 | 43 | 60.8 | 40.7 | physically active | no |
| s022 | type2 | 31 | 36.8 | 68.6 | physically active | no |
| s024 | type2 | 40 | 25.2 | 74.9 | endurance | no |
| s036 | type2 | 29 | 27.9 | 72.4 | power | yes |
| s042 | type2 | 27 | 33.1 | 69.6 | power | yes |
| s079 | type2 | 39 | 22.1 | 80.7 | power | yes |
| s088 | type2 | 27 | 32.9 | 69.3 | power | yes |
| s103 | type2 | 25 | 35.4 | 69.6 | power | yes |
| s119 | type2 | 26 | 30.9 | 69.4 | physically active | no |
| s130 | type2 | 48 | 34.4 | 66.3 | power | no |
| s145 | type2 | 28 | 40.8 | 65.6 | physically active | no |
| s152 | type2 | 24 | 36.9 | 64.5 | physically active | no |
| s169 | type2 | 27 | 38.1 | 66.1 | power | no |
Table A2.
The list of genes based on transcriptomic and proteomic differences between type I and type II muscle fibers. The specificity or prevalence of the gene expression is marked as “type1” for genes expressed in slow-twitch (type I) fibers, “type2” for genes expressed in fast-twitch (type II) fibers and “non-specific” for genes specific or characteristic for skeletal muscles but without the expected differences between fiber types.
| Group | Gene Name | Protein Name | Specificity or Prevalence |
|---|---|---|---|
| Myofibrillar | TTN | Titin | non-specific |
| Myofibrillar | NEB | Nebulin | non-specific |
| Myofibrillar | ACTA1 | Actin alpha 1, skeletal muscle | non-specific |
| Myofibrillar | MYBPC1 | Myosin binding protein C1 | non-specific |
| Myofibrillar | TPM2 | Tropomyosin 2 | non-specific |
| Myofibrillar | ACTN2 | Actinin alpha 2 | non-specific |
| Myofibrillar | MYOM1 | Myomesin | non-specific |
| Myofibrillar | ACTC1 | Actin alpha cardiac muscle 1 | non-specific |
| Myofibrillar | MYBPH | Myosin-binding protein H | non-specific |
| Myofibrillar | MYH7 | Myosin heavy chain 7 | type1 |
| Myofibrillar | MYH7B | Myosin heavy chain 7B | type1 |
| Myofibrillar | MYL2 | Myosin regulatory light chain 2, ventricular/cardiac muscle isoform | type1 |
| Myofibrillar | MYL3 | Myosin light chain 3 | type1 |
| Myofibrillar | MYL5 | Myosin light chain 5 | type1 |
| Myofibrillar | TNNC1 | Troponin C, slow skeletal and cardiac muscles | type1 |
| Myofibrillar | TNNI1 | Troponin I, slow skeletal muscle | type1 |
| Myofibrillar | TNNT1 | Troponin T, slow skeletal muscle | type1 |
| Myofibrillar | TPM3 | Tropomyosin alpha-3 chain | type1 |
| Excitability and E-C coupling | ATP2A2 | Sarcoplasmic/endoplasmic reticulum calcium ATPase 2 | type1 |
| Excitability and E-C coupling | CASQ2 | Calsequestrin-2 | type1 |
| Excitability and E-C coupling | PLN | Cardiac phospholamban | type1 |
| Enzymatic activity | SDHB | Succinate dehydrogenase iron-sulfur subunit, mitochondrial | type1 |
| Enzymatic activity | LDHB | L-lactate dehydrogenase B chain | type1 |
| Myofibrillar | MYH1 | Myosin heavy chain 1 | type2 |
| Myofibrillar | MYH2 | Myosin heavy chain 2 | type2 |
| Myofibrillar | MYL1 | Myosin light chain 1/3, skeletal muscle isoform | type2 |
| Myofibrillar | MYLPF | Myosin regulatory light chain 2, skeletal muscle isoform | type2 |
| Myofibrillar | MYBPC2 | Myosin-binding protein C, fast-type | type2 |
| Myofibrillar | TNNC2 | Troponin C, skeletal muscle | type2 |
| Myofibrillar | TNNI2 | Troponin I, fast skeletal muscle | type2 |
| Myofibrillar | TNNT3 | Troponin T, fast skeletal muscle | type2 |
| Myofibrillar | TPM1 | Tropomyosin alpha-1 chain | type2 |
| Myofibrillar | ACTN3 | Alpha-actinin-3 | type2 |
| Excitability and E-C coupling | ATP2A1 | Sarcoplasmic/endoplasmic reticulum calcium ATPase 1 | type2 |
| Excitability and E-C coupling | CASQ1 | Calsequestrin-1 | type2 |
| Enzymatic activity | LDHA | L-lactate dehydrogenase A chain | type2 |
Table A3.
General data of miRNA sequencing analysis using the QuickMIRSeq pipeline. SD, standard deviation.
Table A3.
General data of miRNA sequencing analysis using the QuickMIRSeq pipeline. SD, standard deviation.
| Sample ID | Total Reads | Mapping of Reads | miRNA Reads with Mismatches | miRNA Reads Percent, % | Number of Detected miRNAs | ||||
|---|---|---|---|---|---|---|---|---|---|
| miRNA | Hairpin | Small RNA | mRNA | Unaligned | |||||
| s036 | 1,165,274 | 1,117,965 | 2836 | 12,043 | 8761 | 23,669 | 344,026 | 95.9 | 370 |
| s042 | 1,100,541 | 1,030,507 | 2623 | 18,603 | 14,365 | 34,443 | 297,986 | 93.6 | 392 |
| s079 | 914,435 | 872,406 | 1977 | 12,413 | 8763 | 18,876 | 238,428 | 95.4 | 345 |
| s088 | 1,102,220 | 1,042,286 | 2904 | 22,261 | 12,434 | 22,335 | 289,753 | 94.6 | 375 |
| s103 | 1,182,208 | 1,139,684 | 2431 | 9289 | 7835 | 22,969 | 326,821 | 96.4 | 363 |
| s059 | 1,532,840 | 1,466,275 | 4026 | 16,727 | 11,048 | 34,764 | 422,644 | 95.7 | 395 |
| s072 | 915,760 | 865,582 | 2588 | 15,594 | 9119 | 22,877 | 244,713 | 94.5 | 349 |
| s090 | 942,666 | 875,093 | 2443 | 28,093 | 14,777 | 22,260 | 239,741 | 92.8 | 347 |
| s093 | 909,835 | 872,580 | 2287 | 10,764 | 6145 | 18,059 | 253,796 | 95.9 | 355 |
| s110 | 1,128,444 | 1,077,174 | 2723 | 11,169 | 9443 | 27,935 | 309,206 | 95.5 | 366 |
| Mean | 1,089,422 | 1,035,955 | 2684 | 15,696 | 10,269 | 24,819 | 296,711 | 95.0 | 366 |
| SD | 190,718 | 186,420 | 544 | 5928 | 2826 | 5807 | 58,117 | 1.1 | 18 |

Figure A1.
Microphotographs of the labeled muscle sections. (A). Sample with a predominance of fast-twitch muscle fibers. (B). Sample with a predominance of slow-twitch muscle fibers.
Figure A1.
Microphotographs of the labeled muscle sections. (A). Sample with a predominance of fast-twitch muscle fibers. (B). Sample with a predominance of slow-twitch muscle fibers.

References
- Essén, B.; Jansson, E.; Henriksson, J.; Taylor, A.W.; Saltin, B. Metabolic characteristics of fibre types in human skeletal muscle. Acta Physiol. Scand. 1975, 95, 153–165. [Google Scholar] [CrossRef] [PubMed]
- Schiaffino, S.; Reggiani, C. Fiber types in mammalian skeletal muscles. Physiol. Rev. 2011, 91, 1447–1531. [Google Scholar] [CrossRef] [PubMed]
- Blaauw, B.; Schiaffino, S.; Reggiani, C. Mechanisms modulating skeletal muscle phenotype. Compr. Physiol. 2013, 3, 1645–1687. [Google Scholar] [CrossRef] [PubMed]
- Smerdu, V.; Mizrachi, I.K.; Campione, M.; Leinwand, L.; Schiaffino, S. Type IIx myosin heavy chain transcripts are expressed in type IIb fibers of human skeletal muscle. Am. J. Physiol. Physiol. 1994, 267, C1723–C1728. [Google Scholar] [CrossRef]
- Rossi, A.C.; Mammucari, C.; Argentini, C.; Reggiani, C.; Schiaffino, S. Two novel/ancient myosins in mammalian skeletal muscles: MYH14/7b and MYH15 are expressed in extraocular muscles and muscle spindles. J. Physiol. 2010, 588, 353–364. [Google Scholar] [CrossRef]
- Schiaffino, S.; Reggiani, C. Molecular diversity of myofibrillar proteins: Gene regulation and functional significance. Physiol. Rev. 1996, 76, 371–423. [Google Scholar] [CrossRef]
- Bottinelli, R.; Reggiani, C. Human skeletal muscle fibres: Molecular and functional diversity. Prog. Biophys. Mol. Biol. 2000, 73, 195–262. [Google Scholar] [CrossRef]
- Oskolkov, N.; Santel, M.; Parikh, H.M.; Ekström, O.; Camp, G.J.; Miyamoto-Mikami, E.; Ström, K.; Mir, B.A.; Kryvokhyzha, D.; Lehtovirta, M.; et al. High-throughput muscle fiber typing from RNA sequencing data. Skelet. Muscle 2022, 12, 16. [Google Scholar] [CrossRef]
- Murgia, M.; Nogara, L.; Baraldo, M.; Reggiani, C.; Mann, M.; Schiaffino, S. Protein profile of fiber types in human skeletal muscle: A single-fiber proteomics study. Skelet. Muscle 2021, 11, 24. [Google Scholar] [CrossRef]
- Scott, W.; Stevens, J.; Binder–Macleod, S.A. Human skeletal muscle fiber type classifications. Phys. Ther. 2001, 81, 1810–1816. [Google Scholar] [CrossRef]
- Ahmetov, I.I.; Vinogradova, O.L.; Williams, A.G. Gene polymorphisms and fiber-type composition of human skeletal muscle. Int. J. Sport Nutr. Exerc. Metab. 2012, 22, 292–303. [Google Scholar] [CrossRef] [PubMed]
- Simoneau, J.; Bouchard, C. Genetic determinism of fiber type proportion in human skeletal muscle. FASEB J. 1995, 9, 1091–1095. [Google Scholar] [CrossRef] [PubMed]
- Talbot, J.; Maves, L. Skeletal muscle fiber type: Using insights from muscle developmental biology to dissect targets for susceptibility and resistance to muscle disease. Wiley Interdiscip. Rev. Dev. Biol. 2016, 5, 518–534. [Google Scholar] [CrossRef] [PubMed]
- Wilson, J.M.; Loenneke, J.P.; Jo, E.; Wilson, G.J.; Zourdos, M.C.; Kim, J.-S. The effects of endurance, strength, and power training on muscle fiber type shifting. J. Strength Cond. Res. 2012, 26, 1724–1729. [Google Scholar] [CrossRef]
- Plotkin, D.L.; Roberts, M.D.; Haun, C.T.; Schoenfeld, B.J. Muscle fiber type transitions with exercise training: Shifting perspectives. Sports 2021, 9, 127. [Google Scholar] [CrossRef]
- Vikne, H.; Strøm, V.; Pripp, A.H.; Gjøvaag, T. Human skeletal muscle fiber type percentage and area after reduced muscle use: A systematic review and meta-analysis. Scand. J. Med. Sci. Sports 2020, 30, 1298–1317. [Google Scholar] [CrossRef]
- Ehlers, M.L.; Celona, B.; Black, B.L. NFATc1 Controls skeletal muscle fiber type and is a negative regulator of MyoD activity. Cell Rep. 2014, 8, 1639–1648. [Google Scholar] [CrossRef]
- Bassel-Duby, R.; Olson, E.N. Signaling pathways in skeletal muscle remodeling. Annu. Rev. Biochem. 2006, 75, 19–37. [Google Scholar] [CrossRef]
- Rasbach, K.A.; Gupta, R.K.; Ruas, J.L.; Wu, J.; Naseri, E.; Estall, J.L.; Spiegelman, B.M. PGC-1α regulates a HIF2α-dependent switch in skeletal muscle fiber types. Proc. Natl. Acad. Sci. USA 2010, 107, 21866–21871. [Google Scholar] [CrossRef]
- Alexander, M.S.; Shi, X.; Voelker, K.A.; Grange, R.W.; Garcia, J.A.; Hammer, R.E.; Garry, D.J. Foxj3 transcriptionally activates Mef2c and regulates adult skeletal muscle fiber type identity. Dev. Biol. 2010, 337, 396–404. [Google Scholar] [CrossRef]
- Calabria, E.; Ciciliot, S.; Moretti, I.; Garcia, M.; Picard, A.; Dyar, K.A.; Pallafacchina, G.; Tothova, J.; Schiaffino, S.; Murgia, M. NFAT isoforms control activity-dependent muscle fiber type specification. Proc. Natl. Acad. Sci. USA 2009, 106, 13335–13340. [Google Scholar] [CrossRef] [PubMed]
- Yan, Z.; Okutsu, M.; Akhtar, Y.N.; Lira, V.A. Regulation of exercise-induced fiber type transformation, mitochondrial biogenesis, and angiogenesis in skeletal muscle. J. Appl. Physiol. 2011, 110, 264–274. [Google Scholar] [CrossRef] [PubMed]
- Lee, S.-H.; Kim, B.-J.; Park, D.-R.; Kim, U.-H. Exercise induces muscle fiber type switching via transient receptor potential melastatin 2-dependent Ca2+ signaling. J. Appl. Physiol. 2018, 124, 364–373. [Google Scholar] [CrossRef] [PubMed]
- Ultimo, S.; Zauli, G.; Martelli, A.M.; Vitale, M.; McCubrey, J.A.; Capitani, S.; Neri, L.M. Influence of physical exercise on microRNAs in skeletal muscle regeneration, aging and diseases. Oncotarget 2018, 9, 17220–17237. [Google Scholar] [CrossRef]
- Plaza-Diaz, J.; Izquierdo, D.; Torres-Martos, Á.; Baig, A.T.; Aguilera, C.M.; Ruiz-Ojeda, F.J. Impact of Physical Activity and Exercise on the Epigenome in Skeletal Muscle and Effects on Systemic Metabolism. Biomedicines 2022, 10, 126. [Google Scholar] [CrossRef]
- Diniz, G.P.; Wang, D. Regulation of skeletal muscle by microRNAs. Compr. Physiol. 2016, 6, 1279–1294. [Google Scholar] [CrossRef]
- McCarthy, J.J. MicroRNA-206: The skeletal muscle-specific myomiR. Biochim. Biophys. Acta (BBA) Bioenergy 2008, 1779, 682–691. [Google Scholar] [CrossRef]
- Horak, M.; Novak, J.; Bienertova-Vasku, J. Muscle-specific microRNAs in skeletal muscle development. Dev. Biol. 2016, 410, 1–13. [Google Scholar] [CrossRef]
- Güller, I.; Russell, A.P. MicroRNAs in skeletal muscle: Their role and regulation in development, disease and function. J. Physiol. 2010, 588, 4075–4087. [Google Scholar] [CrossRef]
- Kovanda, A.; Režen, T.; Rogelj, B. MicroRNA in skeletal muscle development, growth, atrophy, and disease. Wiley Interdiscip. Rev. RNA 2014, 5, 509–525. [Google Scholar] [CrossRef]
- Chen, J.-F.; Mandel, E.M.; Thomson, J.M.; Wu, Q.; Callis, T.E.; Hammond, S.M.; Conlon, F.L.; Wang, D.-Z. The role of MicroRNA-1 and MicroRNA-133 in skeletal muscle proliferation and differentiation. Nat. Genet. 2005, 38, 228–233. [Google Scholar] [CrossRef] [PubMed]
- Sweetman, D.; Goljanek, K.; Rathjen, T.; Oustanina, S.; Braun, T.; Dalmay, T.; Münsterberg, A. Specific requirements of MRFs for the expression of muscle specific microRNAs, miR-1, miR-206 and miR-133. Dev. Biol. 2008, 321, 491–499. [Google Scholar] [CrossRef] [PubMed]
- Van Rooij, E.; Quiat, D.; Johnson, B.A.; Sutherland, L.B.; Qi, X.; Richardson, J.A.; Kelm, R.J., Jr.; Olson, E.N. A Family of microRNAs encoded by myosin genes governs myosin expression and muscle performance. Dev. Cell 2009, 17, 662–673. [Google Scholar] [CrossRef] [PubMed]
- Duran, B.O.D.S.; Fernandez, G.J.; Mareco, E.; Moraes, L.; Salomão, R.A.S.; De Paula, T.G.; Santos, V.B.; Carvalho, R.F.; Dal-Pai-Silvca, M. Differential microRNA expression in fast- and slow-twitch skeletal muscle of piaractus mesopotamicus during growth. PLoS ONE 2015, 10, e0141967. [Google Scholar] [CrossRef]
- Muroya, S.; Taniguchi, M.; Shibata, M.; Oe, M.; Ojima, K.; Nakajima, I.; Chikuni, K. Profiling of differentially expressed microRNA and the bioinformatic target gene analyses in bovine fast- and slow-type muscles by massively parallel sequencing1. J. Anim. Sci. 2013, 91, 90–103. [Google Scholar] [CrossRef]
- Liu, Y.; Zhang, M.; Shan, Y.; Ji, G.; Ju, X.; Tu, Y.; Sheng, Z.; Xie, J.; Zou, J.; Shu, J. miRNA–mRNA network regulation in the skeletal muscle fiber phenotype of chickens revealed by integrated analysis of miRNAome and transcriptome. Sci. Rep. 2020, 10, 10619. [Google Scholar] [CrossRef]
- Bao, T.; Han, H.; Li, B.; Zhao, Y.; Bou, G.; Zhang, X.; Du, M.; Zhao, R.; Mongke, T.; Laxima; et al. The distinct transcriptomes of fast-twitch and slow-twitch muscles in Mongolian horses. Comp. Biochem. Physiol. Part D Genom. Proteom. 2019, 33, 100649. [Google Scholar] [CrossRef]
- Li, Y.; Ma, Q.; Shi, X.; Yuan, W.; Liu, G.; Wang, C. Comparative transcriptome analysis of slow-twitch and fast-twitch muscles in dezhou donkeys. Genes 2022, 13, 1610. [Google Scholar] [CrossRef]
- Semenova, E.A.; Zempo, H.; Miyamoto-Mikami, E.; Kumagai, H.; Larin, A.K.; Sultanov, R.I.; Babalyan, K.A.; Zhelankin, A.V.; Tobina, T.; Shiose, K.; et al. Genome-wide association study identifies CDKN1A as a novel locus associated with muscle fiber composition. Cells 2022, 11, 3910. [Google Scholar] [CrossRef]
- Guilherme, J.P.L.; Egorova, E.S.; Semenova, E.A.; Kostryukova, E.S.; Kulemin, N.A.; Borisov, O.V.; Khabibova, S.A.; Larin, A.K.; Ospanova, E.A.; Pavlenko, A.V.; et al. The A-allele of the FTO gene rs9939609 Polymorphism is associated with decreased proportion of slow oxidative muscle fibers and over-represented in heavier athletes. J. Strength Cond. Res. 2019, 33, 691–700. [Google Scholar] [CrossRef]
- Andrews, S. FastQC: A Quality Control Tool for High Throughput Sequence Data. Available online: http://www.bioinformataics.babraham.ac.uk/proyects/fastqc (accessed on 18 January 2023).
- Ewels, P.; Magnusson, M.; Lundin, S.; Käller, M. MultiQC: Summarize analysis results for multiple tools and samples in a single report. Bioinformatics 2016, 32, 3047–3048. [Google Scholar] [CrossRef] [PubMed]
- Martin, M. Cutadapt removes adapter sequences from high-throughput sequencing reads. EMBnet. J. 2011, 17, 10–12. [Google Scholar] [CrossRef]
- Bolger, A.M.; Lohse, M.; Usadel, B. Trimmomatic: A flexible trimmer for Illumina sequence data. Bioinformatics 2014, 30, 2114–2120. [Google Scholar] [CrossRef] [PubMed]
- Patro, R.; Duggal, G.; Love, M.I.; Irizarry, R.A.; Kingsford, C. Salmon provides fast and bias-aware quantification of transcript expression. Nat. Methods 2017, 14, 417–419. [Google Scholar] [CrossRef]
- Soneson, C.; Love, M.I.; Robinson, M.D. Differential analyses for RNA-seq: Transcript-level estimates improve gene-level inferences. F1000Research 2016, 4, 1521. [Google Scholar] [CrossRef]
- McCarthy, D.J.; Chen, Y.; Smyth, G.K. Differential expression analysis of multifactor RNA-Seq experiments with respect to biological variation. Nucleic Acids Res. 2012, 40, 4288–4297. [Google Scholar] [CrossRef]
- Blighe, K.; Lun, A. PCAtools: Everything Principal Components Analysis. R Package Version 2.10.0. Available online: https://github.com/kevinblighe/PCAtools (accessed on 18 January 2023).
- Wickham, H. Data analysis. In Ggplot2; Springer International Publishing: Cham, Switzerland, 2016; pp. 189–201. [Google Scholar]
- Zhao, S.; Gordon, W.; Du, S.; Zhang, C.; He, W.; Xi, L.; Mathur, S.; Agostino, M.; Paradis, T.; Von Schack, D.; et al. QuickMIRSeq: A pipeline for quick and accurate quantification of both known miRNAs and isomiRs by jointly processing multiple samples from microRNA sequencing. BMC Bioinform. 2017, 18, 180. [Google Scholar] [CrossRef]
- Robinson, M.D.; McCarthy, D.J.; Smyth, G.K. EdgeR: A bioconductor package for differential expression analysis of digital gene expression data. Bioinformatics 2010, 26, 139–140. [Google Scholar] [CrossRef]
- Keenan, A.B.; Torre, D.; Lachmann, A.; Leong, A.K.; Wojciechowicz, M.L.; Utti, V.; Jagodnik, K.M.; Kropiwnicki, E.; Wang, Z.; Ma’Ayan, A. ChEA3: Transcription factor enrichment analysis by orthogonal omics integration. Nucleic Acids Res. 2019, 47, W212–W224. [Google Scholar] [CrossRef]
- McKenzie, A.T.; Katsyv, I.; Song, W.-M.; Wang, M.; Bin Zhang, B. DGCA: A comprehensive R package for differential gene correlation analysis. BMC Syst. Biol. 2016, 10, 106. [Google Scholar] [CrossRef]
- Huang, H.-Y.; Lin, Y.-C.; Cui, S.; Huang, Y.; Tang, Y.; Xu, J.; Bao, J.; Li, Y.; Wen, J.; Zuo, H.; et al. miRTarBase update 2022: An informative resource for experimentally validated miRNA–target interactions. Nucleic Acids Res. 2021, 50, D222–D230. [Google Scholar] [CrossRef] [PubMed]
- Hernández-Hernández, J.M.; García-González, E.G.; Brun, C.E.; Rudnicki, M.A. The myogenic regulatory factors, determinants of muscle development, cell identity and regeneration. Semin. Cell Dev. Biol. 2017, 72, 10–18. [Google Scholar] [CrossRef] [PubMed]
- Asfour, H.A.; Allouh, M.Z.; Said, R.S. Myogenic regulatory factors: The orchestrators of myogenesis after 30 years of discovery. Exp. Biol. Med. 2018, 243, 118–128. [Google Scholar] [CrossRef]
- Balda, M.S.; Garrett, M.D.; Matter, K. The ZO-1–associated Y-box factor ZONAB regulates epithelial cell proliferation and cell density. J. Cell Biol. 2003, 160, 423–432. [Google Scholar] [CrossRef] [PubMed]
- Giorgini, F.; Davies, H.G.; Braun, R.E. Translational repression by MSY4 inhibits spermatid differentiation in mice. Development 2002, 129, 3669–3679. [Google Scholar] [CrossRef] [PubMed]
- Lima, W.R.; Parreira, K.S.; Devuyst, O.; Caplanusi, A.; N′kuli, F.; Marien, B.; Van Der Smissen, P.; Alves, P.M.; Verroust, P.; Christensen, E.I.; et al. ZONAB Promotes proliferation and represses differentiation of proximal tubule epithelial cells. J. Am. Soc. Nephrol. 2010, 21, 478–488. [Google Scholar] [CrossRef] [PubMed]
- Lu, Z.H.; Books, J.T.; Ley, T.J. Cold shock domain family members YB-1 and MSY4 share essential functions during murine embryogenesis. Mol. Cell. Biol. 2006, 26, 8410–8417. [Google Scholar] [CrossRef]
- Snyder, E.; Soundararajan, R.; Sharma, M.; Dearth, A.; Smith, B.; Braun, R.E. Compound heterozygosity for Y box proteins causes sterility due to loss of translational repression. PLoS Genet. 2015, 11, e1005690. [Google Scholar] [CrossRef]
- Cooke, A.; Schwarzl, T.; Huppertz, I.; Kramer, G.; Mantas, P.; Alleaume, A.-M.; Huber, W.; Krijgsveld, J.; Hentze, M.W. The RNA-binding protein YBX3 controls amino acid levels by regulating SLC mRNA abundance. Cell Rep. 2019, 27, 3097–3106.e5. [Google Scholar] [CrossRef]
- Wang, J.; Zhang, F.; Yang, H.; Wu, H.; Cui, R.; Zhao, Y.; Jiao, C.; Wang, X.; Liu, X.; Wu, L.; et al. Effect of TEAD4 on multilineage differentiation of muscle-derived stem cells. Am. J. Transl. Res. 2018, 10, 998–1011. [Google Scholar]
- Hernandez-Torres, F.; Rodríguez-Outeiriño, L.; Franco, D.; Aranega, A.E. Pitx2 in embryonic and adult myogenesis. Front. Cell Dev. Biol. 2017, 5, 46. [Google Scholar] [CrossRef] [PubMed]
- Dodou, E.; Xu, S.-M.; Black, B.L. mef2c is activated directly by myogenic basic helix-loop-helix proteins during skeletal muscle development in vivo. Mech. Dev. 2003, 120, 1021–1032. [Google Scholar] [CrossRef] [PubMed]
- Taylor, M.V.; Hughes, S.M. Mef2 and the skeletal muscle differentiation program. Semin. Cell Dev. Biol. 2017, 72, 33–44. [Google Scholar] [CrossRef] [PubMed]
- Piasecka, A.; Sekrecki, M.; Szcześniak, M.W.; Sobczak, K. MEF2C shapes the microtranscriptome during differentiation of skeletal muscles. Sci. Rep. 2021, 11, 3476. [Google Scholar] [CrossRef] [PubMed]
- An, J.; Shi, J.; He, Q.; Lui, K.; Liu, Y.; Huang, Y.; Sheikh, M.S. CHCM1/CHCHD6, novel mitochondrial protein linked to regulation of mitofilin and mitochondrial cristae morphology. J. Biol. Chem. 2012, 287, 7411–7426. [Google Scholar] [CrossRef] [PubMed]
- Darshi, M.; Mendiola, V.L.; Mackey, M.R.; Murphy, A.N.; Koller, A.; Perkins, G.A.; Ellisman, M.H.; Taylor, S.S. ChChd3, an inner mitochondrial membrane protein, is essential for maintaining crista integrity and mitochondrial function. J. Biol. Chem. 2011, 286, 2918–2932. [Google Scholar] [CrossRef]
- Raichur, S.; Lau, P.; Staels, B.; Muscat, G. Retinoid-related orphan receptor regulates several genes that control metabolism in skeletal muscle cells: Links to modulation of reactive oxygen species production. J. Mol. Endocrinol. 2007, 39, 29–44. [Google Scholar] [CrossRef]
- Seo, K.W.; Wang, Y.; Kokubo, H.; Kettlewell, J.R.; Zarkower, D.A.; Johnson, R.L. Targeted disruption of the DM domain containing transcription factor Dmrt2 reveals an essential role in somite patterning. Dev. Biol. 2006, 290, 200–210. [Google Scholar] [CrossRef]
- Lange, M.; Kaynak, B.; Forster, U.B.; Tönjes, M.; Fischer, J.J.; Grimm, C.; Schlesinger, J.; Just, S.; Dunkel, I.; Krueger, T.; et al. Regulation of muscle development by DPF3, a novel histone acetylation and methylation reader of the BAF chromatin remodeling complex. Genes Dev. 2008, 22, 2370–2384. [Google Scholar] [CrossRef]
- Tomasello, L.; Distefano, R.; Nigita, G.; Croce, C.M. The MicroRNA family gets wider: The IsomiRs classification and role. Front. Cell Dev. Biol. 2021, 9, 668648. [Google Scholar] [CrossRef]
- Ruby, J.G.; Jan, C.H.; Bartel, D.P. Intronic microRNA precursors that bypass drosha processing. Nature 2007, 448, 83–86. [Google Scholar] [CrossRef] [PubMed]
- Licursi, V.; Conte, F.; Fiscon, G.; Paci, P. MIENTURNET: An interactive web tool for microRNA-target enrichment and network-based analysis. BMC Bioinform. 2019, 20, 545. [Google Scholar] [CrossRef] [PubMed]
- Simoneau, J.A.; Bouchard, C. Human variation in skeletal muscle fiber-type proportion and enzyme activities. Am. J. Physiol. Metab. 1989, 257, E567–E572. [Google Scholar] [CrossRef] [PubMed]
- Staron, R.S. Human skeletal muscle fiber types: Delineation, development, and distribution. Can. J. Appl. Physiol. 1997, 22, 307–327. [Google Scholar] [CrossRef]
- Dard-Dascot, C.; Naquin, D.; D’Aubenton-Carafa, Y.; Alix, K.; Thermes, C.; van Dijk, E. Systematic comparison of small RNA library preparation protocols for next-generation sequencing. BMC Genom. 2018, 19, 118. [Google Scholar] [CrossRef]
- McLean, C.S.; Mielke, C.; Cordova, J.M.; Langlais, P.R.; Bowen, B.; Miranda, D.; Coletta, D.K.; Mandarino, L.J. Gene and MicroRNA expression responses to exercise; relationship with insulin sensitivity. PLoS ONE 2015, 10, e0127089. [Google Scholar] [CrossRef]
- Mitchell, C.; D’Souza, R.F.; Schierding, W.; Zeng, N.; Ramzan, F.; O’Sullivan, J.M.; Poppitt, S.D.; Cameron-Smith, D. Identification of human skeletal muscle miRNA related to strength by high-throughput sequencing. Physiol. Genom. 2018, 50, 416–424. [Google Scholar] [CrossRef]
- Taylor, D.L.; Jackson, A.U.; Narisu, N.; Hemani, G.; Erdos, M.R.; Chines, P.S.; Swift, A.; Idol, J.; Didion, J.P.; Welch, R.P.; et al. Integrative analysis of gene expression, DNA methylation, physiological traits, and genetic variation in human skeletal muscle. Proc. Natl. Acad. Sci. USA 2019, 116, 10883–10888. [Google Scholar] [CrossRef]
- Massart, J.; Sjögren, R.J.O.; Egan, B.; Garde, C.; Lindgren, M.; Gu, W.; Ferreira, D.M.S.; Katayama, M.; Ruas, J.L.; Barrès, R.; et al. Endurance exercise training-responsive miR-19b-3p improves skeletal muscle glucose metabolism. Nat. Commun. 2021, 12, 5948. [Google Scholar] [CrossRef]
- Parry, D.J. Myosin heavy chain expression and plasticity: Role of myoblast diversity. Exerc. Sport Sci. Rev. 2001, 29, 175–179. [Google Scholar] [CrossRef]
- Zierath, J.R.; Hawley, J. Skeletal muscle fiber type: Influence on contractile and metabolic properties. PLoS Biol. 2004, 2, e348. [Google Scholar] [CrossRef] [PubMed]
- Maltin, C.A.; Delday, M.I.; Sinclair, K.D.; Steven, J.; Sneddon, A. Impact of manipulations of myogenesis in utero on the performance of adult skeletal muscle. Reproduction 2001, 122, 359–374. [Google Scholar] [CrossRef] [PubMed]
- Vicente-García, C.; Hernández-Camacho, J.D.; Carvajal, J.J. Regulation of myogenic gene expression. Exp. Cell Res. 2022, 419, 113299. [Google Scholar] [CrossRef] [PubMed]
- Swoap, S.J.; Hunter, R.B.; Stevenson, E.J.; Felton, H.M.; Kansagra, N.V.; Lang, J.M.; Esser, K.A.; Kandarian, S.C. The calcineurin-NFAT pathway and muscle fiber-type gene expression. Am. J. Physiol. Physiol. 2000, 279, C915–C924. [Google Scholar] [CrossRef] [PubMed]
- Callis, T.E.; Pandya, K.; Seok, H.Y.; Tang, R.-H.; Tatsuguchi, M.; Huang, Z.-P.; Chen, J.-F.; Deng, Z.; Gunn, B.; Shumate, J.; et al. MicroRNA-208a is a regulator of cardiac hypertrophy and conduction in mice. J. Clin. Investig. 2009, 119, 2772–2786. [Google Scholar] [CrossRef]
- Gan, Z.; Rumsey, J.; Hazen, B.C.; Lai, L.; Leone, T.C.; Vega, R.B.; Xie, H.; Conley, K.E.; Auwerx, J.; Smith, S.R.; et al. Nuclear receptor/microRNA circuitry links muscle fiber type to energy metabolism. J. Clin. Investig. 2013, 123, 2564–2575. [Google Scholar] [CrossRef]
- Wang, J.; Song, C.; Cao, X.; Li, H.; Cai, H.; Ma, Y.; Huang, Y.; Lan, X.; Lei, C.; Ma, Y.; et al. MiR-208b regulates cell cycle and promotes skeletal muscle cell proliferation by targeting CDKN1A. J. Cell. Physiol. 2018, 234, 3720–3729. [Google Scholar] [CrossRef]
- Ticli, G.; Cazzalini, O.; Stivala, L.A.; Prosperi, E. Revisiting the function of p21CDKN1A in DNA repair: The influence of protein interactions and stability. Int. J. Mol. Sci. 2022, 23, 7058. [Google Scholar] [CrossRef]
- Fu, L.; Wang, H.; Liao, Y.; Zhou, P.; Xu, Y.; Zhao, Y.; Xie, S.; Zhao, S.; Li, X. miR-208b modulating skeletal muscle development and energy homoeostasis through targeting distinct targets. RNA Biol. 2020, 17, 743–754. [Google Scholar] [CrossRef]
- Li, X.; Bi, H.; Xie, S.; Cui, W. MiR-208b regulates the conversion of skeletal muscle fiber types by inhibiting mettl8 expression. Front. Genet. 2022, 13, 820464. [Google Scholar] [CrossRef]
- Chen, J.-F.; Tao, Y.; Li, J.; Deng, Z.; Yan, Z.; Xiao, X.; Wang, D.-Z. microRNA-1 and microRNA-206 regulate skeletal muscle satellite cell proliferation and differentiation by repressing Pax7. J. Cell Biol. 2010, 190, 867–879. [Google Scholar] [CrossRef]
- Zhang, Z.; Chen, Y.; Li, B.; Yao, Y.; Jiang, A.; Wei, W.; Liu, H.; Wu, W. Identification of a novel miR-206-Notch3 pathway regulating mouse myoblasts proliferation. Gene 2019, 695, 57–64. [Google Scholar] [CrossRef] [PubMed]
- Salant, G.M.; Tat, K.L.; Goodrich, J.A.; Kugel, J.F. miR-206 knockout shows it is critical for myogenesis and directly regulates newly identified target mRNAs. RNA Biol. 2020, 17, 956–965. [Google Scholar] [CrossRef] [PubMed]
- Przanowska, R.K.; Sobierajska, E.; Su, Z.; Jensen, K.; Przanowski, P.; Nagdas, S.; Kashatus, J.A.; Kashatus, D.F.; Bhatnagar, S.; Lukens, J.R.; et al. miR-206 family is important for mitochondrial and muscle function, but not essential for myogenesis in vitro. FASEB J. 2020, 34, 7687–7702. [Google Scholar] [CrossRef] [PubMed]
- Bjorkman, K.K.; Guess, M.G.; Harrison, B.C.; Polmear, M.M.; Peter, A.K.; Leinwand, L.A. miR-206 enforces a slow muscle phenotype. J. Cell Sci. 2020, 133, jcs243162. [Google Scholar] [CrossRef]
- Mizbani, A.; Luca, E.; Rushing, E.J.; Krützfeldt, J. MicroRNA deep sequencing in two adult stem cell populations identifies miR-501 as novel regulator of myosin heavy chain during muscle regeneration. Development 2016, 143, 4137–4148. [Google Scholar] [CrossRef]
- Hou, L.; Zhu, L.; Li, H.; Jiang, F.; Cao, L.; Hu, C.Y.; Wang, C. MiR-501-3p forms a feedback loop with FOS, MDFI, and MyoD to regulate C2C12 myogenesis. Cells 2019, 8, 573. [Google Scholar] [CrossRef]
- Lin, R.; Rahtu-Korpela, L.; Szabo, Z.; Kemppi, A.; Skarp, S.; Kiviniemi, A.M.; Lepojärvi, E.S.; Halmetoja, E.; Kilpiö, T.; Porvari, K.; et al. MiR-185-5p regulates the development of myocardial fibrosis. J. Mol. Cell. Cardiol. 2021, 165, 130–140. [Google Scholar] [CrossRef]


Disclaimer/Publisher’s Note: The statements, opinions and data contained in all publications are solely those of the individual author(s) and contributor(s) and not of MDPI and/or the editor(s). MDPI and/or the editor(s) disclaim responsibility for any injury to people or property resulting from any ideas, methods, instructions or products referred to in the content. |
© 2023 by the authors. Licensee MDPI, Basel, Switzerland. This article is an open access article distributed under the terms and conditions of the Creative Commons Attribution (CC BY) license (https://creativecommons.org/licenses/by/4.0/).