
Melanoma and Nevi Subtype Histopathological Characterization with Optical Coherence Tomography
 , , , , , , and
Abstract
1. Introduction
2. Materials and Methods
2.1. Equipment
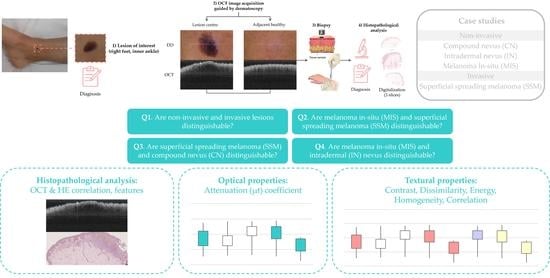
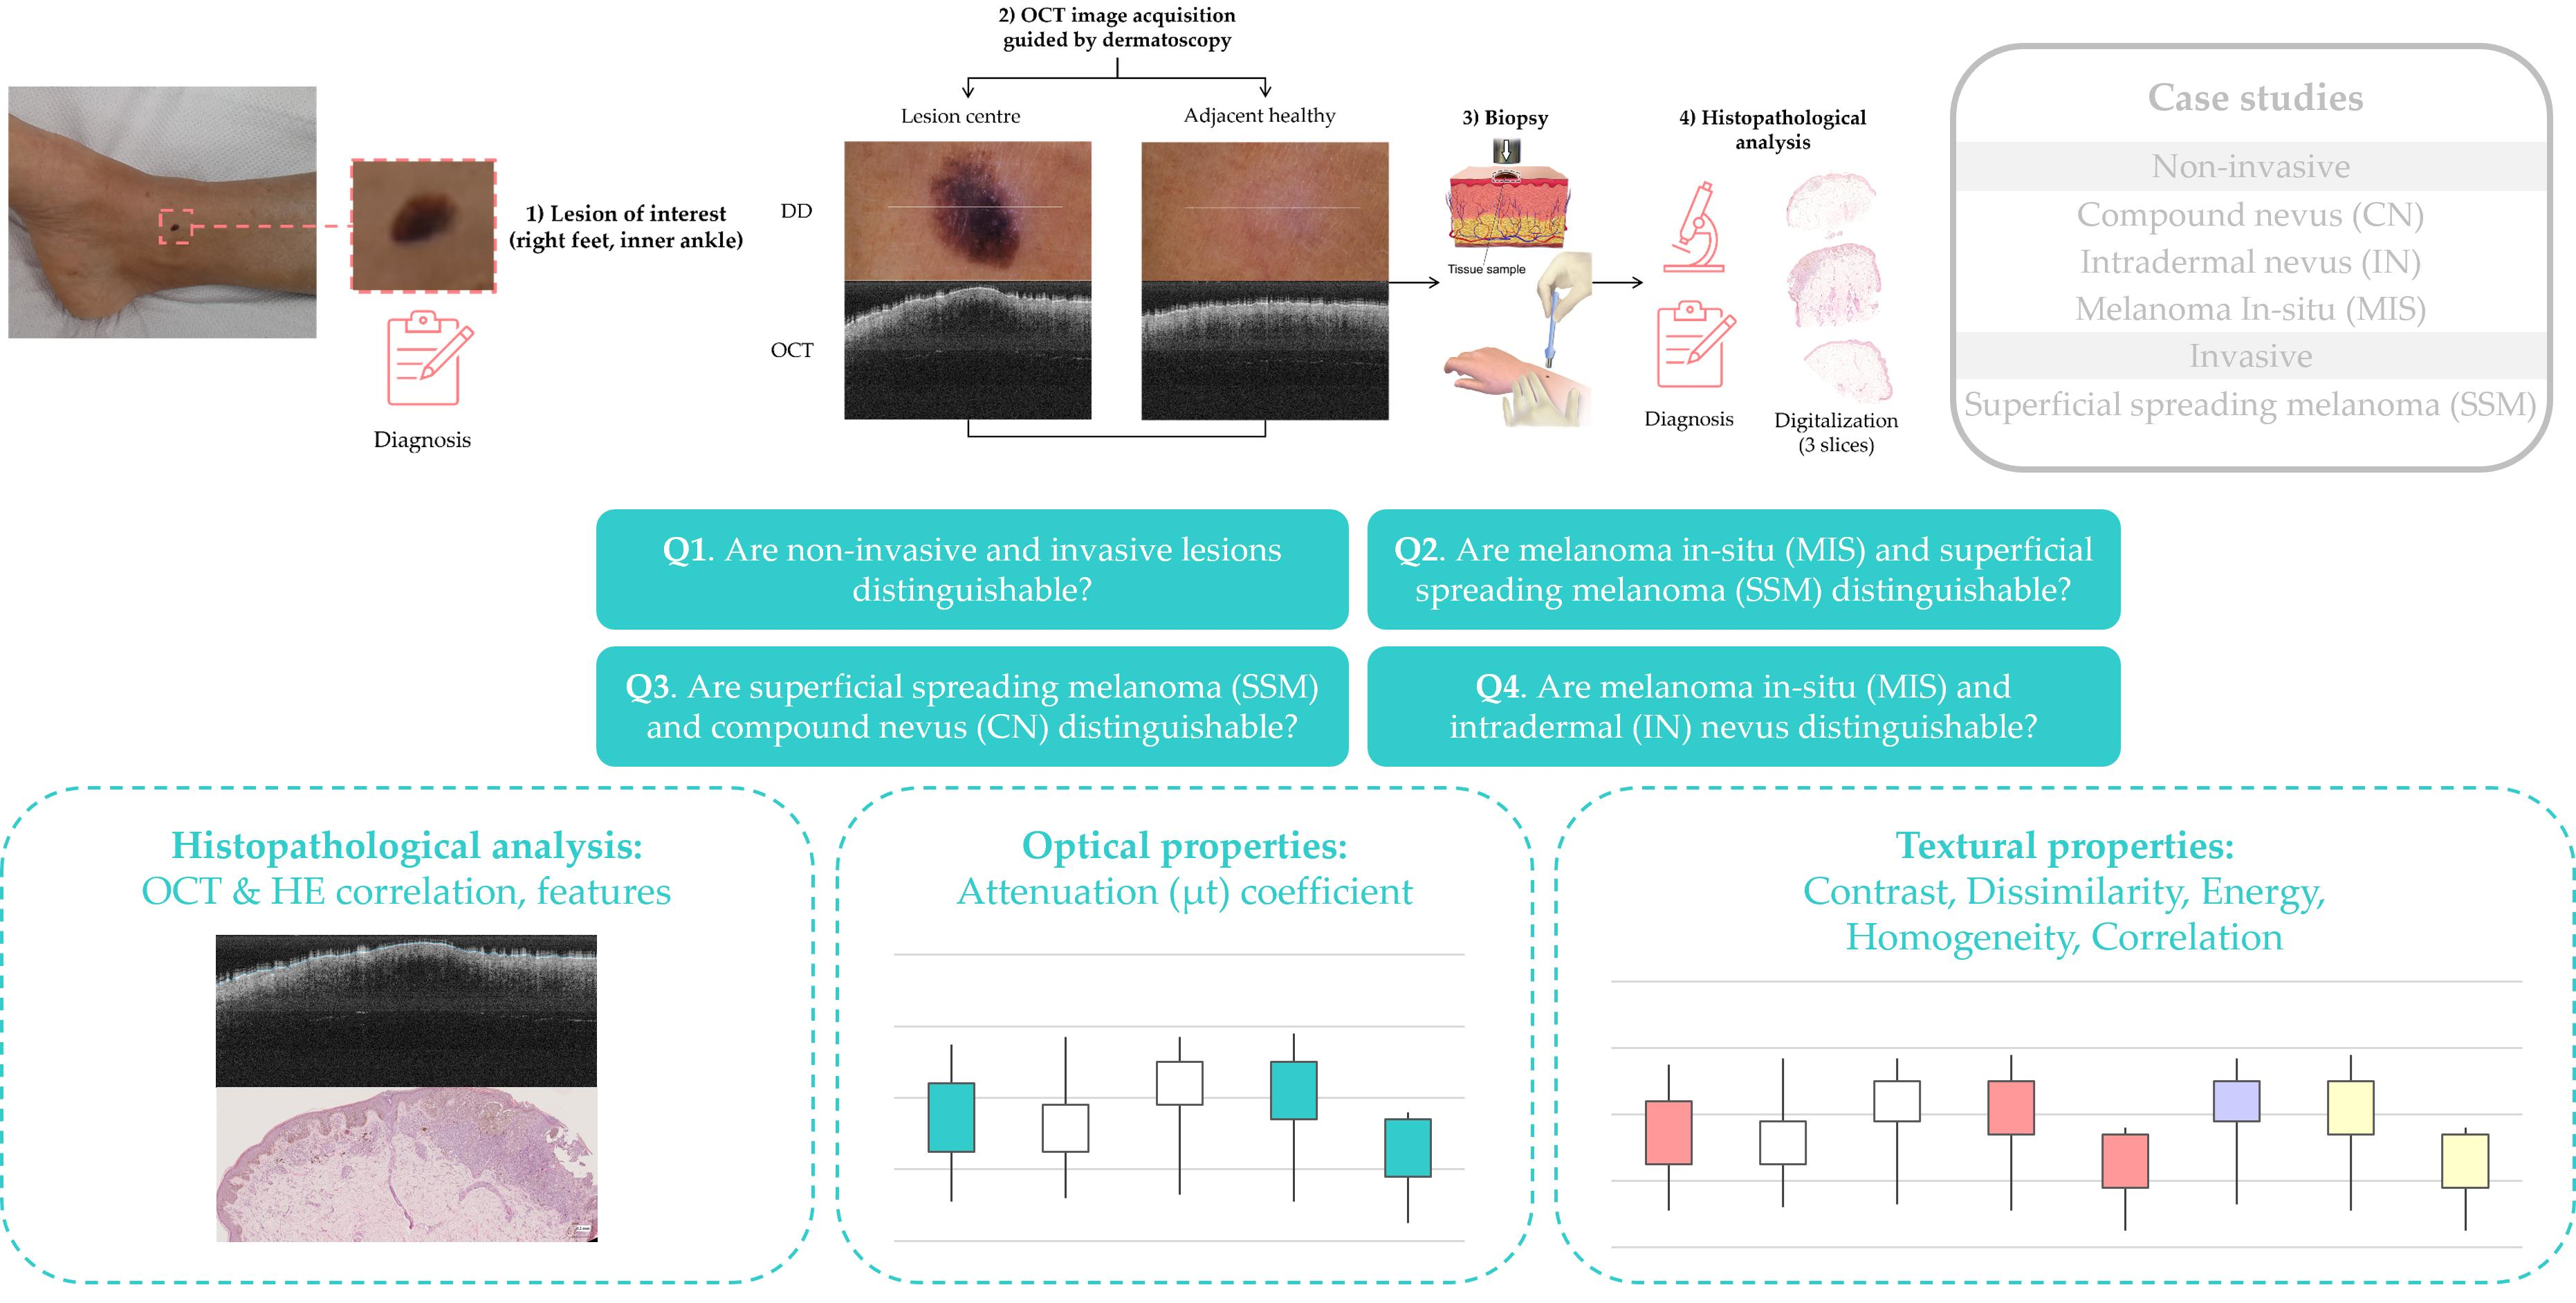
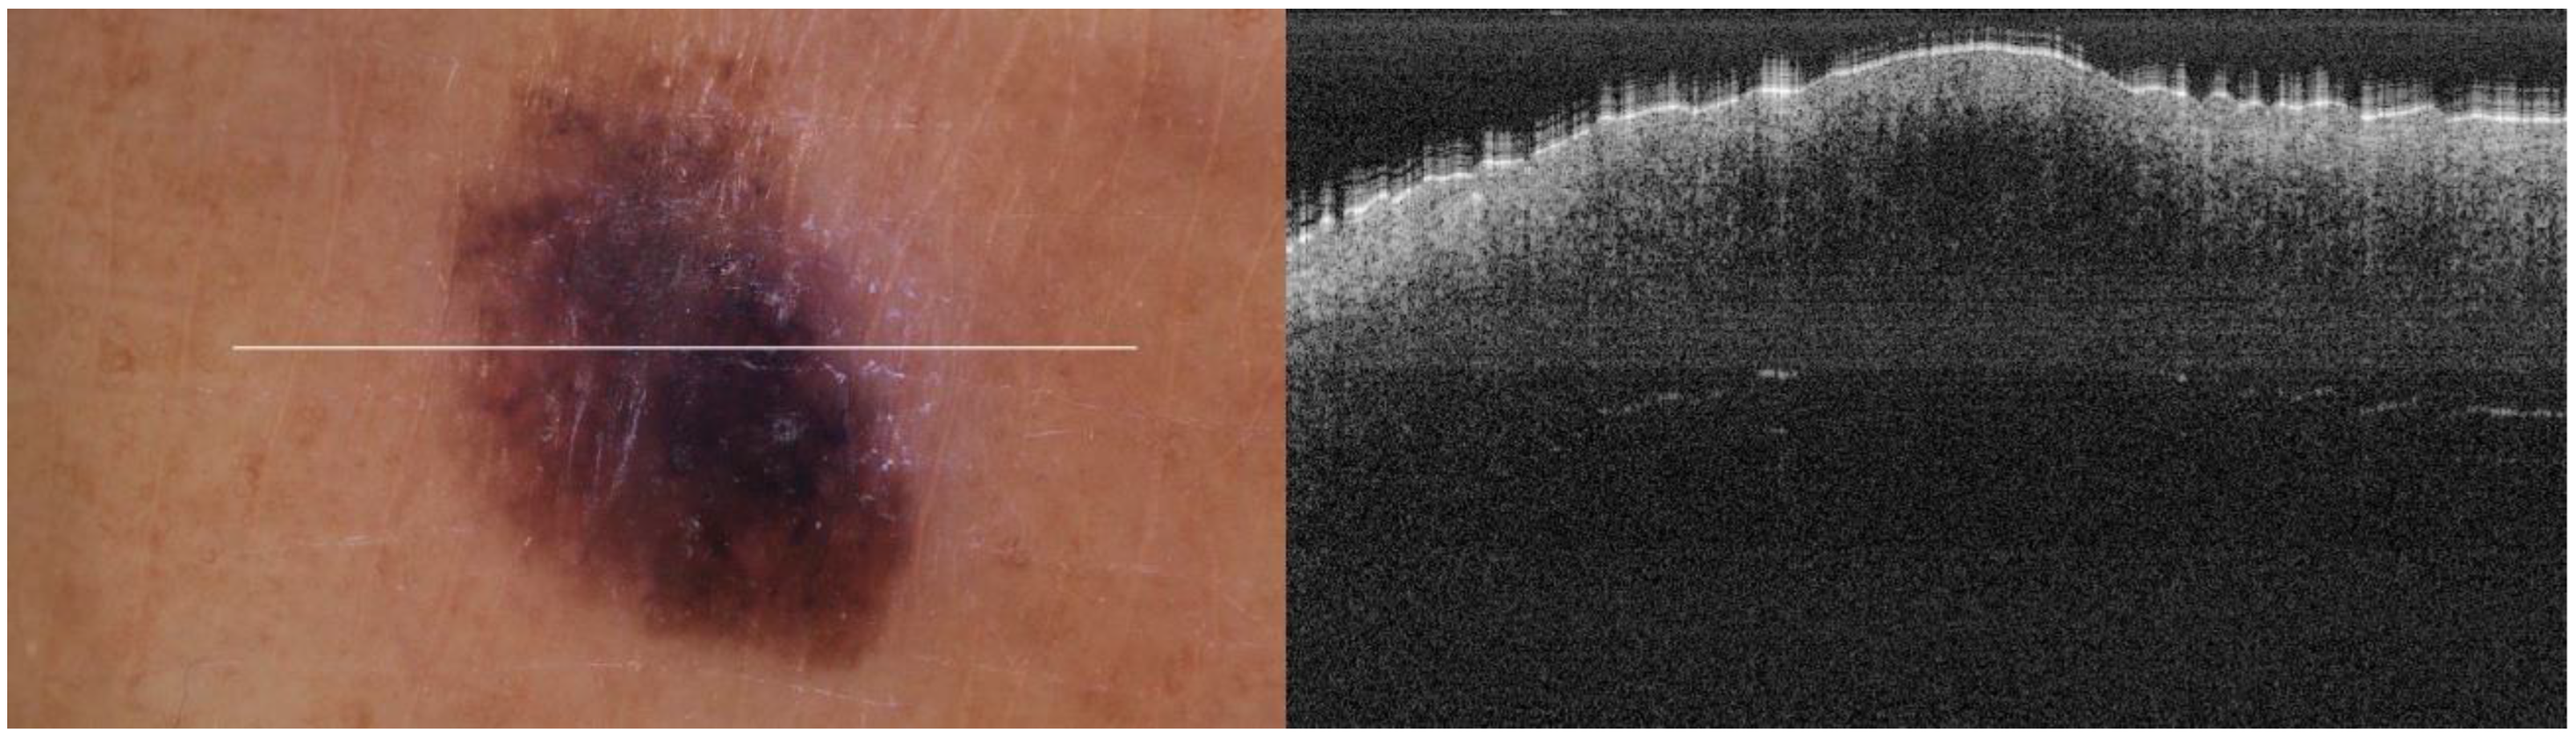
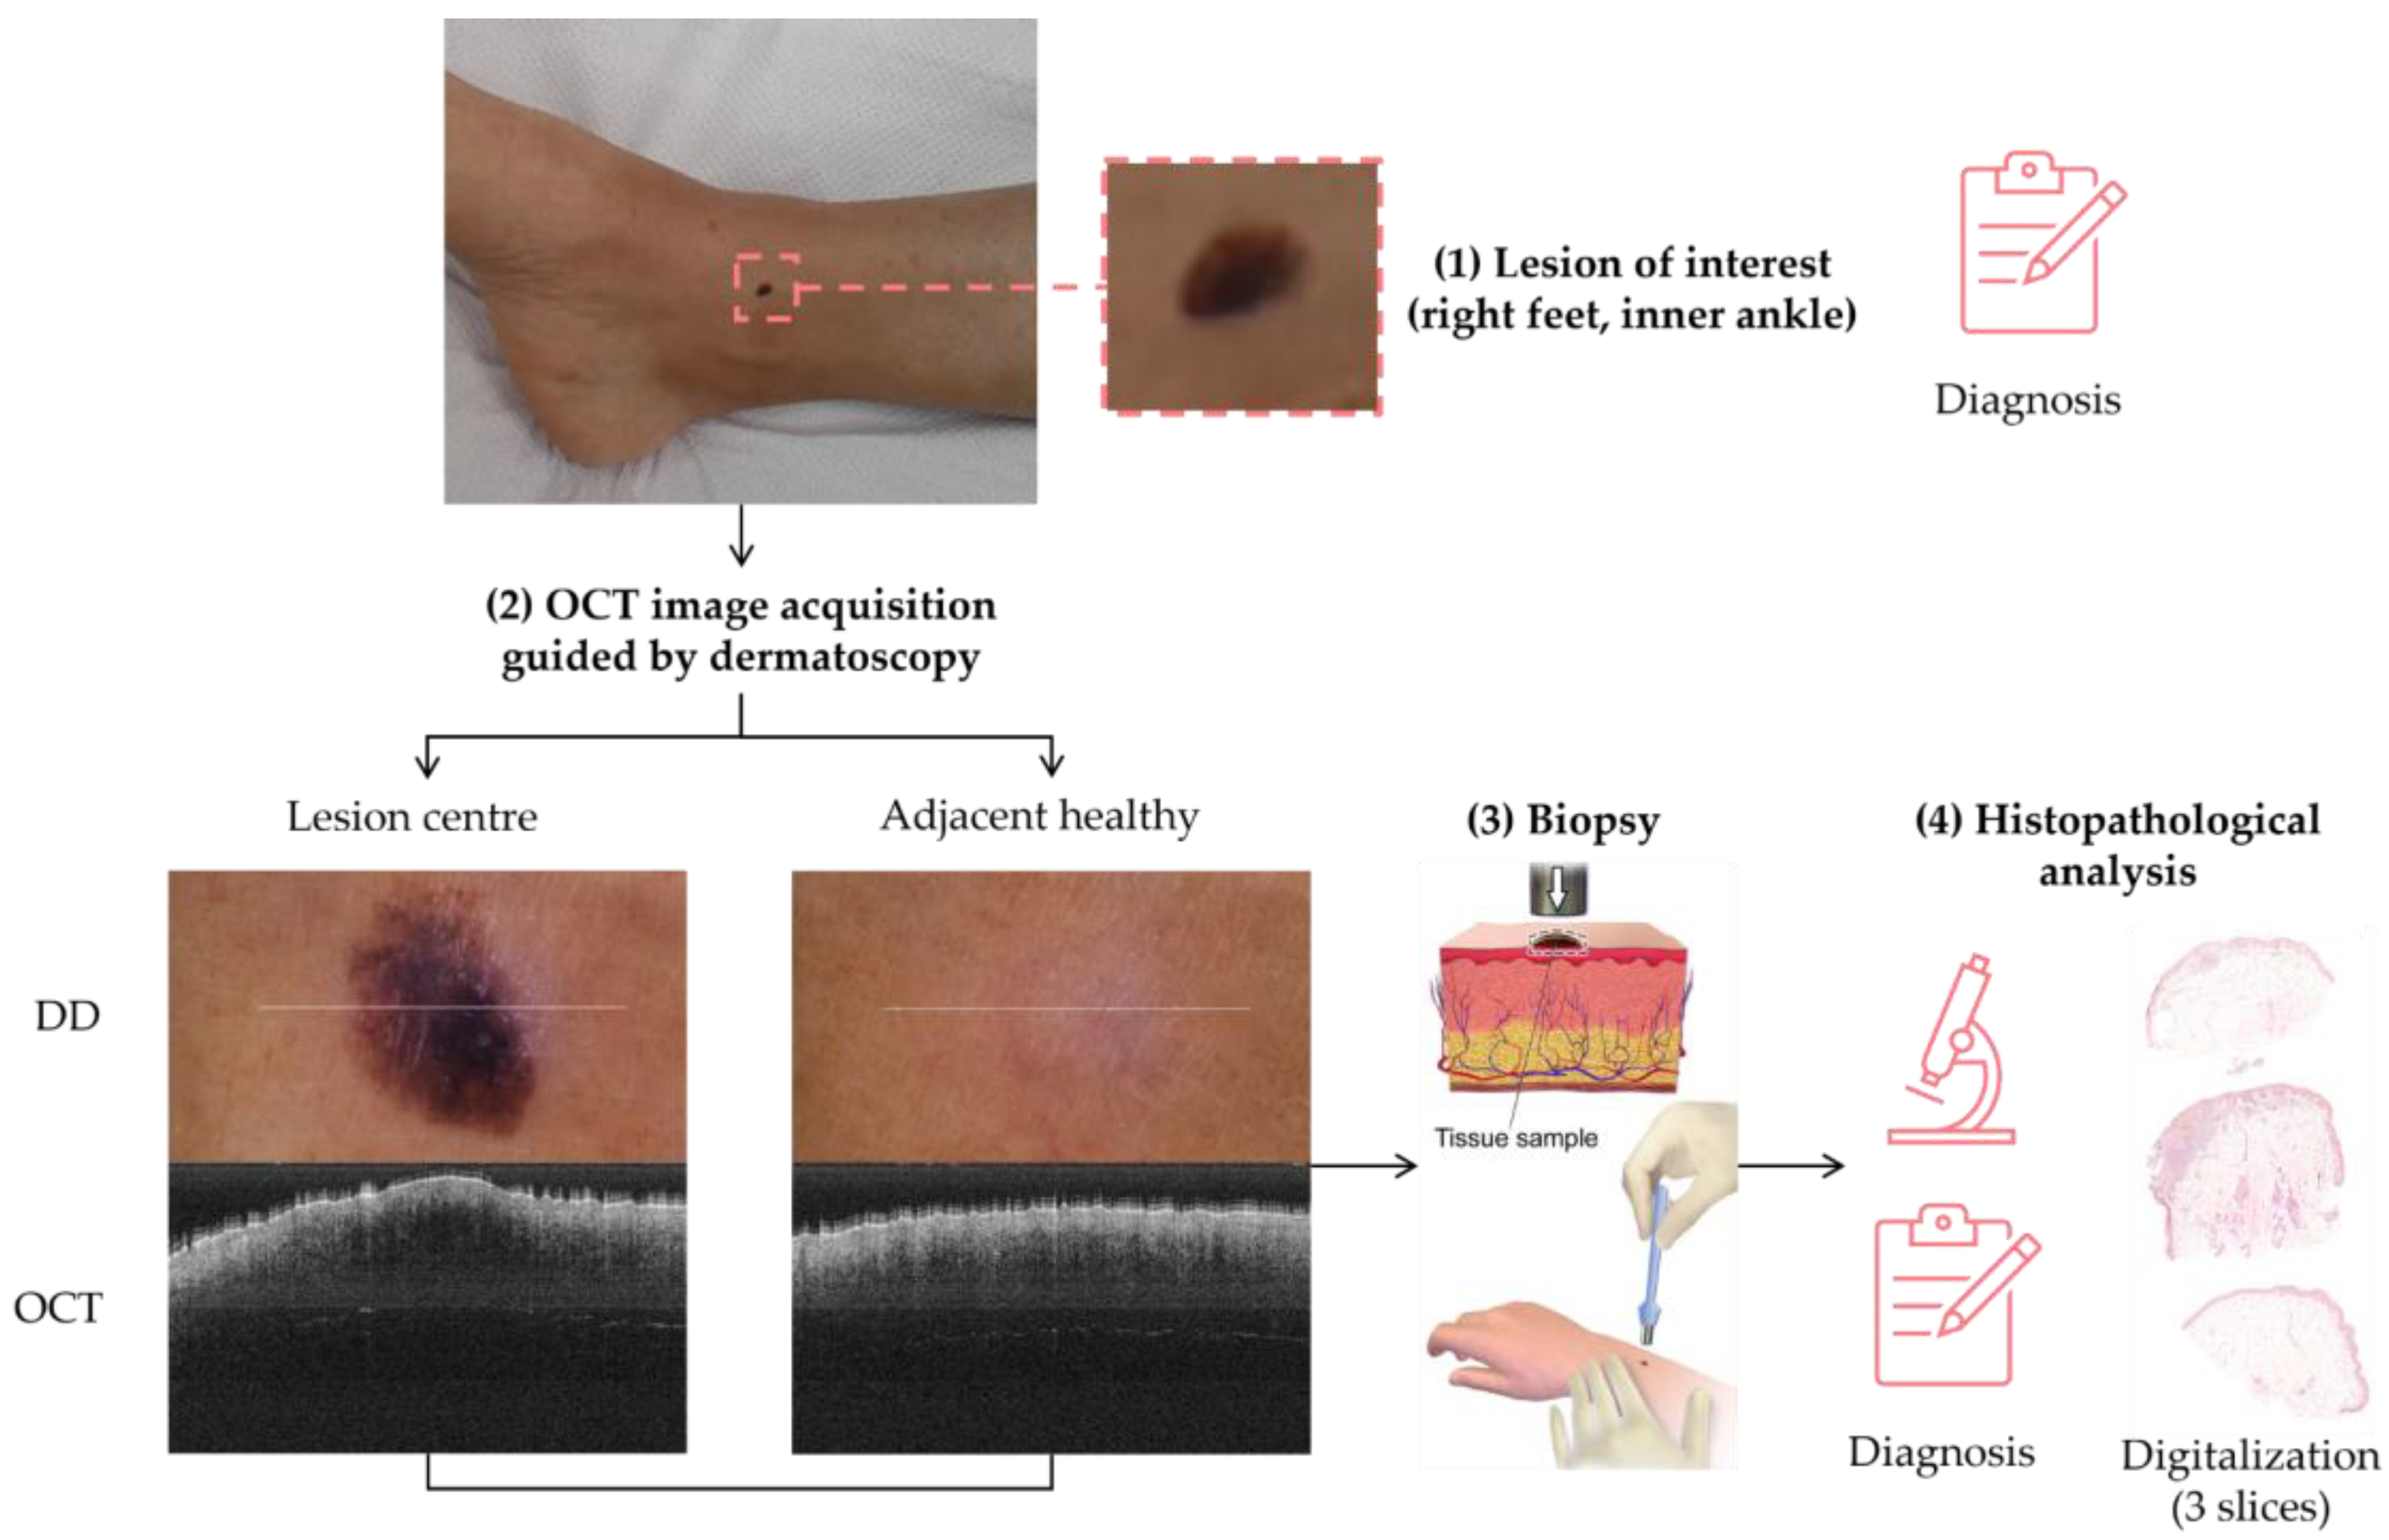
2.2. Sample Acquisition Clinical Procedure
2.3. Samples’ Histopathological Features
2.4. Case Studies
2.5. Target Diagnosis Hypothesis
2.6. Lesions Characterization & Feature Analysis
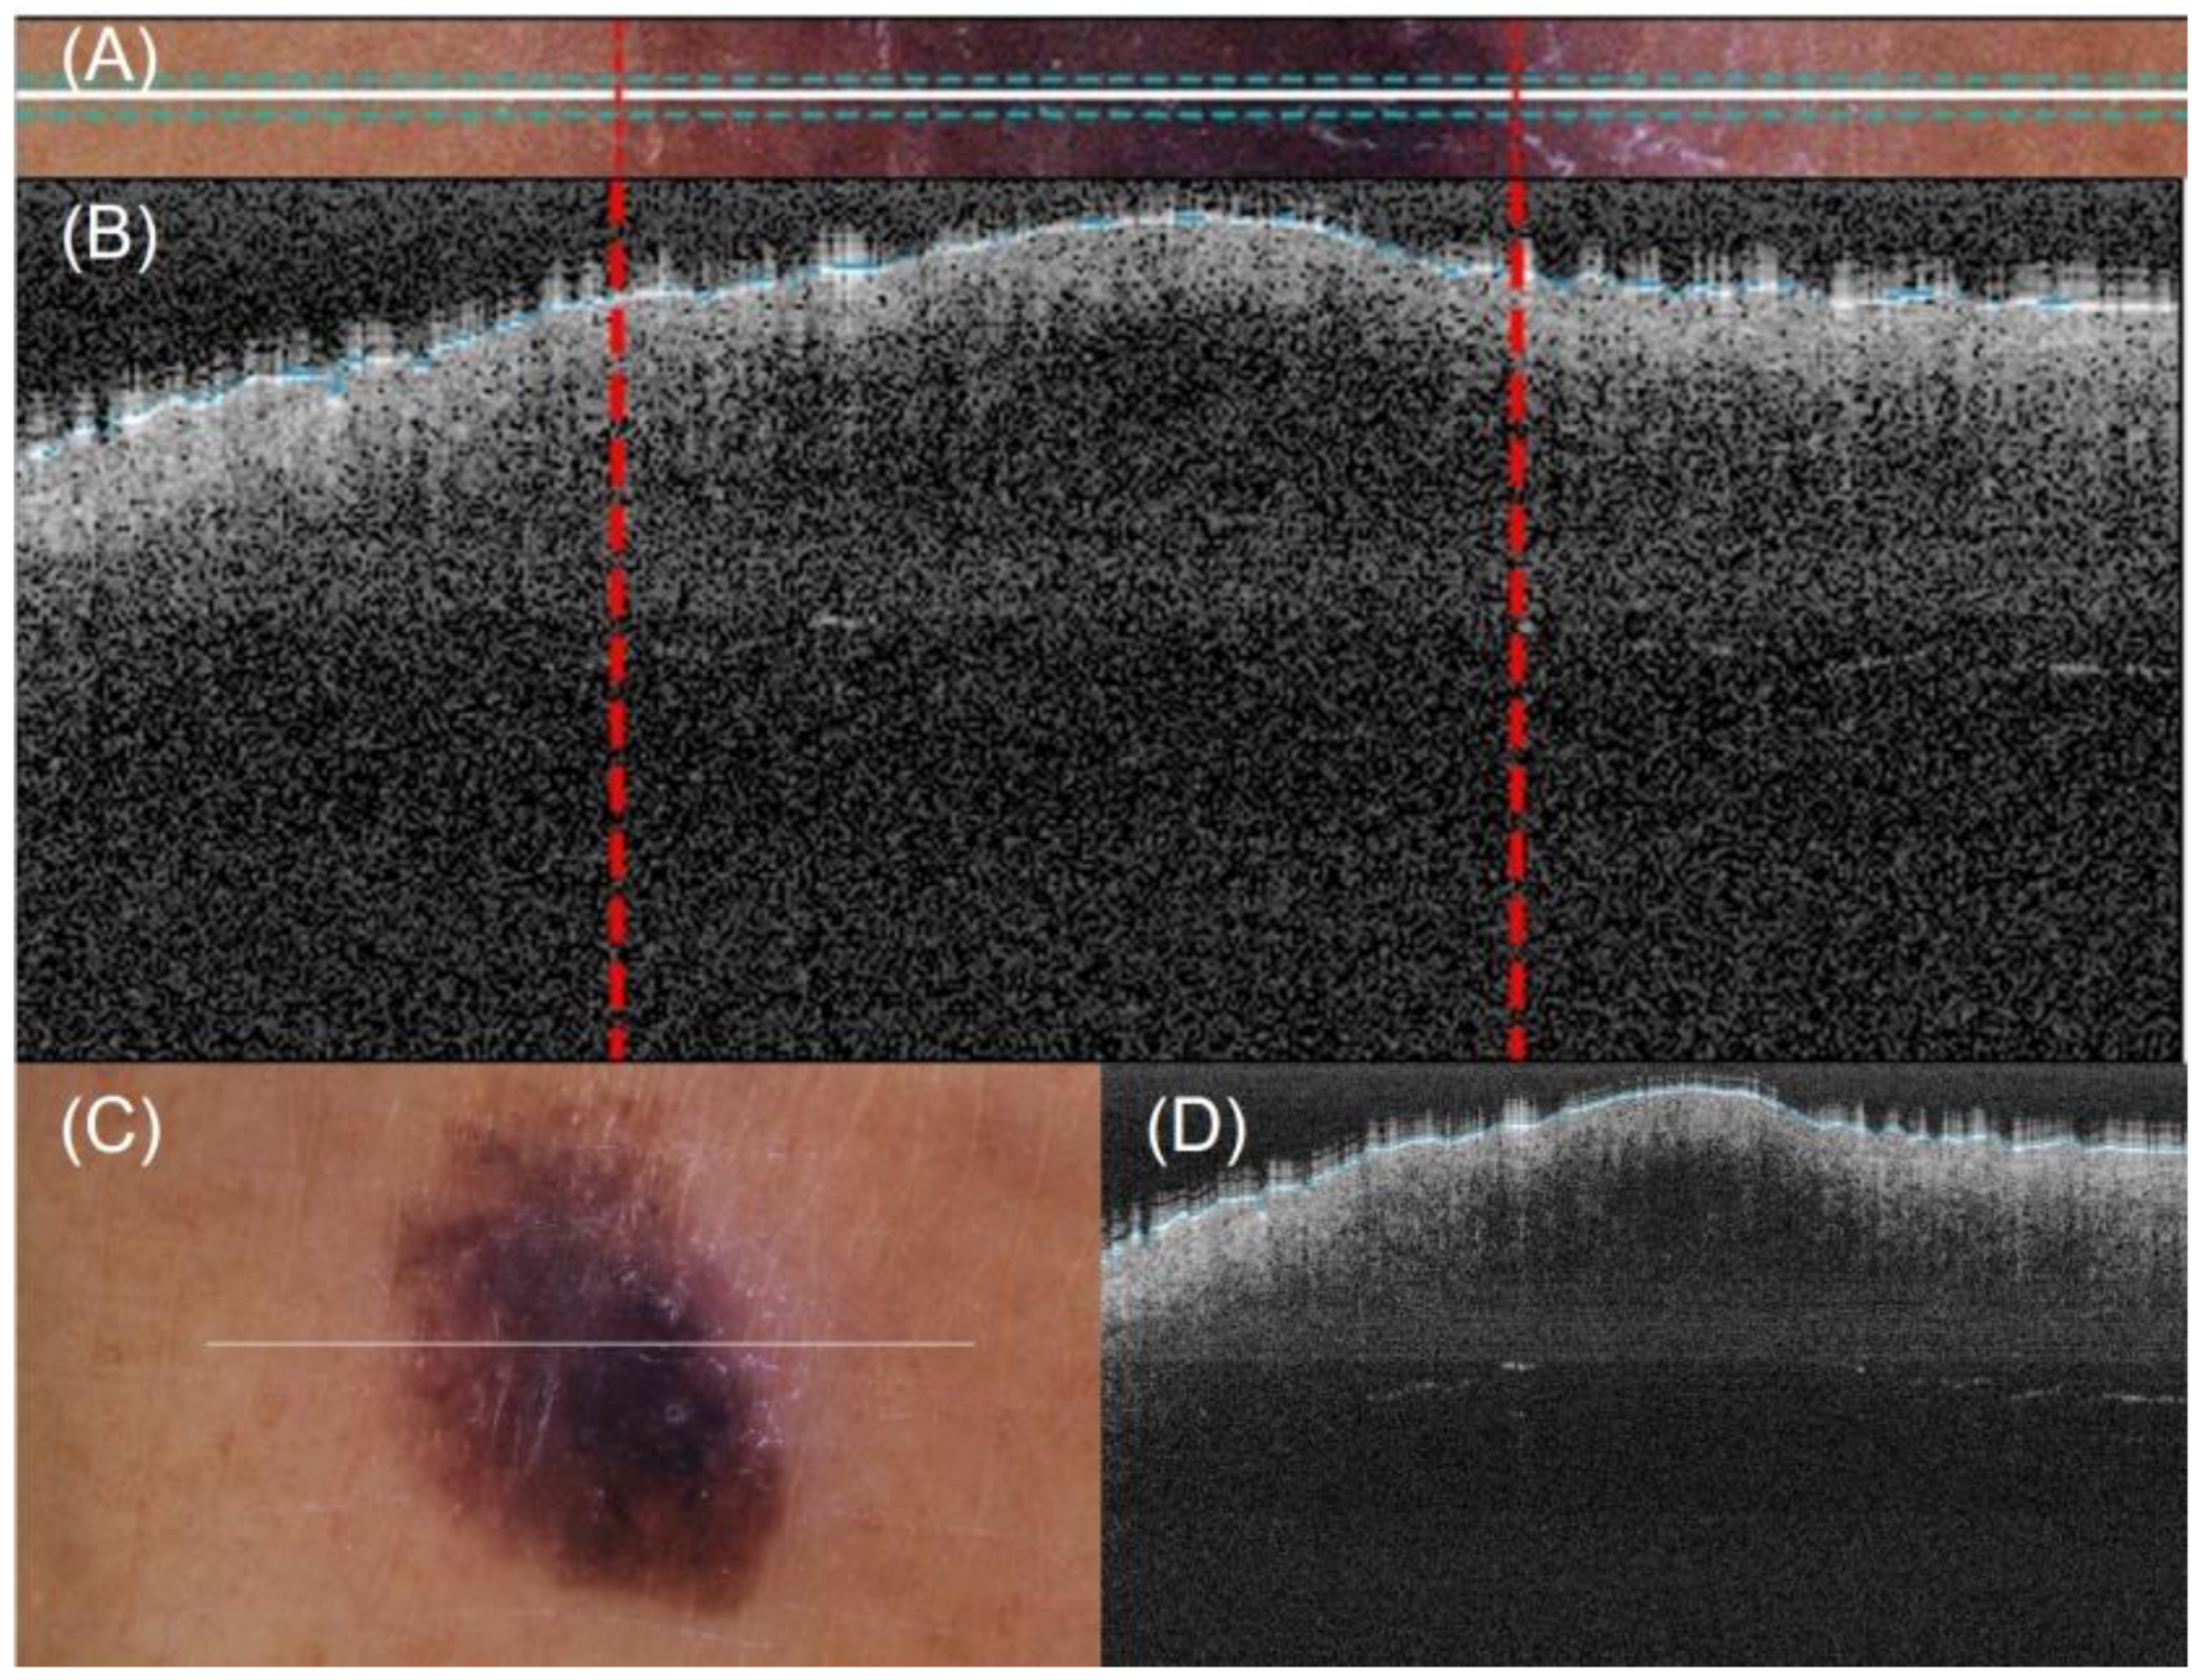
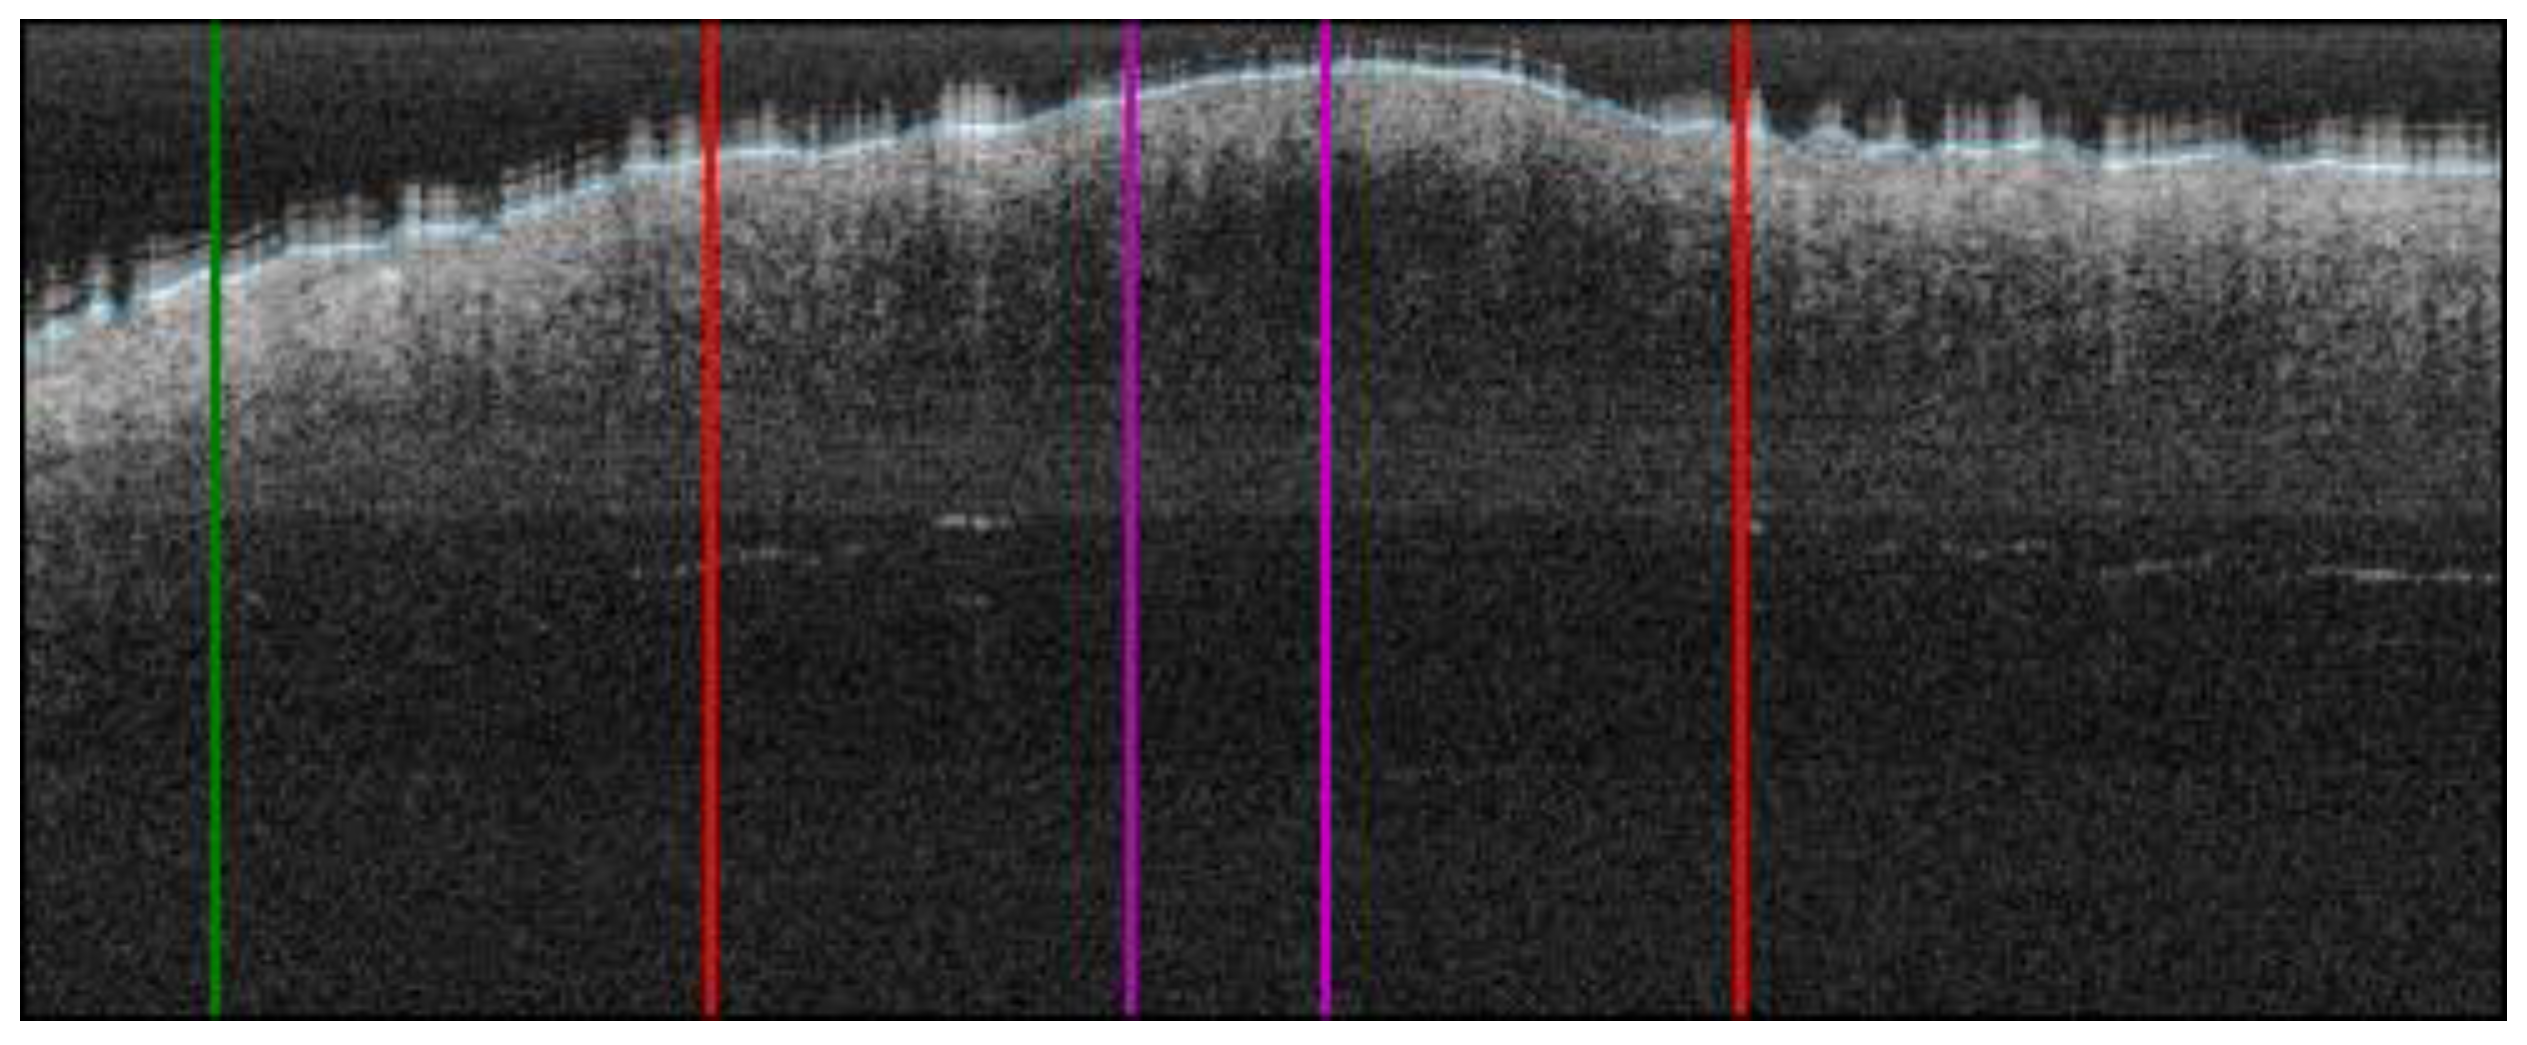
2.6.1. Automatic Lesion Delimitation
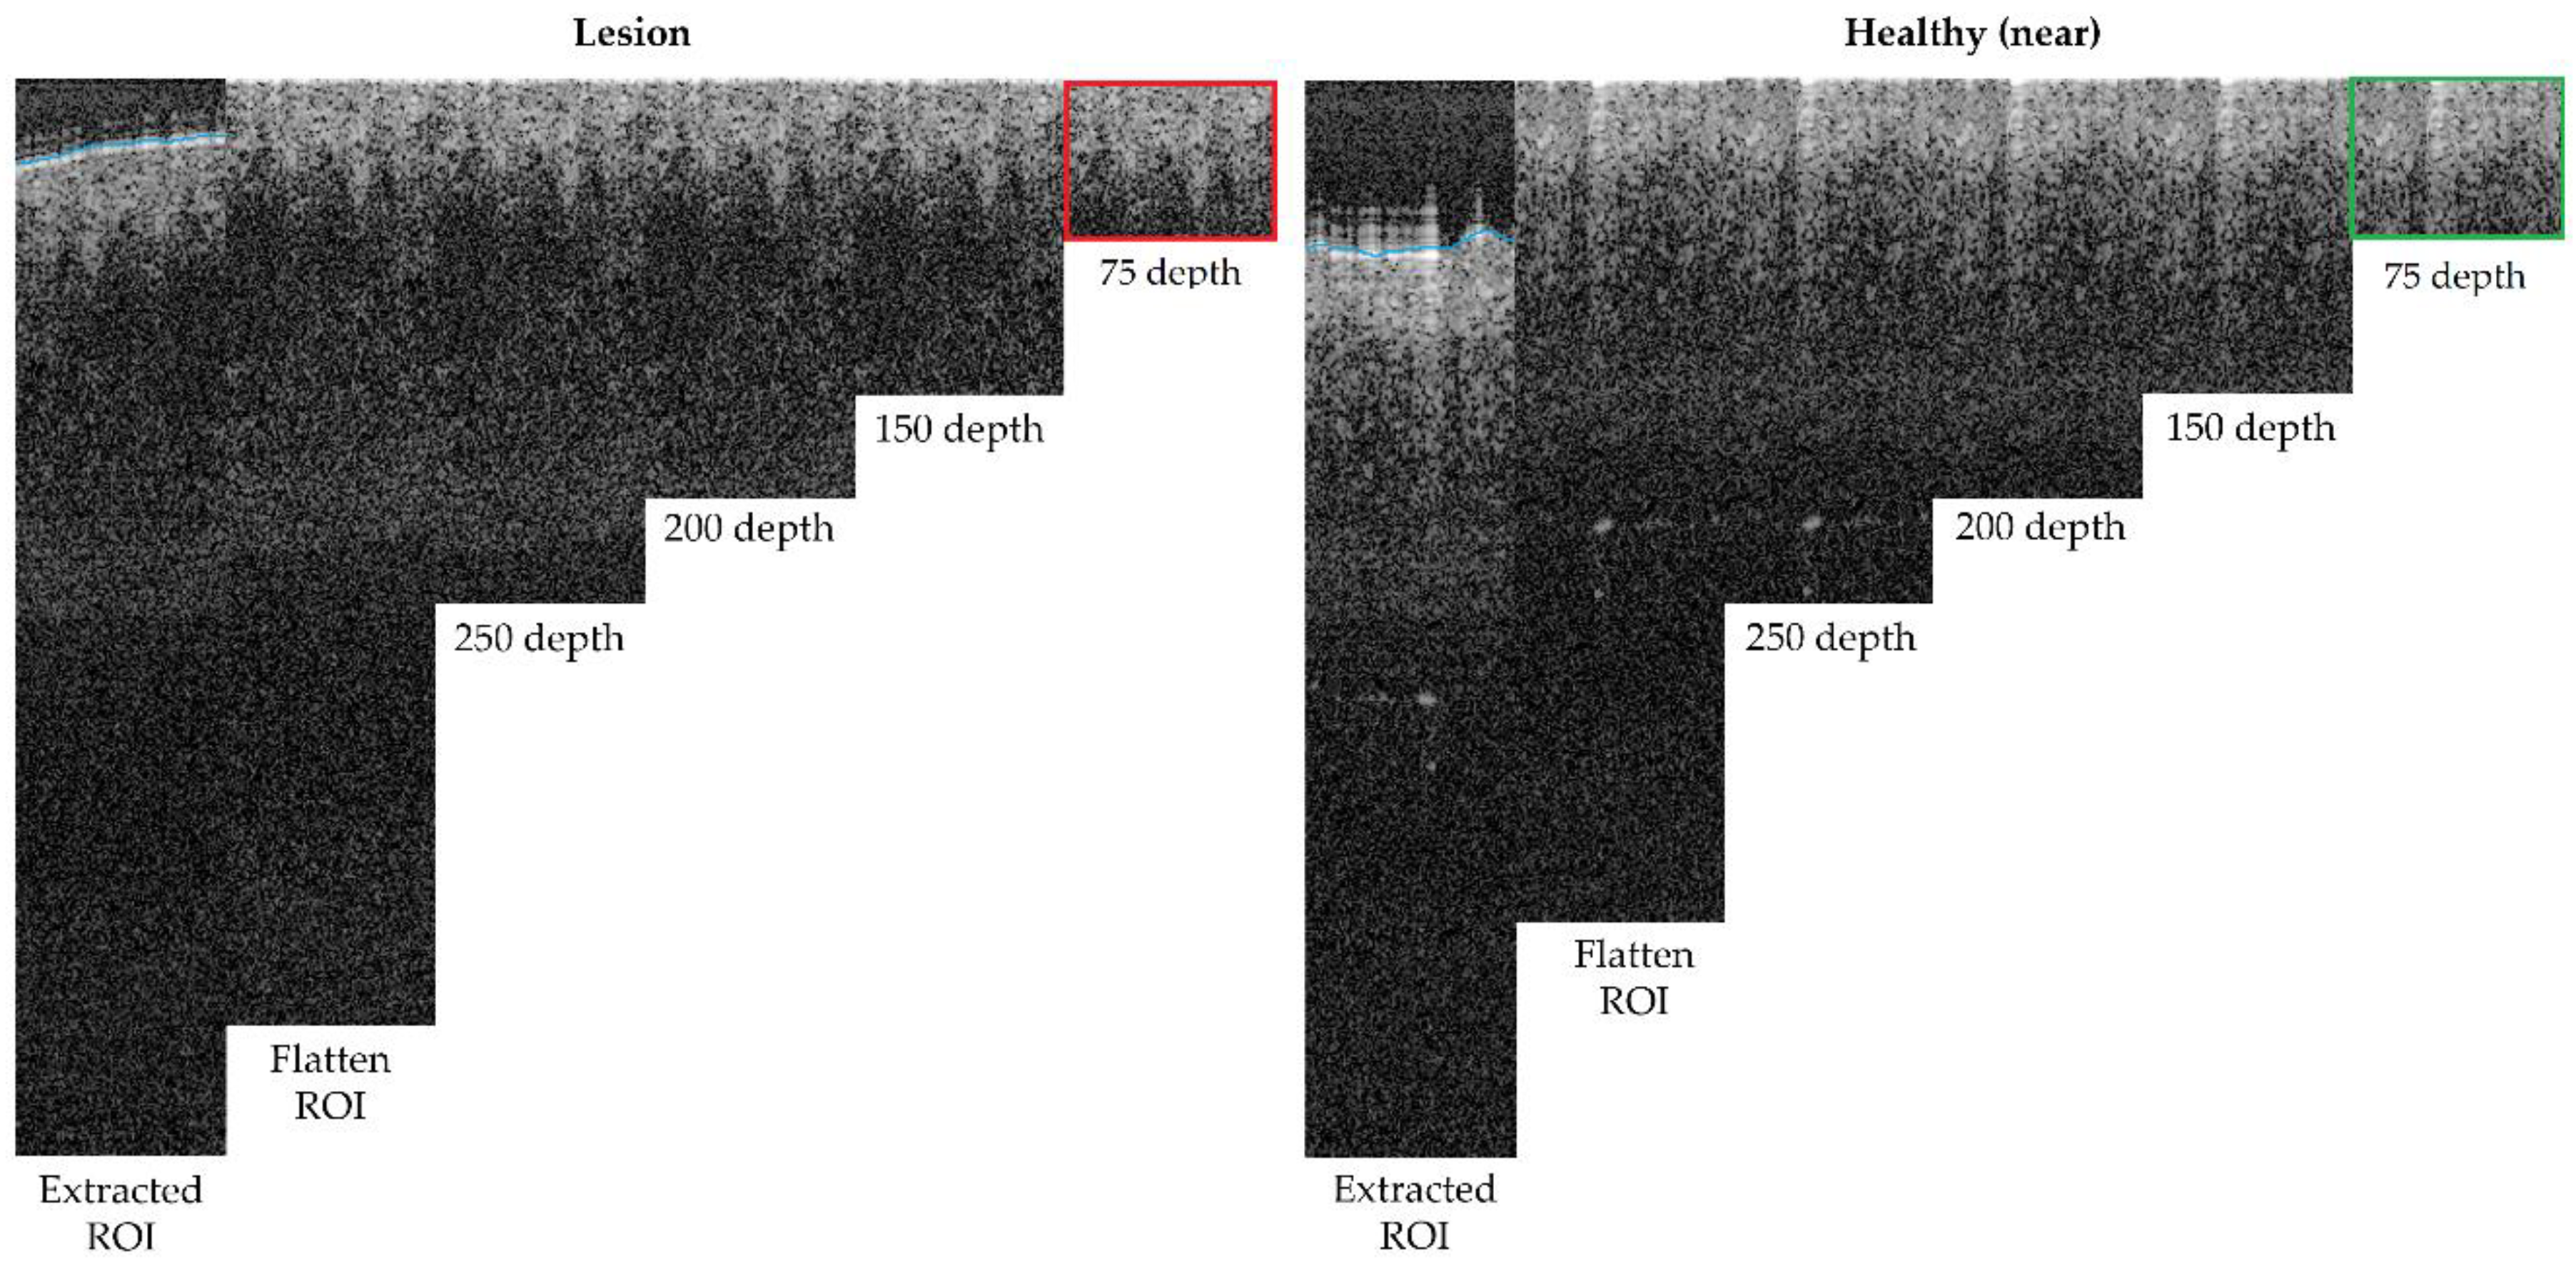
2.6.2. ROI Extraction
2.6.3. Optical Property Study
2.6.4. Textural Properties
3. Results
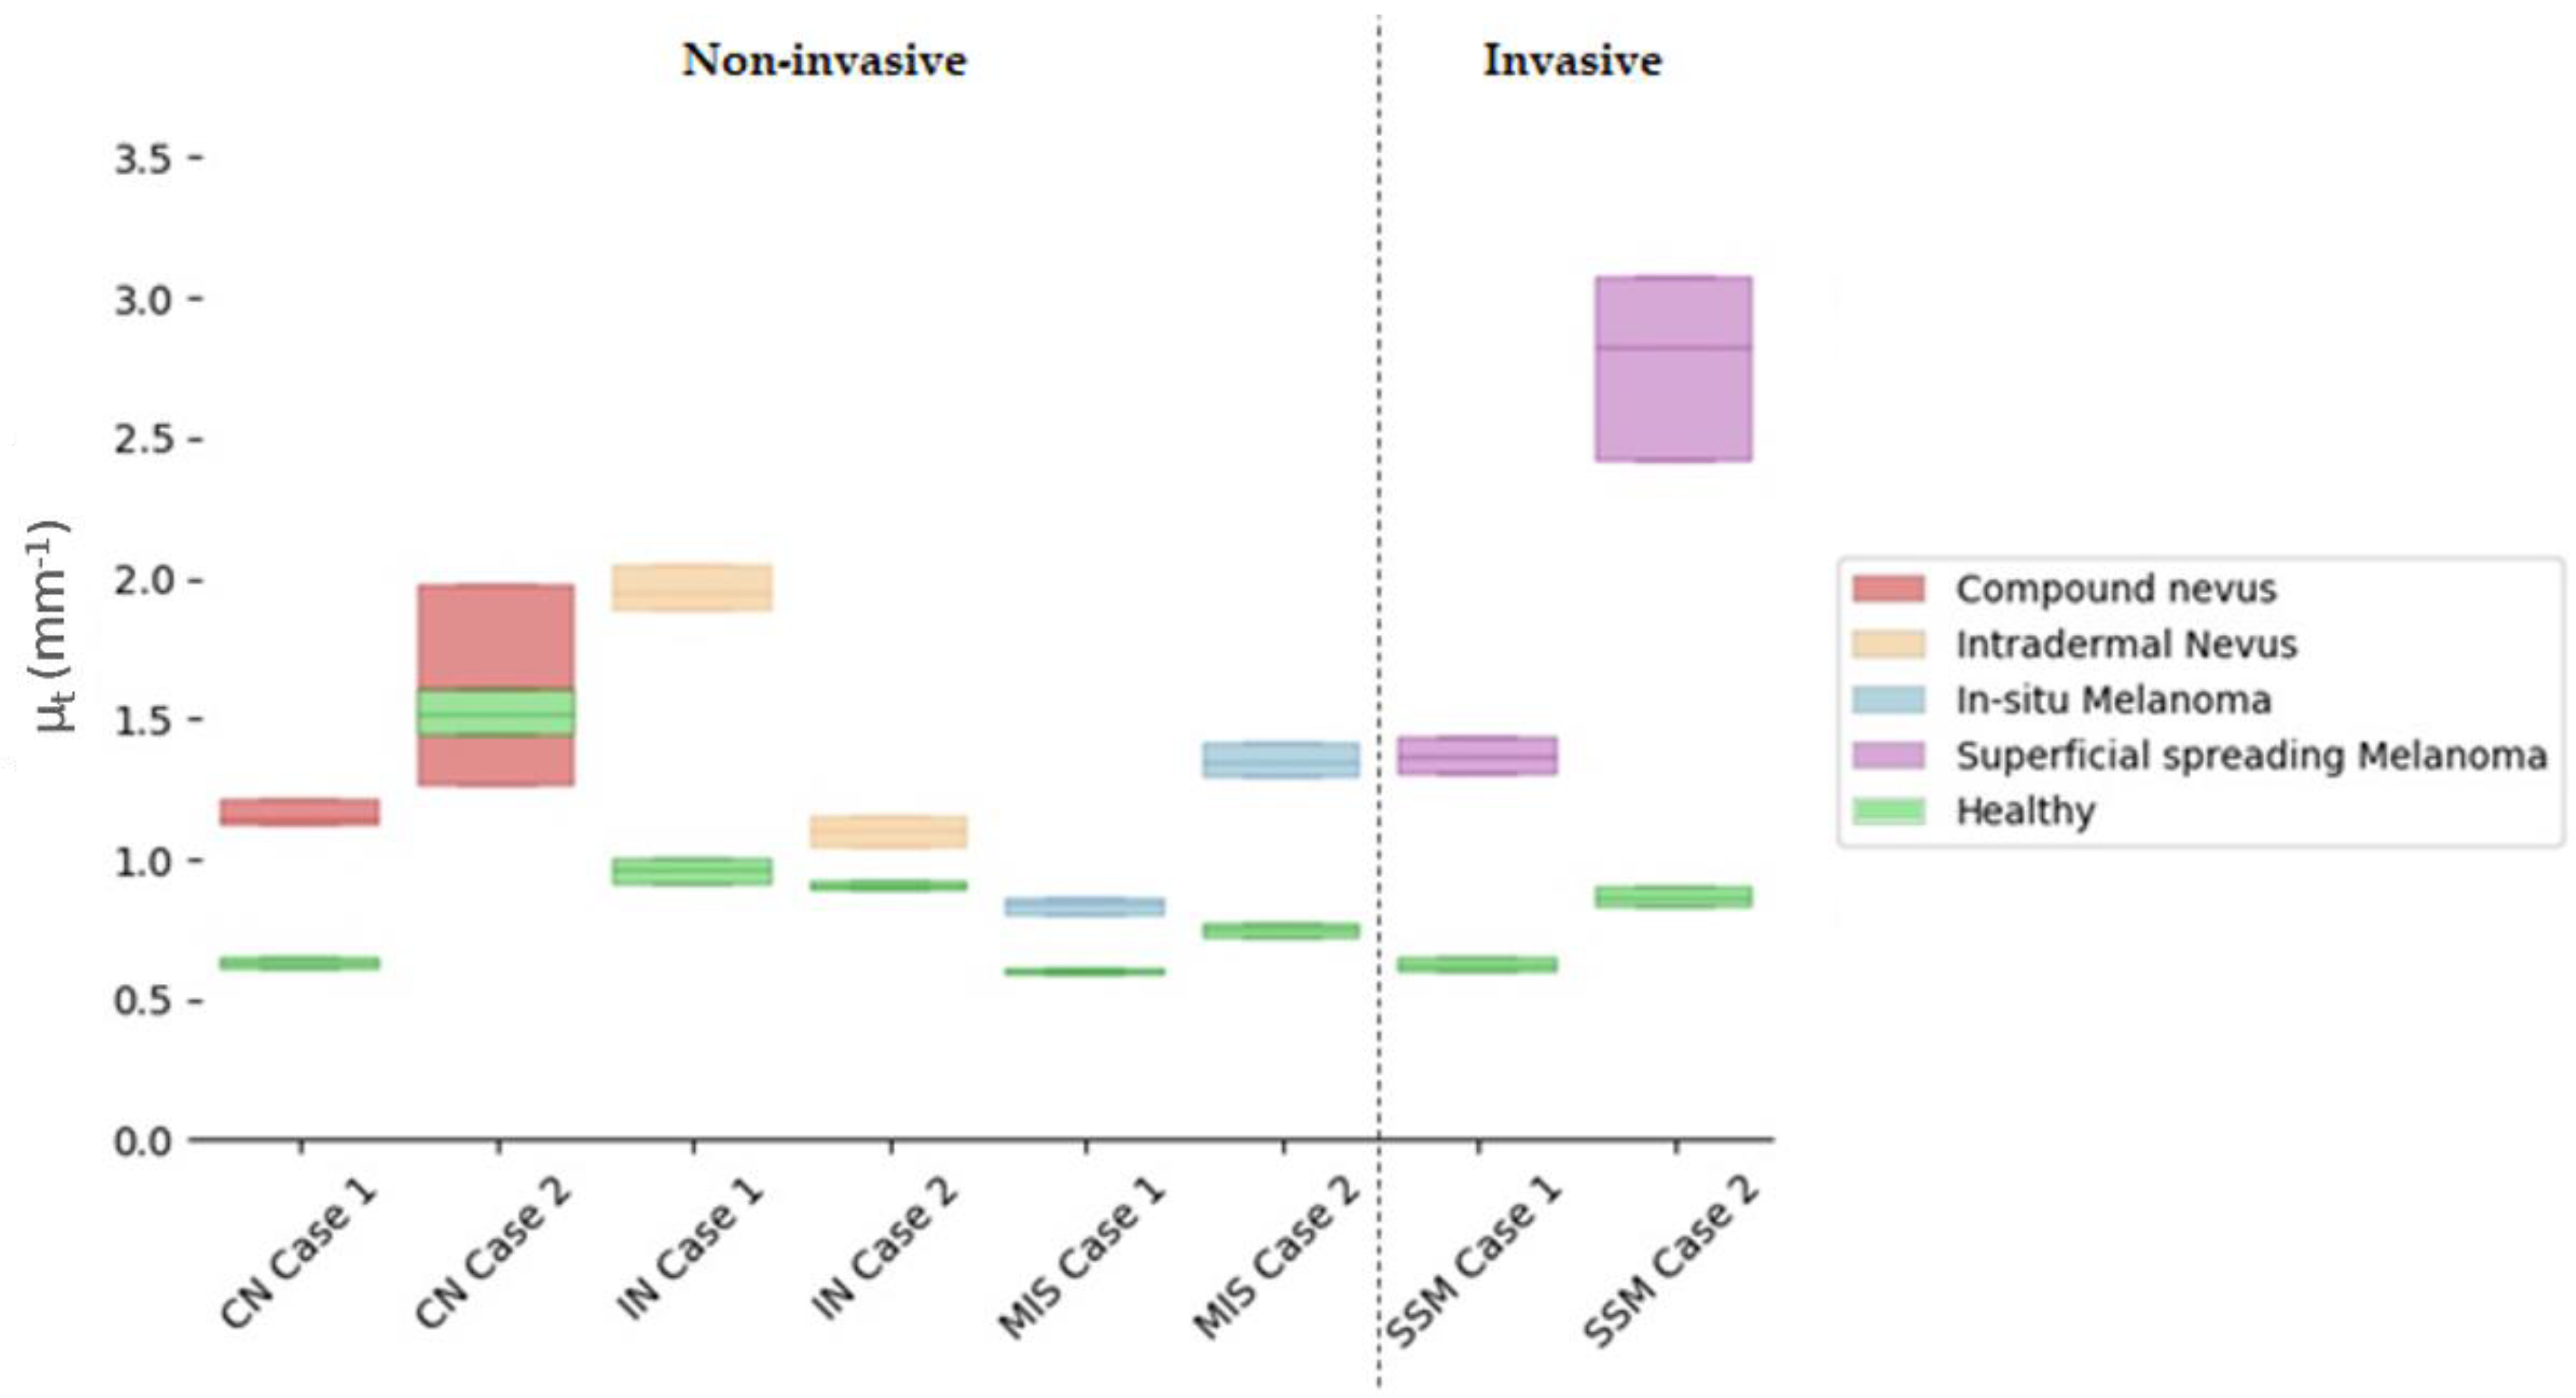
3.1. Optical Properties
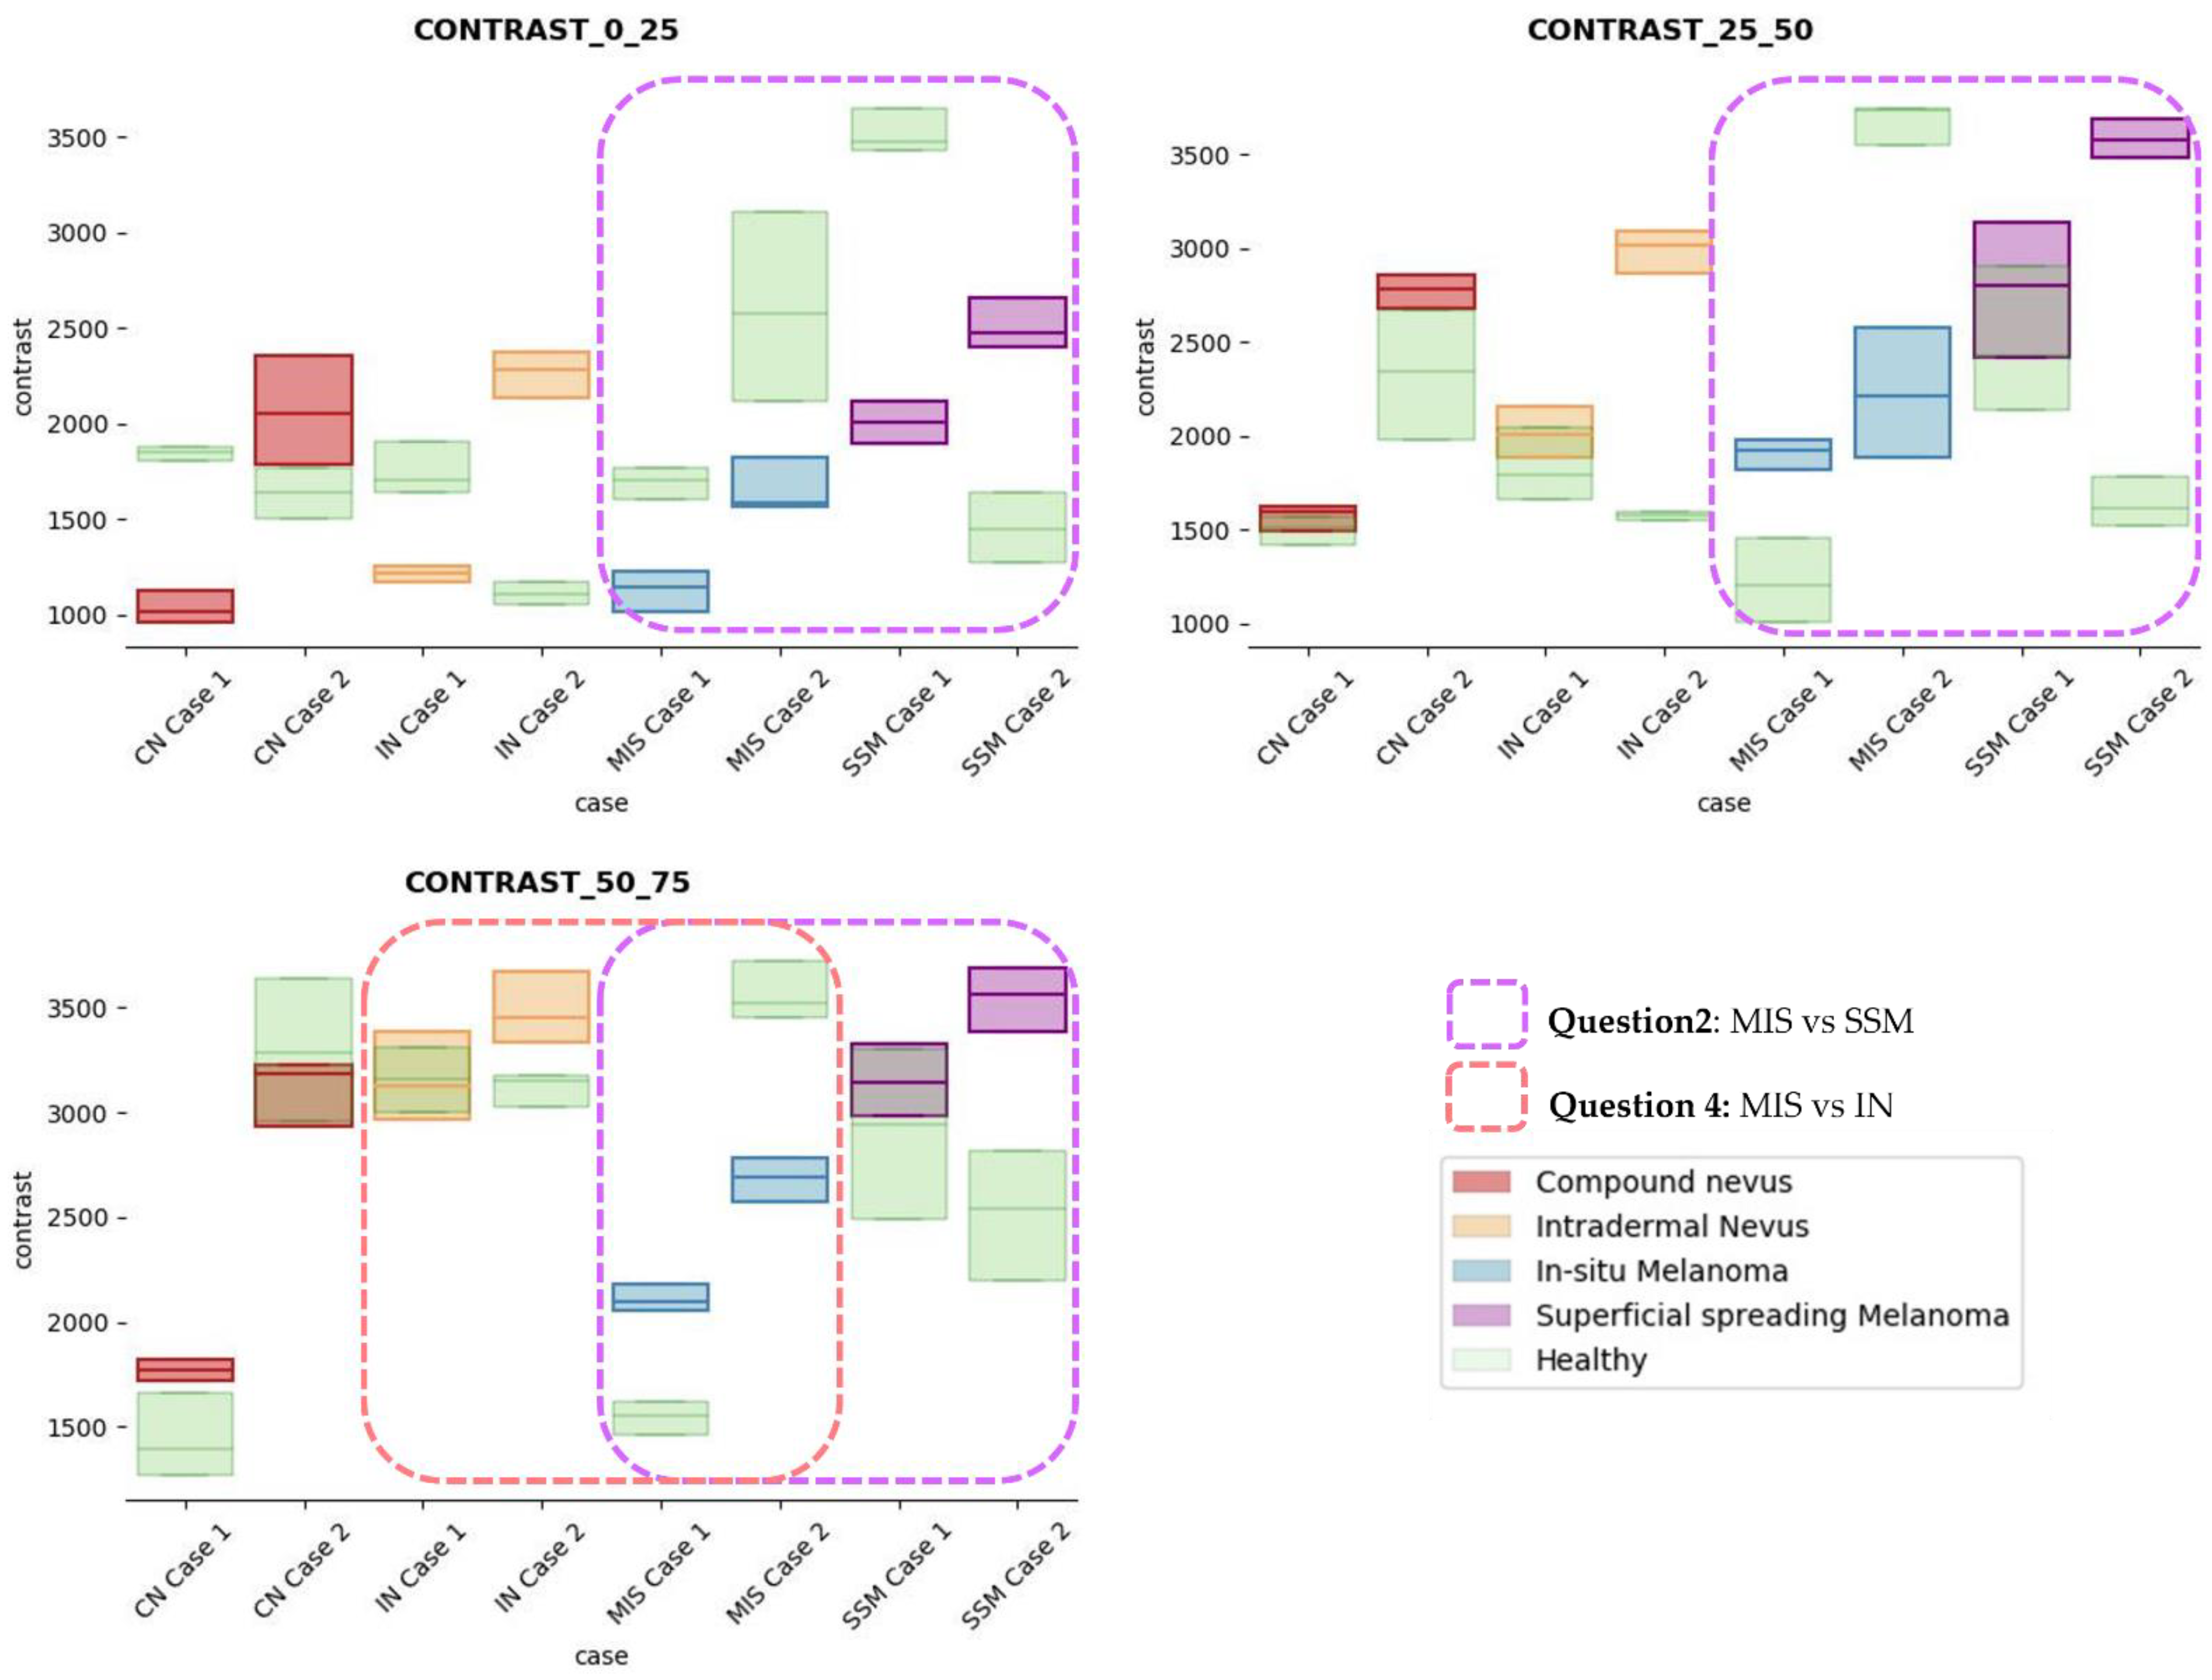
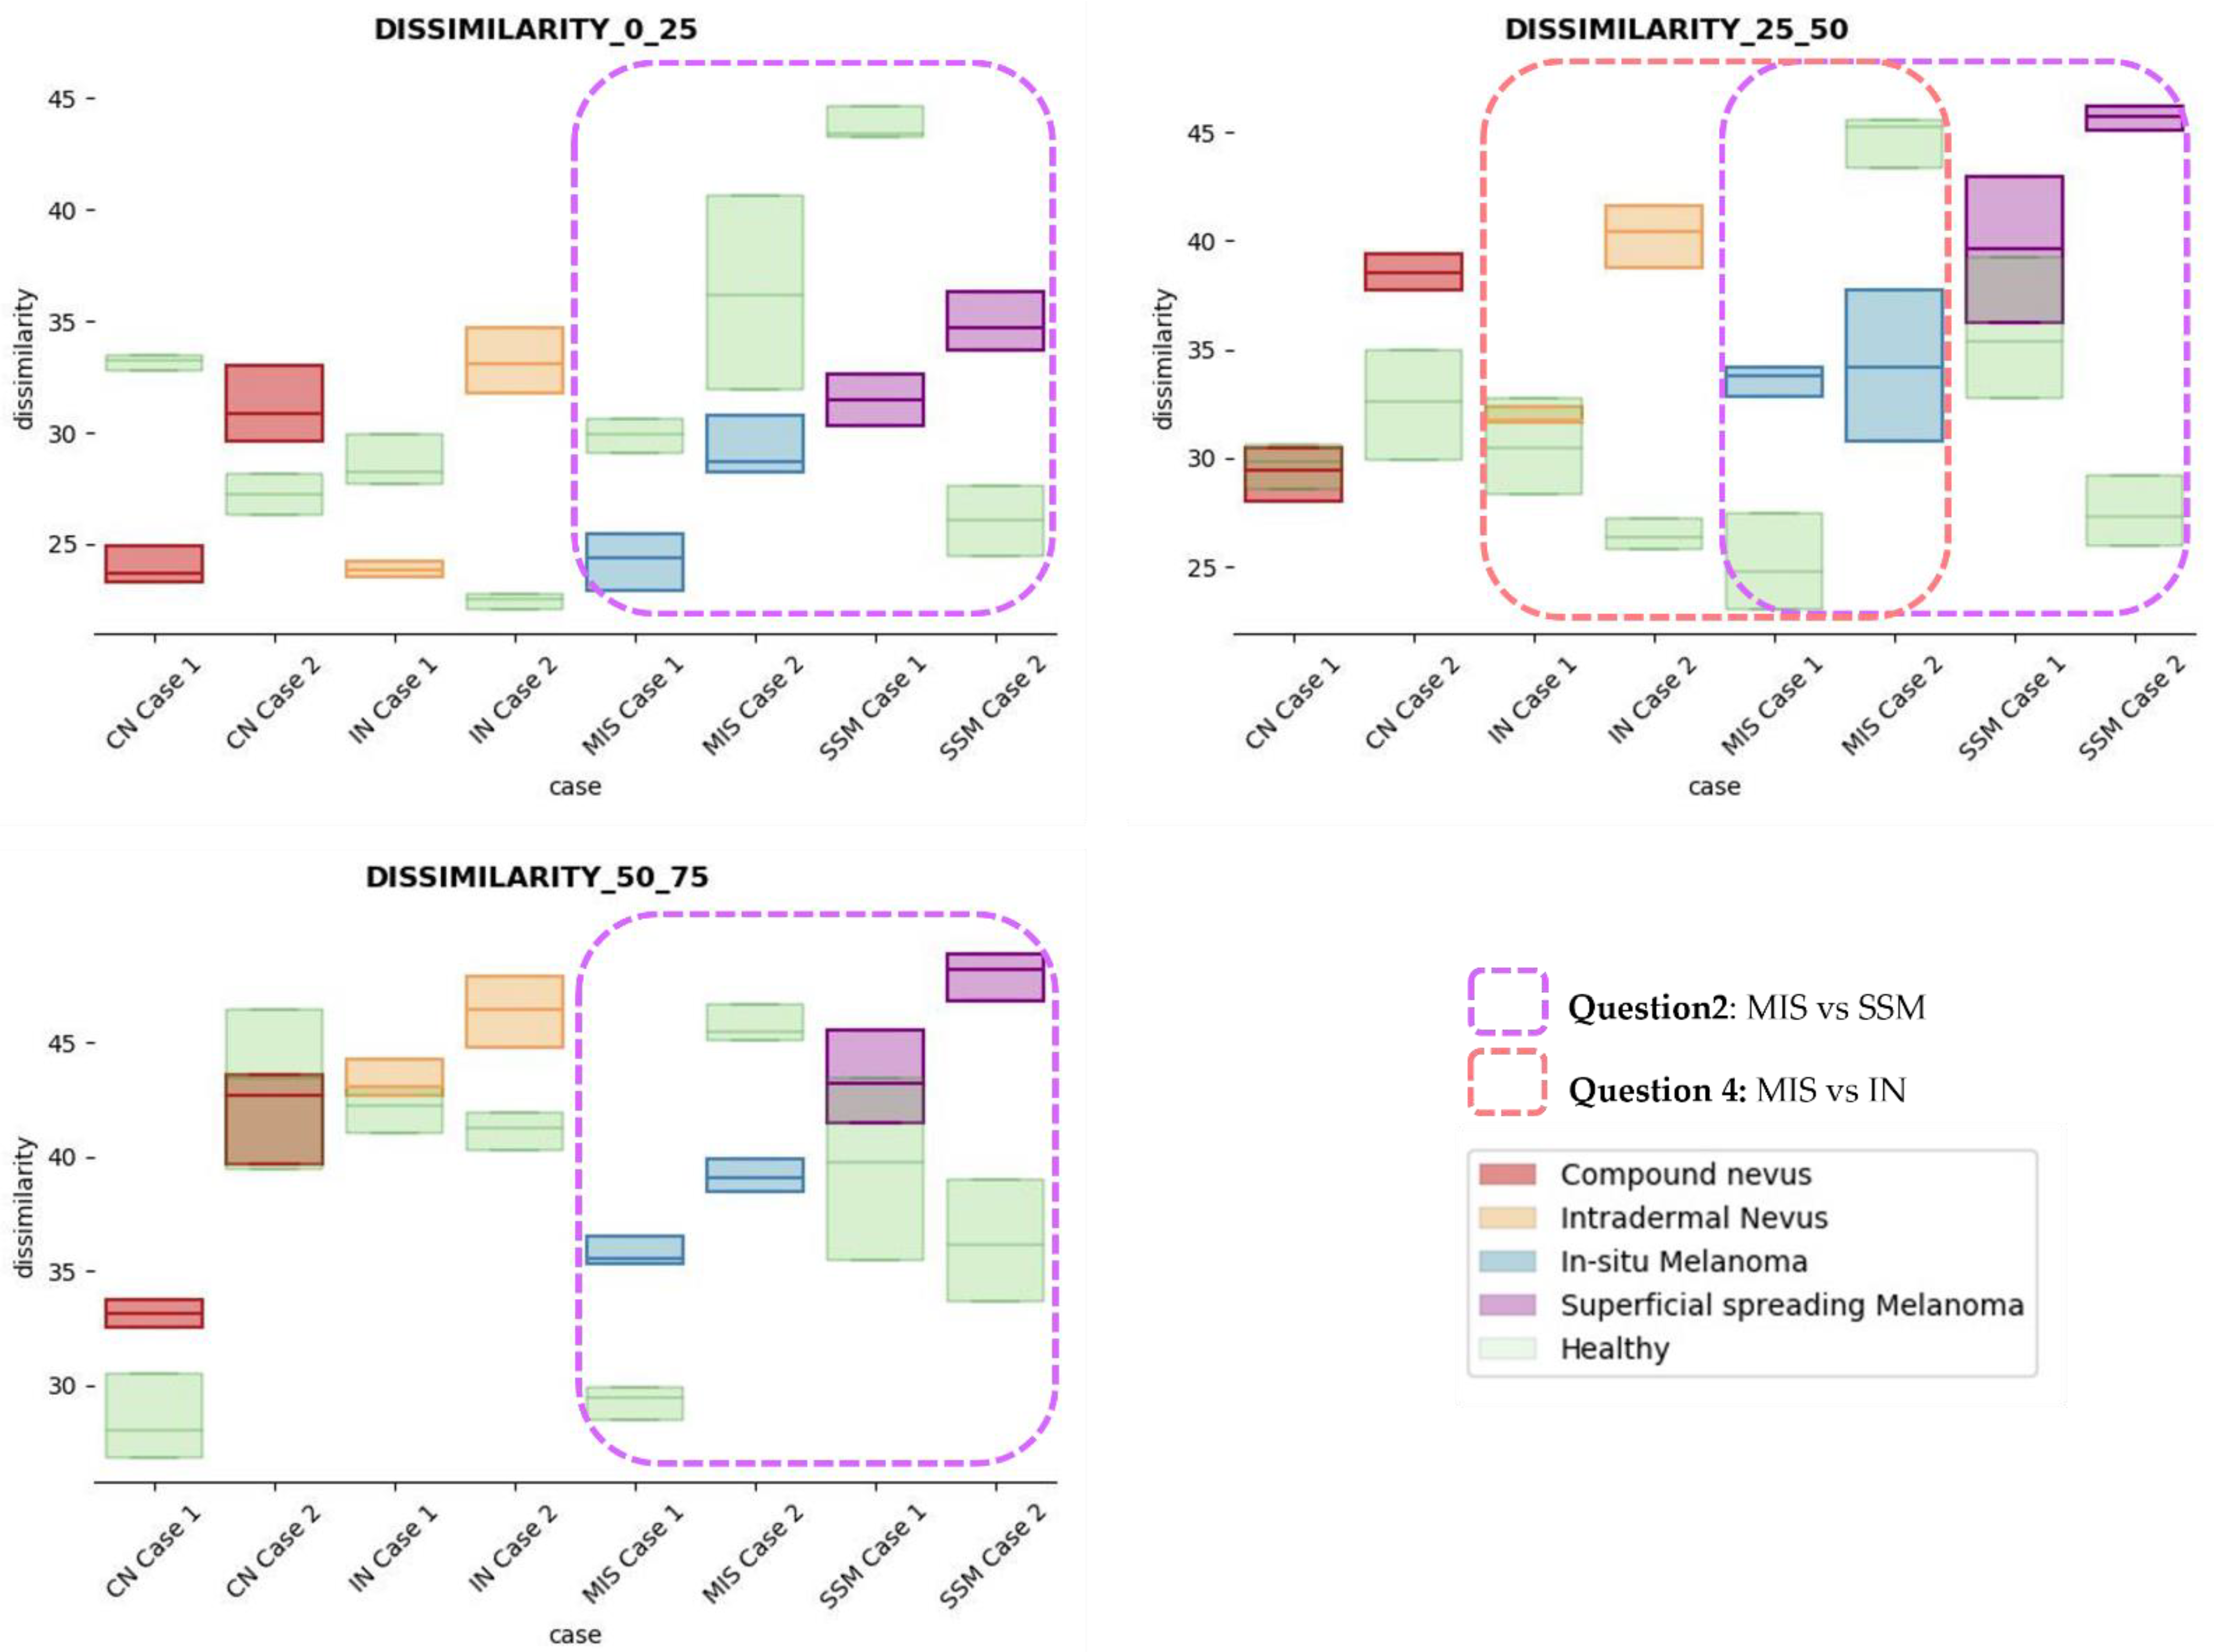
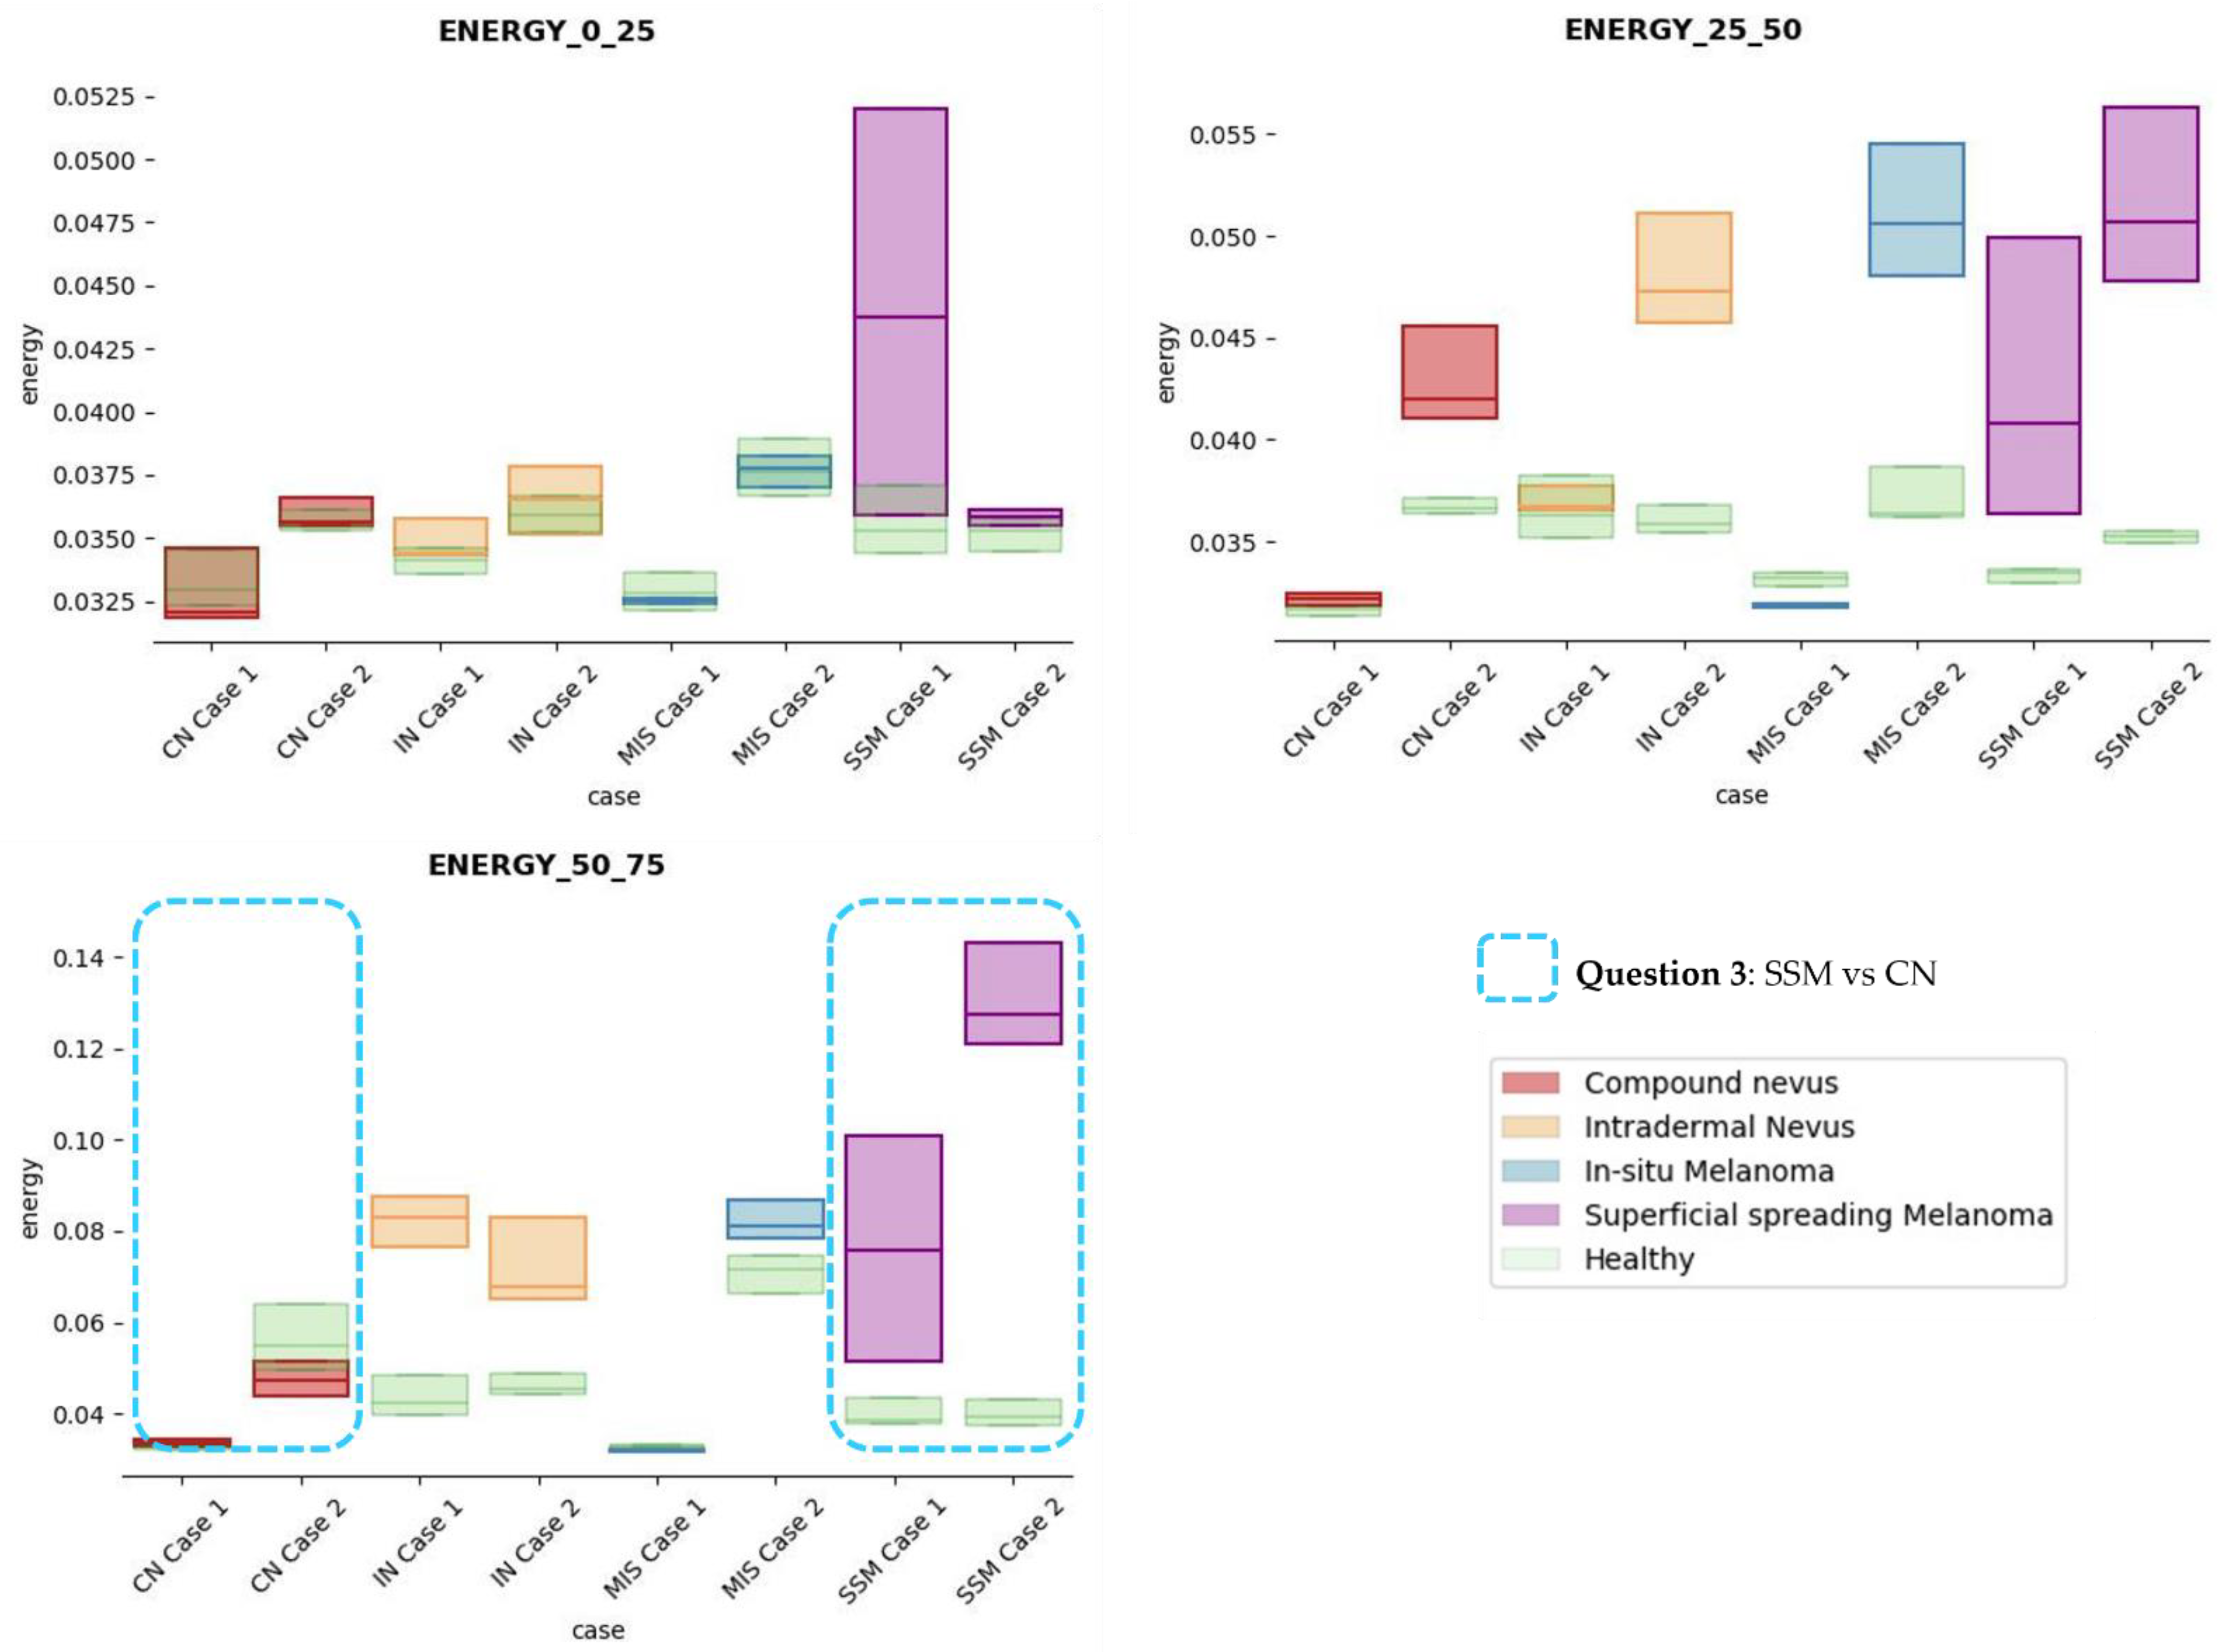
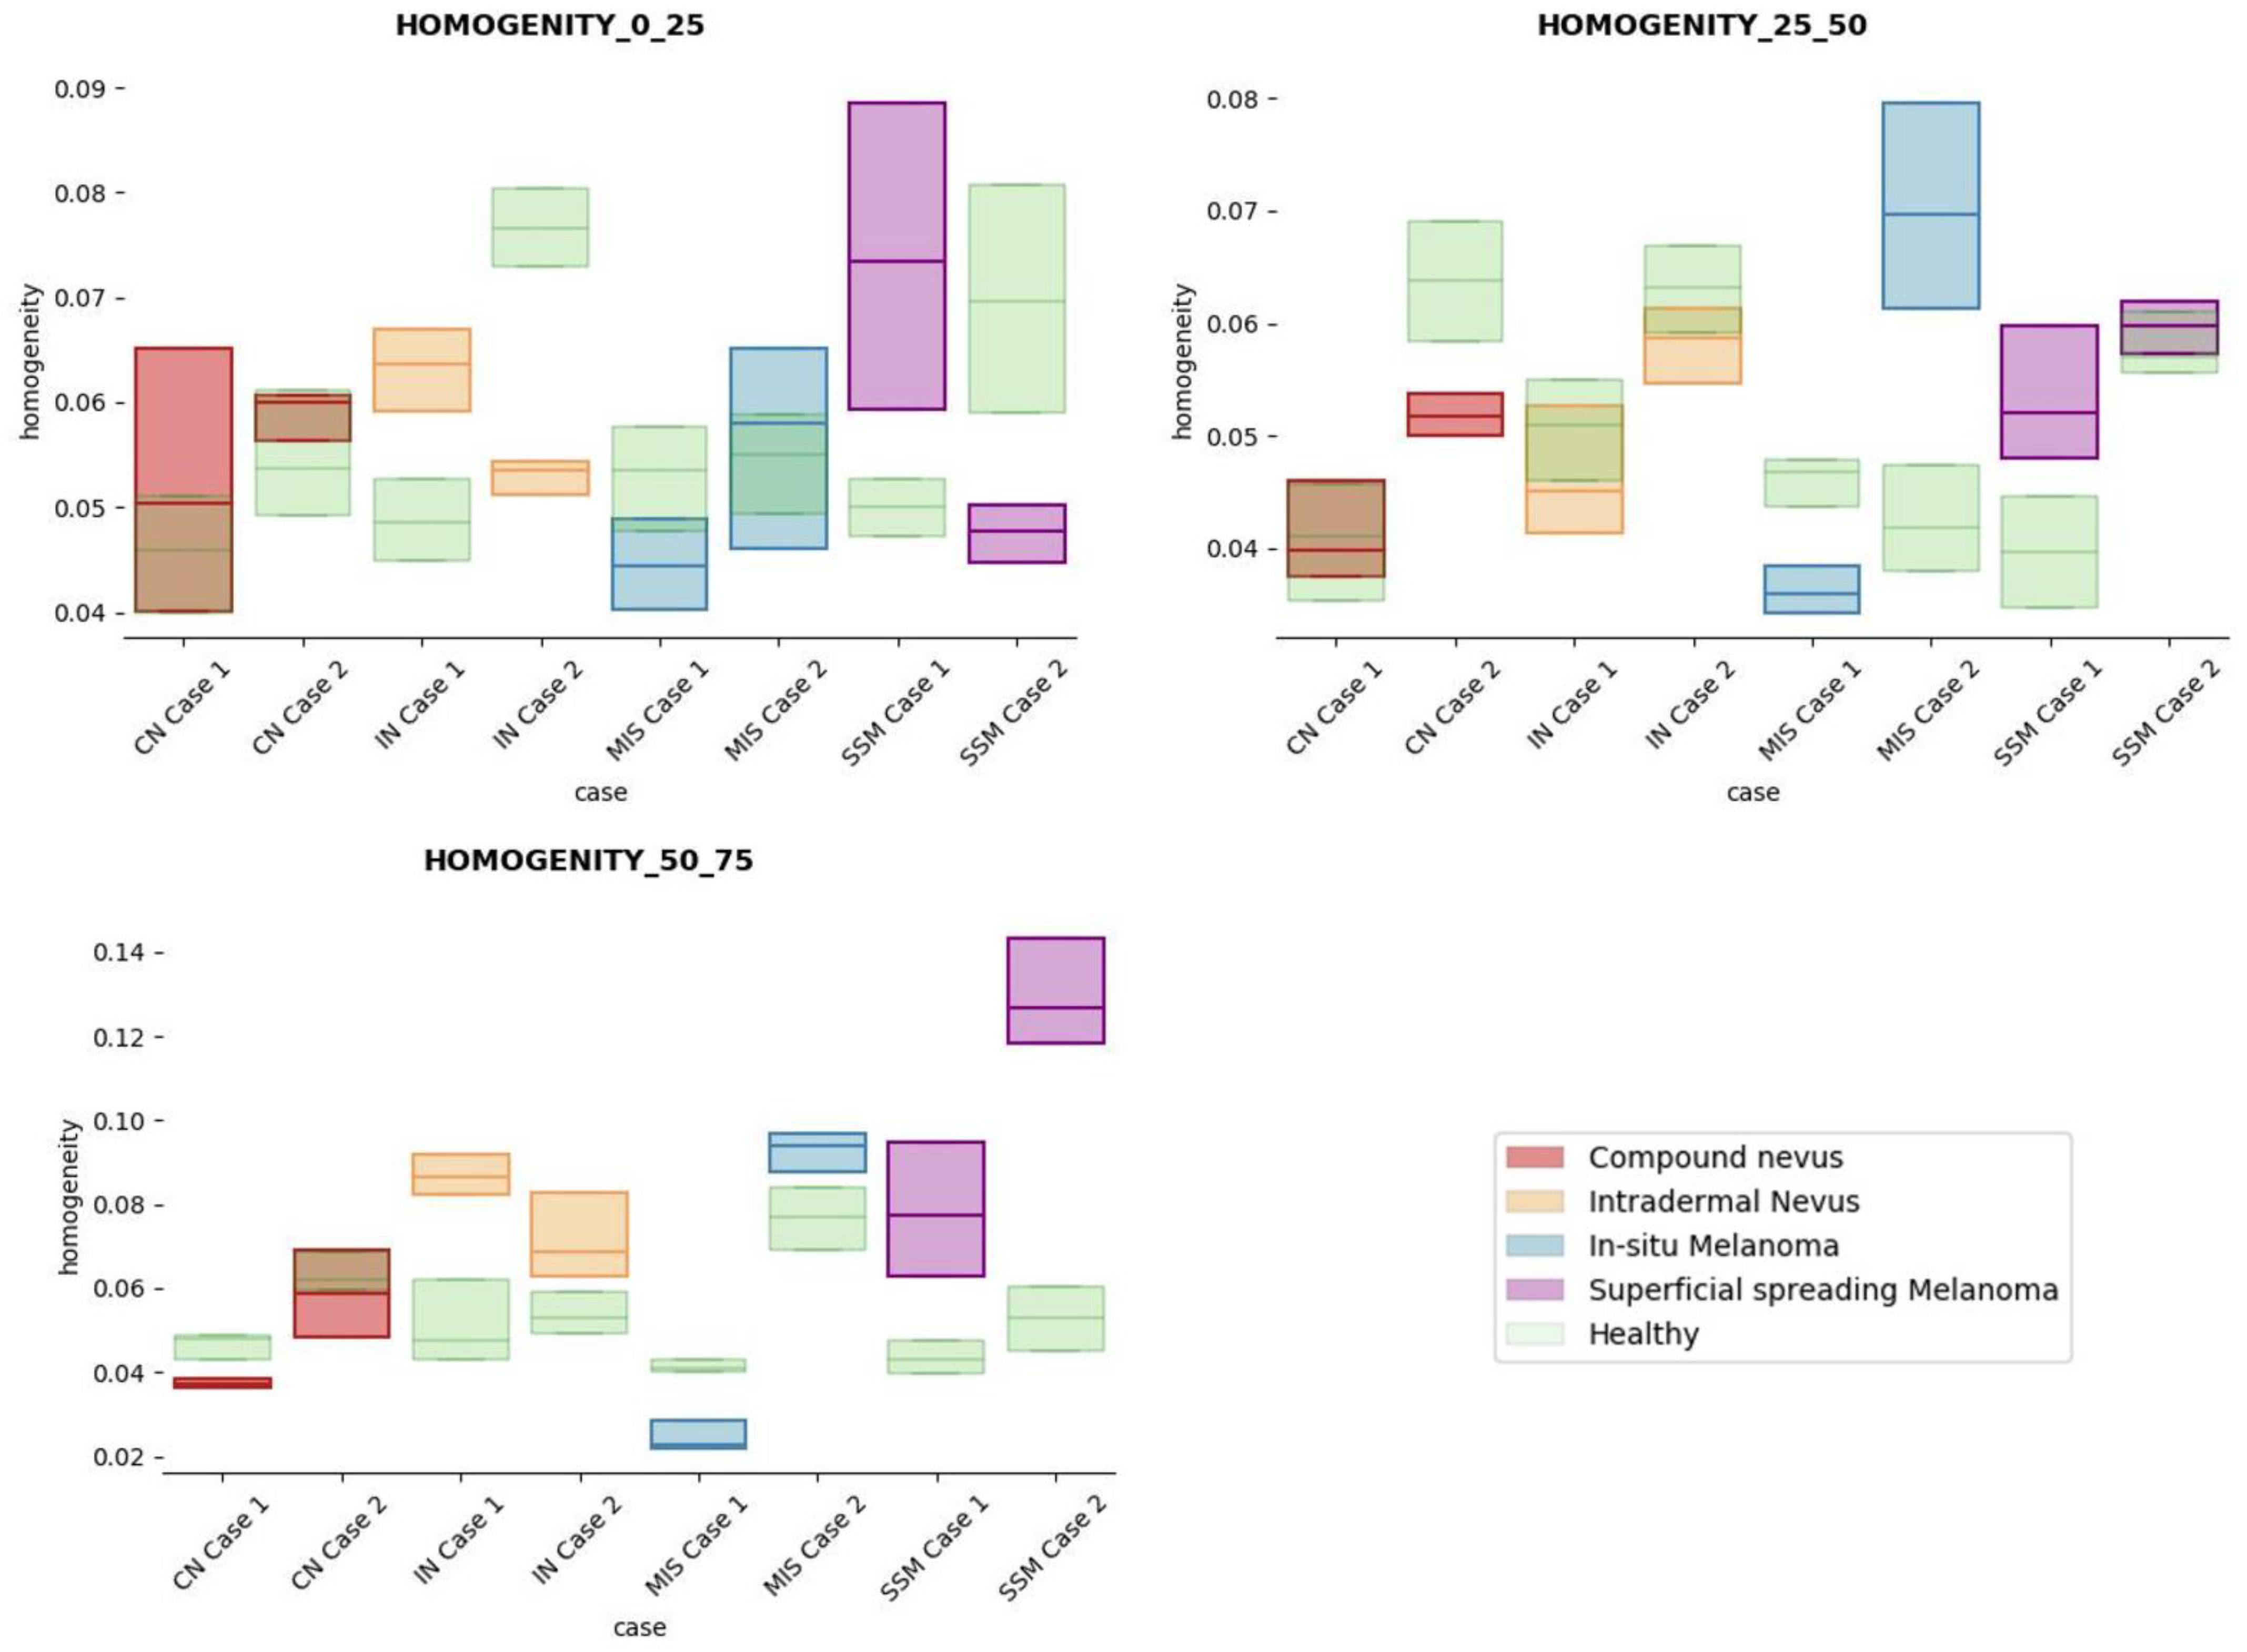
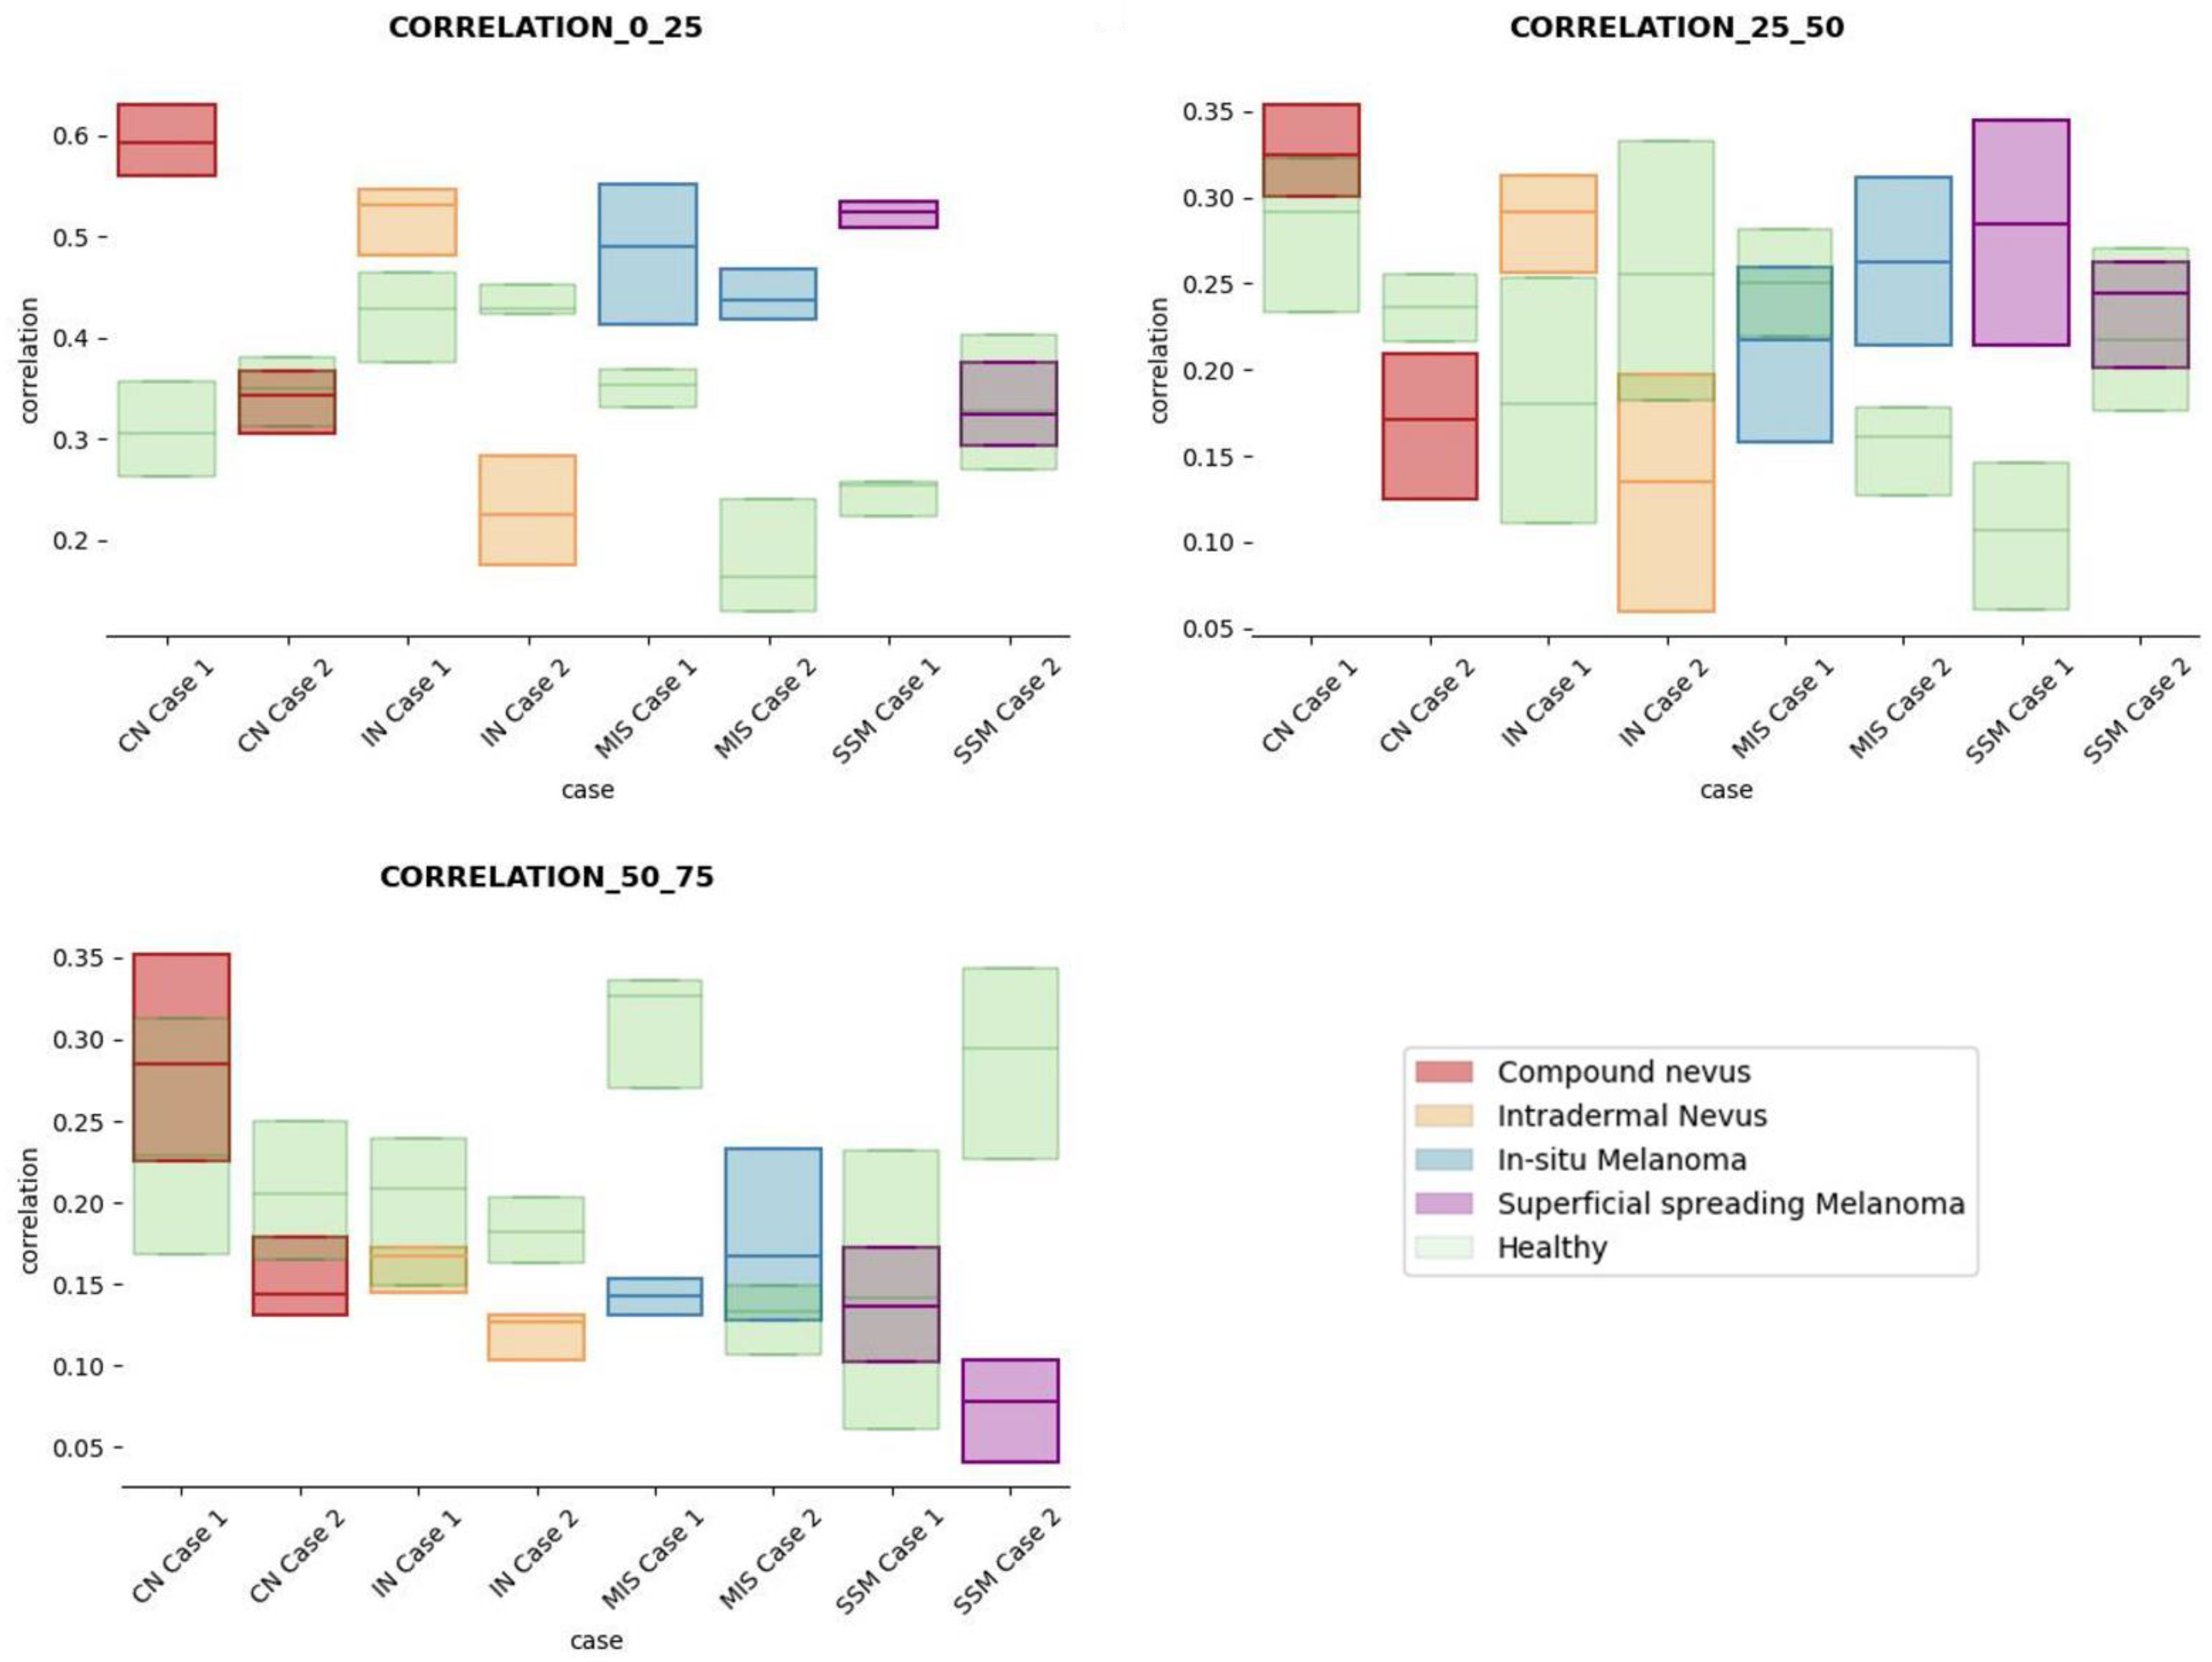
3.2. Textural Properties
4. Discussion and Conclusions
Author Contributions
Funding
Institutional Review Board Statement
Informed Consent Statement
Data Availability Statement
Acknowledgments
Conflicts of Interest
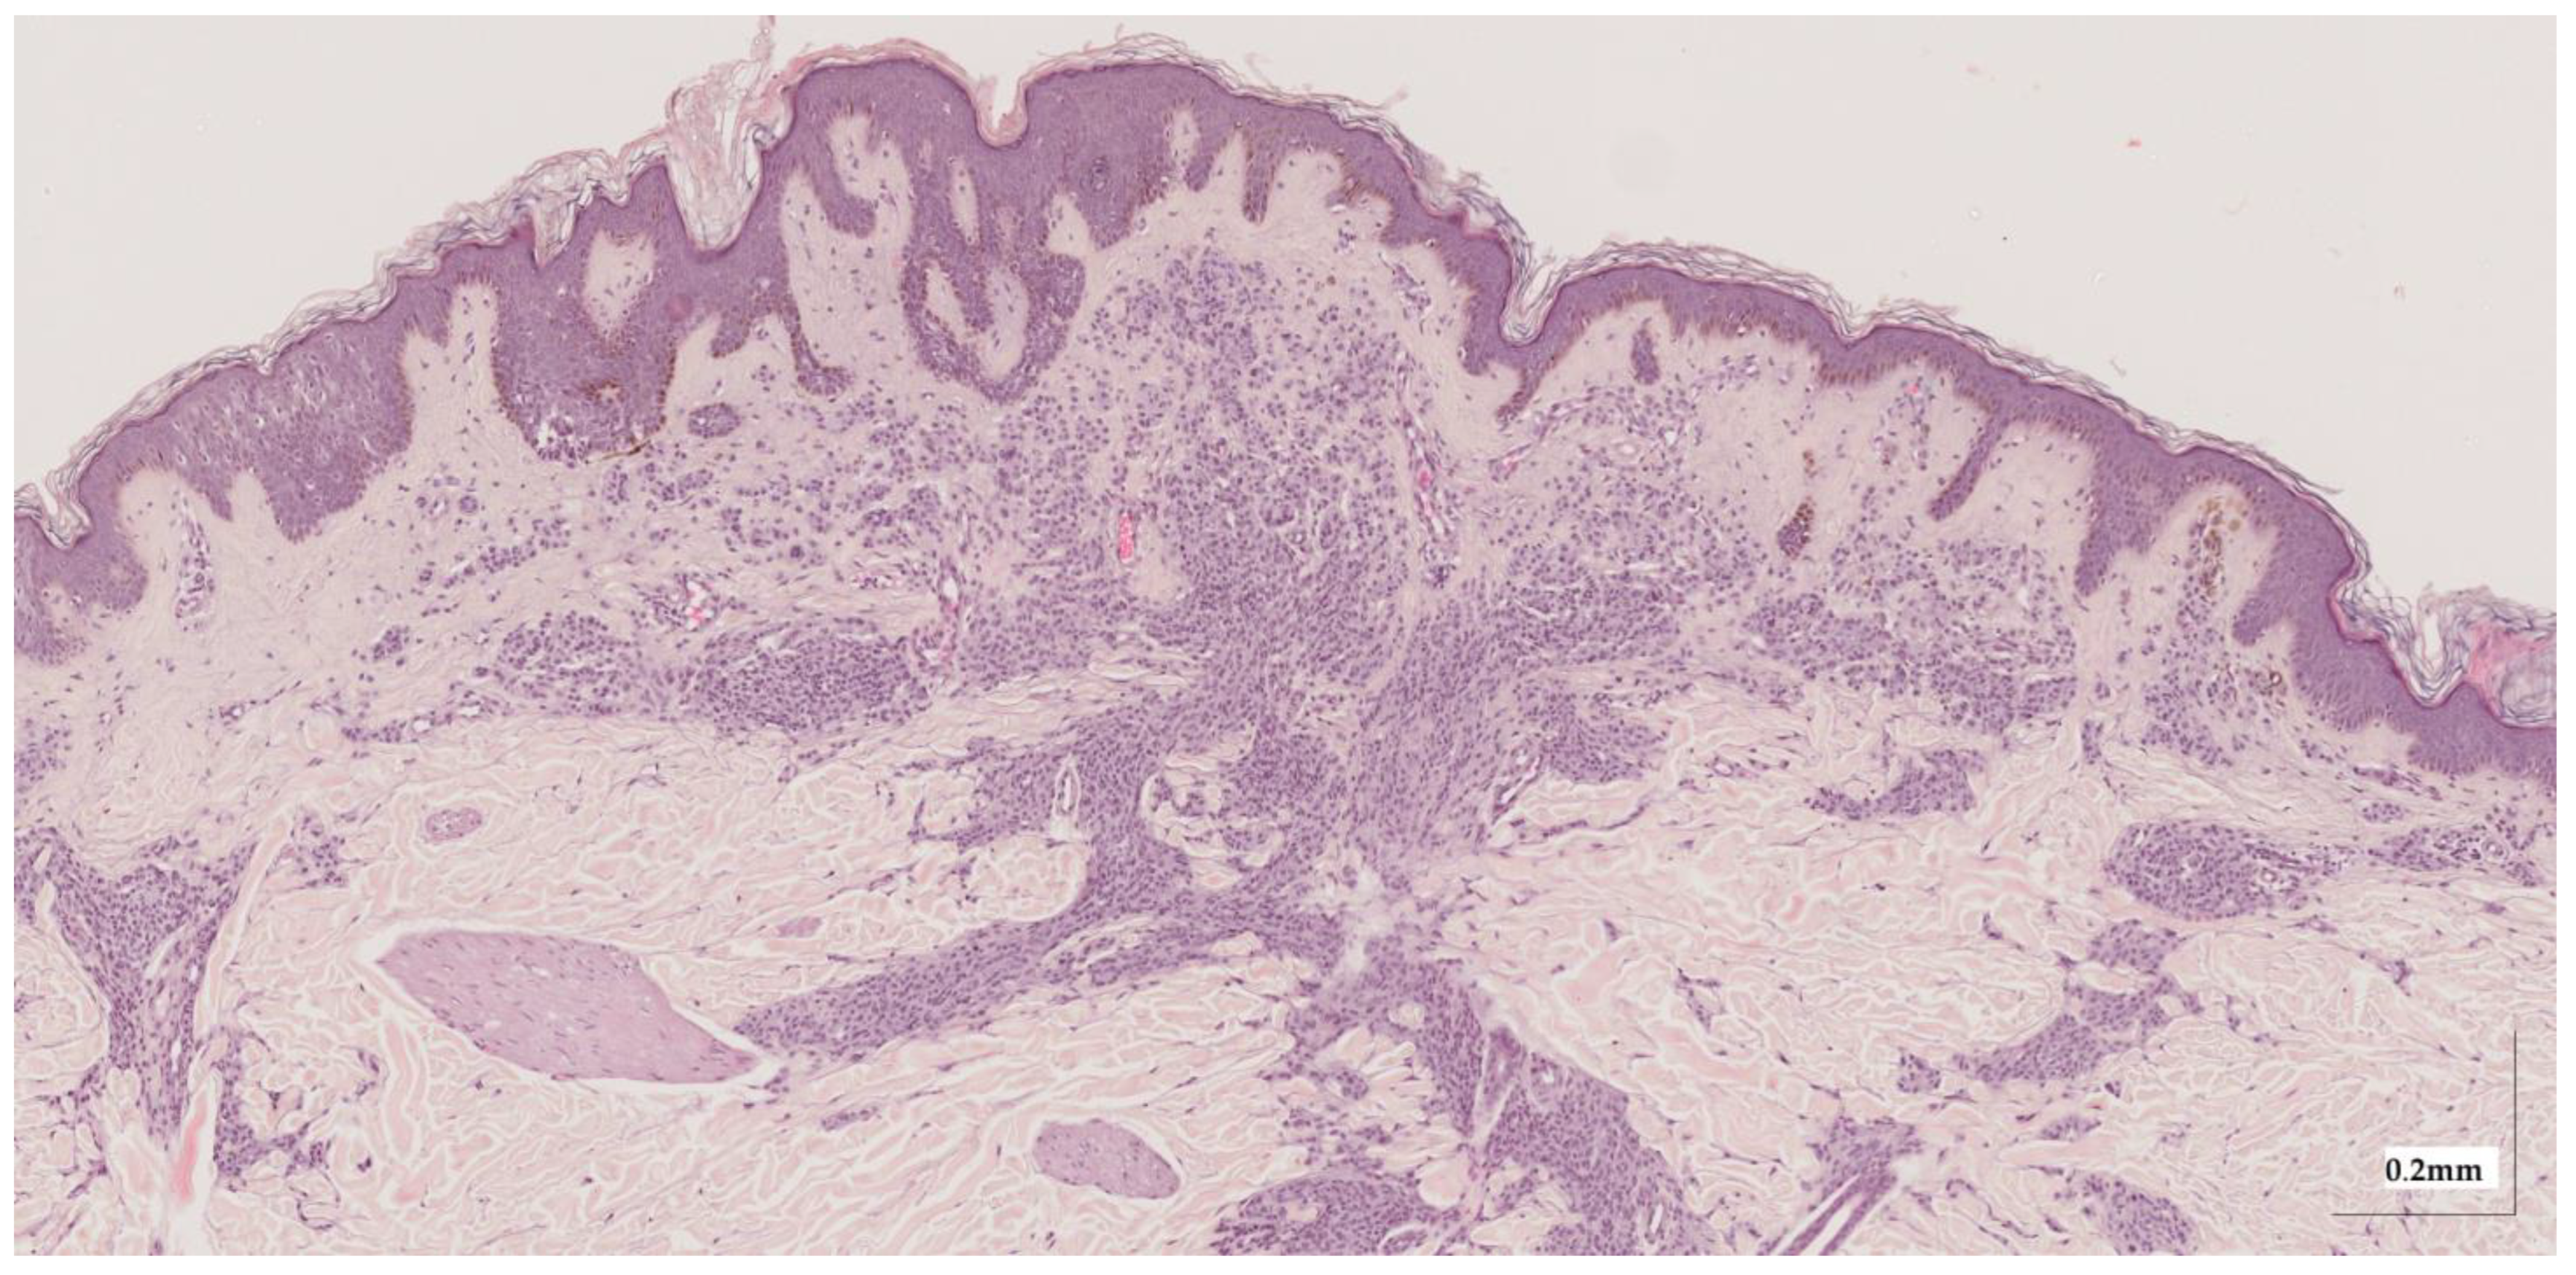
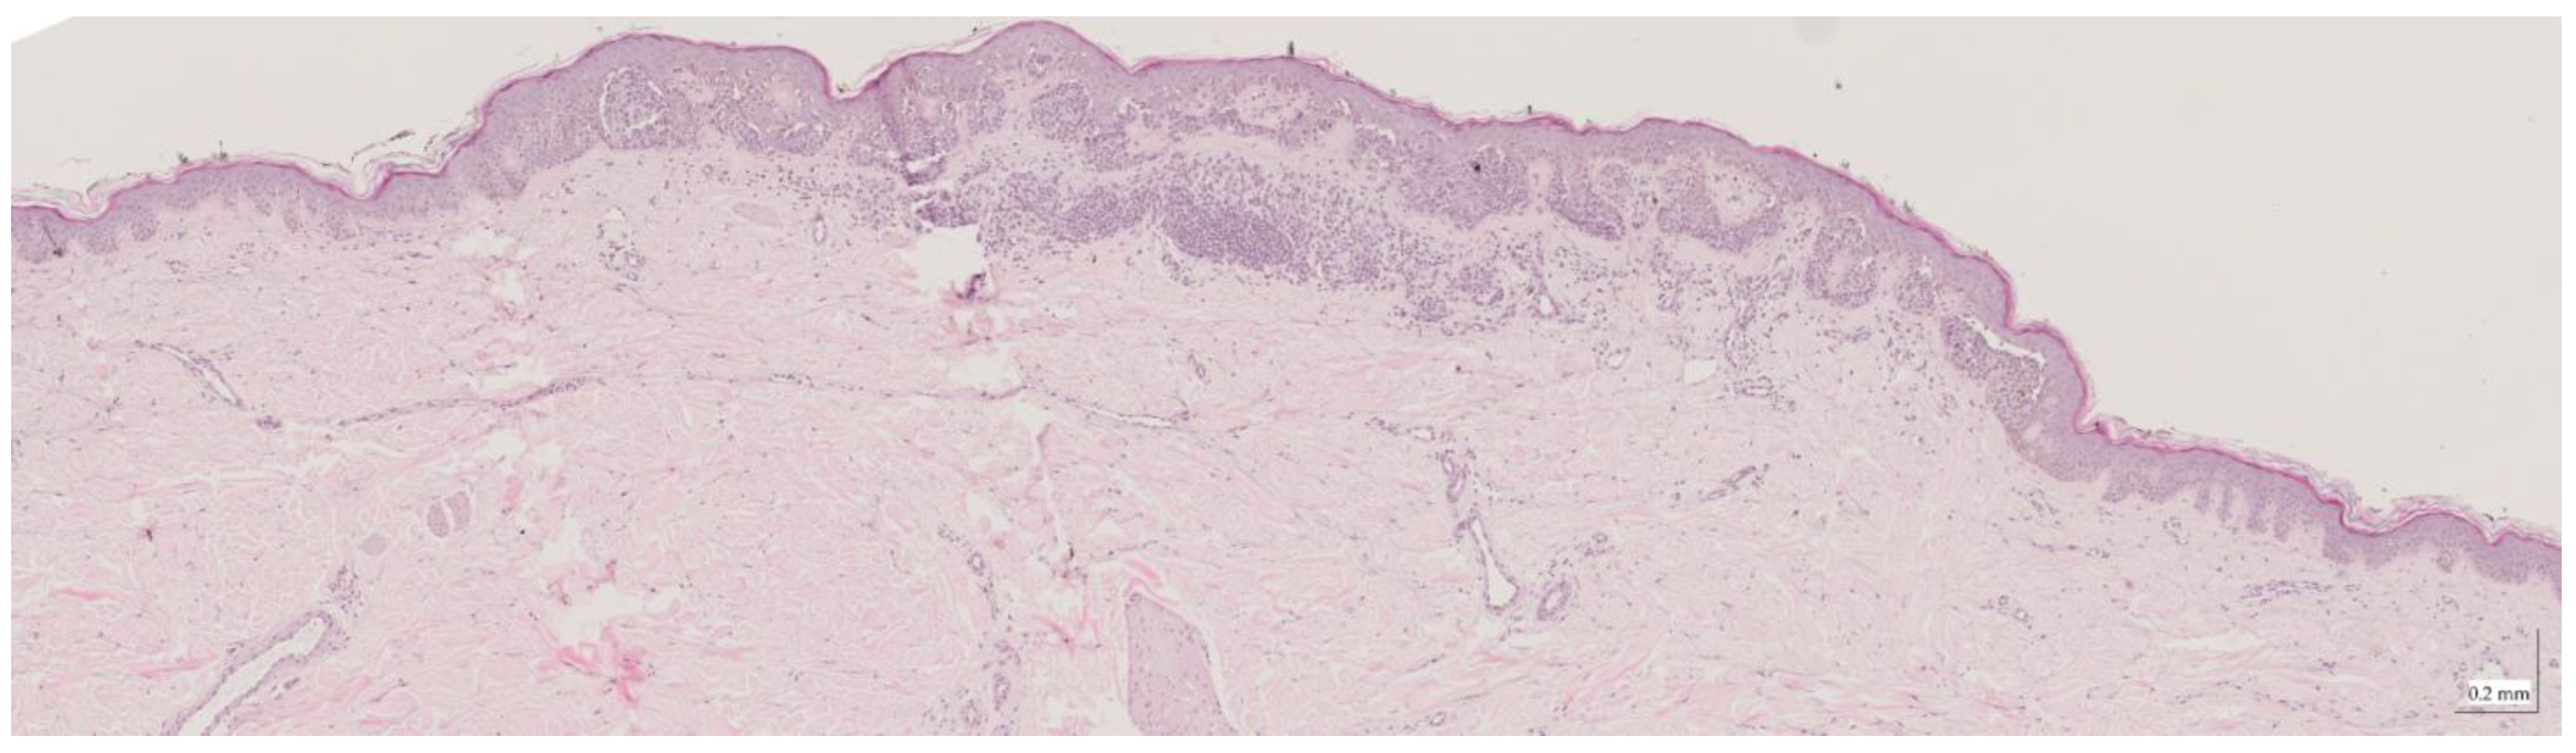
Appendix A. Selected Cases Studies’ HE Histopathological Images (Limited to OCT FOV)


| Pigmentation EPIDERMIS | Pigmentation DERMIS | Inflammatory Answer | Melanocytes’ Pattern EPIDERMIS | Atypia | Growing Pattern | Dermal Component | |
|---|---|---|---|---|---|---|---|
| CN1 | Moderate | None–Mild | N.A. | Isolated + 1 net | N.A. | N.A. | Severe |
| CN2 | Mild | None–Mild | N.A. | Nets + Lentiginous | N.A. | N.A. | Moderate |
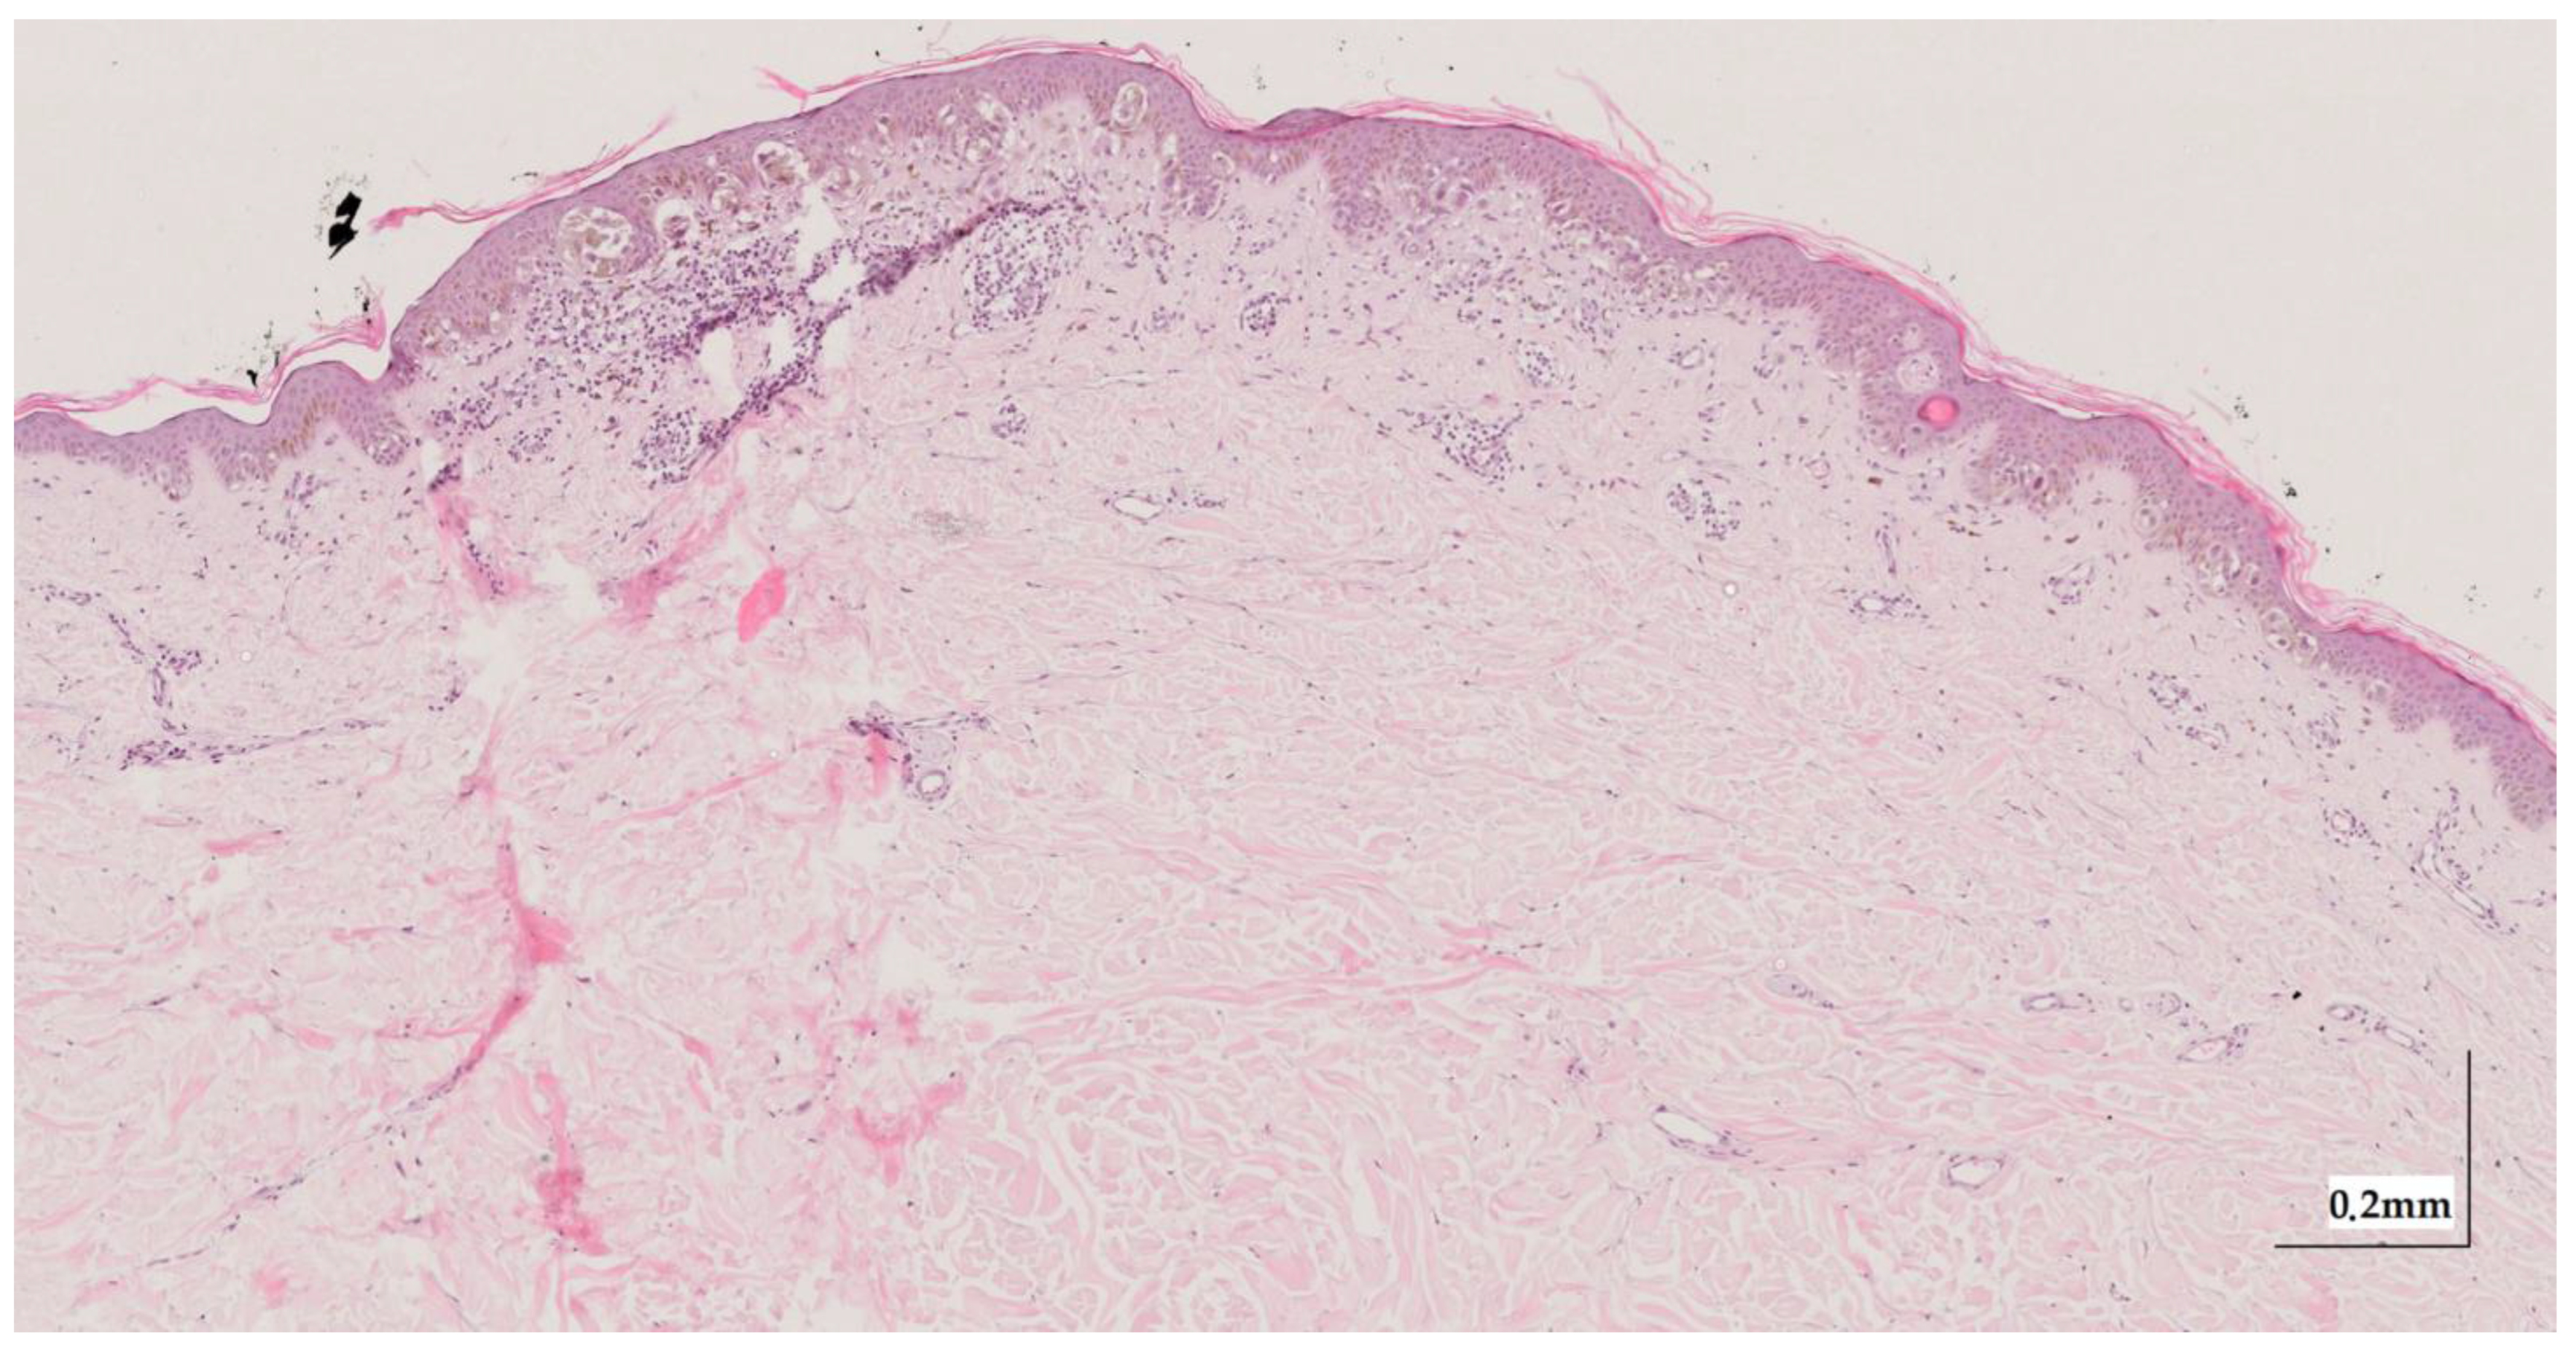
| IN1 | None | Severe | N.A. | N.A. | N.A. | N.A. | Moderate–Severe (centre-right) Mild (left) |
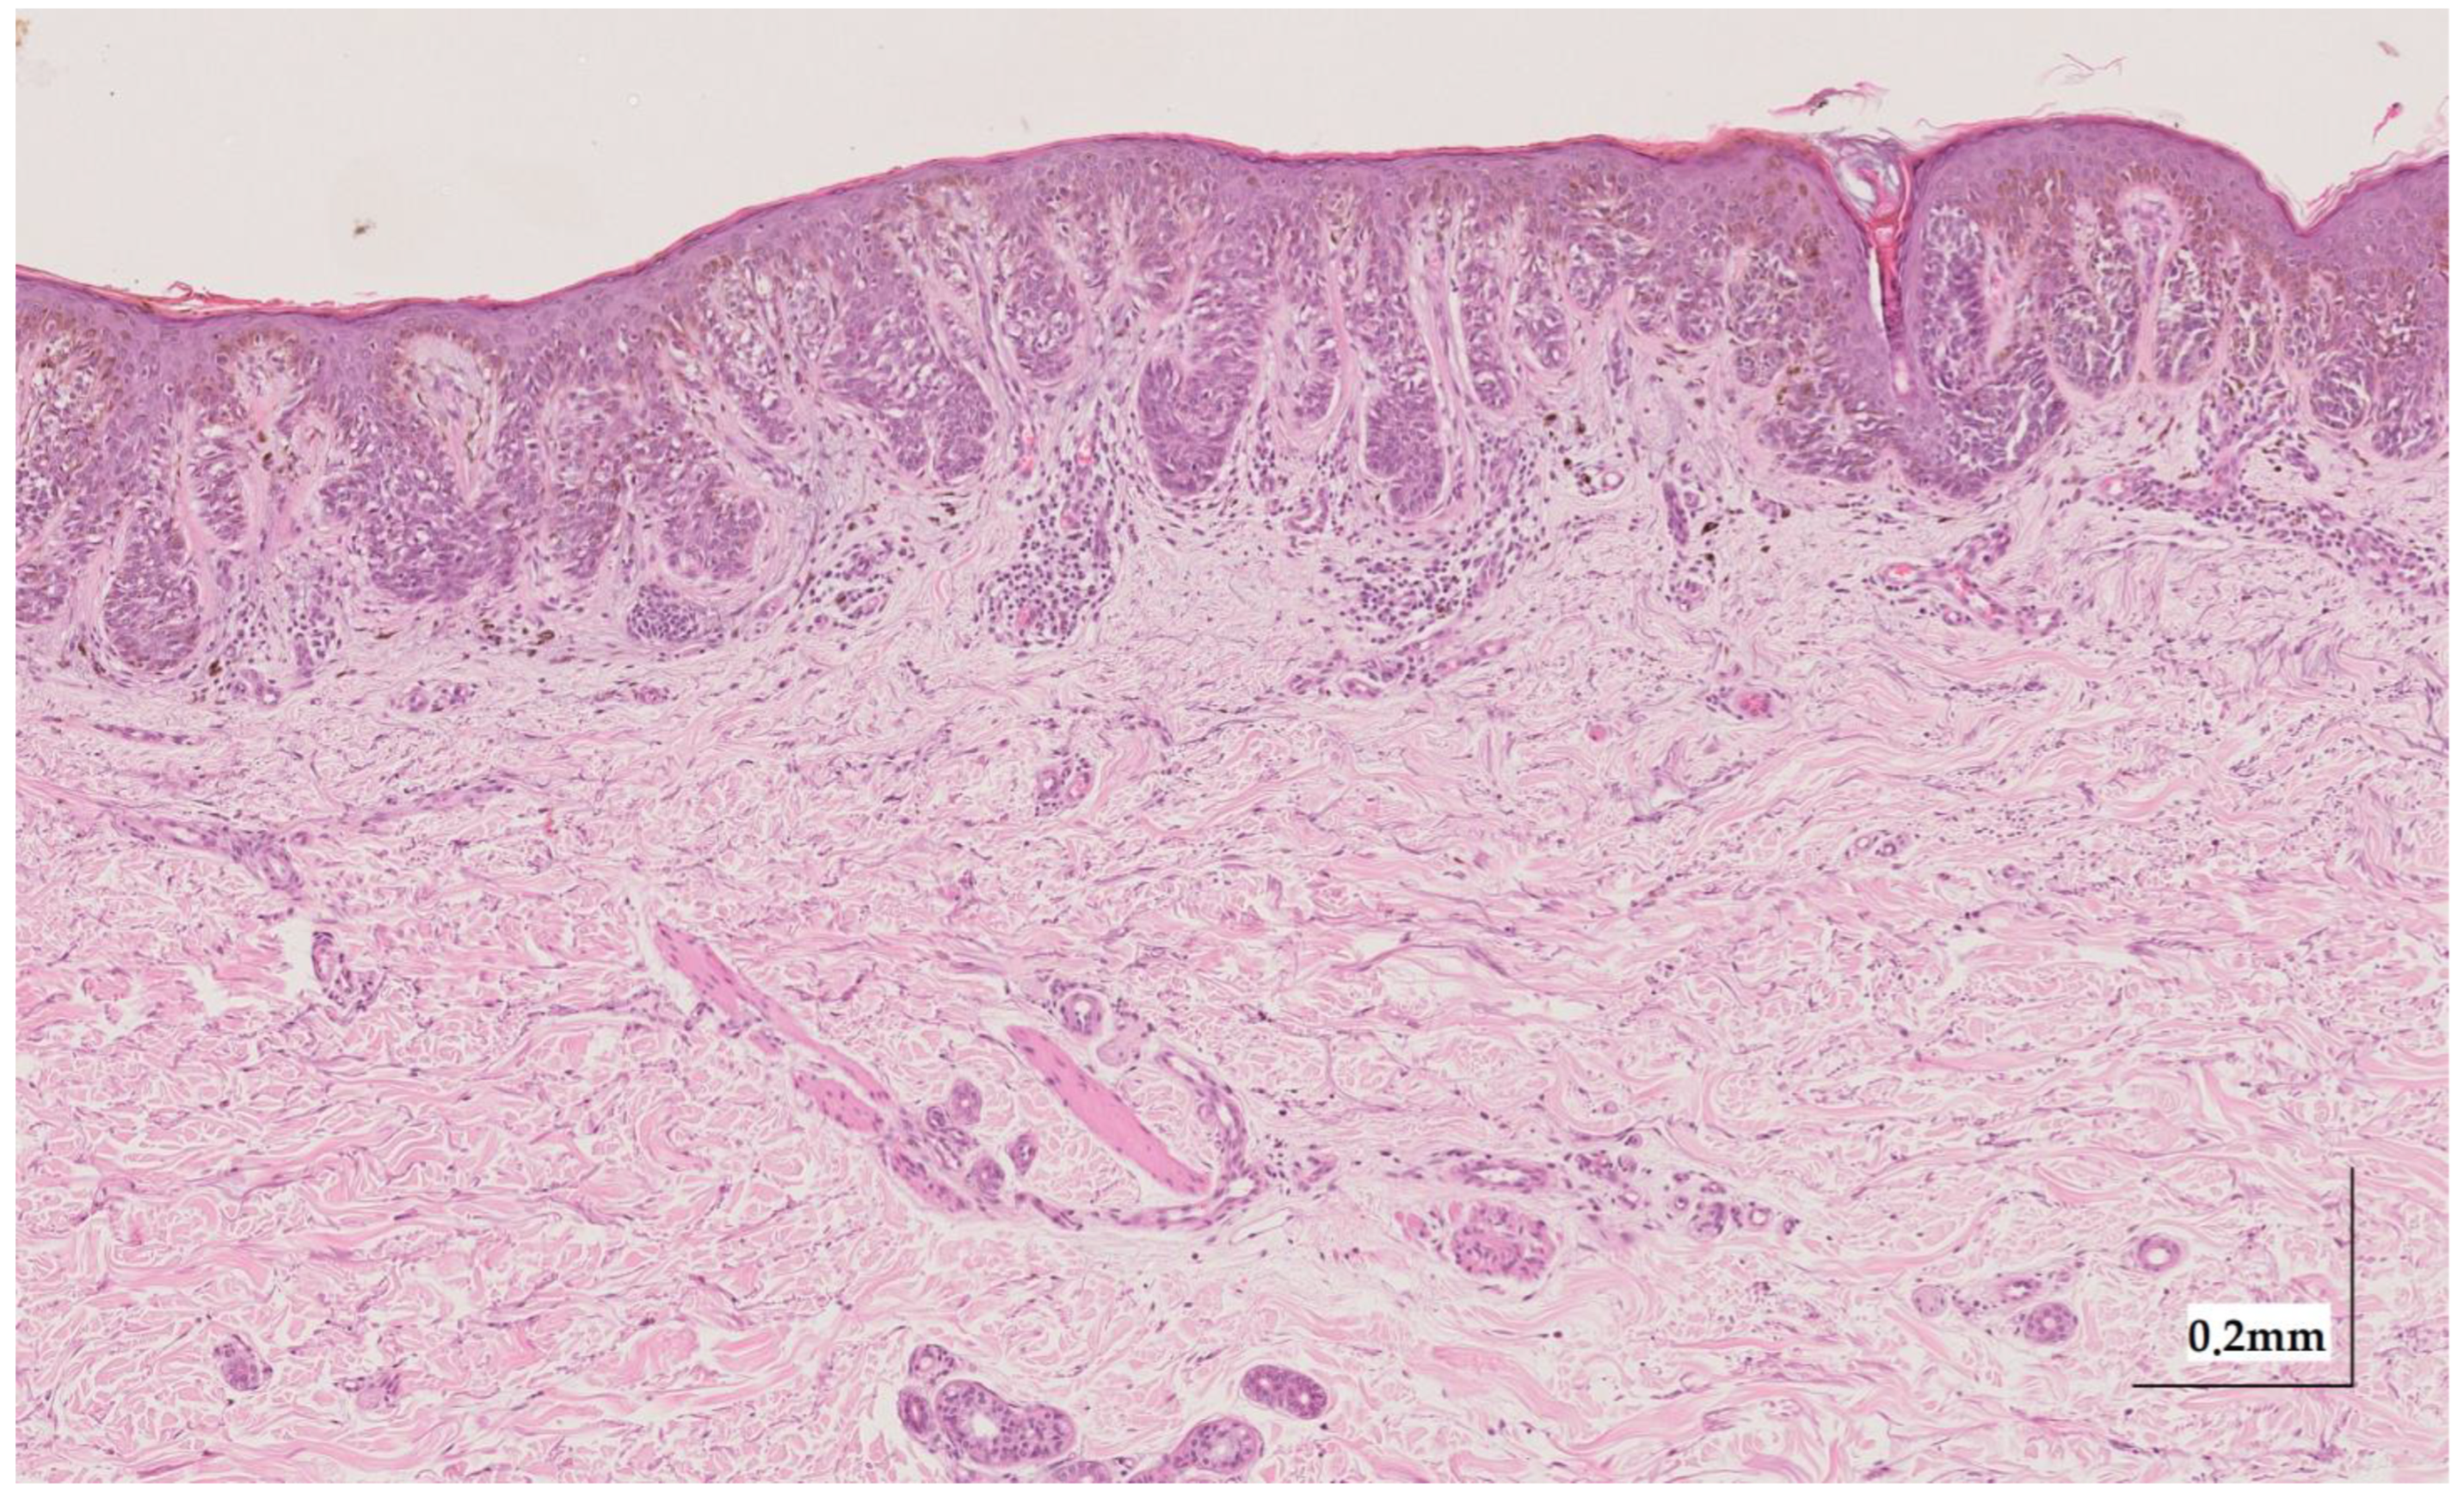
| IN2 | Moderate | Mild | N.A. | N.A. | N.A. | N.A. | Moderate–Severe |
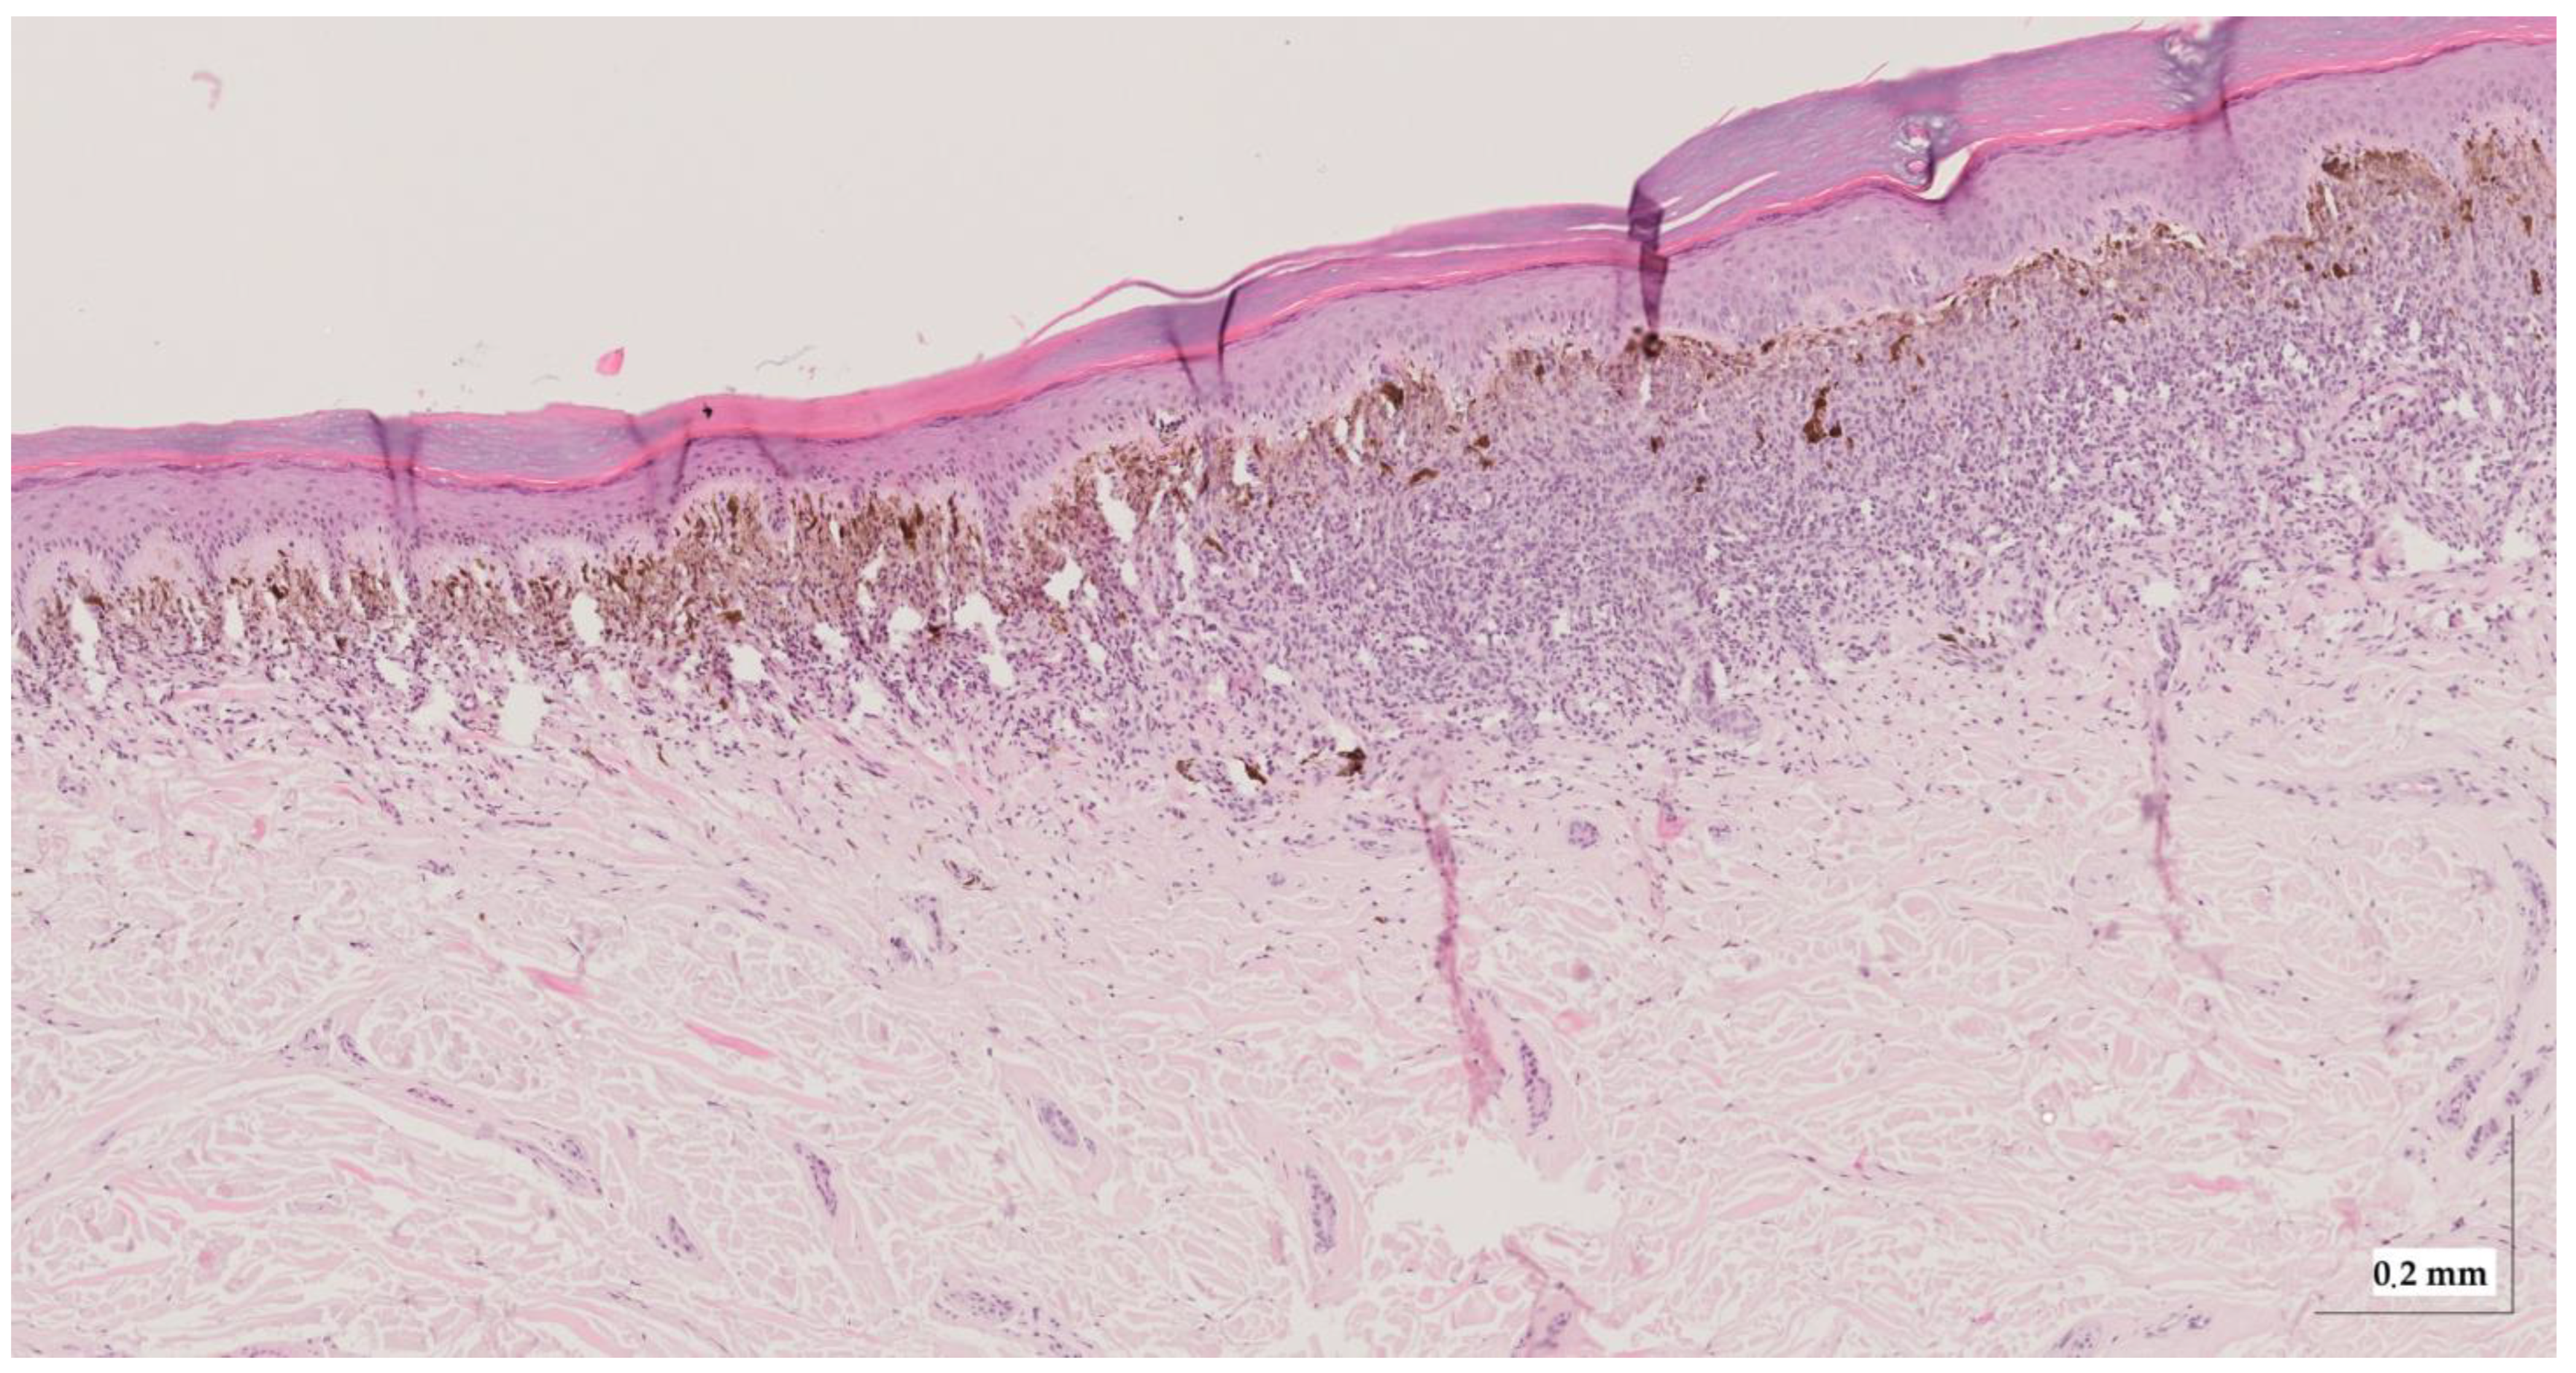
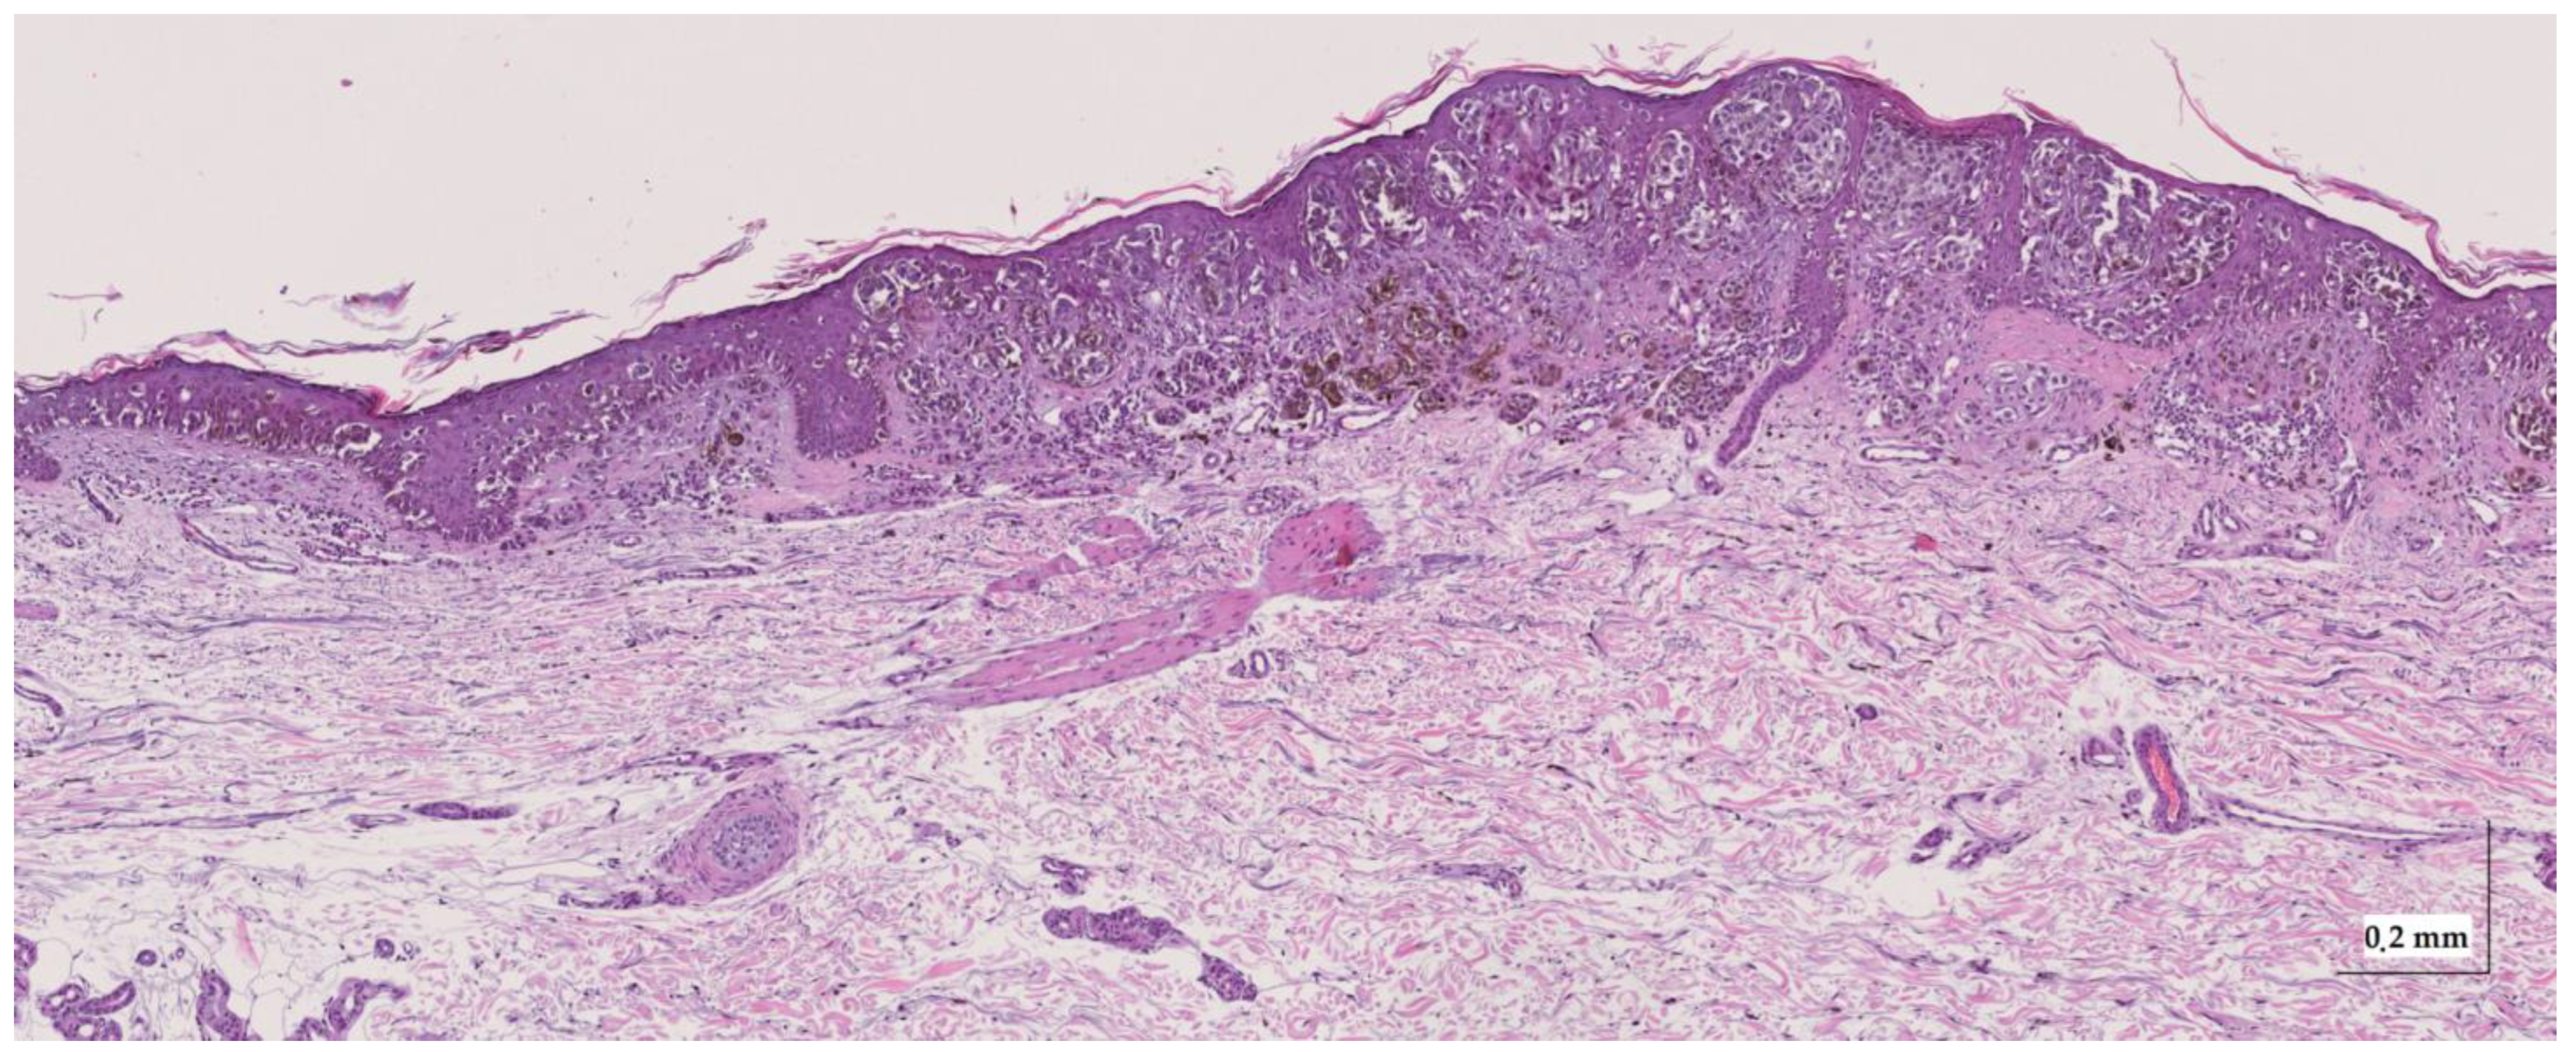
| MIS1 | Moderate | None | Mild (right) Moderate (left) | Nets | Moderate– Severe | N.A. | N.A. |
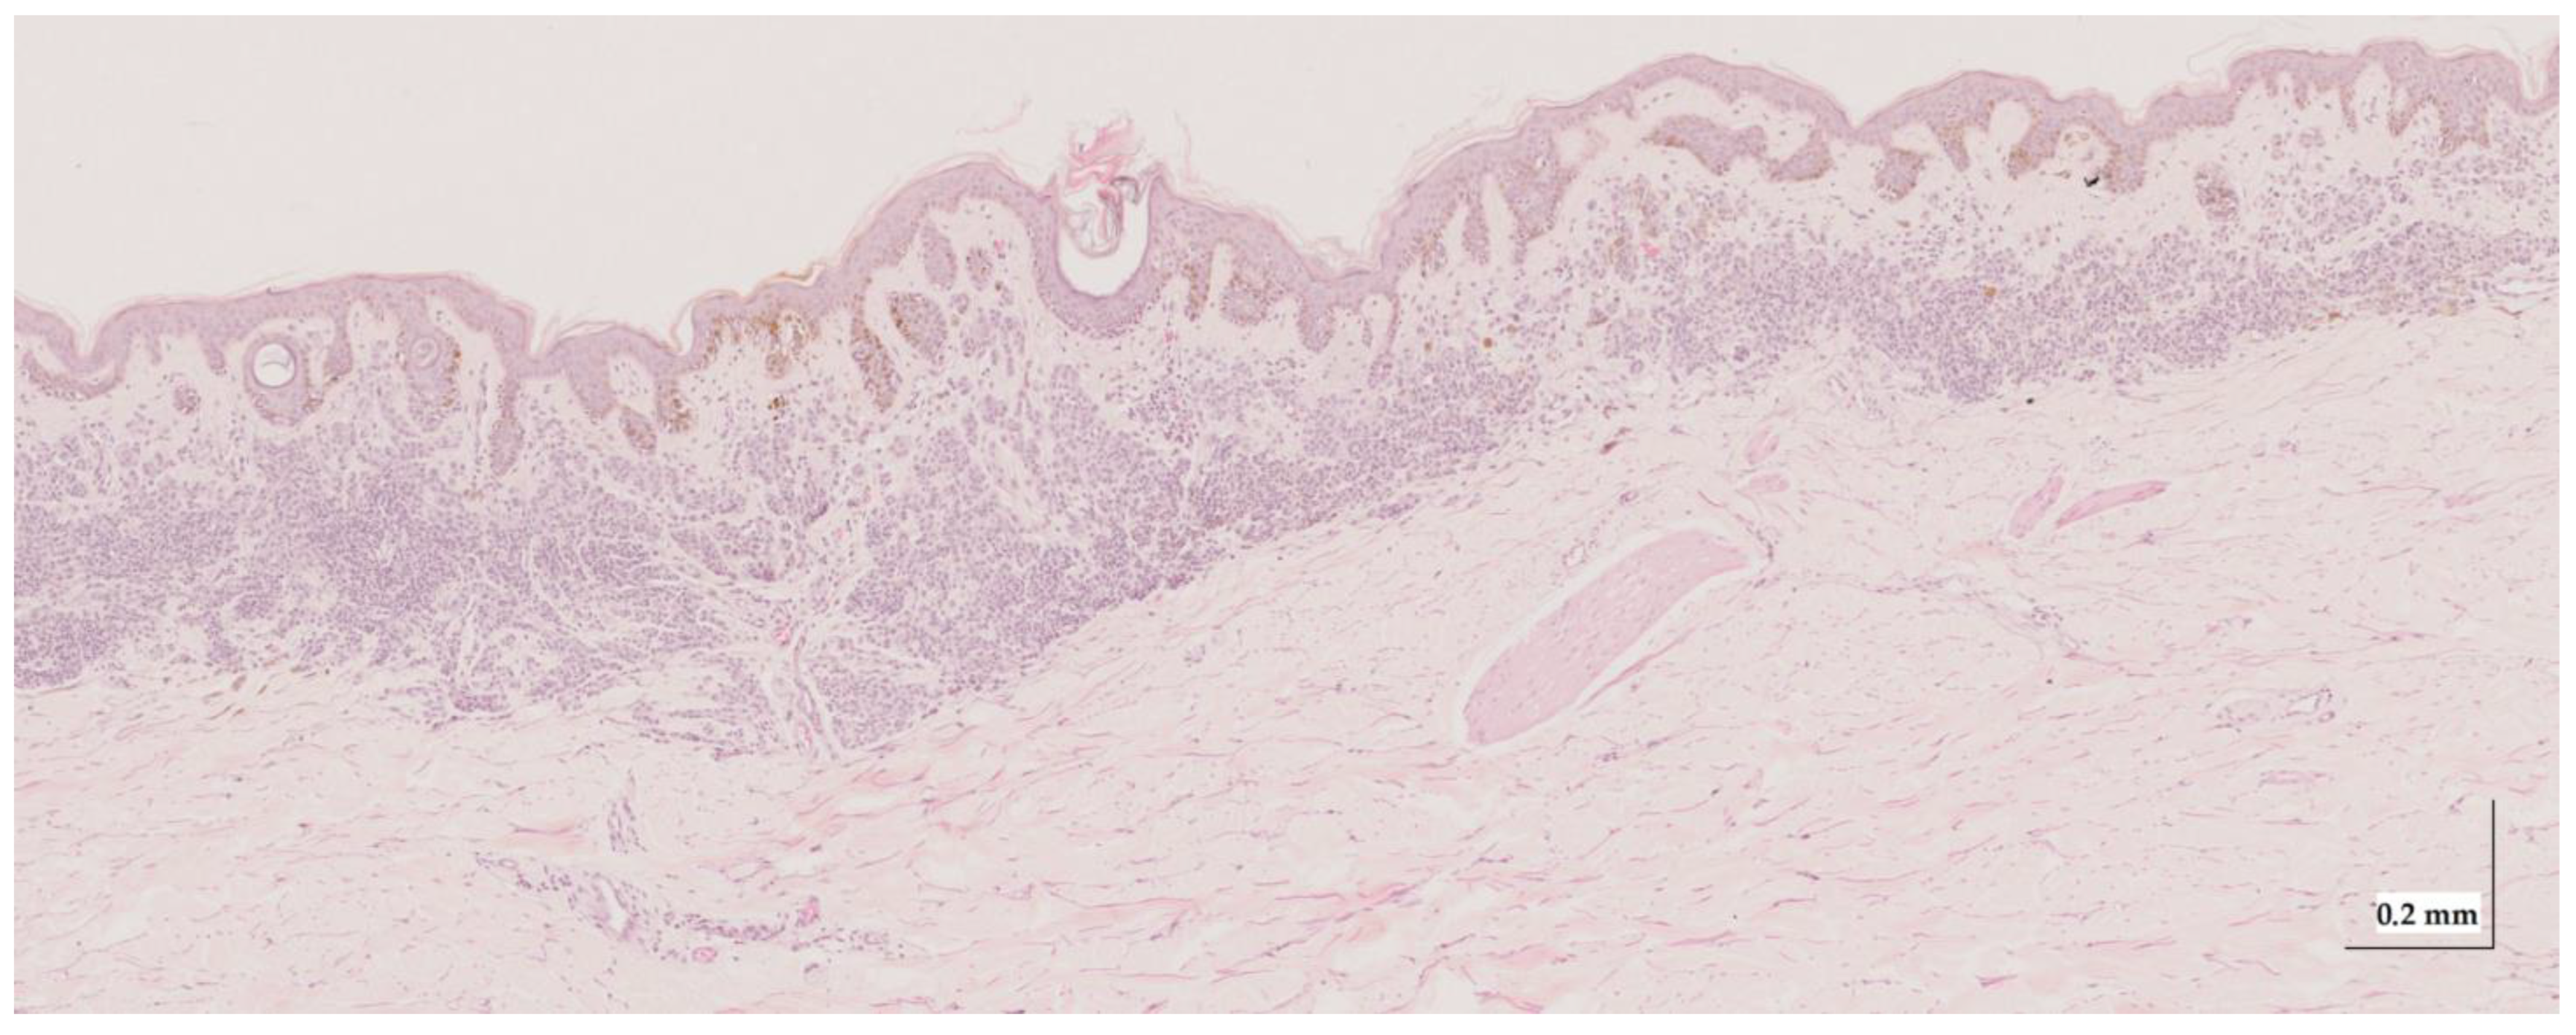
| MIS2 | Moderate | Moderate (and perivascular) | Mild | Nets + Lentiginous | Mild–Moderate | N.A. | N.A. |
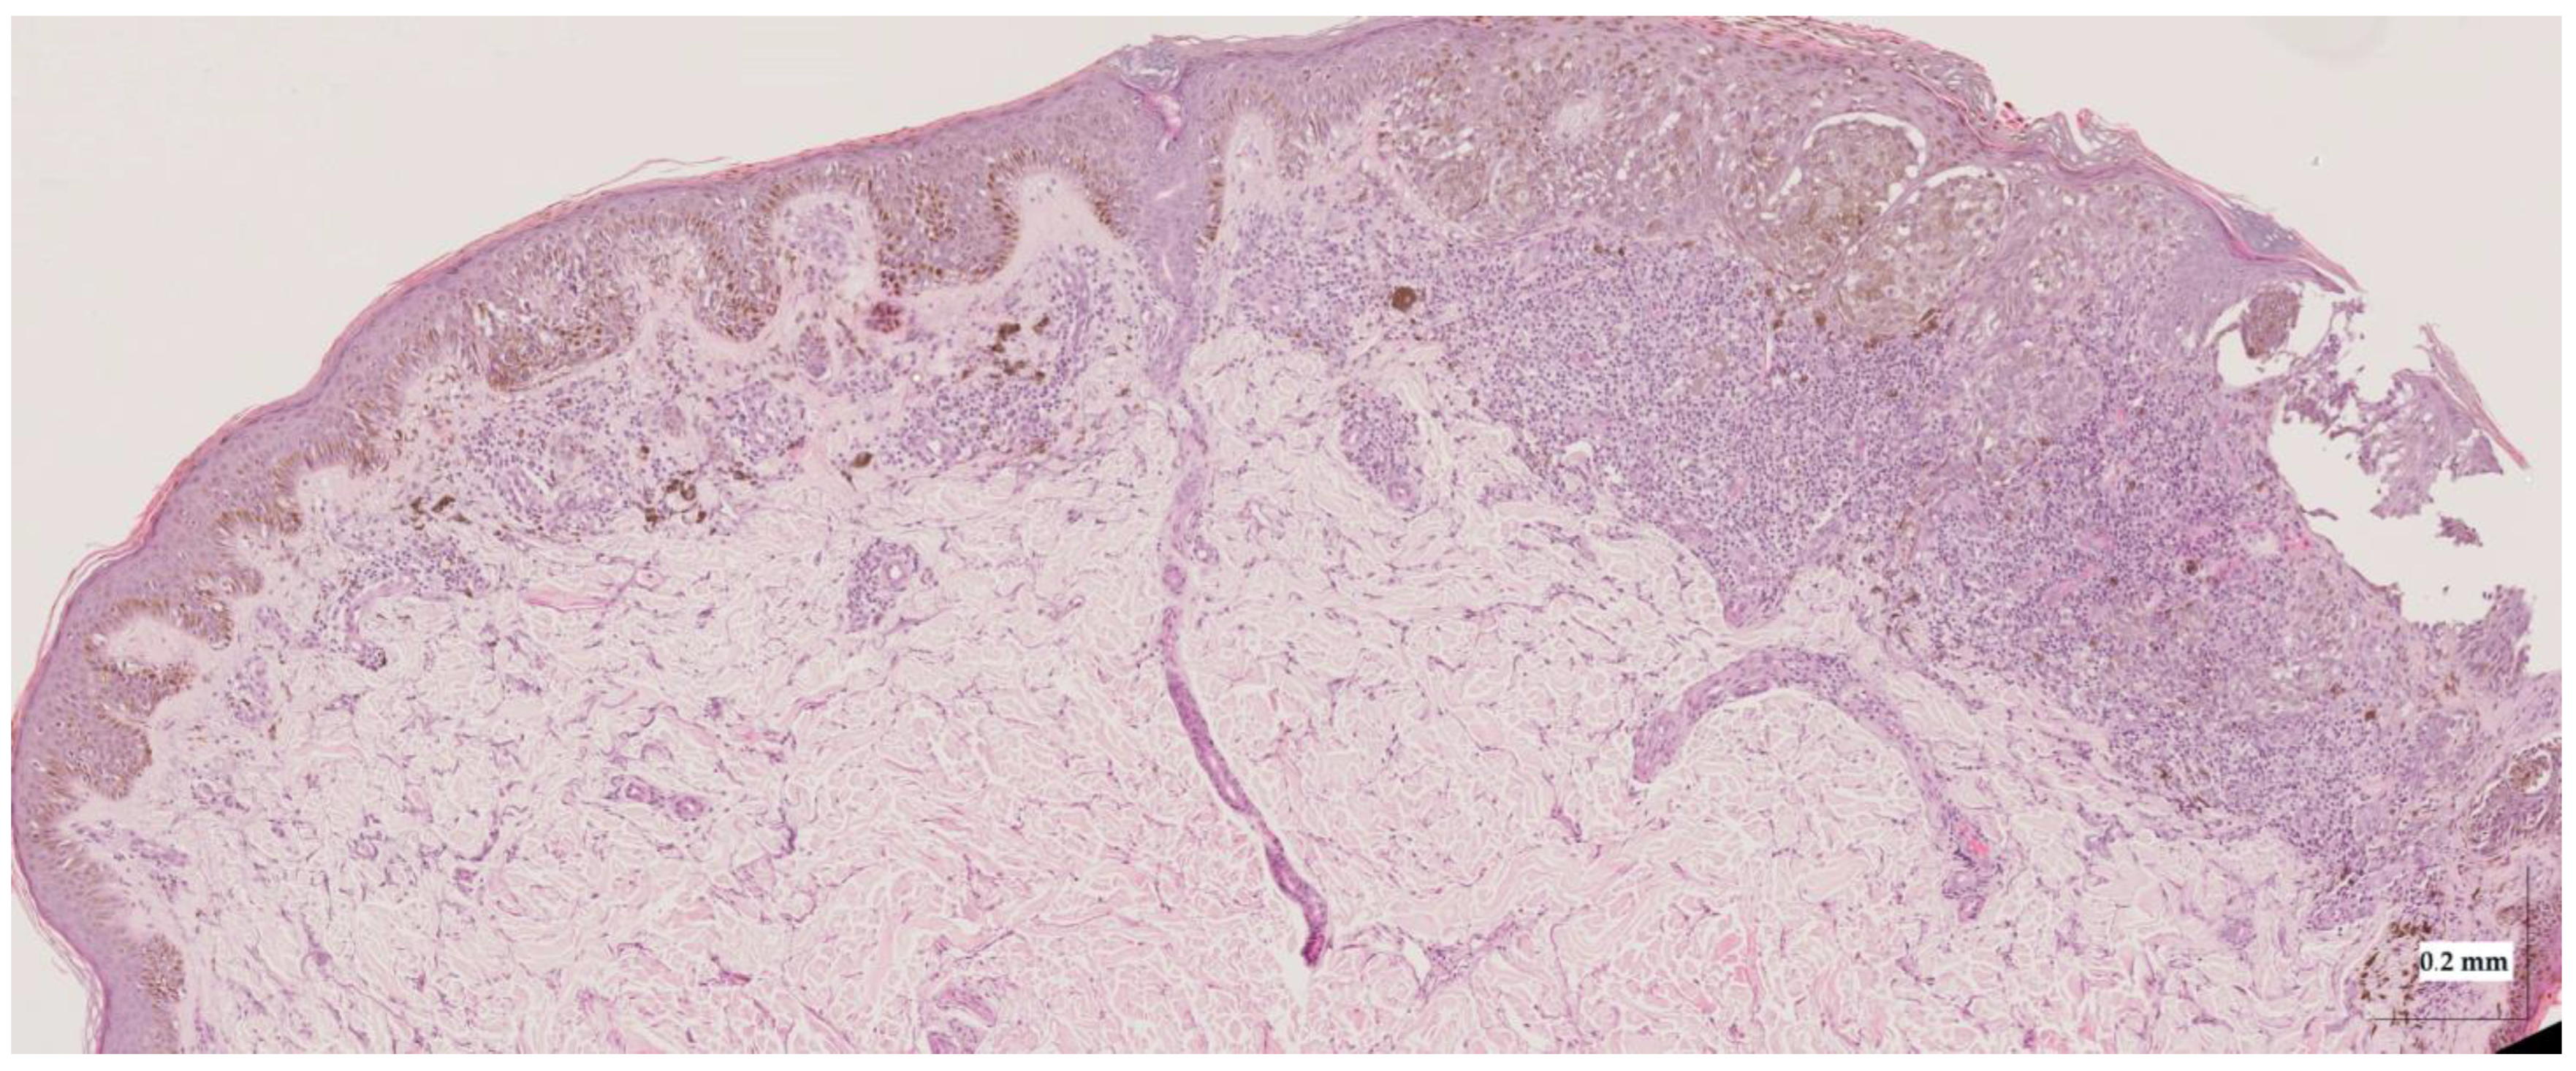
| SSM1 | Moderate | Moderate–High (centre) | Mild | Nets + Lentiginous | Moderate–Severe | Horizontal | N.A. |
| SSM2 | Severe (left) + Moderate (right) | Moderate | Severe (right) + Moderate (left) | Lentiginous (left) + Nets (centre, right) | Mild–Moderate (left), + Severe (right) | Horizontal | N.A. |
References
- Skin Cancer Statistics. World Cancer Research Fund International. Available online: https://www.wcrf.org/cancer-trends/skin-cancer-statistics/ (accessed on 2 August 2022).
- Arnold, M.; Singh, D.; Laversanne, M.; Vignat, J.; Vaccarella, S.; Meheus, F.; Cust, A.E.; De Vries, E.; Whiteman, D.C.; Bray, F. Global Burden of Cutaneous Melanoma in 2020 and Projections to 2040. JAMA Dermatol. 2022, 158, 495–503. [Google Scholar] [CrossRef] [PubMed]
- Pandeya, N.; Kvaskoff, M.; Olsen, C.M.; Green, A.C.; Perry, S.; Baxter, C.; Davis, M.B.; Mortimore, R.; Westacott, L.; Wood, D.; et al. Factors Related to Nevus-Associated Cutaneous Melanoma: A Case-Case Study. J. Investig. Dermatol. 2018, 138, 1816–1824. [Google Scholar] [CrossRef] [PubMed]
- Pampena, R.; Kyrgidis, A.; Lallas, A.; Moscarella, E.; Argenziano, G.; Longo, C. A meta-analysis of nevus-associated melanoma: Prevalence and practical implications. J. Am. Acad. Dermatol. 2017, 77, 938–945.e4. [Google Scholar] [CrossRef] [PubMed]
- Ferrante di Ruffano, L.; Dinnes, J.; Deeks, J.J.; Chuchu, N.; Bayliss, S.E.; Davenport, C.; Takwoingi, Y.; Godfrey, K.; O’sullivan, C.; Matin, R.N.; et al. Optical coherence tomography for diagnosing skin cancer in adults. Cochrane Database Syst. Rev. 2018, 2018, CD013189. [Google Scholar] [CrossRef] [PubMed]
- Xiong, Y.-Q.; Mo, Y.; Wen, Y.-Q.; Cheng, M.-J.; Huo, S.-T.; Chen, X.-J.; Chen, Q. Optical coherence tomography for the diagnosis of malignant skin tumors: A meta-analysis. J. Biomed. Opt. 2018, 23, 020902. [Google Scholar] [CrossRef]
- Psomadakis, C.E.; Marghoob, N.; Bleicher, B.; Markowitz, O. Optical coherence tomography. Clin. Dermatol. 2021, 39, 624–634. [Google Scholar] [CrossRef]
- Yang, L.; Chen, Y.; Ling, S.; Wang, J.; Wang, G.; Zhang, B.; Zhao, H.; Zhao, Q.; Mao, J. Research progress on the application of optical coherence tomography in the field of oncology. Front. Oncol. 2022, 12, 953934. [Google Scholar] [CrossRef]
- Dimitriou, F.; Schuh, S.; Ruini, C.; Katharina Elisabeth Perwein, M.; Daxenberger, F.; Gust, C.; Christina Sattler, E.; Welzel, J. Line-Field Confocal Optical Coherence Tomography: A New Tool for the Differentiation between Nevi and Melanomas? Cancers 2022, 14, 1140. [Google Scholar] [CrossRef]
- Schuh, S.; Holmes, J.; Ulrich, M.; Themstrup, L.; Jemec, G.B.E.; De Carvalho, N.; Pellacani, G.; Welzel, J. Imaging Blood Vessel Morphology in Skin: Dynamic Optical Coherence Tomography as a Novel Potential Diagnostic Tool in Dermatology. Dermatol. Ther. 2017, 7, 187–202. [Google Scholar] [CrossRef]
- De Carvalho, N.; Welzel, J.; Schuh, S.; Themstrup, L.; Ulrich, M.; Jemec, G.B.E.; Holmes, J.; Kaleci, S.; Chester, J.; Bigi, L.; et al. The vascular morphology of melanoma is related to Breslow index: An in vivo study with dynamic optical coherence tomography. Exp. Dermatol. 2018, 27, 1280–1286. [Google Scholar] [CrossRef]
- Gambichler, T.; Plura, I.; Schmid-Wendtner, M.; Valavanis, K.; Kulichova, D.; Stücker, M.; Pljakic, A.; Berking, C.; Maier, T. High-definition optical coherence tomography of melanocytic skin lesions. J. Biophotonics 2015, 8, 681–686. [Google Scholar] [CrossRef]
- Fedorov Kukk, A.; Wu, D.; Gaffal, E.; Panzer, R.; Emmert, S.; Roth, B. Bernhard Multimodal system for optical biopsy of melanoma with integrated ultrasound, optical coherence tomography and Raman spectroscopy. J. Biophotonics 2022, 15, e202200129. [Google Scholar] [CrossRef]
- Turani, Z.; Fatemizadeh, E.; Blumetti, T.; Daveluy, S.; Moraes, A.F.; Chen, W.; Mehregan, D.; Andersen, P.E.; Nasiriavanaki, M. Optical Radiomic Signatures Derived from Optical Coherence Tomography Images Improve Identification of Melanoma. Cancer Res. 2019, 79, 2021–2030. [Google Scholar] [CrossRef]
- Von Knorring, T.; Israelsen, N.M.; Ung, V.; Formann, J.L.; Jensen, M.; Hædersdal, M.; Bang, O.; Fredman, G.; Mogensen, M. Differentiation Between Benign and Malignant Pigmented Skin Tumours Using Bedside Diagnostic Imaging Technologies: A Pilot Study. Acta Derm. Venereol. 2022, 102, adv00634. [Google Scholar] [CrossRef]
- Navarrete-Dechent, C.; Liopyris, K.; Monnier, J.; Aleissa, S.; Boyce, L.M.; Longo, C.; Oliviero, M.; Rabinovitz, H.; Marghoob, A.A.; Halpern, A.C.; et al. Reflectance confocal microscopy terminology glossary for melanocytic skin lesions: A systematic review. J. Am. Acad. Dermatol. 2021, 84, 102–119. [Google Scholar] [CrossRef]
- Blumetti, T.C.M.P.; Cohen, M.P.; Gomes, E.E.; de Macedo, M.P.; de Souza Begnami, M.D.F.; Fregnani, J.H.T.G.; Duprat, J.P.; Pellacani, G.; Rezze, G.G. Optical coherence tomography (OCT) features of nevi and melanomas and their association with intraepidermal or dermal involvement: A pilot study. J. Am. Acad. Dermatol. 2015, 73, 315–317. [Google Scholar] [CrossRef]
- Boone, M.A.L.M.; Suppa, M.; Dhaenens, F.; Miyamoto, M.; Marneffe, A.; Jemec, G.B.E.; Del Marmol, V.; Nebosis, R. In vivo assessment of optical properties of melanocytic skin lesions and differentiation of melanoma from non-malignant lesions by high-definition optical coherence tomography. Arch. Dermatol. Res. 2016, 308, 7–20. [Google Scholar] [CrossRef]
- Avanaki, K.; Andersen, P.E. Optical Coherence Tomography for Melanoma Detection. In Optical Coherence Tomography for Melanoma Detection; CRC Press: Boca Raton, FL, USA, 2021; pp. 47–58. [Google Scholar] [CrossRef]
- Gao, W.; Lin, B.; Zakharov, V.P.; Myakinin, O.O. 2D Fourier Fractal Analysis of Optical Coherence Tomography Images of Basal Cell Carcinomas and Melanomas. In Cutaneous Melanoma; InTech Open: London, UK, 2019. [Google Scholar] [CrossRef]
- Sancho-Durá, J.; Zinoviev, K.; Lloret-Soler, J.; Rubio-Guviernau, J.L.; Margallo-Balbás, E.; Drexler, W. Handheld multi-modal imaging for point-of-care skin diagnosis based on akinetic integrated optics optical coherence tomography. J. Biophotonics 2018, 11, e201800193. [Google Scholar] [CrossRef]
- Amin, M.B.; Greene, F.L.; Edge, S.B.; Compton, C.C.; Gershenwald, J.E.; Brookland, R.K.; Meyer, L.; Gress, D.M.; Byrd, D.R.; Winchester, D.P. The Eighth Edition AJCC Cancer Staging Manual: Continuing to build a bridge from a population-based to a more “personalized” approach to cancer staging. CA. Cancer J. Clin. 2017, 67, 93–99. [Google Scholar] [CrossRef]
- Adabi, S.; Fotouhi, A.; Xu, Q.; Daveluy, S.; Mehregan, D.; Podoleanu, A.; Nasiriavanaki, M. An overview of methods to mitigate artifacts in optical coherence tomography imaging of the skin. Skin Res. Technol. 2018, 24, 265–273. [Google Scholar] [CrossRef]
- Saratxaga, C.L.; Lage, S.; Morales, C.; Boyano, M.; Asumendi, A.; Garrote, E.; Conde, M. Automatic Pigmented Lesion Segmentation through a Dermoscopy-Guided OCT Approach for Early Diagnosis. In Photonics in Dermatology and Plastic Surgery; SPIE WEST: San Francisco, CA, USA, 2019. [Google Scholar]
- Otsu, N. A Threshold Selection Method from Gray-Level Histograms. IEEE Trans. Syst. Man. Cybern. 1979, 9, 62–66. [Google Scholar] [CrossRef]
- Jacques, S.L. Optical properties of biological tissues: A review. Phys. Med. Biol. 2013, 58, R37–R61. [Google Scholar] [CrossRef] [PubMed]
- Levitz, D. Determining Tissue Optical Properties with Optical Coherence Tomographu. Ph.D. Thesis, Lund University, Lund, Sweden, 2004. [Google Scholar]
- Oshina, I.; Spigulis, J. Beer–Lambert law for optical tissue diagnostics: Current state of the art and the main limitations. J. Biomed. Opt. 2021, 26, 100901. [Google Scholar] [CrossRef] [PubMed]
- Jacques, S.L.; Samatham, R.; Choudhury, N.; Fu, Y.; Levitz, D. Measuring tissue optical properties in vivo using reflectance-mode confocal microscopy and OCT. In Biomedical Applications of Light Scattering II; Wax, A., Backman, V., Eds.; SPIE: San Francisco, CA, USA, 2008; p. 68640B. [Google Scholar]
- Lister, T.; Wright, P.A.; Chappell, P.H. Optical properties of human skin. J. Biomed. Opt. 2012, 17, 0909011. [Google Scholar] [CrossRef] [PubMed]
- Bouma, B.E.; Tearney, G.J.; Southern, J.F.; Fujimoto, J.G.; Brezinski, M.E.; Hee, M.R. Determination of the refractive index of highly scattering human tissue by optical coherence tomography. Opt. Lett. 1995, 20, 2258–2260. [Google Scholar] [CrossRef]
- Real, E.; Paredes, G.P.; López Higuera, J.M.; Conde, O.M. Depth-resolved attenuation coefficient estimation for skin cancer assessment with optical coherence tomography. In Proceedings of the European Conference on Biomedical Optics 2019, Munich, Germany, 23–25 June 2019; Volume 11078, pp. 80–82. [Google Scholar] [CrossRef]
- Conners, R.W.; Harlow, C.A. A theoretical comparison of texture algorithms. IEEE Trans. Pattern Anal. Mach. Intell. 1980, PAMI-2, 204–222. [Google Scholar] [CrossRef]
- Fuchs, C.S.K.; Ortner, V.K.; Mogensen, M.; Rossi, A.M.; Pellacani, G.; Welzel, J.; Mosterd, K.; Guitera, P.; Nayahangan, L.J.; Johnsson, V.L.; et al. 2021 international consensus statement on optical coherence tomography for basal cell carcinoma: Image characteristics, terminology and educational needs. J. Eur. Acad. Dermatol. Venereol. 2022, 36, 772–778. [Google Scholar] [CrossRef]
- Rajabi-Estarabadi, A.; Bittar, J.M.; Zheng, C.; Nascimento, V.; Camacho, I.; Feun, L.G.; Nasiriavanaki, M.; Kunz, M.; Nouri, K. Optical coherence tomography imaging of melanoma skin cancer. Lasers Med. Sci. 2019, 34, 411–420. [Google Scholar] [CrossRef]
- Marconi, A.; Quadri, M.; Farnetani, F.; Ciardo, S.; Palazzo, E.; Lotti, R.; Cesinaro, A.M.; Fabbiani, L.; Vaschieri, C.; Puviani, M.; et al. In Vivo Melanoma Cell Morphology Reflects Molecular Signature and Tumor Aggressiveness. J. Investig. Dermatol. 2022, 142, 2205–2216.e6. [Google Scholar] [CrossRef]
- Lintzeri, D.A.; Karimian, N.; Blume-Peytavi, U.; Kottner, J.; Universität zu Berlin, H.; Kottner, J. Epidermal thickness in healthy humans: A systematic review and meta-analysis. J. Eur. Acad. Dermatol. Venereol. 2022, 36, 1191–1200. [Google Scholar] [CrossRef]
- Maiti, R.; Duan, M.; Danby, S.G.; Lewis, R.; Matcher, S.J.; Carré, M.J. Morphological parametric mapping of 21 skin sites throughout the body using optical coherence tomography. J. Mech. Behav. Biomed. Mater. 2020, 102, 103501. [Google Scholar] [CrossRef]
- Mamalis, A.; Ho, D.; Jagdeo, J. Optical Coherence Tomography Imaging of Normal, Chronologically Aged, Photoaged and Photodamaged Skin: A Systematic Review. Dermatol. Surg. 2015, 41, 993. [Google Scholar] [CrossRef]
- Esteva, A.; Chou, K.; Yeung, S.; Naik, N.; Madani, A.; Mottaghi, A.; Liu, Y.; Topol, E.; Dean, J.; Socher, R. Deep learning-enabled medical computer vision. NPJ Digit. Med. 2021, 4, 5. [Google Scholar] [CrossRef]


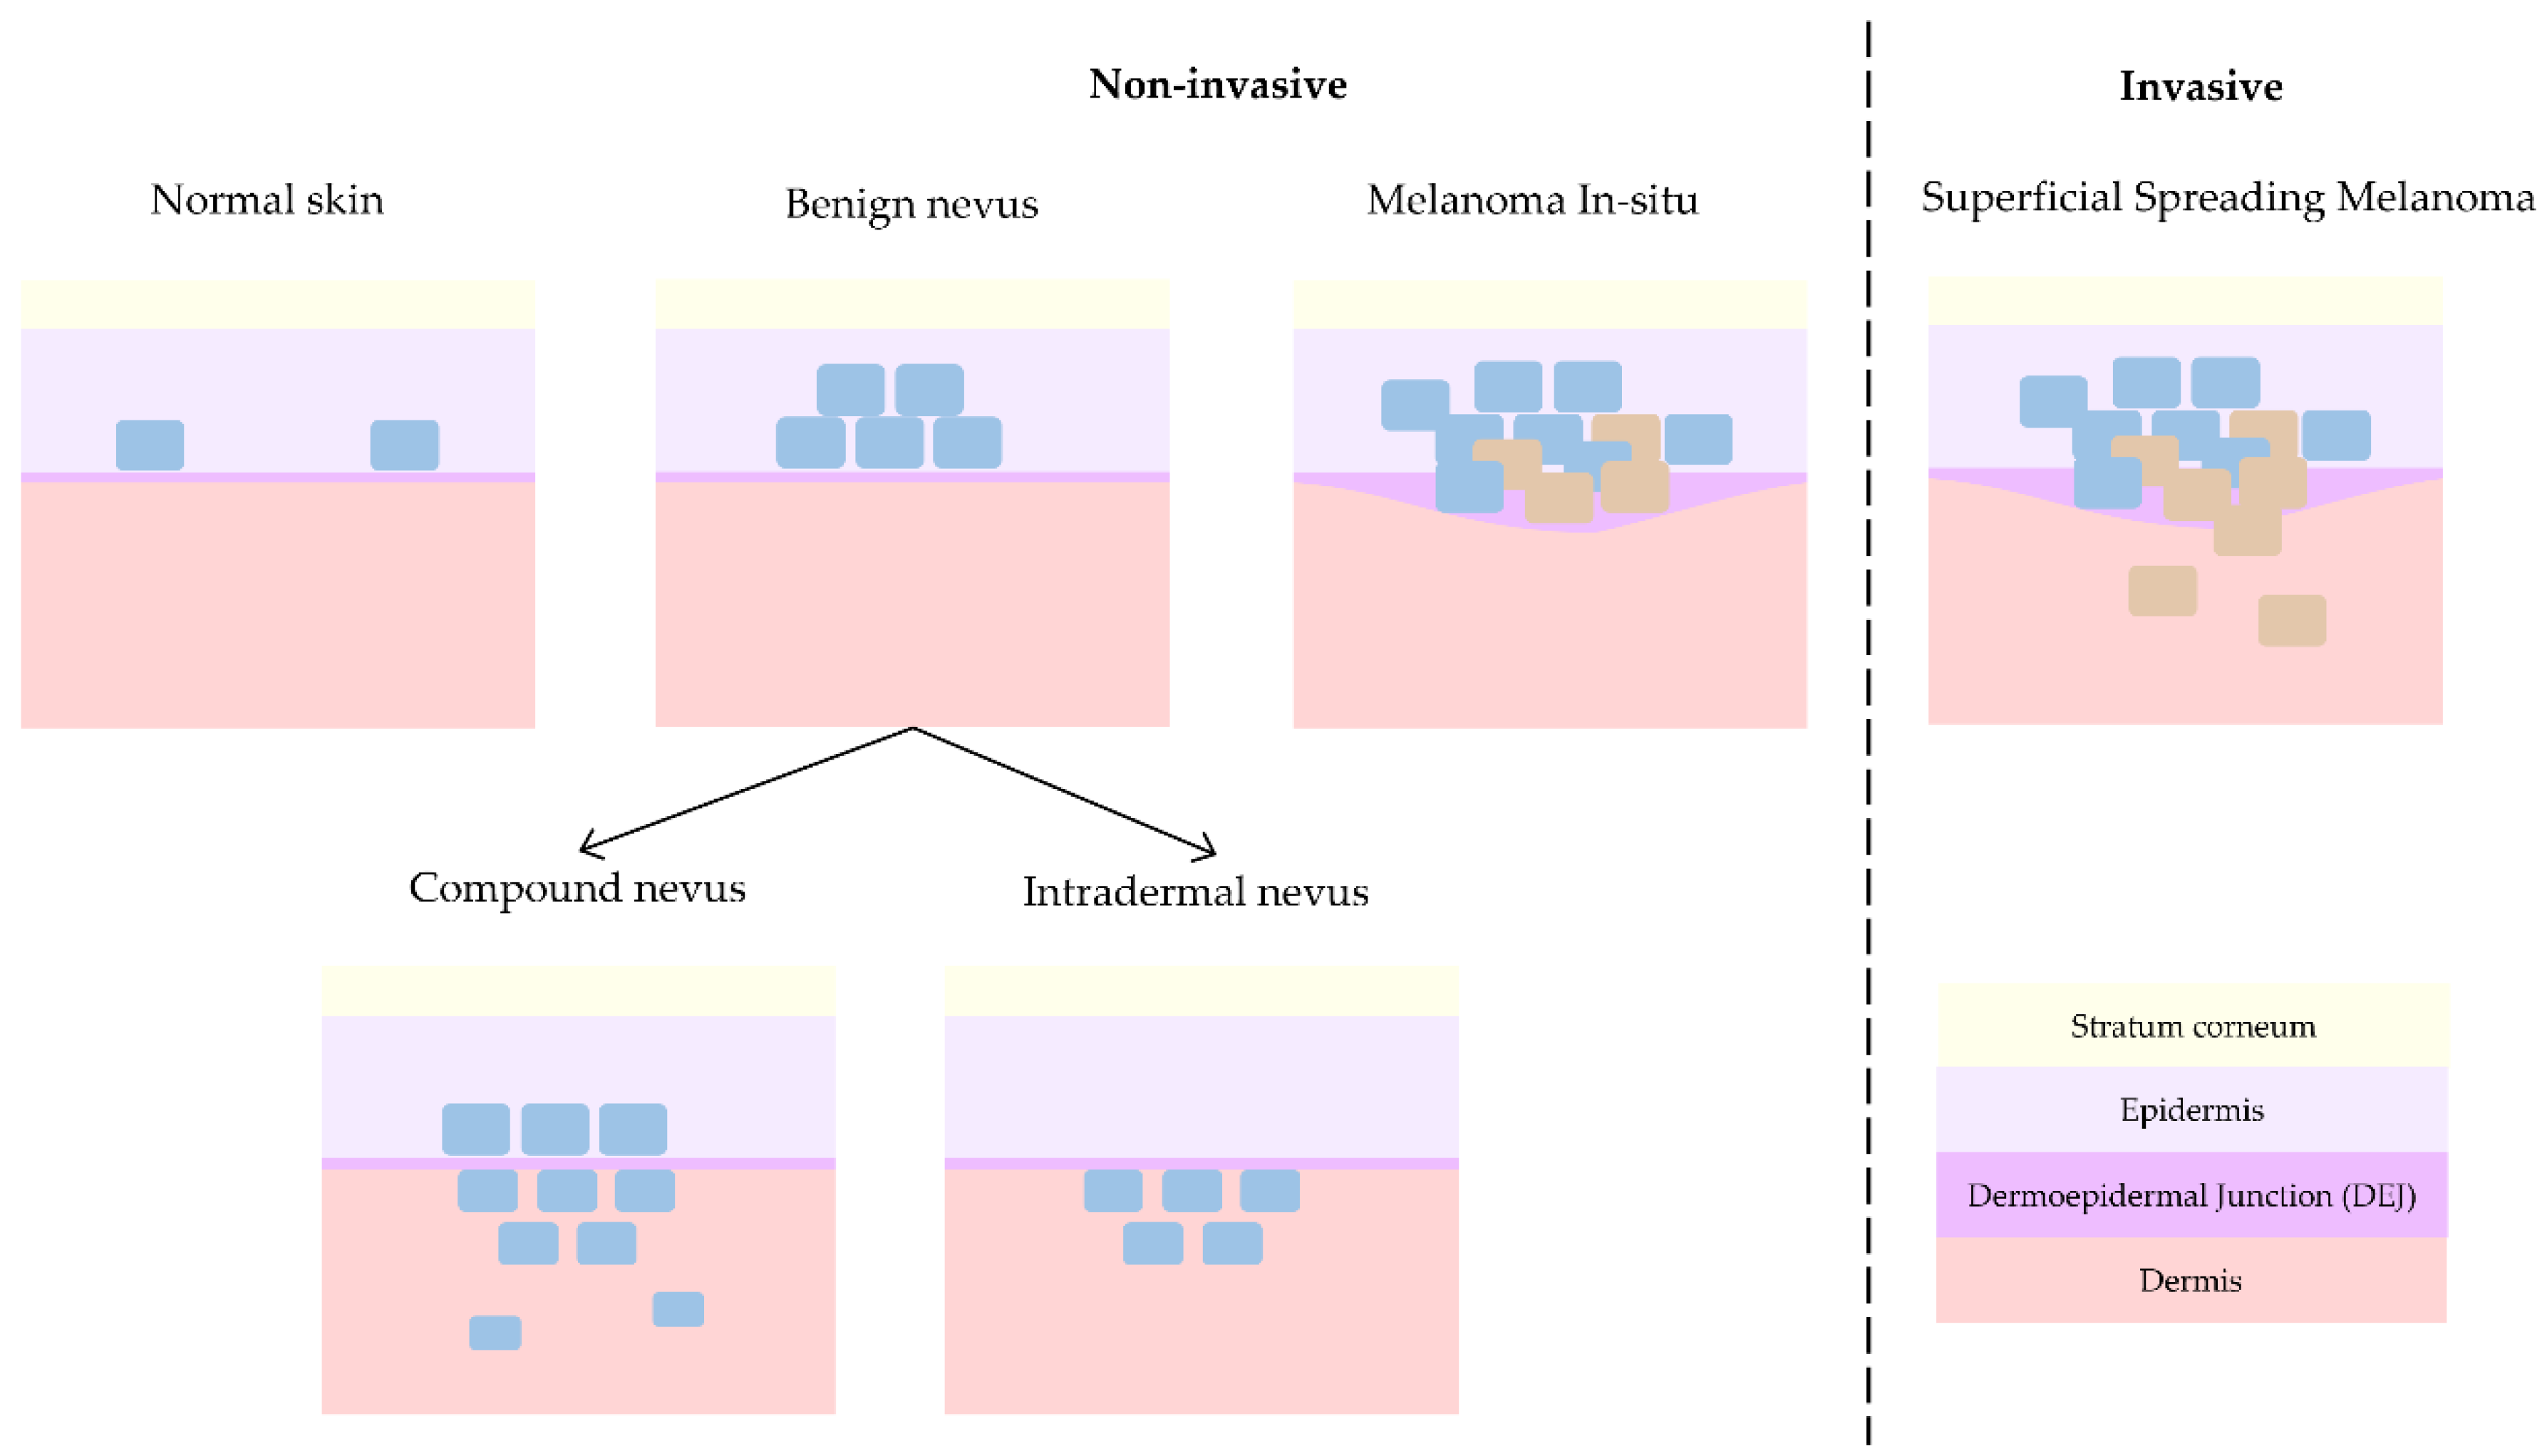
| Epidermis | Dermis | |
|---|---|---|
| Non-invasive | ||
| Compound nevus (CN) | X | X |
| Intradermal nevus (IN) | X | |
| Melanoma in-situ (MIS) | X | |
| Invasive | ||
| Superficial spreading melanoma (SSM) | X | X |
| Compound nevus (CN) Case 1 | Localization: right dorsal |
 |  |
| Compound nevus (CN) Case 2 | Localization: right posterior thigh |
 |  |
| Intradermal nevus (IN) Case 1 | Localization: right forefoot (sole) |
 |  |
| Intradermal nevus (IN) Case 2 | Localization: left dorsal |
 |  |
| Melanoma in-situ (MIS) Case 1 | Localization: right abdomen |
 |  |
| Melanoma in-situ (MIS) Case 2 | Localization: left chest |
 |  |
| Superficial spreading melanoma (SSM) Case 1 | Localization: right anterior arm |
 |  |
| Superficial spreading melanoma (SSM) Case 2 | Localization: right forefoot (right ankle) |
 |  |
| LESION | HEALTHY (Adjacent) | ||
|---|---|---|---|
| Non-Invasive | Median—IQR 1 (mm −1) | Median—IQR (mm −1) | Median Difference |
| CN Case 1 | 1.14–0.10 | 0.62–0.04 | 0.52 |
| CN Case 2 | 1.60–0.71 | 1.52–0.16 | 0.08 |
| IN Case 1 | 1.94–0.15 | 0.96–0.09 | 0.98 2 |
| IN Case 2 | 1.10–0.11 | 0.90–0.03 | 0.20 |
| MIS Case 1 | 0.84–0.06 | 0.60–0.03 | 0.24 |
| MIS Case 2 | 1.34–0.13 | 0.75–0.05 | 0.59 |
| Invasive | |||
| SSM Case 1 | 1.37–0.13 | 0.62–0.05 | 0.75 |
| SSM Case 2 | 2.82–0.65 | 0.86–0.08 | 1.96 |
Disclaimer/Publisher’s Note: The statements, opinions and data contained in all publications are solely those of the individual author(s) and contributor(s) and not of MDPI and/or the editor(s). MDPI and/or the editor(s) disclaim responsibility for any injury to people or property resulting from any ideas, methods, instructions or products referred to in the content. |
© 2023 by the authors. Licensee MDPI, Basel, Switzerland. This article is an open access article distributed under the terms and conditions of the Creative Commons Attribution (CC BY) license (https://creativecommons.org/licenses/by/4.0/).
Share and Cite
Saratxaga, C.L.; Asumendi, A.; Gardeazabal, J.; Izu, R.M.; Sanchez, A.; Cancho-Galan, G.; Morales, C.; Lage, S.; Boyano, M.D.; Conde, O.M.; et al. Melanoma and Nevi Subtype Histopathological Characterization with Optical Coherence Tomography. Life 2023, 13, 625. https://doi.org/10.3390/life13030625
Saratxaga CL, Asumendi A, Gardeazabal J, Izu RM, Sanchez A, Cancho-Galan G, Morales C, Lage S, Boyano MD, Conde OM, et al. Melanoma and Nevi Subtype Histopathological Characterization with Optical Coherence Tomography. Life. 2023; 13(3):625. https://doi.org/10.3390/life13030625
Chicago/Turabian StyleSaratxaga, Cristina L., Aintzane Asumendi, Jesús Gardeazabal, Rosa M. Izu, Ana Sanchez, Goikoana Cancho-Galan, Celia Morales, Sergio Lage, Maria D. Boyano, Olga M. Conde, and et al. 2023. "Melanoma and Nevi Subtype Histopathological Characterization with Optical Coherence Tomography" Life 13, no. 3: 625. https://doi.org/10.3390/life13030625
APA StyleSaratxaga, C. L., Asumendi, A., Gardeazabal, J., Izu, R. M., Sanchez, A., Cancho-Galan, G., Morales, C., Lage, S., Boyano, M. D., Conde, O. M., & Garrote, E. (2023). Melanoma and Nevi Subtype Histopathological Characterization with Optical Coherence Tomography. Life, 13(3), 625. https://doi.org/10.3390/life13030625