Abstract
The prevalence of nonalcoholic fatty liver disease (NAFLD) worldwide is on the rise and NAFLD is becoming the most common cause of chronic liver disease. In the USA, NAFLD affects over 30% of the population, with similar occurrence rates reported from Europe and Asia. This is due to the global increase in obesity and type 2 diabetes mellitus (T2DM) because patients with obesity and T2DM commonly have NAFLD, and patients with NAFLD are often obese and have T2DM with insulin resistance and dyslipidemia as well as hypertriglyceridemia. Excessive accumulation of triglycerides is a hallmark of NAFLD and NAFLD is now recognized as the liver disease component of metabolic syndrome. Liver glucose and lipid metabolisms are intertwined and carbon flux can be used to generate glucose or lipids; therefore, in this review we discuss the important transcription factors and coactivators that regulate glucose and lipid metabolism.
1. Introduction
Nonalcoholic fatty liver disease (NAFLD) is a major public health concern which affects one-fourth of the general population worldwide [1]. In the United States, NAFLD affects 30% of the population [2] and is expected to reach 100 million people in the United States by the year 2030 [3]. NAFLD is characterized by lipid accumulation in the cytoplasm of hepatocytes, which results from an imbalance in lipid acquisition, clearance, and export (i.e., fatty acid uptake, de novo lipogenesis and mitochondrial fatty acid oxidation, production of very low-density lipoproteins particles) [4]. NAFLD is predicted to become the second most common reason for liver transplantation in the United States [6,7].
Obesity, which has reached epidemic proportions worldwide, is associated with an increased risk of numerous metabolic abnormalities, such as NAFLD and T2DM [1,2,3]. Diabetes, T2DM in particular, is a major health burden because of its chronic nature, growing speed, medical cost, and its impact on adults and adolescents [4]. In the United States, diabetic prevalence is estimated to be totaled at approximately 70 million by the year 2050; furthermore, currently 422 million adults globally are living with diabetes and this number is expected to increase to 629 million according to the World Health Organization (WHO) [5] (www.cdc.gov/diabetes/data/statistics-report (accessed on 6 March 2022). In children and adolescents, the prevalence of both type 1 diabetes mellitus (T1D) and T2DM has also increased [6]. Diabetes is associated with increased risk of chronic liver disease, cardiovascular disease, stroke, infections, chronic kidney disease, cancer, diabetic neuropathy, and blindness [7]. The link between diabetes and liver damage, such as fatty liver, cirrhosis, and hepatocellular carcinoma, is well documented [8]. Low-grade inflammation plays a critical pathophysiological role in diabetes [9] and patients with diabetes mellitus have an increased risk of developing infections as well as sepsis; this constitutes 20.1–22.7% of all sepsis patients [10].
T2DM, accounting for more than 90% of diabetes [4], is a severe and complex disease. Because of insulin resistance and insufficient secretion of insulin from pancreatic β cells, increased glucose production in the liver along with reduced glucose utilization in insulin-sensitive tissues, such as muscle and adipose tissues, lead to hyperglycemia in these patients [11,12,13]. Abnormal glucose metabolism impacts the major metabolic pathways, such as carbohydrates and lipids within different tissues and organs [14]. In mammals, the liver is the largest metabolic organ responsible for maintaining long-term energy needs in the body, which includes liver glucose metabolism and lipid metabolism that are tightly intertwined, and liver metabolism that is largely regulated by various transcriptional factors and coactivators. In this review, we will discuss the current understanding of the importance of transcriptional factors and coactivators in the regulation of liver glucose and lipid metabolism.
2. Regulation of Liver Metabolism by Transcription Factors
Evolution is tightly linked to phenotypic variations of organisms by gene expression. A change in the functional product of each gene is altered primarily by transcription factors. Transcription factors can bind to the promoter or enhancer regions of specific genes through their DNA-binding domains [15]. As a result, transcription factors regulate gene transcription, protein synthesis, and cellular function. Glucose is one of the principal energy fuels for mammalian cells and takes a central position in metabolism. In some mammalian tissues and cells, such as neurons, erythrocytes, and renal medulla, glucose is the sole energy source. Low blood glucose levels (hypoglycemia) can cause serious damage to these tissues or cells [16,17]. On the other hand, high blood glucose levels (hyperglycemia) can cause serious adverse effects, which are clearly demonstrated in diabetic patients [18,19]. Therefore, maintenance of blood glucose levels within a narrow range (70~110 mg/dL) is critical for protection of organisms against hypoglycemia during fasting and postprandial hyperglycemia. The liver is one of the main organs that contributes to the regulation of blood glucose levels by releasing the glucose into circulation when blood glucose levels are low and stores along skeletal muscles excess of glucose as glycogen in postprandial states. In mammals, the liver is the central organ for fatty acid metabolism and a key player in glucose metabolism. The liver acts as a crossroad, which metabolically connects various organs, especially skeletal muscle, and adipose tissues, in the endeavor to maintain the long-term energy supply to the body. The regulation of liver glucose metabolism and lipid metabolism is tightly controlled by dietary, hormonal, and neural signals through the activation of various transcriptional factors and coactivators, which will be discussed.
2.1. Cyclic AMP Response-Element Binding Protein (CREB)
CREB, a transcription factor, contains a basic leucine zipper motif and a DNA-binding basic region. CREB binds to the cAMP response element (CRE, 5′-TGACGTCA-3′) [20] in the promoter region of rate-limiting gluconeogenic gene, such as G6pc and Pck1, to upregulate gluconeogenesis in the liver. In the fast state, elevated blood glucagon activates the cAMP-PKA pathway and the phosphorylation of CREB at S133 by PKA, leading to the recruitment of CBP/P300 to CREB (Figure 1) [21,22]. Activated PKA also mediates the dephosphorylation of CRTC2 [21,22]. Phosphorylation of CRTC2 by SIK2 excludes CRTC2 from the nucleus; however, activated PKA can phosphorylate SIK2 at Ser587 and suppress SIK2 activity, therefore, negating its inhibition on CRTC2 [23], thus preventing CRTC2 degradation. Dephosphorylation of CBP leads to its association with CREB [24]. These events result in the formation of the CREB-CBP/P300-CRTC2 coactivator complex to promote gluconeogenic gene expression and hepatic glucose production (Figure 1). Interestingly, knockdown of the liver CREB by antisense oligonucleotide not only alleviated the hyperglycemia, but also reduced liver lipogenesis [25], suggesting that CREB can modulate both glucose and lipid metabolism.
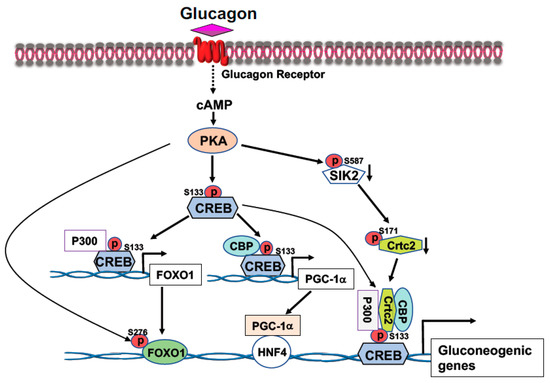
Figure 1.
Activation of the cAMP-PKA signaling by glucagon stimulates gluconeogenic gene expression. Phosphorylation of CREB at S133 by PKA facilitates the bindings of CBP and P300 to CREB. Activated PKA also promotes Crtc2 binding to CREB through inhibition of SIK2 activity, leading to the formation of the CREB-CBP/P300-Crtc2 complex on the promoter of gluconeogenic genes. Phosphorylation of CREB at S133 by PKA recruits P300 on the promoter of Foxo1 gene to initiate Foxo1 gene expression, together with PKA-mediated FOXO1 phosphorylation at S276 increases its stability, leading to increased FOXO1 binding onto the promoter of gluconeogenic genes. Increased expression of PGC-1a gene expression by PKA-mediated CREB phosphorylation at S133 upregulates the rate-limiting gluconeogenic gene expression of Pck1 and G6pc via HNF4a.
2.2. FOXO1
FOXO1 transcription factor belongs to the large Forkhead family of proteins containing a highly conserved DNA-binding domain termed the “Forkhead box”. There are four members (FOXO1, FOXO3, FOXO4, and FOXO6) in the FOXO subgroup [26]. Among these proteins, FOXO3 is highly expressed in the brain and FOXO6 is predominantly expressed in the developing brain. FOXO1 is abundant in adipose tissues and liver, and FOXO4 is abundant in muscle tissues [27]. The Forkhead box, a 110 a.a. region located in the N-terminal part of FOXO protein, can bind to DNA containing two of the consensus recognition DNA sequences: DAF-16 family member-binding element (5′-GTAA(C/T)A-3′) [28] or insulin-responsive element (5′-(C/A)(A/C)AAA(C/T)AA-3′). All of the members in the FOXO family can recognize the core DNA sequence (5′-(A/C)AA(C/T)A-3′) [29].
FOXO1 is a major target of insulin signaling and is the direct substrate of protein kinase B (AKT) in response to the stimulation of insulin or growth factors. Phosphorylation of FOXO can alter their subcellular location, DNA binding affinity, and transcriptional activity [30]. Phosphorylation of FOXO1 at S256 by AKT generates a negative charge in the DNA-binding domain, thus hindering DNA binding [31]. The phosphorylation events in FOXO1 can increase its association with 14-3-3 proteins, leading to the translocation of FOXO1 from nucleus to cytoplasm [32]. Therefore, FOXO1 is rendered to inactive and degradation by virtue of its subcellular compartmentalization and diminished DNA binding (Figure 2). In the liver, FOXO1 binds to the promoter region of rate-limiting gluconeogenic genes Pck1 and G6pc to upregulate liver glucose production [33,34,35]. Recent studies from Dr. Guo’s group showed that phosphorylation of FOXO1 at S276 by PKA can retain FOXO1 in the nucleus and increases its stability (Figure 1) [35]. Interestingly, FOXO1 and IRS2 can reciprocally increase each other’s stability and generate a regulatory circuit [36]. FOXO1 can affect the VLDL production through regulation of the expression of the microsomal triglyceride transfer protein (MTP) or ApoC3 [37,38].
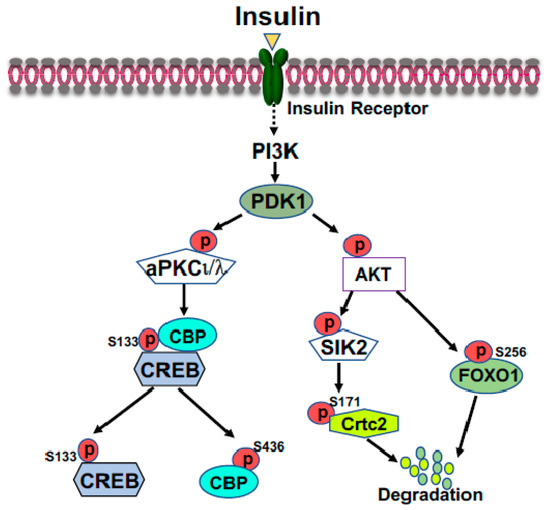
Figure 2.
Suppression of gluconeogenic gene expression by insulin in the fed state. Phosphorylation of FOXO1 by insulin-activated AKT promotes FOXO1 nuclear exclusion and degradation. Activated AKT can activate SIK2, leading to the phosphorylation of CRTC2 at Ser171; subsequently, phosphorylated CRTC2 is excluded from the nucleus and degraded in the cytoplasm. Activated aPKCι/λ by insulin, through the PI3K-PDK1 pathway, can directly phosphorylate CBP at S436, resulting in the disassembly of CREB coactivator complex.
2.3. Carbohydrate Response Element Binding Protein (ChREBP)
ChREBP is an important transcriptional activator of hepatic lipogenesis and fructose metabolism [39,40]. ChREBP binds to a highly conserved carbohydrate response element, C(A/G)(C/T)G(T/C/G)Gnnnnn(C/A)(C/G/A)(C/T/G)G(T/A/G)G, on the promoter of target genes [41]. ChREBP is activated by increased glucose influx and drives the gene expression of the rate-limiting glycolytic pyruvate kinase in liver, and acts in synergy with SREBP-1 (see below) to drive expression of genes involved in de novo fatty acid synthesis (lipogenesis) and esterification, such as ACC, FASN, SCD1, and Elovl6 (Figure 3) [41,42]. Therefore, in the feeding state, excessive blood glucose can be split into pyruvate and channeled into lipogenesis in the liver. Additionally, in the feeding state, glucose will be converted to xylulose 5-phosphate through the pentose phosphate pathway to glucose 6-phosphate (Figure 3). Activation of PP2A by xylulose 5-phosphate, and subsequently, the dephosphorylation of ChREBP by PP2A [41], together with the binding of glucose 6-phosphate to ChREBP render its translocation to the nucleus [43]. ChREBP plays a role in regulating fructose metabolism because loss of liver ChREBP reduces the expression of fructokinase and triose kinase, leading to fructose intolerance [40]. In the fasting state, activated PKA by elevated blood glucagon phosphorylate ChREBP at S196 and T666 leads to the disassociation of ChREBP from the promoters of target genes and binding to 14-3-3, which excludes ChREBP from the nucleus and retains it in the cytoplasm [41,44]. Since ChREBP can activate G6pc expression, ingested fructose can be converted to glucose in the liver and be released into circulation to exacerbate hyperglycemia [45]. Conversely, the gene expression levels of ChREBP are positively correlated with hepatosteatosis and negatively related to liver glycogen contents and insulin resistance.
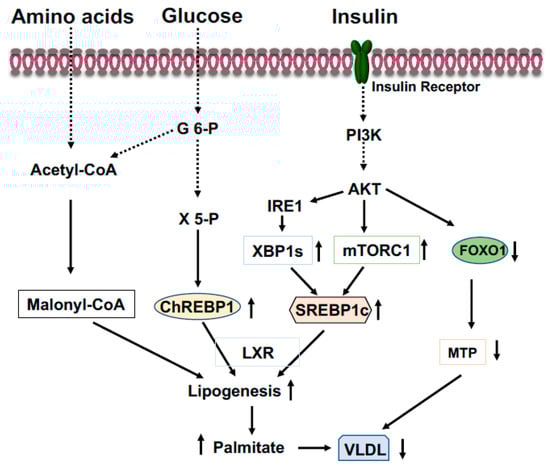
Figure 3.
Coordinated regulation of lipid metabolism in the liver in the fed state. Elevated blood glucose and amino acids provide lipogenic substrate malonyl-CoA through conversion of acetyl-CoA. Activation of the PI3K-AKT signaling by insulin upregulates expression of SREBP1c through mTOCR1 and phosphorylation of IRE1 at S724 to mediate the splicing of XBP1 mRNA and the generation of spliced form XBP1s, then, XBP1s stimulates SREBP1c expression. Xylulose 5-phosphate via the pentose-phosphate pathway promotes ChREBP1 nuclear entry and lipogenesis. Phosphorylation of FOXO1 by AKT results in FOXO1 degradation and decreased expression of MTP, resulting in increased triglyceride accumulation in the liver.
2.4. Sterol Regulatory Element-Binding Protein-1 (SREBP-1)
SREBPs, transcription factors and the master regulators of cellular lipid metabolism and homeostasis, are involved in various physiological and pathological processes of lipid synthesis [46]. There are two SREBP genes, SREBP-1 and SREBP-2, that give rise to three SREBP proteins: SREBP-1a, SREBP-1c and SREBP-2. SREBP-1 is mainly involved in fatty acid synthesis and SREBP-2 in cholesterol synthesis. SREBP-1c and SREBP-2 are the predominant isoforms expressed in the liver. The regulation of these gene expressions is in a feed-forward manner because their promoters harbor the sterol regulatory element (SRE, 5′-ATCACNCCAC-3′) [47]. To activate the transcription of target genes, SREBPs must be transported to the Golgi complex, where they are cleaved by two functionally distinct proteases, namely, Site-1 protease (S1P, also known as MBTPS1) and Site-2 protease (S2P, also known as MBTPS2). Then, the transcriptionally active fragment of SREBP is released into the cytosol and then migrates into the nucleus. This activation by proteolytic processing is tightly regulated by the interaction with ER membrane proteins, SREBP cleavage-activating protein (SCAP), and insulin-induced gene (Insig) [48]. Under conditions of deprived sterols, SCAP escorts SREBPs from the ER to the Golgi complex through incorporation into COPII-coated vesicles. Subsequently, SREBPs are cleaved by S1P and S2P within the Golgi. With increased cholesterol content (high sterols), Insig binds to SCAP to retain SCAP/SREBPs on the ER membrane as an inactive precursor [49].
SREBP-1c preferentially upregulates gene expressions that are related to fatty acids and triglyceride synthesis, such as ACC, FASN, SCD1, and GPGT, while SREBP-2 mainly controls gene expressions required for cholesterol synthesis and uptake, such as HMGS, HMGR, and LDL receptor [46]. Insulin or feeding can drastically increase the mRNA levels of SREBP-1c [50,51], through the mTOR, and requires LXR and C/EBPβ (Figure 3) [52]. Insulin also regulates the expression of Insig-1 and Insig-2, two important inhibitors for the proteolytic activation of SREBPs [53,54]. Since overexpression of either SREBP-1c or SREBP-1a in mouse liver markedly increased the expression of lipogenic genes and causes massive hepatosteatosis [55], hyperinsulinemia in obesity or early stage of T2DM would stimulate the expression of SREBP-1, thus leading to the development of steatosis.
2.5. X-Box Binding Protein 1 (XBP1)
Endoplasmic reticulum (ER) stress has emerged as a key player in the progression of insulin resistance and the promotion of lipid accumulation in the liver since it can transduce some effects of lipid metabolites and cytokines into the activation of stress kinases [56]. ER stress leads to the cellular response termed the unfolded protein response (UPR) through the activation of three canonical pathways: IRE1-XBP1s, PERK-eIF2, and ATF6 [57,58]. Solid evidence has demonstrated the elevation of the UPR in the liver of patients with diabetes, obesity, and NAFLD, whereas administration of the chemical chaperones 4-phenyl butyric acid (PBA) or taurine-conjugated ursodeoxycholic acid (TUDCA) to ob/ob mice normalized blood glucose levels, improved insulin sensitivity, and reduced hepatic steatosis [59,60]. ER stress is able to induce the entire lipogenic program, and the attenuation of ER stress in ob/ob mice which decreases SREBP1c activation and triglyceride contents in the liver [61]. In particular, the IRE1-XBP1 pathway is critical for lipogenesis [62,63].
XBP is a bZIP member of the CREB/ATF family of transcription factors. This gene consists of six exons and encodes 261 amino acids in the normal condition. However, the accumulation of unfolded proteins in the ER leads to the activation of IRE1α, and activated IRE1α excises a 26-nucleotide intron of the XBP1 mRNA and shifts the coding reading frame, resulting in the expression of a more stable and active form known as XBP1s (for the spliced form) with 276 amino acids [64,65]. XBP1s is an important transcription factor that drives SREBP1 gene (Srebf1) expression [66]. Coactivator P300 can be induced by XBP1s, thus increasing glucose production in the liver (see below) [67,68]. Our recent study revealed that the activation of IRE1-XBP1 signaling by insulin-activated AKT increases XBP1s to stimulate liver lipogenesis in the fed state (Figure 3), while in the fasted state augmentation of XBP1u (the unspliced form) upregulates liver gluconeogenesis to maintain the euglycemia [69]. Thus, XBP1s can affect both glucose and lipid metabolism.
2.6. Nuclear Receptors
Nuclear receptors (NRs) are ligand-regulated transcriptional factors involved in a broad spectrum of biological processes [70]. No ligand-binding orphan receptors were also included in this superfamily, and currently, this superfamily comprises of 48 members. NRs play several roles in the regulation of physiological processes of metabolism, development, cell proliferation, immune response, reproduction, and pathological processes such as metabolic syndromes and cancer, as well as neurological disorders. Members in this family share similar protein homology, a transactivation domain at the N-terminal, a DNA-binding domain followed by a hinge domain, and a ligand-binding domain at the C-terminal [71]. The binding of a ligand to the ligand-binding domain transforms the NRs into transcriptionally competent factors. Based on structural and phylogenetic analysis, NRs are divided into six distinct groups. The dysregulation of NRs contributes to the development of several diseases, including diabetes, cancer, etc. Several NRs can play important roles in regulating liver glucose and lipid metabolism which are discussed below.
2.6.1. Peroxisome Proliferator Activated Receptors (PPARs)
Discovered 30 years ago, PPARs (consisting of three isotypes: PPARα, β/δ, and γ) are important metabolic regulators of systemic energy homeostasis. They are ligand-inducible transcriptional factors that belong to the nuclear receptor superfamily. However, each of them contains different functions and expression abundance within the targeting tissues [72]. All PPARs, like other NRs, have an N-terminal activation domain, a central DNA-binding domain, a cofactor-binding flexible hinge region, and a ligand-binding domain at the C-terminal. Ligand binding, heterodimerization with RXR, and interaction with coactivators lead to the full activation of transcriptional activity of genes containing PPAR response element (PPRE, 5′-AGGTCANAGGTCA-3′) and each PPAR member is preferentially bound by distinct ligands [73]. PPARs can be activated by natural lipid-derived metabolites, dietary lipids, and synthetic compounds, including fibrates and TZD, to augment target gene expression in the liver, muscle, and adipose tissues.
PPARα is highly expressed in the metabolic tissues, such as liver and skeletal muscle, with high mitochondrial fatty acid oxidation. The expression of PPARα is regulated by insulin, leptin, growth hormones, glucocorticoids, and stress. Fasting increases fatty acid oxidation by induction of PPARα to provide ATP and GTP for the energy-demanding gluconeogenesis process in the liver. Leptin can upregulate PPARα expression through changes of fatty acids flux [74]. In the presence of PGC-1α, adiponectin also upregulates PPARα-responsive gene expression [75]. However, both insulin and growth hormone downregulate PPARα expression [76,77]. PPARα target genes can regulate lipid and glucose metabolism and inflammatory responses [78]. PPARα functions primarily in the liver and controls directly or indirectly the gene expressions of FATP, CD36, FABP, CPT1α and 2, LCAD, VLCAD, ECI1, and ACOX to regulate fatty acids uptake, binding, transport, synthesis, oxidation, storage, and ketogenesis [79,80]. Liver-specific PPARα knockout mice exerted increased liver lipid accumulation and hypercholesterolemia [81]. In the fed state, PPARα can control lipogenesis and allows the use of nutrients to generate fatty acids [82] because activation of PPARα increases the levels of mature nuclear form SREBP-1c via proteolytic cleavage [83].
PPARβ/δ is expressed ubiquitously as well as in most metabolically active tissues and plays a role in fatty acid oxidation and glucose metabolism. Activation of PPARβ/δ ameliorates hyperglycemia by reducing liver glucose production and increasing lipogenesis in the liver, and HFD-fed PPARβ/δ null mice exhibited increased VLDL production [84]. PPARγ consists of γ1, γ2, and γ4 isoforms in humans and is abundant in adipose tissues, but γ2 can be induced in the liver and muscle tissues [85,86]. PPARγ has an essential role in regulating adipocyte differentiation, lipid storage, insulin sensitivity, and glucose metabolism [87]. Activation of PPARγ by TZDs improves hyperglycemia and insulin sensitivity in patients with T2DM [88]. Knockout of liver PPARγ reduced liver steatosis, but elevated blood triglycerides and free fatty acids in addition to exacerbating hyperglycemia and insulin resistance [89].
2.6.2. Liver X Receptors (LXR)
LXRs, consisting of two isoforms (LXRα/β), are the transcriptional factors of the NR superfamily and play an important role in the control of cholesterol and lipid metabolism [90]. LXRα is highly expressed in the metabolic tissues—liver, intestine, adipose tissues, and macrophages—while LXRβ is expressed ubiquitously [91]. LXRs heterodimerize with retinoid X receptor (RXR) and bind to target gene promoters on LXR-responsive-element (LXRE). The canonical LXRE is composed of the repeated sequence AGGTCA, separated by four nucleotides [92]. A number of cholesterol derivatives, such as oxysterols and desmosterol, and synthetic ligands, can function as LXR activators [90,93]. Without the ligand binding, the LXR/RXR complex binds to corepressors: nuclear receptor corepressor (NCoR) and the silencing mediator of retinoic acid and thyroid hormone receptor (SMRT) to inhibit target gene expression. When either LXRs or RXR are activated by their ligands, the corepressors will be replaced by coactivators P300 and nuclear receptor coactivator 1, leading to the expression of target genes related to lipid metabolism [94]. The LXRα knockout mice had massive accumulation of cholesterol in the liver when fed a high-cholesterol diet [95]. Activation of LXRs increase bile acid synthesis and biliary cholesterol excretion through upregulation gene expression of Cyp7a1 and Abcg5/8, respectively [95,96]. Activation of LXRs stimulates transport from peripheral tissues to the liver for bile acid synthesis and excretion, thus decreasing the cellular cholesterol levels accomplished through the upregulation of the expression of the ATP bonding cassette (ABC) A1/G1 and reducing the low-density lipoprotein receptor (LDLR) [97]. Activation of LXRs also increased liver triglyceride levels through increasing de novo lipogenesis by upregulating the expression of SREBP1c and ChREBP [98,99].
2.6.3. Farnesoid X Receptors
Farnesoid X receptor (FXR) is a nuclear receptor and a ligand-activated transcriptional factor involved in the regulation of bile acid synthesis by controlling bile acid synthesis, transport, and metabolism, the enterohepatic cycle, glucose and lipid homeostasis, oxidative stress, and inflammation [100]. Four FXR isoforms are generated through an alternative promoter and RNA splicing. FXR is mainly expressed in the liver, intestines, and kidneys. In the liver, FXR modulates bile acid synthesis via inhibition of CYP7A1 [101]. FXR stimulates bile acid secretion by increasing the bile acid export pump and multidrug related protein, meanwhile, FXR reduces bile acid reabsorption. Activation of FXR protects against liver accumulation of bile acids; consequently, FXR knockout mice exhibit significantly increased bile acid levels in the liver, suggesting that FXR primarily regulates bile acid homeostasis and is a therapeutic target of cholestatic liver diseases [102]. Furthermore, FXR activation leads to reduction of liver triglyceride levels through upregulation of carboxylesterase 1 and PPARα as well as downregulation of SREBP1c [103,104]. FXR knockout mice exhibit increased blood glucose levels and insulin intolerance; however, activation of FXR reduces liver gluconeogenesis by inhibiting the expression of Pck1 and G6pc [103].
2.6.4. Hepatocyte Nuclear Factor 4 (HNF4)
HNF4 is a transcriptional factor belonging to the orphan nuclear receptors in the NR superfamily and its expression and activities are restricted to the liver and gastrointestinal tract while containing two isoforms (HNF4α and HNF4γ) [105,106]. HNF4 proteins have an additional repressor domain with an inhibitory function [107]. Interestingly, fatty acids could present constitutively in the ligand-binding domain, making HNF4 different from other members in the NR superfamily [108]. HNF4 has critical roles in liver development and regulation of liver functions through controlling the expression of liver-specific genes related to glycolysis, gluconeogenesis, fatty acid metabolism, urea production, bile acid synthesis, apolipoprotein synthesis, and drug metabolism [109]. Inactivation mutations in HNF4α result in insulin secretion defects [110]. Liver-specific HNF4α-null mice exhibited increased fat accumulation in the liver, drastic reduction of liver gluconeogenesis, along with reduced blood cholesterol and triglyceride levels [111]. Post-translational modification of HNF4 can modulate its transcriptional activity [112,113].
3. Regulation of Liver Metabolism by Coactivators and Corepressors
The genetic material of DNA is wrapped around core histones that form nucleosomes, the fundamental organizing unit, within the chromatin of all eukaryotic genomes [114]. The efficient packaging of the genetic material in the chromatin forms a physical barrier to RNA polymerase and transcription factors for preventing unnecessary gene transcription. To initiate gene transcription, histones undergo post-translational modifications (PTM) and changes to their chemical properties to unwrap chromatin. The core histones (H2A, H2B, H3, and H4) are rich in positively charged Lys residues, which bind to the negatively charged DNA backbone. However, acetylation masks the positive charges leading to the condensed chromatin being loosened and the chromatin being opened in order to be transcriptionally accessible to transcriptional factors and coactivators as well as the formation of the transcription apparatus [115,116]. Acetylation is a reversible process in which histone acetyltransferases (HATs) add an acetyl group to the lysine residue of the target protein, whereby, histone deacetylases (HDACs) remove the acetyl group. HATs and HDACs are major histone family proteins which regulate the post translational modifications process [117].
3.1. Regulation of Liver Metabolism of Coactivators CBP and P300
Coactivators can interact with other transcriptional factors and nuclear receptors to increase the gene transcription rate and are required for effective transcription of many eukaryotic genes through modification of constraint chromatin and activator recruitment of the transcriptional apparatus. To date, acetylation is the best understood and well-studied histone modification and the status of histone acetylation is closely related to transcriptional activation and silencing. HAT transfers an acetyl group to the ξ-amino groups of the lysine side chain within a histone or target protein, while the acetyl group can be removed by HDACs. HAT is classified by three different types based on their sequence homology, structure, and functional similarity.
In humans, there are 30 known HATs which are grouped into five families: GCN5- related N-acetyltransferase, MYST, CBP/P300, the general transcription factor HATs, and the nuclear hormone-related (SRC/NCoA) HATs [118,119]. GCN5 can regulate glucose and iron metabolism [120,121]. MYST histone acetyl transferases have been implicated in uncontrolled cell growth and malignancy in several human cancer types [122]; however, their role in regulating metabolism is not well documented. CBP/P300 contains three cysteine–histidine-rich domains, bromodomain, and an acetyl transferases domain that are involved in several signal transduction pathways to regulate metabolism and energy homeostasis [123,124]. CBP/P300 can act as histone acetyltransferases as well as transcriptional coactivators. The acetyltransferase activity of CBP/P300 transfers the acetyl group to lysine residues in histones, causing chromatin remodeling, and these proteins can bind to the transcriptional start sites and function as a coactivator with transcriptional factors to initiate target gene expression. CBP and P300 are ubiquitously expressed [125]. They are closely related proteins sharing numerous near identical regions and a similar structure including four cysteine–histidine-rich regions (CH1-3), the KIX domain (CREB-binding site), the bromodomain, the HAT domain, and the steroid receptor coactivator-1 interaction domain (SID) [126].
To protect organisms against hypoglycemia during fasting and postprandial hyperglycemia by the opposing actions of insulin signaling and glucagon signaling pathways, blood glucose levels are maintained within a narrow, defined range (70–110 mg/dL, fasting). In the fasted state, glucagon stimulates liver glucose production through the cAMP-PKA signaling pathway and phosphorylation of CREB at S133 by PKA (Figure 1) [127]. Phosphorylation of CREB at Ser133 leads to the recruitment CBP, P300, and CRTC2 to CREB and the formation of the CREB coactivator complex on the promoters of the rate-limiting gluconeogenic genes, Pck1 and G6pc, to stimulate gene expression and glucose production in the liver [21,24,128]. P300 can acetylate CRTC2 at K628 to prevent CRTC2 nuclear exclusion and degradation [129]. Furthermore, FOXO1 upregulates gluconeogenesis through activation of Pck1 and G6pc gene expression in the liver [130,131]. Our study showed that P300 stimulates Foxo1 gene expression in the fasted state through binding to the tandem cAMP-response element sites in the proximal promoter region of the Foxo1 gene [132]. Since FOXO1 binds to insulin responsive sequence (IRS) on the gluconeogenic gene, the coordinated effects of P300 and FOXO1 can fully activate the gluconeogenic program (Figure 1).
In the fed and postprandial states, elevated insulin levels will reduce blood glucose levels, and the gluconeogenic engine—the CREB-CBP/P300 complex—needs to be turned off and glucose will be used to generate glycogen and stored in the liver. Interestingly, insulin can also stimulate the phosphorylation of CREB at S133 [21], suggesting that CREB is constitutively phosphorylated at S133. CBP can be phosphorylated at S436 by atypical PKCι/λ (Figure 2) [22], leading to its dissociation from the CREB coactivator complex. However, P300 lacks the corresponding S436 phosphorylation site found in CBP, therefore, P300 constitutively binds to CREB to maintain the basal gluconeogenesis in the fed and postprandial states [24]. Physiologic concentration of glucose could not effectively promote glycogen synthesis when glucose was the sole substrate and efficient glycogen synthesis occurred when gluconeogenic precursors were added [133]. It has been proven that the gluconeogenic pathway contributes for 50–70% of newly synthesized glycogen during the postprandial state [134,135,136]. To mimic the phosphorylation site found in CBP, a phosphorylation-competent P300G422S knock-in mouse model was generated. These P300 knock-in mice had significantly decreased liver glycogen content and produced significantly less glycogen in a tracer incorporation assay in the postprandial state, indicating an important and unique role of P300 in glycogen synthesis through maintaining basal gluconeogenesis [137]. Moreover, both P300 and CBP can acetylate other proteins such as FXR, SREBP-1, and FOXO1 to modulate gene expression related to glucose and lipid metabolism (see below section) [138,139,140].
3.2. Regulation of Liver Metabolism of CREB-Regulated Transcription Coactivator 2 (CRTC2)
CRTC proteins, also known as transducers of regulated CREB activity, regulate the metabolic flux by controlling the important enzymes within the metabolic process. CRTC proteins have CREB-binding domain (amino terminus), transactivation domain (carboxy terminus), and regulatory domain (central part) which bind to the CREB and other bZIP (basic leucine zipper) proteins, basic transcriptional machineries, and enzymes [20]. Among the CRTC isoforms, CRTC2 can regulate glucose and lipid metabolism in a tissue-specific manner, including the liver, pancreas, the small intestines, and adipose tissues [141]. During fasting conditions, CRTC2 increases the gluconeogenic flux in the liver by activating Pck1 and G6pc genes [21]. Activated AKT by insulin through the PI3K-AKT pathway can activate SIK2, leading to the phosphorylation of CRTC2 at Ser171, and subsequently, the phosphorylated CRTC2 is excluded from the nucleus and degraded in the cytoplasm (Figure 2) [21]. However, activated PKA can drive CRTC2 translocation into the nucleus through inhibition of SIK2 [23].
3.3. Regulation of Liver Metabolism of PGC-1α
Peroxisome proliferator activated receptor gamma coactivator-1 alpha (PGC-1α) is a master transcriptional coactivator for mitochondrial biogenesis in brown adipose tissues [142]. This coactivator also regulates the transcription of genes related to gluconeogenesis, glucose transport, glycogenolysis, fatty acid oxidation, energy homeostasis, and mitochondrial activity in the liver [143,144,145]. In the fasted state, activation of cAMP-PKA by glucagon leads to the phosphorylation of CREB at S133 and recruitment of CBP to the promoter of PGC-1α to stimulate the PGC-1α gene expression, subsequently, PGC-1α coactivates HNF4α to upregulate the rate-limiting gluconeogenic gene expression of Pck1 and G6pc (Figure 1) [143,146]. Ιnterestingly, PGC-1a can affect insulin signaling and glucose metabolism by regulating the ratio of IRS1 and IRS2 in the liver [147].
PGC-1α has an important role in the regulation of lipid metabolism in the liver as well [148]. Mitochondrial dysfunction results in decreased fatty acid oxidation and is implicated in the development of hepatic steatosis. Overexpression of PGC-1α in hepatocytes elevates mitochondrial content and function, leading to an increase in fatty acid oxidation and reduction of triglyceride levels and VLDL synthesis and secretion [149]. On the other hand, heterozygous liver-specific PGC-1α knockout mice exhibited decreased expression of genes related to mitochondrial β oxidation and accumulation of triglycerides in the liver [144]. Furthermore, mice fed on a choline-deficient diet increased fat accumulation in the liver in part through impaired PGC-1α activity [150].
3.4. Regulation of Liver Metabolism of Corepressors
Corepressors comprise multiple proteins including DNA-binding proteins, histone methyltransferases, HDACs, Silencing mediator of retinoic acid and thyroid hormone receptor (SMRT), Nuclear receptor corepressor (NCoR), G-protein sippressor 2 (GPS2), transducing β-like protein (TBL1), and TBL-related 1 (TBLR1). Corepressors function as transcriptional silencers through interaction with many transcriptional factors, resulting in inactivation of a variety of chromatin remodeling enzymes to alter metabolism [151,152,153,154]. NCoR/SMRT/HDAC3 have a large NR-binding surface that interacts with multiple NR targets, thereby to regulate the liver metabolism [155]. Notably, HDAC3 can interact with PPARγ to impair insulin sensitivity in obese models and NCoR/HDAC3 can alter lipogenic enzymes through MeCP2 (Metyl-CpG-binding protein 2) [156]. In line with these studies, depletion of NCoR1/SMRT leads to metabolic abnormalities, including hypoglycemia, hypothermia, and weight loss [156].
4. Coordinated Regulation of Glucose and Lipid Metabolism by Transcriptional Factors and Coactivators in the Liver
4.1. Coordinated Regulation of Glucose Metabolism in the Liver
Blood glucose levels are tightly modulated by the insulin and glucagon signaling pathways. In the fed and postprandial states, elevated blood glucose levels promptly stimulate the secretion of insulin from pancreatic 𝛽 cells, leading to increased glucose uptake and utilization in insulin-sensitive tissues such as muscle and adipose tissue, and suppression of liver glucose production. In the fasting state, glucagon, secreted from the 𝛼 cells of the pancreas, stimulates liver gluconeogenesis through upregulation of the rate-limiting gluconeogenic genes Pck1 and G6pc. These two gluconeogenic genes are also controlled at the transcriptional level by insulin (discussed below).
In the fasted state, activation of cAMP-PKA signaling by elevated blood glucagon will lead to increased CREB phosphorylation at S133 and the formation of CREB-CBP/P300 complex to drive the expression of rate-limiting gluconeogenic expression (Figure 1). Augmentation of the expression of PGC-1α gene expression by CREB phosphorylation at S133 and recruitment of CBP leads to upregulation of the rate-limiting gluconeogenic gene expression of Pck1 and G6pc via HNF4α [143,146] (Figure 1). The salt-inducible kinases 2 (SIK2) play a role in modulating CRTC2 activity through phosphorylation of CRTC2 at S171 to exclude CRTC2 from the nucleus [21,23]. However, activated PKA can phosphorylate SIK2 at Ser587 to inhibit SIK2 activity and negate its inhibition on CRTC2, leading to CRTC2 translocation into the nucleus. Activation of cAMP-PKA signaling also stimulates the mRNA levels of the FOXO1 gene driven by CREB and P300, which bind to tandem CRE sites in the proximal promoter region of the FOXO1 gene [132] (Figure 1). In addition, PKA-mediated phosphorylation of FOXO1 at S276 increases FOXO1′s stability and nuclear localization (Figure 1) [35]. The finely tuned and coordinated regulation of gluconeogenic gene by these transcriptional factors and coactivators will maintain the glucose levels within the normal range and provide enough glucose for tissues and cells that depend on glucose as the sole energy source.
In the fed state, elevated blood glucose levels promptly stimulate the secretion of insulin from pancreatic β cells, leading to the suppression of liver glucose production. Insulin can inhibit liver glucose production through several mechanisms to maintain blood glucose levels. To turn off the gluconeogenic engine, the CREB coactivator complex, activated aPKCι/λ (atypical protein kinase C) by insulin, through the PI3K-PDK1 pathway, can directly phosphorylate CBP at S436 resulting in the disassembly of CREB coactivator complex (Figure 2) [22]. As mentioned above, insulin-stimulated phosphorylation of CRTC2 at Ser171 leads to nuclear exclusion and degradation (Figure 2). In addition, activated AKT mediates the phosphorylation of FOXO1, and then triggers the export of FOXO1 from the nucleus to the cytoplasm and promotes its ubiquitinylation and degradation (Figure 3) [29].
4.2. Coordinated Regulation of Lipid Metabolism in the Liver
In the fed state, elevated blood glucose and amino acids provide the substrate acetyl-CoA for lipogenesis, and also elevated blood glucose levels promptly stimulate the secretion of insulin from pancreatic β cells. In the liver, activation of the PI3K-AKT signaling by insulin results in increased expression of SREBP1c through mTOCR1 (Figure 3) [157]. Activated AKT can directly phosphorylate IRE1 at S724 to mediate the splicing of XBP1 mRNA and the generation of spliced form XBP1s; subsequently, XBP1s stimulates SREBP1c expression (Figure 3) [69]. Elevated blood insulin levels can increase the glucokinase activity to augment the generation of glucose 6-phosphate, then, xylulose 5-phosphate via the pentose-phosphate pathway. Xylulose 5-phosphate can promote ChREBP1 nuclear entry and lipogenesis (Figure 3) [158]. Furthermore, activated AKT mediates phosphorylation of FOXO1 and nuclear exclusion leads to the decreased expression of microsomal triglyceride transfer protein (MTP), limiting the export of triglyceride from the liver and favoring triglyceride accumulation in the liver [69].
5. Excessive Liver Glucose Production in T2DM and Obesity
In patients with T2DM and obesity, insulin resistance is the hallmark [1,56]. Because of intra-islet regulation and insulin resistance that lead to failed suppression of glucagon secretion from the pancreatic α cells, these patients have hyperglucagonemia and/or an increased ratio of glucagon/insulin [159,160,161,162]. This results in excessive liver glucose production and decreased glucose utilization in extrahepatic tissues (muscle and adipose tissues) causing fasted hyperglycemia. These patients have decreased liver glycogen contents [163,164]. The inappropriate high rates of liver glucose production, even in the compensatory stage with hyperinsulinemia, are through gluconeogenesis and glycogenolysis; however, the main contributor of inappropriate liver glucose production is elevated gluconeogenesis [165,166]. The availability of the gluconeogenic precursors is essential for the gluconeogenic capacity of the liver. Skeletal muscle is crucial for glucose utilization and is responsible for over 80% of glucose clearance [167,168]. However, up to 15% of glucose taken by the muscle is released as lactate, pyruvate, and alanine into circulation [169] and these metabolites will be used as gluconeogenic precursors by the liver. Importantly, due to insulin resistance and elevated ratio of glucagon/insulin in obesity and T2DM [159,160,161,162], lipolysis would be increased in adipose tissue and a glycerol flux to the liver would occur, glycerol will be used as a preferred gluconeogenic precursor (Figure 4) [170].
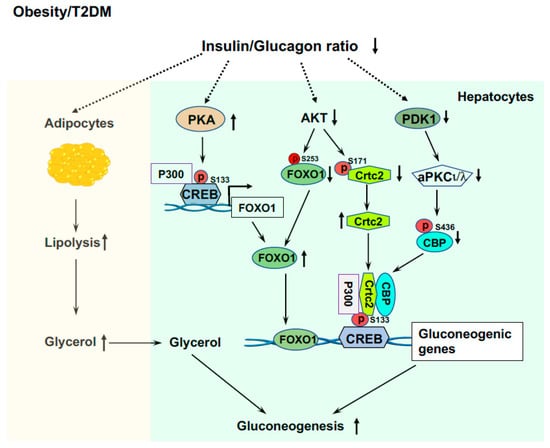
Figure 4.
Elevated liver glucose production in T2DM and obesity. Elevated ratio of glucagon/insulin increases lipolysis in adipose tissue and released glycerol is a preferred gluconeogenic precursor. Increased P300 and CREB phosphorylation upregulate the expression of the Foxo1 gene, and low AKT activity and impaired phosphorylation of FOXO1 by AKT, leading to increased FOXO1 protein levels that drive gluconeogenic gene expressions. Insulin resistance and impaired PDK1 and AKT activity leads to formation of the CREB-CBP/P300-Crtc2 complex to drive the over expression of gluconeogenic genes.
LPS leakage from the intestine into circulation and endoplasmic reticulum (ER) stress play important roles in the development of insulin resistance in obesity and T2D [56,171,172,173]. Our study showed that endotoxemia can induce P300 via XBP1s in the ER stress pathway in the liver [67]. Increased P300 will bind to the promoter of the Foxo1 gene and upregulate the expression of the Foxo1 gene (Figure 4) [132]. In addition, elevated P300 can bind to CREB to drive the gene expression of Pck1 and G6pc. These data reveal the significance of changes in the composition of gut microbiota and the increase in intestinal permeability and LPS leakage, and their initiated low-grade inflammation in the development of hyperglycemia in T2DM and obesity. Because of insulin resistance and impaired insulin signaling [68], patients with obesity and T2DM have low AKT activity and impaired phosphorylation of FOXO1and Crtc2 by AKT, leading to increased FOXO1 and Crtc2 protein levels that drive further gluconeogenic gene expressions (Figure 4).
6. Abnormal Lipid Metabolism in the Liver of T2DM and Obesity
In obesity and T2DM, insulin resistance results in elevated blood glucose (hyperglycemia) and hyperglycemia can stimulate glucose uptake by the liver through mass action even with impaired activity of glucokinase (hexokinase IV) [174,175]. However, glucose from circulation would not be used to make glycogen due to the inappropriate activation of glycogen phosphorylase and inhibition of glycogen synthase by increased blood glucagon or glucagon/insulin ratio, leading to low glycogen contents in the liver [163,164]. Glucose carbon can therefore be used to make fatty acids, providing a nutrient flux for de novo lipogenesis (DNL). Furthermore, hyperglycemia will cause a compensatory increase in insulin secretion from pancreatic β cells to counter the insulin resistance [176]. High basal and continuously increasing fasting insulin level is a marker for the development of non-alcoholic fatty liver diseases (NAFLD) [177], and elevated insulin would increase SREBP-1c, coordinating LXR and ChREBP to promote the expression of lipogenic genes and de novo lipogenesis in the liver [50].
Furthermore, due to insulin resistance and elevated blood glucagon levels, there is an increase in adipose tissue lipolysis and the release of free fatty acids (FFA) into circulation in patients with T2DM and obesity [178]. Plasma FFA can be re-esterified and channeled into VLDL (Figure 5). Moreover, impaired insulin signaling can prevent the degradation of FOXO1 and phosphorylation of this protein by PKA can increase FOXO1 nuclear localization [35] and upregulate the expression of MTP [69]. Collectively, these effects will increase lipogenesis and VLDL production in the liver (Figure 5).
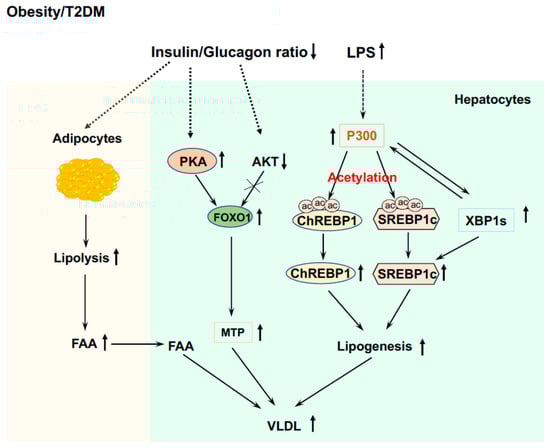
Figure 5.
Abnormal lipid metabolism in the liver of T2DM and obesity. Induced P300 via XBP1s by endotoxemia acetylates SREBP1c and ChREBP1 to drive de novo lipogenesis. The interaction of P300 and XBP1s also stabilizes XBP1s, and XBP1s can stimulate de novo lipogenesis by upregulating SREBP1c expression. Impaired insulin signaling can prevent the degradation of FOXO1, and phosphorylation of FOXO1 by PKA can increase FOXO1 nuclear localization and upregulate the expression of MTP. The decreased ratio of insulin to glucagon stimulates lipolysis in adipose tissue and releases FFA into circulation, and FAA will be used to generate TG and incorporate into VLDL.
For lipogenesis in the liver, intact insulin signaling is required; therefore, defects in hepatic insulin signaling should lead to decreased fatty accumulation in the liver. However, patients with insulin resistance in obesity and T2DM commonly have hepatosteatosis [179,180]. Many patients with a similar degree of liver steatosis exhibit distinct insulin sensitivity (very high or very low) [181] and improvement of insulin resistance does not necessarily reverse liver steatosis [182]. Therefore, there is a dissociation of hyperglycemia and insulin resistance with liver steatosis in some patients. As mentioned above, endotoxemia can induce P300 via XBP1s in the ER stress pathway in the liver [67] and elevated P300 can disrupt insulin signaling by acetylating IRS1 and 2 in the insulin signaling pathway [67]. Nuclear form SREBP1 can activate SREBP1c gene expression in a feed-forward manner [47,183]. In the liver of HFD-fed mice, the nuclear form of the SREBP1 protein was heavily acetylated [139], and in cultured hepatocytes the mutation of P300 acetylation sites at K289 and K309 (double KR mutation) in SREBP1n (nuclear active form) completely abolished the binding of SREBP1n to the promoter of the SREBP1c gene. Furthermore, P300 can acetylate ChREBP at K672 to augment ChREBP-mediated lipogenesis (Figure 5) [184]. These studies revealed that endotoxin-induced P300 can cause insulin resistance and stimulate lipogenesis in the liver of obese and T2DM patients.
7. Perspective
Glucose is a major energy source for mammalian cells and takes a central position in metabolism. It is the sole energy source in some mammalian tissues and cells, such as neurons, erythrocytes, and the renal medulla; in the brain, the rate of glucose utilization is about 130 g/day [16,185]. However, higher blood glucose levels (fasting hyperglycemia) are toxic because of protein modifications and the induction of oxidative damage [186,187,188,189]. Hyperglycemia can cause other adverse effects in diabetes, including NAFLD [7,18,190]. Effective treatment to maintain the blood glucose levels of patients with obesity and T2DM within a small, defined range (70~110 mg/dL, fasting), therefore, is crucial in protecting patients from the adverse complications.
Patients with T2DM and obesity commonly have NAFLD, which includes a complex spectrum of disorders ranging from steatosis to nonalcoholic steatohepatitis (NASH) and cirrhosis. Excessive accumulation of triglycerides (TG) is a hallmark of NAFLD. NAFLD is rising rapidly and is the leading indication for liver transplantation worldwide. NAFLD affects over 30% of the population in the USA [191]. NAFLD is now recognized as the liver disease component of metabolic syndrome because patients with NAFLD often have obesity and type 2 diabetes with insulin resistance, dyslipidemia, hypertriglyceridemia, and hypertension [192]. In patients with T2DM, over 75% of patients have NAFLD and over 90% of severely obese patients that underwent bariatric surgery have NAFLD [193,194]. NAFLD can lead to NASH, cirrhosis, and hepatocellular carcinoma. The majority of patients with NAFLD are also obese and/or have T2DM [2], suggesting that there may be a mutual cause-and-effect relationship between fatty liver and insulin resistance in a unified pathogenesis mechanism [195,196]. As such, hyperinsulinemia in obesity and diabetes results in the development of steatosis through increasing hepatic lipogenesis; subsequently, the accumulation of hepatic lipid species, e.g., diacylglycerol (DAG) and ceramide, leads to the impairment of insulin signaling [195,196,197]. For these reasons, several drugs, such as metformin, SGLT-2 inhibitors, TZD, and GLP-1 agonists, are used in the treatment of T2DM have been assessed for improving fat metabolism in patients with NAFLD.
However, as of now, effective treatment for NAFLD has not been found yet and needs to be developed. Since sedentary lifestyles are an important cause of obesity and T2DM, and exercise can improve insulin sensitivity and attenuate fat accumulation in the liver [198], increasing physical activities would be an effective intervention to combat obesity and T2DM.
Author Contributions
Conceptualization, L.H.; writing-original draft, L.H.; writing-review and editing, L.H., B.R. and A.P. All authors have read and agreed to the published version of the manuscript.
Funding
This work was supported in part by grants from the National Institute of Diabetes and Digestive and Kidney Diseases: R01DK120309 and R01DK107641.
Institutional Review Board Statement
Not applicable.
Informed Consent Statement
Not applicable.
Data Availability Statement
Not applicable.
Conflicts of Interest
The authors declare no conflict of interest.
References
- Doria, A.; Patti, M.E.; Kahn, C.R. The emerging genetic architecture of type 2 diabetes. Cell Metab. 2008, 8, 186–200. [Google Scholar] [CrossRef] [PubMed]
- Masuoka, H.C.; Chalasani, N. Nonalcoholic fatty liver disease: An emerging threat to obese and diabetic individuals. Ann. N. Y. Acad. Sci. 2013, 1281, 106–122. [Google Scholar] [CrossRef]
- Powell-Wiley, T.M.; Poirier, P.; Burke, L.E.; Despres, J.P.; Gordon-Larsen, P.; Lavie, C.J.; Lear, S.A.; Ndumele, C.E.; Neeland, I.J.; Sanders, P.; et al. Obesity and Cardiovascular Disease: A Scientific Statement From the American Heart Association. Circulation 2021, 143, e984–e1010. [Google Scholar] [CrossRef] [PubMed]
- Lin, X.; Xu, Y.; Pan, X.; Xu, J.; Ding, Y.; Sun, X.; Song, X.; Ren, Y.; Shan, P.F. Global, regional, and national burden and trend of diabetes in 195 countries and territories: An analysis from 1990 to 2025. Sci. Rep. 2020, 10, 14790. [Google Scholar] [CrossRef] [PubMed]
- Khan, R.M.M.; Chua, Z.J.Y.; Tan, J.C.; Yang, Y.; Liao, Z.; Zhao, Y. From Pre-Diabetes to Diabetes: Diagnosis, Treatments and Translational Research. Medicina 2019, 55, 546. [Google Scholar] [CrossRef]
- Dabelea, D.; Mayer-Davis, E.J.; Saydah, S.; Imperatore, G.; Linder, B.; Divers, J.; Bell, R.; Badaru, A.; Talton, J.W.; Crume, T.; et al. Prevalence of type 1 and type 2 diabetes among children and adolescents from 2001 to 2009. JAMA 2014, 311, 1778–1786. [Google Scholar] [CrossRef] [PubMed]
- Papatheodorou, K.; Banach, M.; Bekiari, E.; Rizzo, M.; Edmonds, M. Complications of Diabetes 2017. J. Diabetes Res. 2018, 2018, 3086167. [Google Scholar] [CrossRef] [PubMed]
- Zhao, Y.; Xing, H.; Wang, X.; Ou, W.; Zhao, H.; Li, B.; Li, Y.; Duan, Y.; Zhuang, L.; Li, W.; et al. Management of Diabetes Mellitus in Patients with Chronic Liver Diseases. J. Diabetes Res. 2019, 2019, 6430486. [Google Scholar] [CrossRef] [PubMed]
- He, L. Alterations of Gut Microbiota by Overnutrition Impact Gluconeogenic Gene Expression and Insulin Signaling. Int. J. Mol. Sci. 2021, 22, 2121. [Google Scholar] [CrossRef] [PubMed]
- Koh, G.C.; Peacock, S.J.; van der Poll, T.; Wiersinga, W.J. The impact of diabetes on the pathogenesis of sepsis. Eur. J. Clin. Microbiol. Infect. Dis. 2012, 31, 379–388. [Google Scholar] [CrossRef] [PubMed]
- Magnusson, I.; Rothman, D.L.; Katz, L.D.; Shulman, R.G.; Shulman, G.I. Increased rate of gluconeogenesis in type II diabetes mellitus. A 13C nuclear magnetic resonance study. J. Clin. Investig. 1992, 90, 1323–1327. [Google Scholar] [CrossRef] [PubMed]
- Saltiel, A.R.; Kahn, C.R. Insulin signalling and the regulation of glucose and lipid metabolism. Nature 2001, 414, 799–806. [Google Scholar] [CrossRef] [PubMed]
- Wajngot, A.; Chandramouli, V.; Schumann, W.C.; Ekberg, K.; Jones, P.K.; Efendic, S.; Landau, B.R. Quantitative contributions of gluconeogenesis to glucose production during fasting in type 2 diabetes mellitus. Metabolism 2001, 50, 47–52. [Google Scholar] [CrossRef] [PubMed]
- Robey, R.B.; Weisz, J.; Kuemmerle, N.B.; Salzberg, A.C.; Berg, A.; Brown, D.G.; Kubik, L.; Palorini, R.; Al-Mulla, F.; Al-Temaimi, R.; et al. Metabolic reprogramming and dysregulated metabolism: Cause, consequence and/or enabler of environmental carcinogenesis? Carcinogenesis 2015, 36 (Suppl. S1), S203–S231. [Google Scholar] [CrossRef]
- Spitz, F.; Furlong, E.E. Transcription factors: From enhancer binding to developmental control. Nat. Rev. Genet. 2012, 13, 613–626. [Google Scholar] [CrossRef]
- Vannucci, R.C.; Vannucci, S.J. Hypoglycemic brain injury. Semin. Neonatol. 2001, 6, 147–155. [Google Scholar] [CrossRef]
- Desouza, C.; Salazar, H.; Cheong, B.; Murgo, J.; Fonseca, V. Association of hypoglycemia and cardiac ischemia: A study based on continuous monitoring. Diabetes Care 2003, 26, 1485–1489. [Google Scholar] [CrossRef]
- Einarsdottir, A.B.; Stefansson, E. Prevention of diabetic retinopathy. Lancet 2009, 373, 1316–1318. [Google Scholar] [CrossRef]
- Bellentani, S.; Marino, M. Epidemiology and natural history of non-alcoholic fatty liver disease (NAFLD). Ann. Hepatol. 2009, 8 (Suppl. S1), S4–S8. [Google Scholar] [CrossRef]
- Altarejos, J.Y.; Montminy, M. CREB and the CRTC co-activators: Sensors for hormonal and metabolic signals. Nat. Rev. Mol. Cell Biol. 2011, 12, 141–151. [Google Scholar] [CrossRef]
- Koo, S.H.; Flechner, L.; Qi, L.; Zhang, X.; Screaton, R.A.; Jeffries, S.; Hedrick, S.; Xu, W.; Boussouar, F.; Brindle, P.; et al. The CREB coactivator TORC2 is a key regulator of fasting glucose metabolism. Nature 2005, 437, 1109–1111. [Google Scholar] [CrossRef] [PubMed]
- He, L.; Sabet, A.; Djedjos, S.; Miller, R.; Sun, X.; Hussain, M.A.; Radovick, S.; Wondisford, F.E. Metformin and insulin suppress hepatic gluconeogenesis through phosphorylation of CREB binding protein. Cell 2009, 137, 635–646. [Google Scholar] [CrossRef] [PubMed]
- Muraoka, M.; Fukushima, A.; Viengchareun, S.; Lombes, M.; Kishi, F.; Miyauchi, A.; Kanematsu, M.; Doi, J.; Kajimura, J.; Nakai, R.; et al. Involvement of SIK2/TORC2 signaling cascade in the regulation of insulin-induced PGC-1alpha and UCP-1 gene expression in brown adipocytes. Am. J. Physiol. Endocrinol. Metab. 2009, 296, E1430–E1439. [Google Scholar] [CrossRef] [PubMed]
- He, L.; Naik, K.; Meng, S.; Cao, J.; Sidhaye, A.R.; Ma, A.; Radovick, S.; Wondisford, F.E. Transcriptional co-activator p300 maintains basal hepatic gluconeogenesis. J. Biol. Chem. 2012, 287, 32069–32077. [Google Scholar] [CrossRef]
- Erion, D.M.; Ignatova, I.D.; Yonemitsu, S.; Nagai, Y.; Chatterjee, P.; Weismann, D.; Hsiao, J.J.; Zhang, D.; Iwasaki, T.; Stark, R.; et al. Prevention of hepatic steatosis and hepatic insulin resistance by knockdown of cAMP response element-binding protein. Cell Metab. 2009, 10, 499–506. [Google Scholar] [CrossRef] [PubMed]
- Peng, S.; Li, W.; Hou, N.; Huang, N. A Review of FoxO1-Regulated Metabolic Diseases and Related Drug Discoveries. Cells 2020, 9, 184. [Google Scholar] [CrossRef]
- Greer, E.L.; Brunet, A. FOXO transcription factors at the interface between longevity and tumor suppression. Oncogene 2005, 24, 7410–7425. [Google Scholar] [CrossRef]
- Furuyama, T.; Nakazawa, T.; Nakano, I.; Mori, N. Identification of the differential distribution patterns of mRNAs and consensus binding sequences for mouse DAF-16 homologues. Biochem. J. 2000, 349, 629–634. [Google Scholar] [CrossRef]
- Brent, M.M.; Anand, R.; Marmorstein, R. Structural basis for DNA recognition by FoxO1 and its regulation by posttranslational modification. Structure 2008, 16, 1407–1416. [Google Scholar] [CrossRef]
- Lalmansingh, A.S.; Karmakar, S.; Jin, Y.; Nagaich, A.K. Multiple modes of chromatin remodeling by Forkhead box proteins. Biochim. Biophys. Acta 2012, 1819, 707–715. [Google Scholar] [CrossRef]
- Zhang, X.; Gan, L.; Pan, H.; Guo, S.; He, X.; Olson, S.T.; Mesecar, A.; Adam, S.; Unterman, T.G. Phosphorylation of serine 256 suppresses transactivation by FKHR (FOXO1) by multiple mechanisms. Direct and indirect effects on nuclear/cytoplasmic shuttling and DNA binding. J. Biol. Chem. 2002, 277, 45276–45284. [Google Scholar] [CrossRef] [PubMed]
- Xie, Q.; Chen, J.; Yuan, Z. Post-translational regulation of FOXO. Acta Biochim. Biophys. Sin. 2012, 44, 897–901. [Google Scholar] [CrossRef] [PubMed]
- Dong, X.C.; Copps, K.D.; Guo, S.; Li, Y.; Kollipara, R.; De Pinho, R.A.; White, M.F. Inactivation of hepatic Foxo1 by insulin signaling is required for adaptive nutrient homeostasis and endocrine growth regulation. Cell Metab. 2008, 8, 65–76. [Google Scholar] [CrossRef]
- Zhang, K.; Li, L.; Qi, Y.; Zhu, X.; Gan, B.; DePinho, R.A.; Averitt, T.; Guo, S. Hepatic suppression of Foxo1 and Foxo3 causes hypoglycemia and hyperlipidemia in mice. Endocrinology 2012, 153, 631–646. [Google Scholar] [CrossRef] [PubMed]
- Wu, Y.; Pan, Q.; Yan, H.; Zhang, K.; Guo, X.; Xu, Z.; Yang, W.; Qi, Y.; Guo, C.A.; Hornsby, C.; et al. Novel Mechanism of Foxo1 Phosphorylation in Glucagon Signaling in Control of Glucose Homeostasis. Diabetes 2018, 67, 2167–2182. [Google Scholar] [CrossRef] [PubMed]
- Guo, S.; Dunn, S.L.; White, M.F. The reciprocal stability of FOXO1 and IRS2 creates a regulatory circuit that controls insulin signaling. Mol. Endocrinol. 2006, 20, 3389–3399. [Google Scholar] [CrossRef] [PubMed]
- Kamagate, A.; Qu, S.; Perdomo, G.; Su, D.; Kim, D.H.; Slusher, S.; Meseck, M.; Dong, H.H. FoxO1 mediates insulin-dependent regulation of hepatic VLDL production in mice. J. Clin. Investig. 2008, 118, 2347–2364. [Google Scholar] [CrossRef]
- Altomonte, J.; Cong, L.; Harbaran, S.; Richter, A.; Xu, J.; Meseck, M.; Dong, H.H. Foxo1 mediates insulin action on apoC-III and triglyceride metabolism. J. Clin. Investig. 2004, 114, 1493–1503. [Google Scholar] [CrossRef]
- Iizuka, K. The transcription factor carbohydrate-response element-binding protein (ChREBP): A possible link between metabolic disease and cancer. Biochim. Biophys. Acta Mol. Basis Dis. 2017, 1863, 474–485. [Google Scholar] [CrossRef]
- Iizuka, K.; Bruick, R.K.; Liang, G.; Horton, J.D.; Uyeda, K. Deficiency of carbohydrate response element-binding protein (ChREBP) reduces lipogenesis as well as glycolysis. Proc. Natl. Acad. Sci. USA 2004, 101, 7281–7286. [Google Scholar] [CrossRef]
- Kawaguchi, T.; Takenoshita, M.; Kabashima, T.; Uyeda, K. Glucose and cAMP regulate the L-type pyruvate kinase gene by phosphorylation/dephosphorylation of the carbohydrate response element binding protein. Proc. Natl. Acad. Sci. USA 2001, 98, 13710–13715. [Google Scholar] [CrossRef] [PubMed]
- Morigny, P.; Houssier, M.; Mairal, A.; Ghilain, C.; Mouisel, E.; Benhamed, F.; Masri, B.; Recazens, E.; Denechaud, P.D.; Tavernier, G.; et al. Interaction between hormone-sensitive lipase and ChREBP in fat cells controls insulin sensitivity. Nat. Metab. 2019, 1, 133–146. [Google Scholar] [CrossRef] [PubMed]
- Dentin, R.; Tomas-Cobos, L.; Foufelle, F.; Leopold, J.; Girard, J.; Postic, C.; Ferre, P. Glucose 6-phosphate, rather than xylulose 5-phosphate, is required for the activation of ChREBP in response to glucose in the liver. J. Hepatol. 2012, 56, 199–209. [Google Scholar] [CrossRef] [PubMed]
- Davies, M.N.; O’Callaghan, B.L.; Towle, H.C. Glucose activates ChREBP by increasing its rate of nuclear entry and relieving repression of its transcriptional activity. J. Biol. Chem. 2008, 283, 24029–24038. [Google Scholar] [CrossRef] [PubMed]
- Kim, M.S.; Krawczyk, S.A.; Doridot, L.; Fowler, A.J.; Wang, J.X.; Trauger, S.A.; Noh, H.L.; Kang, H.J.; Meissen, J.K.; Blatnik, M.; et al. ChREBP regulates fructose-induced glucose production independently of insulin signaling. J. Clin. Investig. 2016, 126, 4372–4386. [Google Scholar] [CrossRef]
- Shimano, H.; Sato, R. SREBP-regulated lipid metabolism: Convergent physiology—Divergent pathophysiology. Nat. Rev. Endocrinol. 2017, 13, 710–730. [Google Scholar] [CrossRef]
- Amemiya-Kudo, M.; Shimano, H.; Hasty, A.H.; Yahagi, N.; Yoshikawa, T.; Matsuzaka, T.; Okazaki, H.; Tamura, Y.; Iizuka, Y.; Ohashi, K.; et al. Transcriptional activities of nuclear SREBP-1a, -1c, and -2 to different target promoters of lipogenic and cholesterogenic genes. J. Lipid Res. 2002, 43, 1220–1235. [Google Scholar] [CrossRef]
- Horton, J.D.; Goldstein, J.L.; Brown, M.S. SREBPs: Activators of the complete program of cholesterol and fatty acid synthesis in the liver. J. Clin. Investig. 2002, 109, 1125–1131. [Google Scholar] [CrossRef]
- Shao, W.; Espenshade, P.J. Sterol regulatory element-binding protein (SREBP) cleavage regulates Golgi-to-endoplasmic reticulum recycling of SREBP cleavage-activating protein (SCAP). J. Biol. Chem. 2014, 289, 7547–7557. [Google Scholar] [CrossRef]
- Shimomura, I.; Bashmakov, Y.; Ikemoto, S.; Horton, J.D.; Brown, M.S.; Goldstein, J.L. Insulin selectively increases SREBP-1c mRNA in the livers of rats with streptozotocin-induced diabetes. Proc. Natl. Acad. Sci. USA 1999, 96, 13656–13661. [Google Scholar] [CrossRef]
- Matsumoto, E.; Ishihara, A.; Tamai, S.; Nemoto, A.; Iwase, K.; Hiwasa, T.; Shibata, S.; Takiguchi, M. Time of day and nutrients in feeding govern daily expression rhythms of the gene for sterol regulatory element-binding protein (SREBP)-1 in the mouse liver. J. Biol. Chem. 2010, 285, 33028–33036. [Google Scholar] [CrossRef]
- Tian, J.; Goldstein, J.L.; Brown, M.S. Insulin induction of SREBP-1c in rodent liver requires LXRalpha-C/EBPbeta complex. Proc. Natl. Acad. Sci. USA 2016, 113, 8182–8187. [Google Scholar] [CrossRef]
- Yang, T.; Espenshade, P.J.; Wright, M.E.; Yabe, D.; Gong, Y.; Aebersold, R.; Goldstein, J.L.; Brown, M.S. Crucial step in cholesterol homeostasis: Sterols promote binding of SCAP to INSIG-1, a membrane protein that facilitates retention of SREBPs in ER. Cell 2002, 110, 489–500. [Google Scholar] [CrossRef] [PubMed]
- Yabe, D.; Komuro, R.; Liang, G.; Goldstein, J.L.; Brown, M.S. Liver-specific mRNA for Insig-2 down-regulated by insulin: Implications for fatty acid synthesis. Proc. Natl. Acad. Sci. USA 2003, 100, 3155–3160. [Google Scholar] [CrossRef] [PubMed]
- Shimano, H.; Horton, J.D.; Shimomura, I.; Hammer, R.E.; Brown, M.S.; Goldstein, J.L. Isoform 1c of sterol regulatory element binding protein is less active than isoform 1a in livers of transgenic mice and in cultured cells. J. Clin. Investig. 1997, 99, 846–854. [Google Scholar] [CrossRef]
- Samuel, V.T.; Shulman, G.I. Mechanisms for insulin resistance: Common threads and missing links. Cell 2012, 148, 852–871. [Google Scholar] [CrossRef] [PubMed]
- Ron, D.; Walter, P. Signal integration in the endoplasmic reticulum unfolded protein response. Nat. Rev. Mol. Cell Biol. 2007, 8, 519–529. [Google Scholar] [CrossRef] [PubMed]
- Schroder, M.; Kaufman, R.J. The mammalian unfolded protein response. Annu. Rev. Biochem. 2005, 74, 739–789. [Google Scholar] [CrossRef] [PubMed]
- Ozcan, U.; Cao, Q.; Yilmaz, E.; Lee, A.H.; Iwakoshi, N.N.; Ozdelen, E.; Tuncman, G.; Gorgun, C.; Glimcher, L.H.; Hotamisligil, G.S. Endoplasmic reticulum stress links obesity, insulin action, and type 2 diabetes. Science 2004, 306, 457–461. [Google Scholar] [CrossRef] [PubMed]
- Gregor, M.F.; Yang, L.; Fabbrini, E.; Mohammed, B.S.; Eagon, J.C.; Hotamisligil, G.S.; Klein, S. Endoplasmic reticulum stress is reduced in tissues of obese subjects after weight loss. Diabetes 2009, 58, 693–700. [Google Scholar] [CrossRef]
- Kammoun, H.L.; Chabanon, H.; Hainault, I.; Luquet, S.; Magnan, C.; Koike, T.; Ferre, P.; Foufelle, F. GRP78 expression inhibits insulin and ER stress-induced SREBP-1c activation and reduces hepatic steatosis in mice. J. Clin. Investig. 2009, 119, 1201–1215. [Google Scholar] [CrossRef] [PubMed]
- Lee, A.H.; Scapa, E.F.; Cohen, D.E.; Glimcher, L.H. Regulation of hepatic lipogenesis by the transcription factor XBP1. Science 2008, 320, 1492–1496. [Google Scholar] [CrossRef] [PubMed]
- Sha, H.; He, Y.; Chen, H.; Wang, C.; Zenno, A.; Shi, H.; Yang, X.; Zhang, X.; Qi, L. The IRE1alpha-XBP1 pathway of the unfolded protein response is required for adipogenesis. Cell Metab. 2009, 9, 556–564. [Google Scholar] [CrossRef]
- Calfon, M.; Zeng, H.; Urano, F.; Till, J.H.; Hubbard, S.R.; Harding, H.P.; Clark, S.G.; Ron, D. IRE1 couples endoplasmic reticulum load to secretory capacity by processing the XBP-1 mRNA. Nature 2002, 415, 92–96. [Google Scholar] [CrossRef] [PubMed]
- Lee, K.; Tirasophon, W.; Shen, X.; Michalak, M.; Prywes, R.; Okada, T.; Yoshida, H.; Mori, K.; Kaufman, R.J. IRE1-mediated unconventional mRNA splicing and S2P-mediated ATF6 cleavage merge to regulate XBP1 in signaling the unfolded protein response. Genes Dev. 2002, 16, 452–466. [Google Scholar] [CrossRef]
- Ning, J.; Hong, T.; Ward, A.; Pi, J.; Liu, Z.; Liu, H.Y.; Cao, W. Constitutive role for IRE1alpha-XBP1 signaling pathway in the insulin-mediated hepatic lipogenic program. Endocrinology 2011, 152, 2247–2255. [Google Scholar] [CrossRef]
- Cao, J.; Peng, J.; An, H.; He, Q.; Boronina, T.; Guo, S.; White, M.F.; Cole, P.A.; He, L. Endotoxemia-mediated activation of acetyltransferase P300 impairs insulin signaling in obesity. Nat. Commun. 2017, 8, 131. [Google Scholar] [CrossRef]
- Peng, J.; He, L. IRS posttranslational modifications in regulating insulin signaling. J. Mol. Endocrinol. 2018, 60, R1–R8. [Google Scholar] [CrossRef] [PubMed]
- Peng, J.; Qin, C.; Ramatchandirin, B.; Pearah, A.; Guo, S.; Hussain, M.; Yu, L.; Wondisford, F.E.; He, L. Activation of the canonical ER stress IRE1-XBP1 pathway by insulin regulates glucose and lipid metabolism. J. Biol. Chem. 2022, 298, 102283. [Google Scholar] [CrossRef] [PubMed]
- Dhiman, V.K.; Bolt, M.J.; White, K.P. Nuclear receptors in cancer—Uncovering new and evolving roles through genomic analysis. Nat. Rev. Genet. 2018, 19, 160–174. [Google Scholar] [CrossRef]
- Rastinejad, F.; Huang, P.; Chandra, V.; Khorasanizadeh, S. Understanding nuclear receptor form and function using structural biology. J. Mol. Endocrinol. 2013, 51, T1–T21. [Google Scholar] [CrossRef]
- Lamichane, S.; Dahal Lamichane, B.; Kwon, S.M. Pivotal Roles of Peroxisome Proliferator-Activated Receptors (PPARs) and Their Signal Cascade for Cellular and Whole-Body Energy Homeostasis. Int. J. Mol. Sci. 2018, 19, 949. [Google Scholar] [CrossRef]
- Berger, J.; Moller, D.E. The mechanisms of action of PPARs. Annu. Rev. Med. 2002, 53, 409–435. [Google Scholar] [CrossRef] [PubMed]
- Liang, C.P.; Tall, A.R. Transcriptional profiling reveals global defects in energy metabolism, lipoprotein, and bile acid synthesis and transport with reversal by leptin treatment in ob/ob mouse liver. J. Biol. Chem. 2001, 276, 49066–49076. [Google Scholar] [CrossRef]
- You, M.; Considine, R.V.; Leone, T.C.; Kelly, D.P.; Crabb, D.W. Role of adiponectin in the protective action of dietary saturated fat against alcoholic fatty liver in mice. Hepatology 2005, 42, 568–577. [Google Scholar] [CrossRef] [PubMed]
- Zhou, Y.C.; Waxman, D.J. Cross-talk between janus kinase-signal transducer and activator of transcription (JAK-STAT) and peroxisome proliferator-activated receptor-alpha (PPARalpha) signaling pathways. Growth hormone inhibition of pparalpha transcriptional activity mediated by stat5b. J. Biol. Chem. 1999, 274, 2672–2681. [Google Scholar] [CrossRef] [PubMed]
- Steineger, H.H.; Sorensen, H.N.; Tugwood, J.D.; Skrede, S.; Spydevold, O.; Gautvik, K.M. Dexamethasone and insulin demonstrate marked and opposite regulation of the steady-state mRNA level of the peroxisomal proliferator-activated receptor (PPAR) in hepatic cells. Hormonal modulation of fatty-acid-induced transcription. Eur. J. Biochem. 1994, 225, 967–974. [Google Scholar] [CrossRef] [PubMed]
- Bishop-Bailey, D. Peroxisome proliferator-activated receptors in the cardiovascular system. Br. J. Pharmacol. 2000, 129, 823–834. [Google Scholar] [CrossRef] [PubMed]
- Pawlak, M.; Lefebvre, P.; Staels, B. Molecular mechanism of PPARalpha action and its impact on lipid metabolism, inflammation and fibrosis in non-alcoholic fatty liver disease. J. Hepatol. 2015, 62, 720–733. [Google Scholar] [CrossRef]
- Rodriguez, J.C.; Gil-Gomez, G.; Hegardt, F.G.; Haro, D. Peroxisome proliferator-activated receptor mediates induction of the mitochondrial 3-hydroxy-3-methylglutaryl-CoA synthase gene by fatty acids. J. Biol. Chem. 1994, 269, 18767–18772. [Google Scholar] [CrossRef] [PubMed]
- Montagner, A.; Polizzi, A.; Fouche, E.; Ducheix, S.; Lippi, Y.; Lasserre, F.; Barquissau, V.; Regnier, M.; Lukowicz, C.; Benhamed, F.; et al. Liver PPARalpha is crucial for whole-body fatty acid homeostasis and is protective against NAFLD. Gut 2016, 65, 1202–1214. [Google Scholar] [CrossRef] [PubMed]
- Kersten, S.; Seydoux, J.; Peters, J.M.; Gonzalez, F.J.; Desvergne, B.; Wahli, W. Peroxisome proliferator-activated receptor alpha mediates the adaptive response to fasting. J. Clin. Investig. 1999, 103, 1489–1498. [Google Scholar] [CrossRef] [PubMed]
- Knight, B.L.; Hebbachi, A.; Hauton, D.; Brown, A.M.; Wiggins, D.; Patel, D.D.; Gibbons, G.F. A role for PPARalpha in the control of SREBP activity and lipid synthesis in the liver. Biochem. J. 2005, 389, 413–421. [Google Scholar] [CrossRef]
- Reilly, S.M.; Lee, C.H. PPAR delta as a therapeutic target in metabolic disease. FEBS Lett. 2008, 582, 26–31. [Google Scholar] [CrossRef]
- Usuda, D.; Kanda, T. Peroxisome proliferator-activated receptors for hypertension. World J. Cardiol. 2014, 6, 744–754. [Google Scholar] [CrossRef]
- Azhar, S. Peroxisome proliferator-activated receptors, metabolic syndrome and cardiovascular disease. Future Cardiol. 2010, 6, 657–691. [Google Scholar] [CrossRef] [PubMed]
- Ahmadian, M.; Suh, J.M.; Hah, N.; Liddle, C.; Atkins, A.R.; Downes, M.; Evans, R.M. PPARgamma signaling and metabolism: The good, the bad and the future. Nat. Med. 2013, 19, 557–566. [Google Scholar] [CrossRef] [PubMed]
- Berger, J.P.; Akiyama, T.E.; Meinke, P.T. PPARs: Therapeutic targets for metabolic disease. Trends Pharmacol. Sci. 2005, 26, 244–251. [Google Scholar] [CrossRef]
- Matsusue, K.; Haluzik, M.; Lambert, G.; Yim, S.H.; Gavrilova, O.; Ward, J.M.; Brewer, B., Jr.; Reitman, M.L.; Gonzalez, F.J. Liver-specific disruption of PPARgamma in leptin-deficient mice improves fatty liver but aggravates diabetic phenotypes. J. Clin. Investig. 2003, 111, 737–747. [Google Scholar] [CrossRef]
- Janowski, B.A.; Grogan, M.J.; Jones, S.A.; Wisely, G.B.; Kliewer, S.A.; Corey, E.J.; Mangelsdorf, D.J. Structural requirements of ligands for the oxysterol liver X receptors LXRalpha and LXRbeta. Proc. Natl. Acad. Sci. USA 1999, 96, 266–271. [Google Scholar] [CrossRef]
- Repa, J.J.; Liang, G.; Ou, J.; Bashmakov, Y.; Lobaccaro, J.M.; Shimomura, I.; Shan, B.; Brown, M.S.; Goldstein, J.L.; Mangelsdorf, D.J. Regulation of mouse sterol regulatory element-binding protein-1c gene (SREBP-1c) by oxysterol receptors, LXRalpha and LXRbeta. Genes Dev. 2000, 14, 2819–2830. [Google Scholar] [CrossRef] [PubMed]
- Pehkonen, P.; Welter-Stahl, L.; Diwo, J.; Ryynanen, J.; Wienecke-Baldacchino, A.; Heikkinen, S.; Treuter, E.; Steffensen, K.R.; Carlberg, C. Genome-wide landscape of liver X receptor chromatin binding and gene regulation in human macrophages. BMC Genom. 2012, 13, 50. [Google Scholar] [CrossRef] [PubMed]
- Yang, C.; McDonald, J.G.; Patel, A.; Zhang, Y.; Umetani, M.; Xu, F.; Westover, E.J.; Covey, D.F.; Mangelsdorf, D.J.; Cohen, J.C.; et al. Sterol intermediates from cholesterol biosynthetic pathway as liver X receptor ligands. J. Biol. Chem. 2006, 281, 27816–27826. [Google Scholar] [CrossRef]
- Jakobsson, T.; Treuter, E.; Gustafsson, J.A.; Steffensen, K.R. Liver X receptor biology and pharmacology: New pathways, challenges and opportunities. Trends Pharmacol. Sci. 2012, 33, 394–404. [Google Scholar] [CrossRef] [PubMed]
- Peet, D.J.; Turley, S.D.; Ma, W.; Janowski, B.A.; Lobaccaro, J.M.; Hammer, R.E.; Mangelsdorf, D.J. Cholesterol and bile acid metabolism are impaired in mice lacking the nuclear oxysterol receptor LXR alpha. Cell 1998, 93, 693–704. [Google Scholar] [CrossRef]
- Yu, L.; York, J.; von Bergmann, K.; Lutjohann, D.; Cohen, J.C.; Hobbs, H.H. Stimulation of cholesterol excretion by the liver X receptor agonist requires ATP-binding cassette transporters G5 and G8. J. Biol. Chem. 2003, 278, 15565–15570. [Google Scholar] [CrossRef]
- Tontonoz, P. Transcriptional and posttranscriptional control of cholesterol homeostasis by liver X receptors. Cold Spring Harb. Symp. Quant. Biol. 2011, 76, 129–137. [Google Scholar] [CrossRef]
- Schultz, J.R.; Tu, H.; Luk, A.; Repa, J.J.; Medina, J.C.; Li, L.; Schwendner, S.; Wang, S.; Thoolen, M.; Mangelsdorf, D.J.; et al. Role of LXRs in control of lipogenesis. Genes Dev. 2000, 14, 2831–2838. [Google Scholar] [CrossRef]
- Cha, J.Y.; Repa, J.J. The liver X receptor (LXR) and hepatic lipogenesis. The carbohydrate-response element-binding protein is a target gene of LXR. J. Biol. Chem. 2007, 282, 743–751. [Google Scholar] [CrossRef]
- Li, C.; Li, Y.; Gai, Z. Bile Acids and Farnesoid X Receptor: Novel Target for the Treatment of Diabetic Cardiomyopathy. Curr. Protein Pept. Sci. 2019, 20, 976–983. [Google Scholar] [CrossRef]
- Inagaki, T.; Choi, M.; Moschetta, A.; Peng, L.; Cummins, C.L.; McDonald, J.G.; Luo, G.; Jones, S.A.; Goodwin, B.; Richardson, J.A.; et al. Fibroblast growth factor 15 functions as an enterohepatic signal to regulate bile acid homeostasis. Cell Metab. 2005, 2, 217–225. [Google Scholar] [CrossRef] [PubMed]
- Hirschfield, G.M.; Mason, A.; Luketic, V.; Lindor, K.; Gordon, S.C.; Mayo, M.; Kowdley, K.V.; Vincent, C.; Bodhenheimer, H.C., Jr.; Pares, A.; et al. Efficacy of obeticholic acid in patients with primary biliary cirrhosis and inadequate response to ursodeoxycholic acid. Gastroenterology 2015, 148, 751–761.e758. [Google Scholar] [CrossRef]
- Xu, J.; Li, Y.; Chen, W.D.; Xu, Y.; Yin, L.; Ge, X.; Jadhav, K.; Adorini, L.; Zhang, Y. Hepatic carboxylesterase 1 is essential for both normal and farnesoid X receptor-controlled lipid homeostasis. Hepatology 2014, 59, 1761–1771. [Google Scholar] [CrossRef] [PubMed]
- Pineda Torra, I.; Claudel, T.; Duval, C.; Kosykh, V.; Fruchart, J.C.; Staels, B. Bile acids induce the expression of the human peroxisome proliferator-activated receptor alpha gene via activation of the farnesoid X receptor. Mol. Endocrinol. 2003, 17, 259–272. [Google Scholar] [CrossRef] [PubMed]
- Sladek, F.M.; Zhong, W.M.; Lai, E.; Darnell, J.E., Jr. Liver-enriched transcription factor HNF-4 is a novel member of the steroid hormone receptor superfamily. Genes Dev. 1990, 4, 2353–2365. [Google Scholar] [CrossRef] [PubMed]
- Chartier, F.L.; Bossu, J.P.; Laudet, V.; Fruchart, J.C.; Laine, B. Cloning and sequencing of cDNAs encoding the human hepatocyte nuclear factor 4 indicate the presence of two isoforms in human liver. Gene 1994, 147, 269–272. [Google Scholar] [CrossRef] [PubMed]
- Hadzopoulou-Cladaras, M.; Kistanova, E.; Evagelopoulou, C.; Zeng, S.; Cladaras, C.; Ladias, J.A. Functional domains of the nuclear receptor hepatocyte nuclear factor 4. J. Biol. Chem. 1997, 272, 539–550. [Google Scholar] [CrossRef]
- Dhe-Paganon, S.; Ottinger, E.A.; Nolte, R.T.; Eck, M.J.; Shoelson, S.E. Crystal structure of the pleckstrin homology-phosphotyrosine binding (PH-PTB) targeting region of insulin receptor substrate 1. Proc. Natl. Acad. Sci. USA 1999, 96, 8378–8383. [Google Scholar] [CrossRef]
- Lu, H. Crosstalk of HNF4alpha with extracellular and intracellular signaling pathways in the regulation of hepatic metabolism of drugs and lipids. Acta Pharm. Sin. B 2016, 6, 393–408. [Google Scholar] [CrossRef]
- Yamagata, K.; Furuta, H.; Oda, N.; Kaisaki, P.J.; Menzel, S.; Cox, N.J.; Fajans, S.S.; Signorini, S.; Stoffel, M.; Bell, G.I. Mutations in the hepatocyte nuclear factor-4alpha gene in maturity-onset diabetes of the young (MODY1). Nature 1996, 384, 458–460. [Google Scholar] [CrossRef]
- Hayhurst, G.P.; Lee, Y.H.; Lambert, G.; Ward, J.M.; Gonzalez, F.J. Hepatocyte nuclear factor 4alpha (nuclear receptor 2A1) is essential for maintenance of hepatic gene expression and lipid homeostasis. Mol. Cell. Biol. 2001, 21, 1393–1403. [Google Scholar] [CrossRef] [PubMed]
- Zhou, W.; Hannoun, Z.; Jaffray, E.; Medine, C.N.; Black, J.R.; Greenhough, S.; Zhu, L.; Ross, J.A.; Forbes, S.; Wilmut, I.; et al. SUMOylation of HNF4alpha regulates protein stability and hepatocyte function. J. Cell Sci. 2012, 125, 3630–3635. [Google Scholar] [CrossRef] [PubMed]
- Veto, B.; Bojcsuk, D.; Bacquet, C.; Kiss, J.; Sipeki, S.; Martin, L.; Buday, L.; Balint, B.L.; Aranyi, T. The transcriptional activity of hepatocyte nuclear factor 4 alpha is inhibited via phosphorylation by ERK1/2. PLoS ONE 2017, 12, e0172020. [Google Scholar] [CrossRef]
- Chereji, R.V.; Morozov, A.V. Functional roles of nucleosome stability and dynamics. Brief Funct. Genom. 2015, 14, 50–60. [Google Scholar] [CrossRef]
- Bannister, A.J.; Kouzarides, T. Regulation of chromatin by histone modifications. Cell Res. 2011, 21, 381–395. [Google Scholar] [CrossRef] [PubMed]
- Sadakierska-Chudy, A.; Filip, M. A comprehensive view of the epigenetic landscape. Part II: Histone post-translational modification, nucleosome level, and chromatin regulation by ncRNAs. Neurotox. Res. 2015, 27, 172–197. [Google Scholar] [CrossRef]
- Miller, J.L.; Grant, P.A. The role of DNA methylation and histone modifications in transcriptional regulation in humans. Subcell. Biochem. 2013, 61, 289–317. [Google Scholar] [CrossRef]
- Kouzarides, T. Chromatin modifications and their function. Cell 2007, 128, 693–705. [Google Scholar] [CrossRef]
- Wapenaar, H.; Dekker, F.J. Histone acetyltransferases: Challenges in targeting bi-substrate enzymes. Clin. Epigenetics 2016, 8, 59. [Google Scholar] [CrossRef]
- Dominy, J.E., Jr.; Lee, Y.; Jedrychowski, M.P.; Chim, H.; Jurczak, M.J.; Camporez, J.P.; Ruan, H.B.; Feldman, J.; Pierce, K.; Mostoslavsky, R.; et al. The deacetylase Sirt6 activates the acetyltransferase GCN5 and suppresses hepatic gluconeogenesis. Mol. Cell 2012, 48, 900–913. [Google Scholar] [CrossRef]
- Tao, Y.; Wu, Q.; Guo, X.; Zhang, Z.; Shen, Y.; Wang, F. MBD5 regulates iron metabolism via methylation-independent genomic targeting of Fth1 through KAT2A in mice. Br. J. Haematol. 2014, 166, 279–291. [Google Scholar] [CrossRef]
- Avvakumov, N.; Cote, J. The MYST family of histone acetyltransferases and their intimate links to cancer. Oncogene 2007, 26, 5395–5407. [Google Scholar] [CrossRef]
- Goodman, R.H.; Smolik, S. CBP/p300 in cell growth, transformation, and development. Genes Dev. 2000, 14, 1553–1577. [Google Scholar] [CrossRef]
- Ogryzko, V.V.; Schiltz, R.L.; Russanova, V.; Howard, B.H.; Nakatani, Y. The transcriptional coactivators p300 and CBP are histone acetyltransferases. Cell 1996, 87, 953–959. [Google Scholar] [CrossRef] [PubMed]
- Partanen, A.; Motoyama, J.; Hui, C.C. Developmentally regulated expression of the transcriptional cofactors/histone acetyltransferases CBP and p300 during mouse embryogenesis. Int. J. Dev. Biol. 1999, 43, 487–494. [Google Scholar]
- Arany, Z.; Sellers, W.R.; Livingston, D.M.; Eckner, R. E1A-associated p300 and CREB-associated CBP belong to a conserved family of coactivators. Cell 1994, 77, 799–800. [Google Scholar] [CrossRef]
- Krebs, E.G. The Albert Lasker Medical Awards. Role of the cyclic AMP-dependent protein kinase in signal transduction. JAMA 1989, 262, 1815–1818. [Google Scholar] [CrossRef]
- Zhou, X.Y.; Shibusawa, N.; Naik, K.; Porras, D.; Temple, K.; Ou, H.; Kaihara, K.; Roe, M.W.; Brady, M.J.; Wondisford, F.E. Insulin regulation of hepatic gluconeogenesis through phosphorylation of CREB-binding protein. Nat. Med. 2004, 10, 633–637. [Google Scholar] [CrossRef]
- Liu, Y.; Dentin, R.; Chen, D.; Hedrick, S.; Ravnskjaer, K.; Schenk, S.; Milne, J.; Meyers, D.J.; Cole, P.; Yates, J., 3rd; et al. A fasting inducible switch modulates gluconeogenesis via activator/coactivator exchange. Nature 2008, 456, 269–273. [Google Scholar] [CrossRef]
- Nakae, J.; Kitamura, T.; Silver, D.L.; Accili, D. The forkhead transcription factor Foxo1 (Fkhr) confers insulin sensitivity onto glucose-6-phosphatase expression. J. Clin. Investig. 2001, 108, 1359–1367. [Google Scholar] [CrossRef]
- Cheng, Z.; Guo, S.; Copps, K.; Dong, X.; Kollipara, R.; Rodgers, J.T.; Depinho, R.A.; Puigserver, P.; White, M.F. Foxo1 integrates insulin signaling with mitochondrial function in the liver. Nat. Med. 2009, 15, 1307–1311. [Google Scholar] [CrossRef]
- Wondisford, A.R.; Xiong, L.; Chang, E.; Meng, S.; Meyers, D.J.; Li, M.; Cole, P.A.; He, L. Control of Foxo1 gene expression by co-activator P300. J. Biol. Chem. 2014, 289, 4326–4333. [Google Scholar] [CrossRef]
- Hems, D.A.; Whitton, P.D.; Taylor, E.A. Glycogen synthesis in the perfused liver of the starved rat. Biochem. J. 1972, 129, 529–538. [Google Scholar] [CrossRef]
- Newgard, C.B.; Moore, S.V.; Foster, D.W.; McGarry, J.D. Efficient hepatic glycogen synthesis in refeeding rats requires continued carbon flow through the gluconeogenic pathway. J. Biol. Chem. 1984, 259, 6958–6963. [Google Scholar] [CrossRef]
- Shulman, G.I.; Rothman, D.L.; Smith, D.; Johnson, C.M.; Blair, J.B.; Shulman, R.G.; DeFronzo, R.A. Mechanism of liver glycogen repletion in vivo by nuclear magnetic resonance spectroscopy. J. Clin. Investig. 1985, 76, 1229–1236. [Google Scholar] [CrossRef]
- Katz, J.; McGarry, J.D. The glucose paradox. Is glucose a substrate for liver metabolism? J. Clin. Investig. 1984, 74, 1901–1909. [Google Scholar] [CrossRef]
- He, L.; Cao, J.; Meng, S.; Ma, A.; Radovick, S.; Wondisford, F.E. Activation of basal gluconeogenesis by coactivator p300 maintains hepatic glycogen storage. Mol. Endocrinol. 2013, 27, 1322–1332. [Google Scholar] [CrossRef]
- Qiang, L.; Banks, A.S.; Accili, D. Uncoupling of acetylation from phosphorylation regulates FoxO1 function independent of its subcellular localization. J. Biol. Chem. 2010, 285, 27396–27401. [Google Scholar] [CrossRef]
- Ponugoti, B.; Kim, D.H.; Xiao, Z.; Smith, Z.; Miao, J.; Zang, M.; Wu, S.Y.; Chiang, C.M.; Veenstra, T.D.; Kemper, J.K. SIRT1 deacetylates and inhibits SREBP-1C activity in regulation of hepatic lipid metabolism. J. Biol. Chem. 2010, 285, 33959–33970. [Google Scholar] [CrossRef]
- Kemper, J.K.; Xiao, Z.; Ponugoti, B.; Miao, J.; Fang, S.; Kanamaluru, D.; Tsang, S.; Wu, S.Y.; Chiang, C.M.; Veenstra, T.D. FXR acetylation is normally dynamically regulated by p300 and SIRT1 but constitutively elevated in metabolic disease states. Cell Metab. 2009, 10, 392–404. [Google Scholar] [CrossRef]
- Conkright, M.D.; Canettieri, G.; Screaton, R.; Guzman, E.; Miraglia, L.; Hogenesch, J.B.; Montminy, M. TORCs: Transducers of regulated CREB activity. Mol. Cell 2003, 12, 413–423. [Google Scholar] [CrossRef] [PubMed]
- Kobayashi, M.; Deguchi, Y.; Nozaki, Y.; Higami, Y. Contribution of PGC-1alpha to Obesity- and Caloric Restriction-Related Physiological Changes in White Adipose Tissue. Int. J. Mol. Sci. 2021, 22, 6025. [Google Scholar] [CrossRef]
- Yoon, J.C.; Puigserver, P.; Chen, G.; Donovan, J.; Wu, Z.; Rhee, J.; Adelmant, G.; Stafford, J.; Kahn, C.R.; Granner, D.K.; et al. Control of hepatic gluconeogenesis through the transcriptional coactivator PGC-1. Nature 2001, 413, 131–138. [Google Scholar] [CrossRef]
- Estall, J.L.; Kahn, M.; Cooper, M.P.; Fisher, F.M.; Wu, M.K.; Laznik, D.; Qu, L.; Cohen, D.E.; Shulman, G.I.; Spiegelman, B.M. Sensitivity of lipid metabolism and insulin signaling to genetic alterations in hepatic peroxisome proliferator-activated receptor-gamma coactivator-1alpha expression. Diabetes 2009, 58, 1499–1508. [Google Scholar] [CrossRef]
- Corona, J.C.; Duchen, M.R. PPARgamma and PGC-1alpha as therapeutic targets in Parkinson’s. Neurochem. Res. 2015, 40, 308–316. [Google Scholar] [CrossRef] [PubMed]
- Puigserver, P.; Rhee, J.; Donovan, J.; Walkey, C.J.; Yoon, J.C.; Oriente, F.; Kitamura, Y.; Altomonte, J.; Dong, H.; Accili, D.; et al. Insulin-regulated hepatic gluconeogenesis through FOXO1-PGC-1alpha interaction. Nature 2003, 423, 550–555. [Google Scholar] [CrossRef] [PubMed]
- Besse-Patin, A.; Jeromson, S.; Levesque-Damphousse, P.; Secco, B.; Laplante, M.; Estall, J.L. PGC1A regulates the IRS1:IRS2 ratio during fasting to influence hepatic metabolism downstream of insulin. Proc. Natl. Acad. Sci. USA 2019, 116, 4285–4290. [Google Scholar] [CrossRef] [PubMed]
- Li, S.; Liu, C.; Li, N.; Hao, T.; Han, T.; Hill, D.E.; Vidal, M.; Lin, J.D. Genome-wide coactivation analysis of PGC-1alpha identifies BAF60a as a regulator of hepatic lipid metabolism. Cell Metab. 2008, 8, 105–117. [Google Scholar] [CrossRef]
- Morris, E.M.; Meers, G.M.; Booth, F.W.; Fritsche, K.L.; Hardin, C.D.; Thyfault, J.P.; Ibdah, J.A. PGC-1alpha overexpression results in increased hepatic fatty acid oxidation with reduced triacylglycerol accumulation and secretion. Am. J. Physiol. Gastrointest. Liver Physiol. 2012, 303, G979–G992. [Google Scholar] [CrossRef]
- Aharoni-Simon, M.; Hann-Obercyger, M.; Pen, S.; Madar, Z.; Tirosh, O. Fatty liver is associated with impaired activity of PPARgamma-coactivator 1alpha (PGC1alpha) and mitochondrial biogenesis in mice. Lab. Investig. 2011, 91, 1018–1028. [Google Scholar] [CrossRef]
- Shapiro, M.J.; Shapiro, V.S. Transcriptional repressors, corepressors and chromatin modifying enzymes in T cell development. Cytokine 2011, 53, 271–281. [Google Scholar] [CrossRef] [PubMed]
- Ahmad, K.F.; Melnick, A.; Lax, S.; Bouchard, D.; Liu, J.; Kiang, C.L.; Mayer, S.; Takahashi, S.; Licht, J.D.; Prive, G.G. Mechanism of SMRT corepressor recruitment by the BCL6 BTB domain. Mol. Cell 2003, 12, 1551–1564. [Google Scholar] [CrossRef]
- Wu, X.; Li, H.; Park, E.J.; Chen, J.D. SMRTE inhibits MEF2C transcriptional activation by targeting HDAC4 and 5 to nuclear domains. J. Biol. Chem. 2001, 276, 24177–24185. [Google Scholar] [CrossRef] [PubMed]
- Jayne, S.; Zwartjes, C.G.; van Schaik, F.M.; Timmers, H.T. Involvement of the SMRT/NCoR-HDAC3 complex in transcriptional repression by the CNOT2 subunit of the human Ccr4-Not complex. Biochem. J. 2006, 398, 461–467. [Google Scholar] [CrossRef] [PubMed]
- Mottis, A.; Mouchiroud, L.; Auwerx, J. Emerging roles of the corepressors NCoR1 and SMRT in homeostasis. Genes Dev. 2013, 27, 819–835. [Google Scholar] [CrossRef]
- Ye, J. Improving insulin sensitivity with HDAC inhibitor. Diabetes 2013, 62, 685–687. [Google Scholar] [CrossRef]
- Laplante, M.; Sabatini, D.M. mTORC1 activates SREBP-1c and uncouples lipogenesis from gluconeogenesis. Proc. Natl. Acad. Sci. USA 2010, 107, 3281–3282. [Google Scholar] [CrossRef]
- Wu, C.; Kang, J.E.; Peng, L.J.; Li, H.; Khan, S.A.; Hillard, C.J.; Okar, D.A.; Lange, A.J. Enhancing hepatic glycolysis reduces obesity: Differential effects on lipogenesis depend on site of glycolytic modulation. Cell Metab. 2005, 2, 131–140. [Google Scholar] [CrossRef]
- Lund, A.; Bagger, J.I.; Christensen, M.; Knop, F.K.; Vilsboll, T. Glucagon and type 2 diabetes: The return of the alpha cell. Curr. Diabetes Rep. 2014, 14, 555. [Google Scholar] [CrossRef]
- Ahren, B. Beta- and alpha-cell dysfunction in subjects developing impaired glucose tolerance: Outcome of a 12-year prospective study in postmenopausal Caucasian women. Diabetes 2009, 58, 726–731. [Google Scholar] [CrossRef]
- Unger, R.H. Glucagon physiology and pathophysiology in the light of new advances. Diabetologia 1985, 28, 574–578. [Google Scholar] [CrossRef]
- Unger, R.H.; Aguilar-Parada, E.; Muller, W.A.; Eisentraut, A.M. Studies of pancreatic alpha cell function in normal and diabetic subjects. J. Clin. Investig. 1970, 49, 837–848. [Google Scholar] [CrossRef]
- Ros, S.; Zafra, D.; Valles-Ortega, J.; Garcia-Rocha, M.; Forrow, S.; Dominguez, J.; Calbo, J.; Guinovart, J.J. Hepatic overexpression of a constitutively active form of liver glycogen synthase improves glucose homeostasis. J. Biol. Chem. 2010, 285, 37170–37177. [Google Scholar] [CrossRef]
- Kida, Y.; Esposito-Del Puente, A.; Bogardus, C.; Mott, D.M. Insulin resistance is associated with reduced fasting and insulin-stimulated glycogen synthase phosphatase activity in human skeletal muscle. J. Clin. Investig. 1990, 85, 476–481. [Google Scholar] [CrossRef] [PubMed]
- Bock, G.; Chittilapilly, E.; Basu, R.; Toffolo, G.; Cobelli, C.; Chandramouli, V.; Landau, B.R.; Rizza, R.A. Contribution of hepatic and extrahepatic insulin resistance to the pathogenesis of impaired fasting glucose: Role of increased rates of gluconeogenesis. Diabetes 2007, 56, 1703–1711. [Google Scholar] [CrossRef] [PubMed]
- Basu, R.; Chandramouli, V.; Dicke, B.; Landau, B.; Rizza, R. Obesity and type 2 diabetes impair insulin-induced suppression of glycogenolysis as well as gluconeogenesis. Diabetes 2005, 54, 1942–1948. [Google Scholar] [CrossRef]
- De Fronzo, R.A.; Jacot, E.; Jequier, E.; Maeder, E.; Wahren, J.; Felber, J.P. The effect of insulin on the disposal of intravenous glucose. Results from indirect calorimetry and hepatic and femoral venous catheterization. Diabetes 1981, 30, 1000–1007. [Google Scholar] [CrossRef]
- Ferrannini, E.; Simonson, D.C.; Katz, L.D.; Reichard, G., Jr.; Bevilacqua, S.; Barrett, E.J.; Olsson, M.; DeFronzo, R.A. The disposal of an oral glucose load in patients with non-insulin-dependent diabetes. Metabolism 1988, 37, 79–85. [Google Scholar] [CrossRef]
- Kelley, D.; Mitrakou, A.; Marsh, H.; Schwenk, F.; Benn, J.; Sonnenberg, G.; Arcangeli, M.; Aoki, T.; Sorensen, J.; Berger, M.; et al. Skeletal muscle glycolysis, oxidation, and storage of an oral glucose load. J. Clin. Investig. 1988, 81, 1563–1571. [Google Scholar] [CrossRef] [PubMed]
- Xu, H.; Wang, Y.; Kwon, H.; Shah, A.; Kalemba, K.; Su, X.; He, L.; Wondisford, F.E. Glucagon Changes Substrate Preference in Gluconeogenesis. J. Biol. Chem. 2022, 298, 102708. [Google Scholar] [CrossRef]
- Ley, R.E.; Backhed, F.; Turnbaugh, P.; Lozupone, C.A.; Knight, R.D.; Gordon, J.I. Obesity alters gut microbial ecology. Proc. Natl. Acad. Sci. USA 2005, 102, 11070–11075. [Google Scholar] [CrossRef]
- Tai, N.; Wong, F.S.; Wen, L. The role of gut microbiota in the development of type 1, type 2 diabetes mellitus and obesity. Rev. Endocr. Metab. Disord. 2015, 16, 55–65. [Google Scholar] [CrossRef]
- Cani, P.D.; Bibiloni, R.; Knauf, C.; Waget, A.; Neyrinck, A.M.; Delzenne, N.M.; Burcelin, R. Changes in gut microbiota control metabolic endotoxemia-induced inflammation in high-fat diet-induced obesity and diabetes in mice. Diabetes 2008, 57, 1470–1481. [Google Scholar] [CrossRef]
- Ader, M.; Ni, T.C.; Bergman, R.N. Glucose effectiveness assessed under dynamic and steady state conditions. Comparability of uptake versus production components. J. Clin. Investig. 1997, 99, 1187–1199. [Google Scholar] [CrossRef]
- Del Prato, S.; Riccio, A.; Vigili de Kreutzenberg, S.; Dorella, M.; Tiengo, A.; DeFronzo, R.A. Basal plasma insulin levels exert a qualitative but not quantitative effect on glucose-mediated glucose uptake. Am. J. Physiol. 1995, 268, E1089–E1095. [Google Scholar] [CrossRef]
- Galicia-Garcia, U.; Benito-Vicente, A.; Jebari, S.; Larrea-Sebal, A.; Siddiqi, H.; Uribe, K.B.; Ostolaza, H.; Martin, C. Pathophysiology of Type 2 Diabetes Mellitus. Int. J. Mol. Sci. 2020, 21, 6275. [Google Scholar] [CrossRef]
- Rhee, E.J.; Lee, W.Y.; Cho, Y.K.; Kim, B.I.; Sung, K.C. Hyperinsulinemia and the development of nonalcoholic Fatty liver disease in nondiabetic adults. Am. J. Med. 2011, 124, 69–76. [Google Scholar] [CrossRef]
- Eriksson, J.W.; Smith, U.; Waagstein, F.; Wysocki, M.; Jansson, P.A. Glucose turnover and adipose tissue lipolysis are insulin-resistant in healthy relatives of type 2 diabetes patients: Is cellular insulin resistance a secondary phenomenon? Diabetes 1999, 48, 1572–1578. [Google Scholar] [CrossRef]
- Rotman, Y.; Sanyal, A.J. Current and upcoming pharmacotherapy for non-alcoholic fatty liver disease. Gut 2017, 66, 180–190. [Google Scholar] [CrossRef]
- Oh, H.; Jun, D.W.; Saeed, W.K.; Nguyen, M.H. Non-alcoholic fatty liver diseases: Update on the challenge of diagnosis and treatment. Clin. Mol. Hepatol. 2016, 22, 327–335. [Google Scholar] [CrossRef]
- Stefan, N.; Haring, H.U. The metabolically benign and malignant fatty liver. Diabetes 2011, 60, 2011–2017. [Google Scholar] [CrossRef]
- Lonardo, A.; Bellentani, S.; Ratziu, V.; Loria, P. Insulin resistance in nonalcoholic steatohepatitis: Necessary but not sufficient—Death of a dogma from analysis of therapeutic studies? Expert Rev. Gastroenterol. Hepatol. 2011, 5, 279–289. [Google Scholar] [CrossRef]
- Dif, N.; Euthine, V.; Gonnet, E.; Laville, M.; Vidal, H.; Lefai, E. Insulin activates human sterol-regulatory-element-binding protein-1c (SREBP-1c) promoter through SRE motifs. Biochem. J. 2006, 400, 179–188. [Google Scholar] [CrossRef]
- Bricambert, J.; Miranda, J.; Benhamed, F.; Girard, J.; Postic, C.; Dentin, R. Salt-inducible kinase 2 links transcriptional coactivator p300 phosphorylation to the prevention of ChREBP-dependent hepatic steatosis in mice. J. Clin. Investig. 2010, 120, 4316–4331. [Google Scholar] [CrossRef] [PubMed]
- Felig, P.; Owen, O.E.; Morgan, A.P.; Cahill, G.F., Jr. Utilization of metabolic fuels in obese subjects. Am. J. Clin. Nutr. 1968, 21, 1429–1433. [Google Scholar] [CrossRef]
- Marshall, S.; Bacote, V.; Traxinger, R.R. Discovery of a metabolic pathway mediating glucose-induced desensitization of the glucose transport system. Role of hexosamine biosynthesis in the induction of insulin resistance. J. Biol. Chem. 1991, 266, 4706–4712. [Google Scholar] [CrossRef]
- Degenhardt, T.P.; Thorpe, S.R.; Baynes, J.W. Chemical modification of proteins by methylglyoxal. Cell. Mol. Biol. 1998, 44, 1139–1145. [Google Scholar] [PubMed]
- Baynes, J.W.; Thorpe, S.R. Role of oxidative stress in diabetic complications: A new perspective on an old paradigm. Diabetes 1999, 48, 1–9. [Google Scholar] [CrossRef]
- Huebschmann, A.G.; Regensteiner, J.G.; Vlassara, H.; Reusch, J.E. Diabetes and advanced glycoxidation end products. Diabetes Care 2006, 29, 1420–1432. [Google Scholar] [CrossRef]
- Mukherjee, D. Peripheral and cerebrovascular atherosclerotic disease in diabetes mellitus. Best Pract. Res. Clin. Endocrinol. Metab. 2009, 23, 335–345. [Google Scholar] [CrossRef]
- Younossi, Z.M.; Koenig, A.B.; Abdelatif, D.; Fazel, Y.; Henry, L.; Wymer, M. Global epidemiology of nonalcoholic fatty liver disease-Meta-analytic assessment of prevalence, incidence, and outcomes. Hepatology 2016, 64, 73–84. [Google Scholar] [CrossRef] [PubMed]
- Li, Z.; Xue, J.; Chen, P.; Chen, L.; Yan, S.; Liu, L. Prevalence of nonalcoholic fatty liver disease in mainland of China: A meta-analysis of published studies. J. Gastroenterol. Hepatol. 2014, 29, 42–51. [Google Scholar] [CrossRef] [PubMed]
- Portillo Sanchez, P.; Bril, F.; Maximos, M.; Lomonaco, R.; Biernacki, D.; Orsak, B.; Subbarayan, S.; Webb, A.; Hecht, J.; Cusi, K. High Prevalence of Nonalcoholic Fatty Liver Disease in Patients with Type 2 Diabetes Mellitus and Normal Plasma Aminotransferase Levels. J. Clin. Endocrinol. Metab. 2014, 100, 2138. [Google Scholar] [CrossRef] [PubMed]
- Kasturiratne, A.; Weerasinghe, S.; Dassanayake, A.S.; Rajindrajith, S.; de Silva, A.P.; Kato, N.; Wickremasinghe, A.R.; de Silva, H.J. Influence of non-alcoholic fatty liver disease on the development of diabetes mellitus. J. Gastroenterol. Hepatol. 2013, 28, 142–147. [Google Scholar] [CrossRef]
- McGarry, J.D. What if Minkowski had been ageusic? An alternative angle on diabetes. Science 1992, 258, 766–770. [Google Scholar] [CrossRef]
- Moore, D.D. Nuclear receptors reverse McGarry’s vicious cycle to insulin resistance. Cell Metab. 2012, 15, 615–622. [Google Scholar] [CrossRef]
- Chavez, J.A.; Summers, S.A. A ceramide-centric view of insulin resistance. Cell Metab. 2012, 15, 585–594. [Google Scholar] [CrossRef]
- Bird, S.R.; Hawley, J.A. Update on the effects of physical activity on insulin sensitivity in humans. BMJ Open Sport Exerc. Med. 2016, 2, e000143. [Google Scholar] [CrossRef]


Disclaimer/Publisher’s Note: The statements, opinions and data contained in all publications are solely those of the individual author(s) and contributor(s) and not of MDPI and/or the editor(s). MDPI and/or the editor(s) disclaim responsibility for any injury to people or property resulting from any ideas, methods, instructions or products referred to in the content. |
© 2023 by the authors. Licensee MDPI, Basel, Switzerland. This article is an open access article distributed under the terms and conditions of the Creative Commons Attribution (CC BY) license (https://creativecommons.org/licenses/by/4.0/).