
Monitoring Methodology for an AI Tool for Breast Cancer Screening Deployed in Clinical Centers


Abstract
1. Introduction
2. Materials and Methods
2.1. AI System
2.2. Data
2.3. Statistical Analysis
3. Results
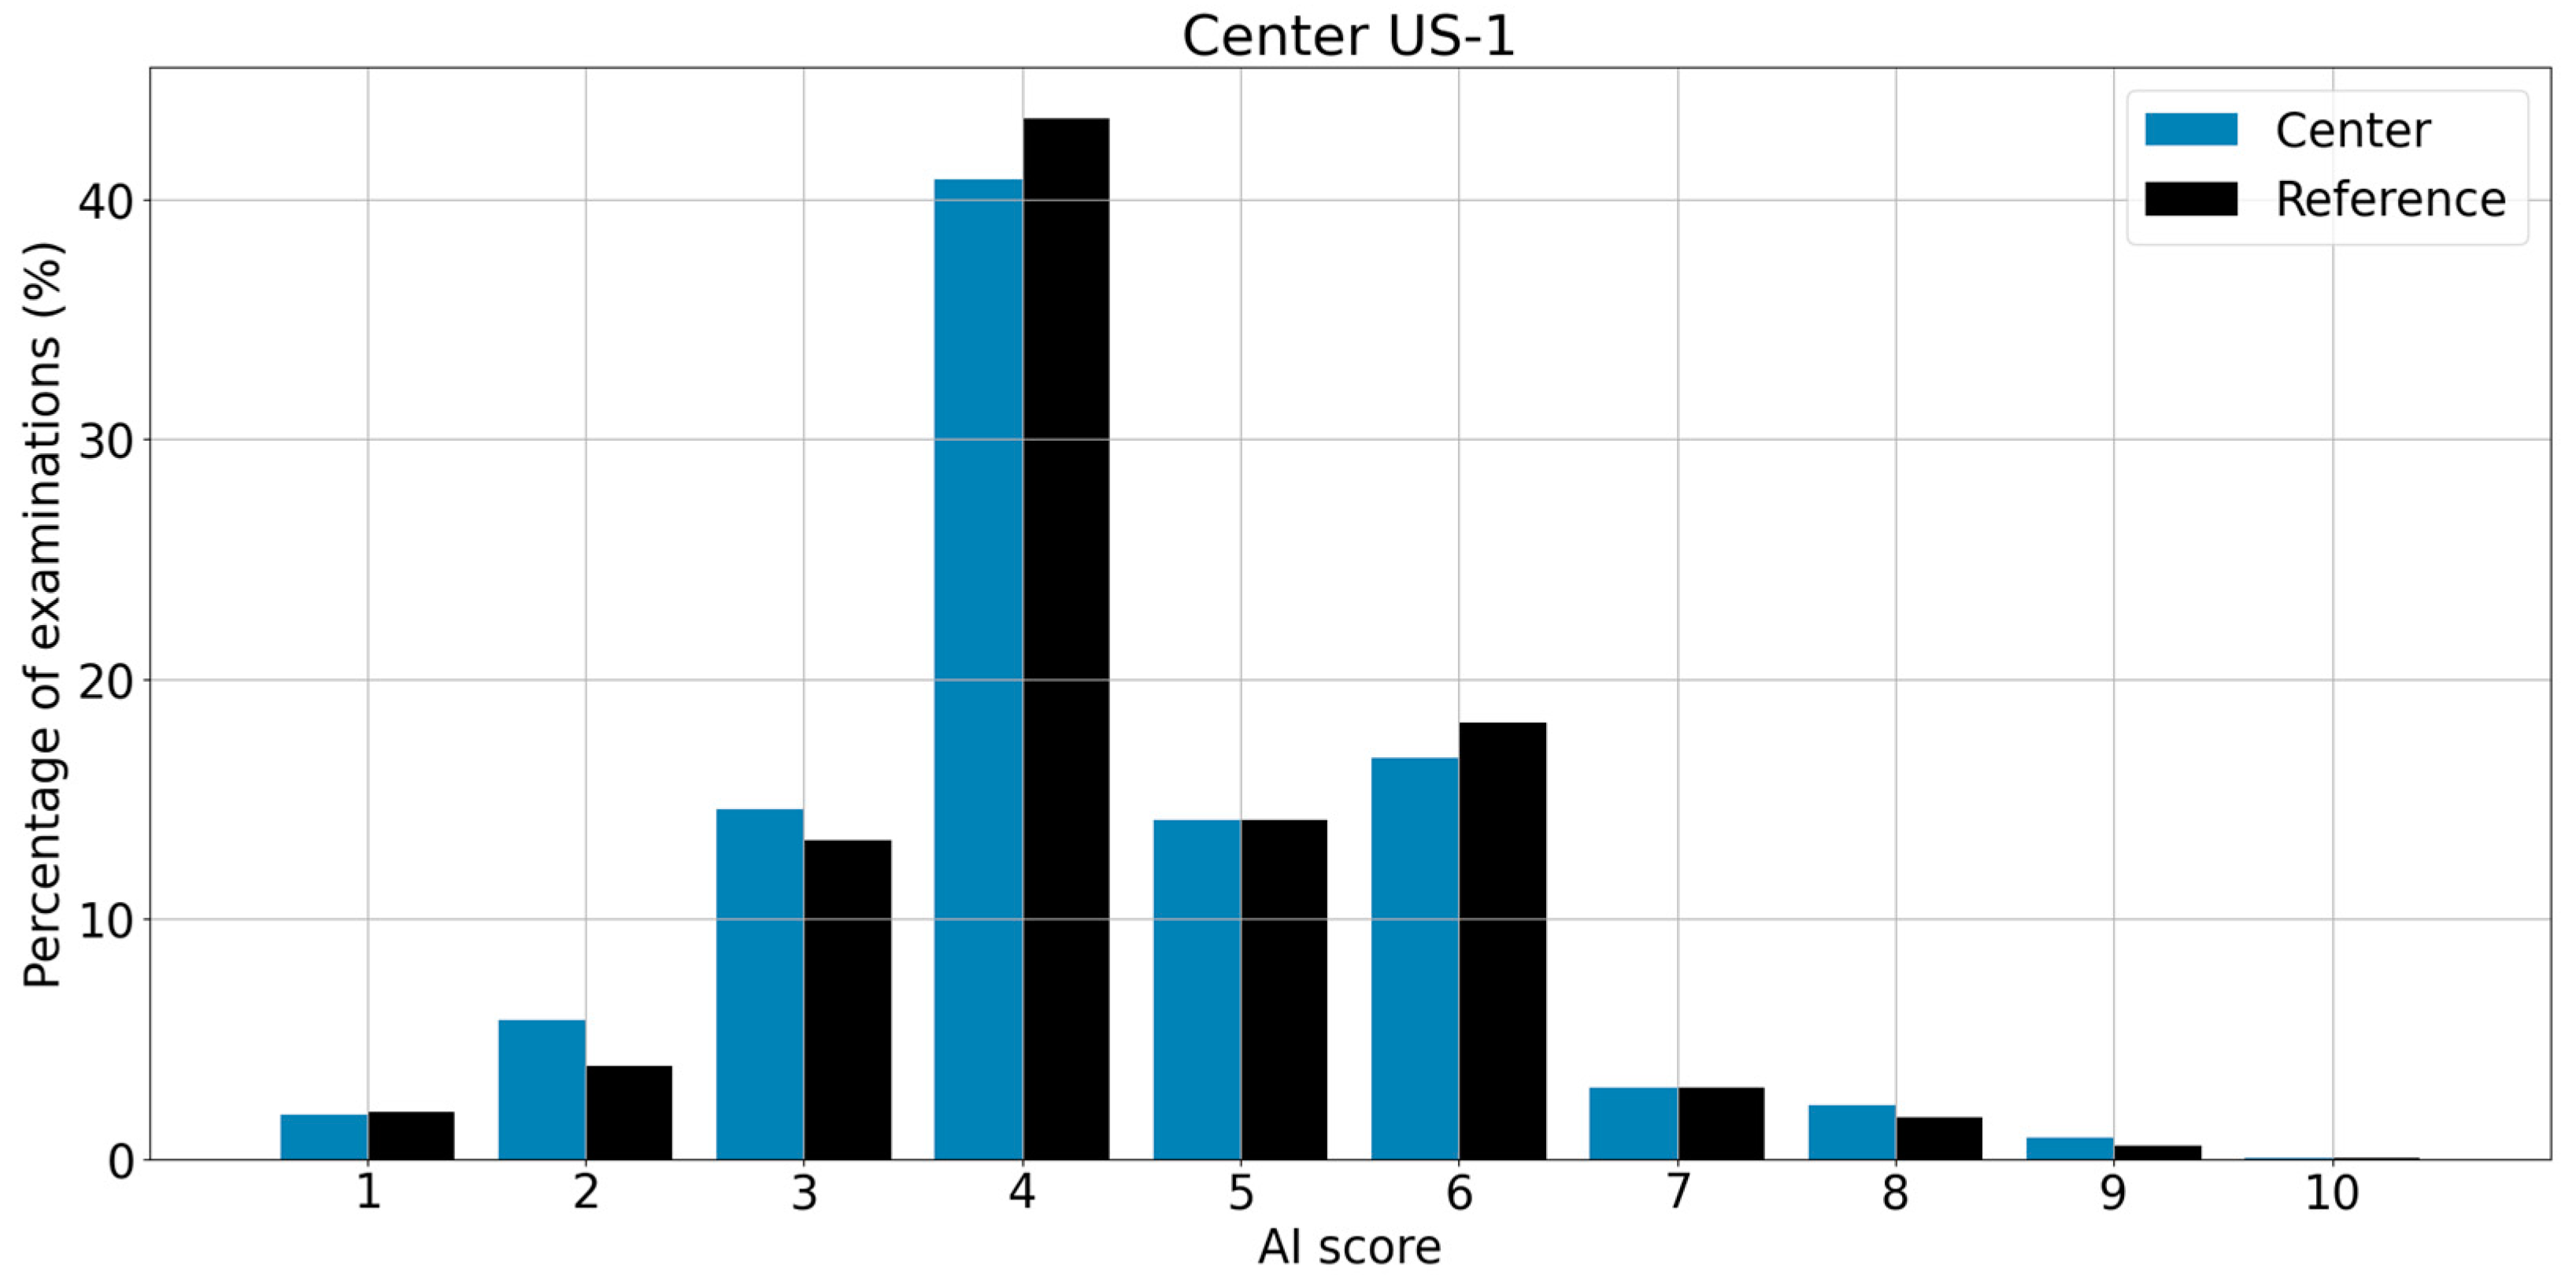
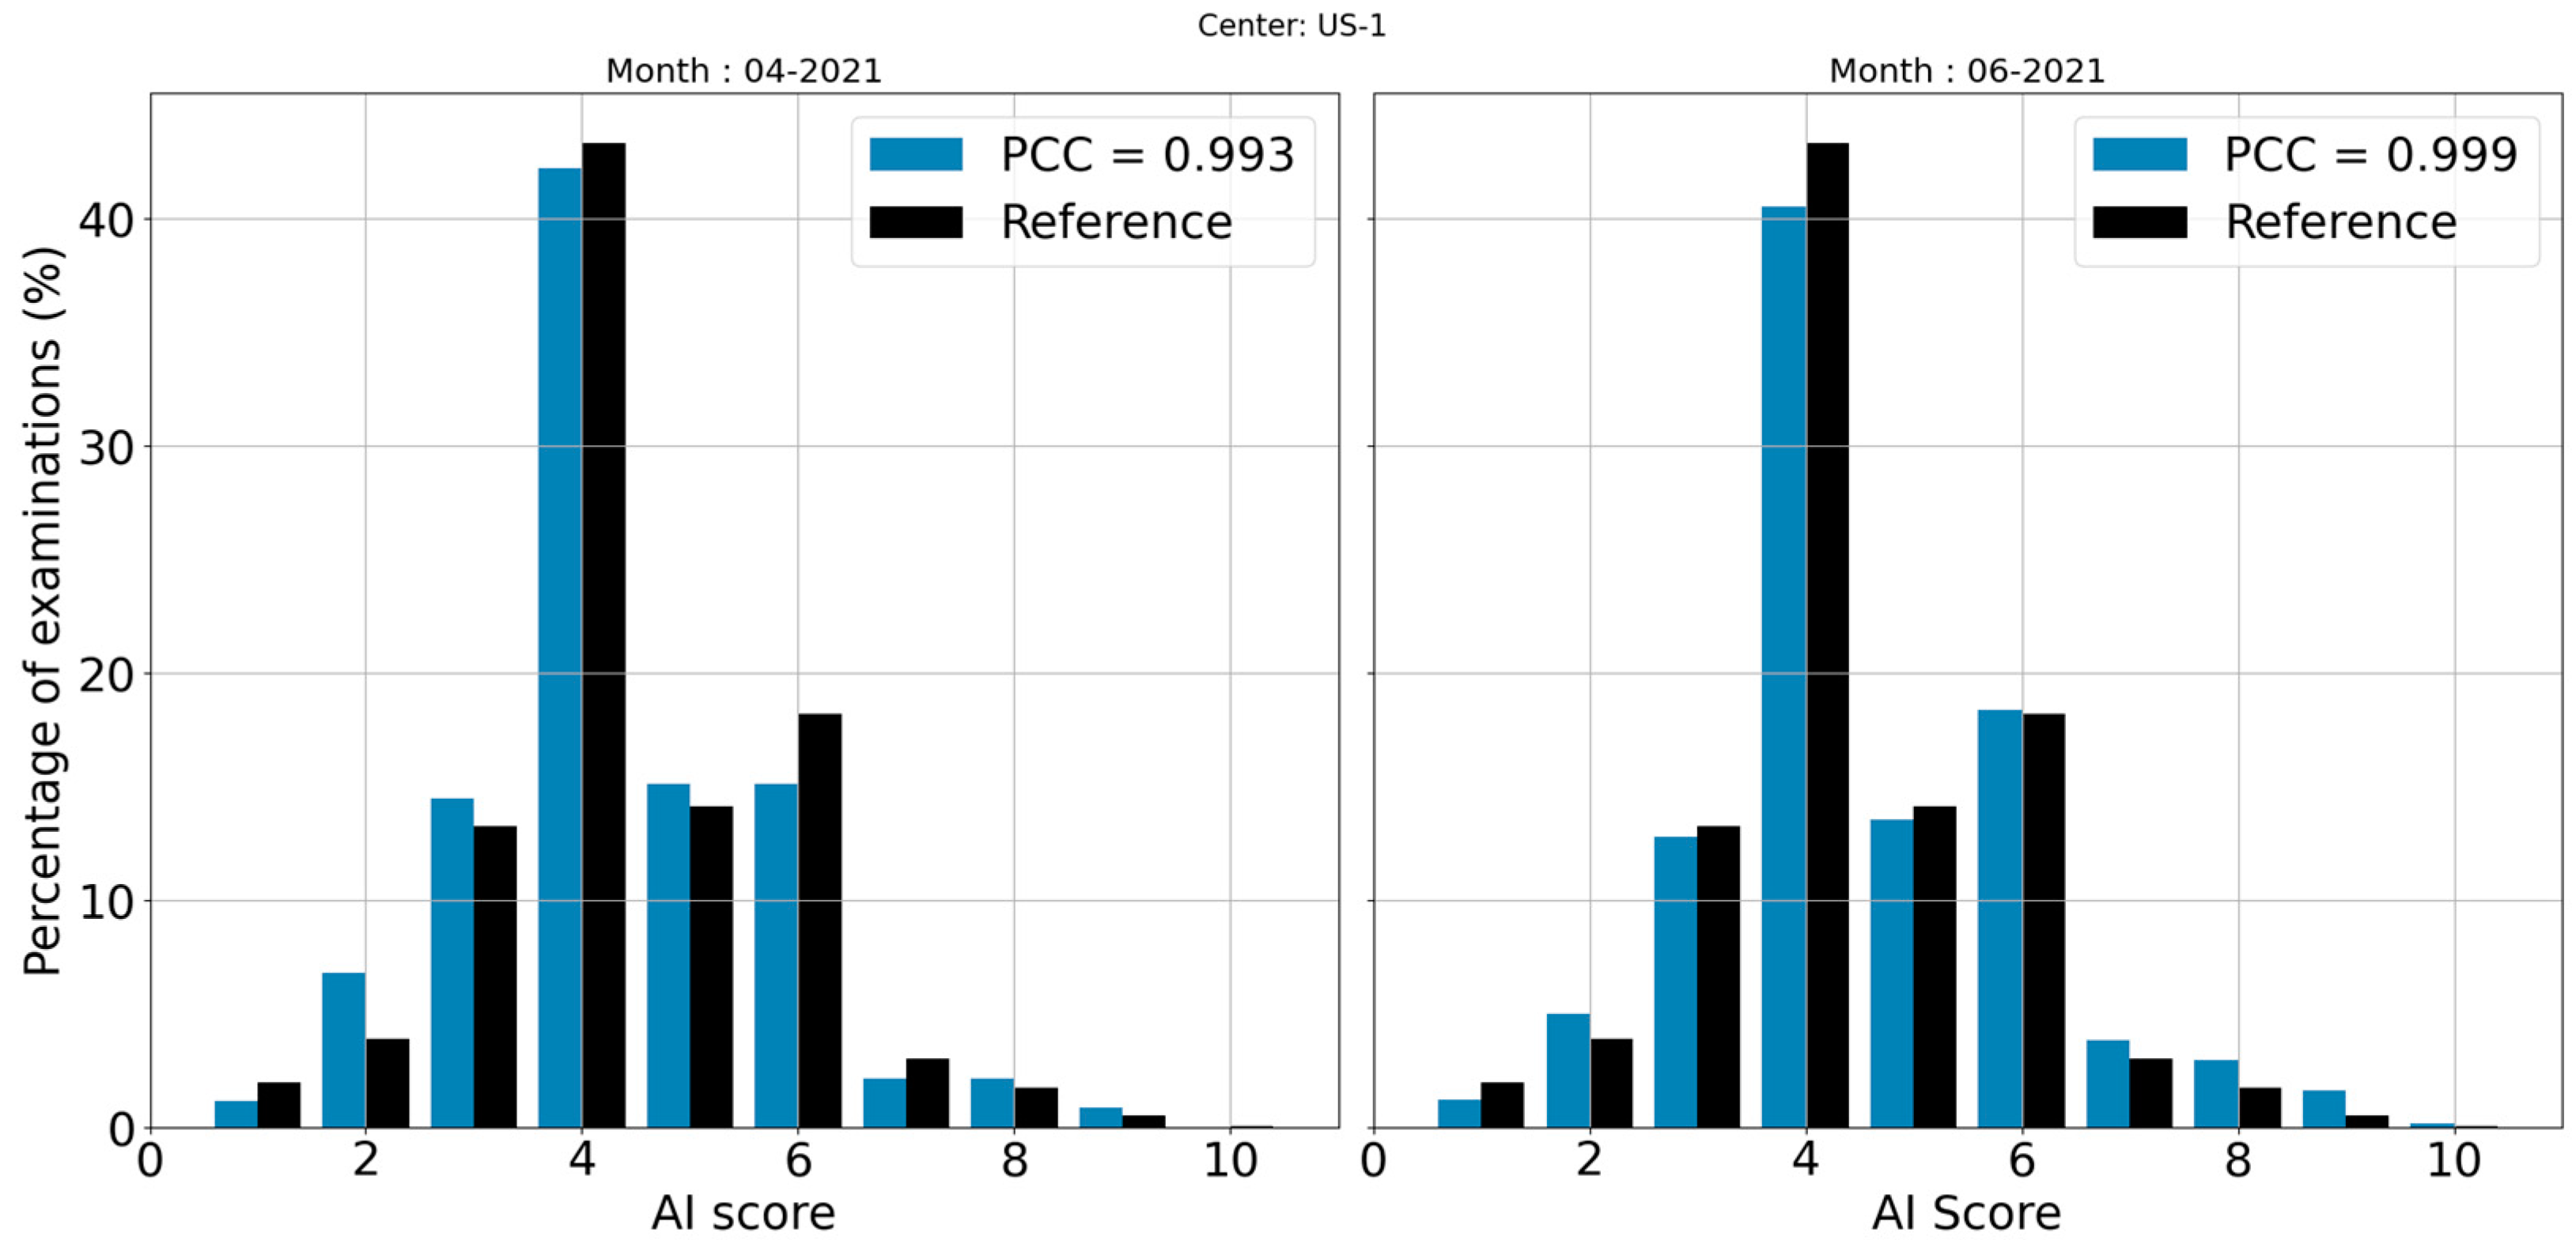
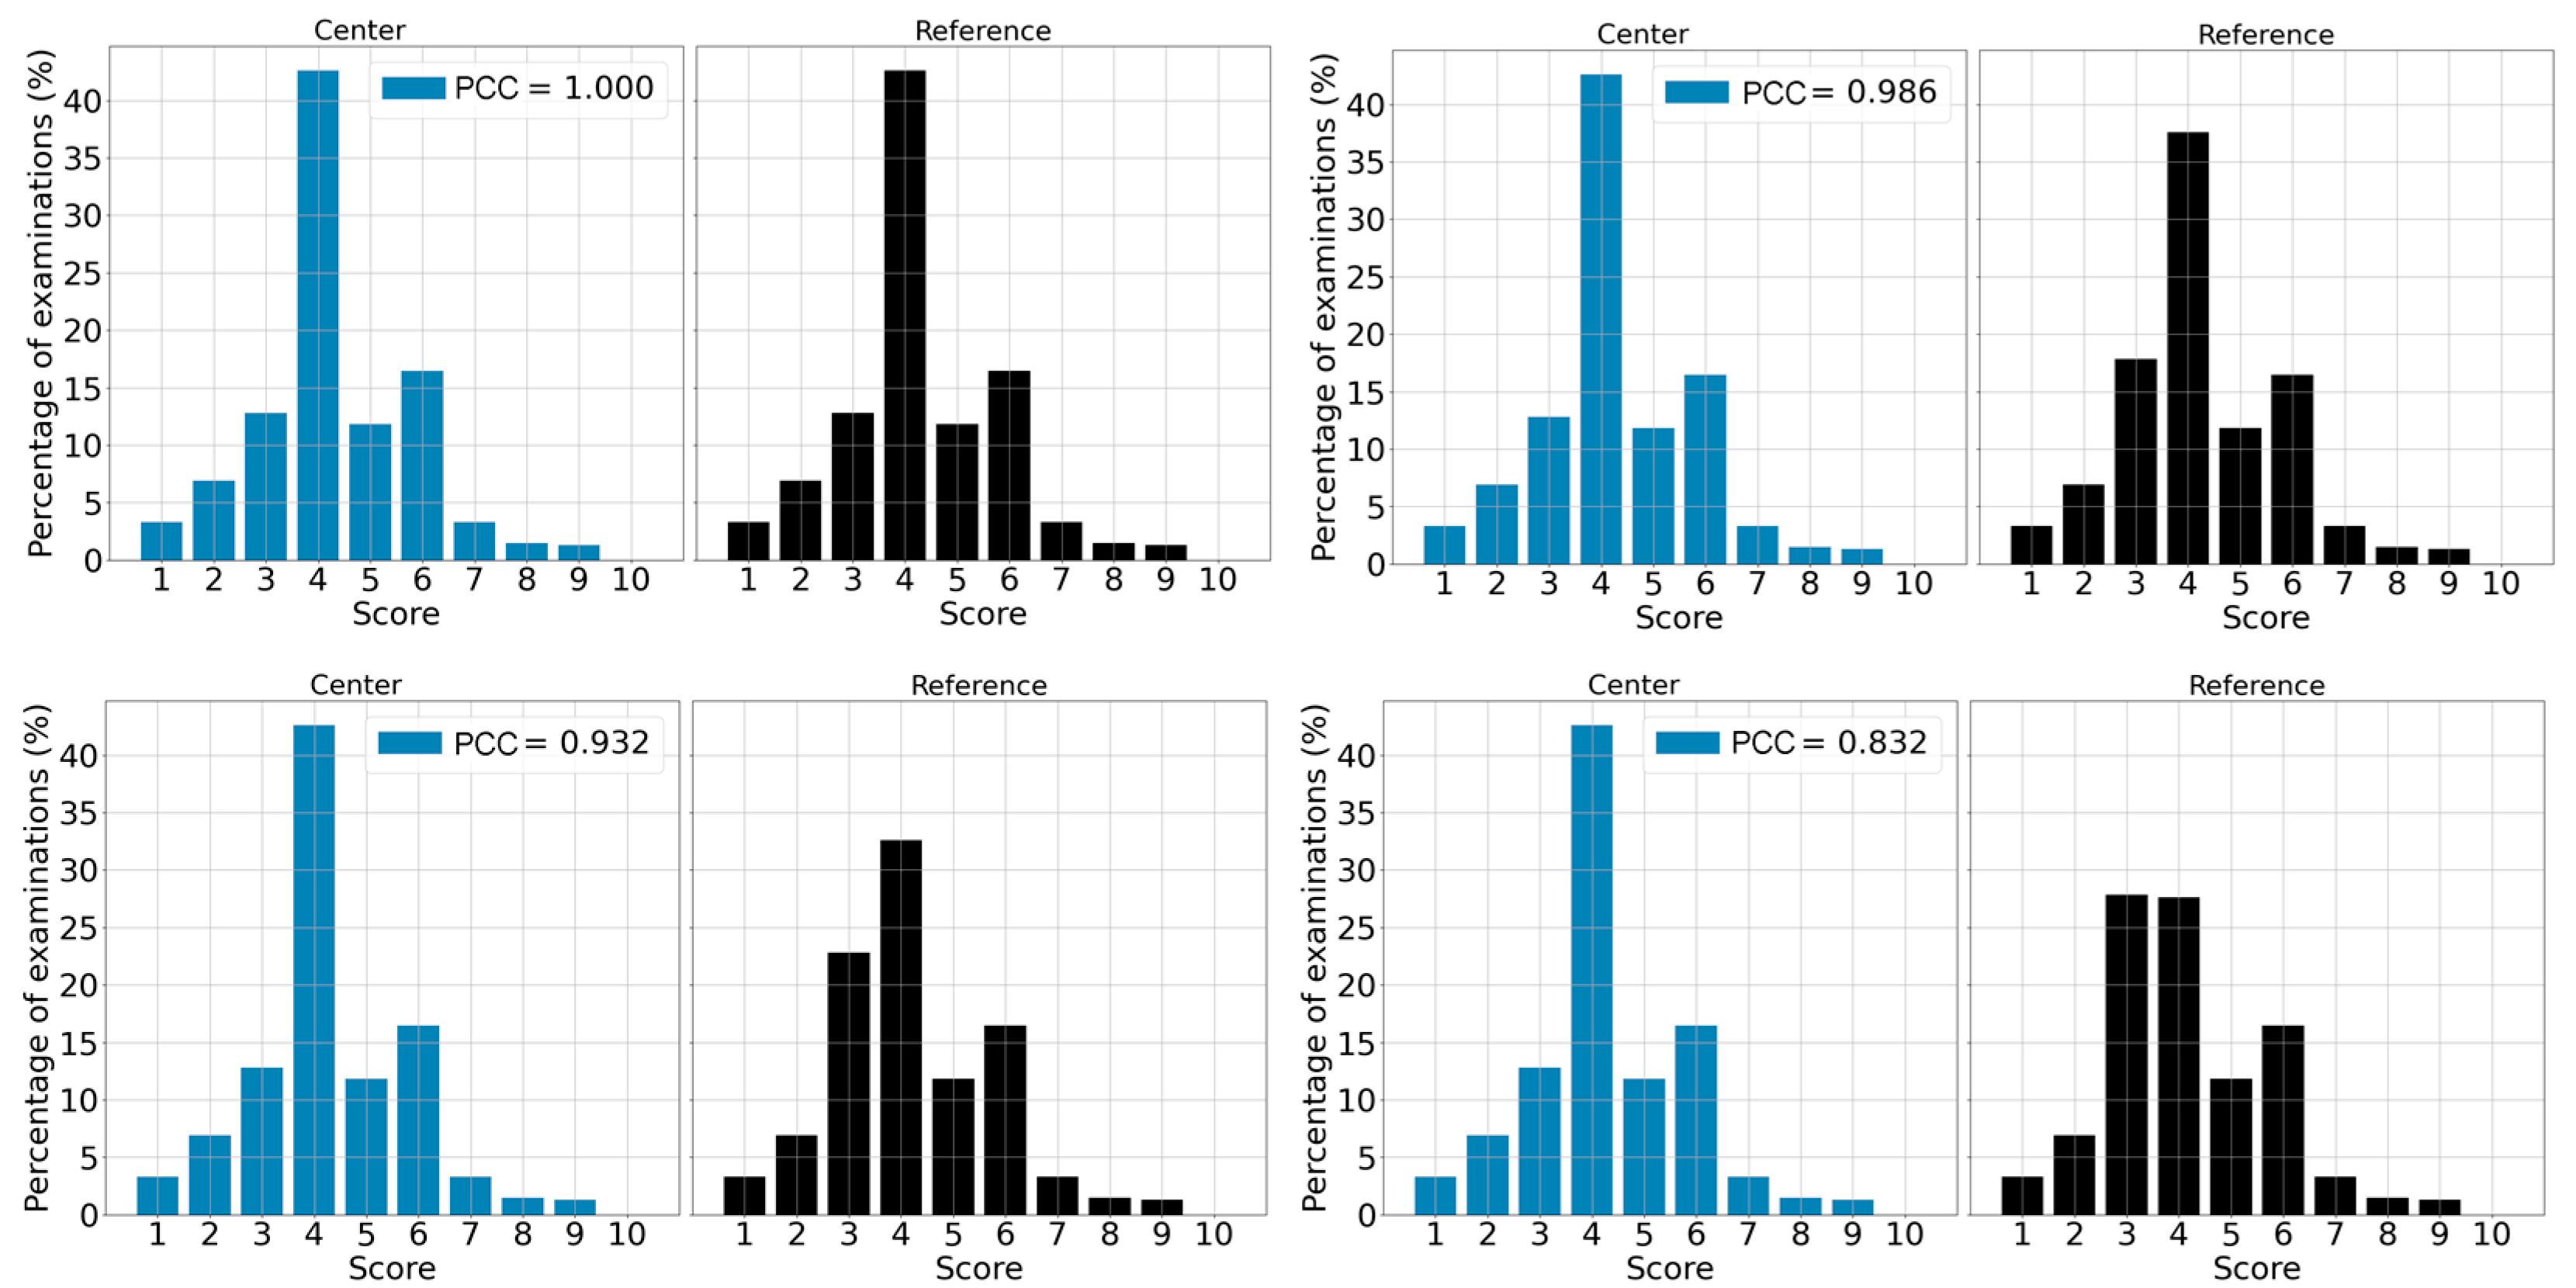
3.1. Correlation between Reference and Center
3.2. χ2 Test
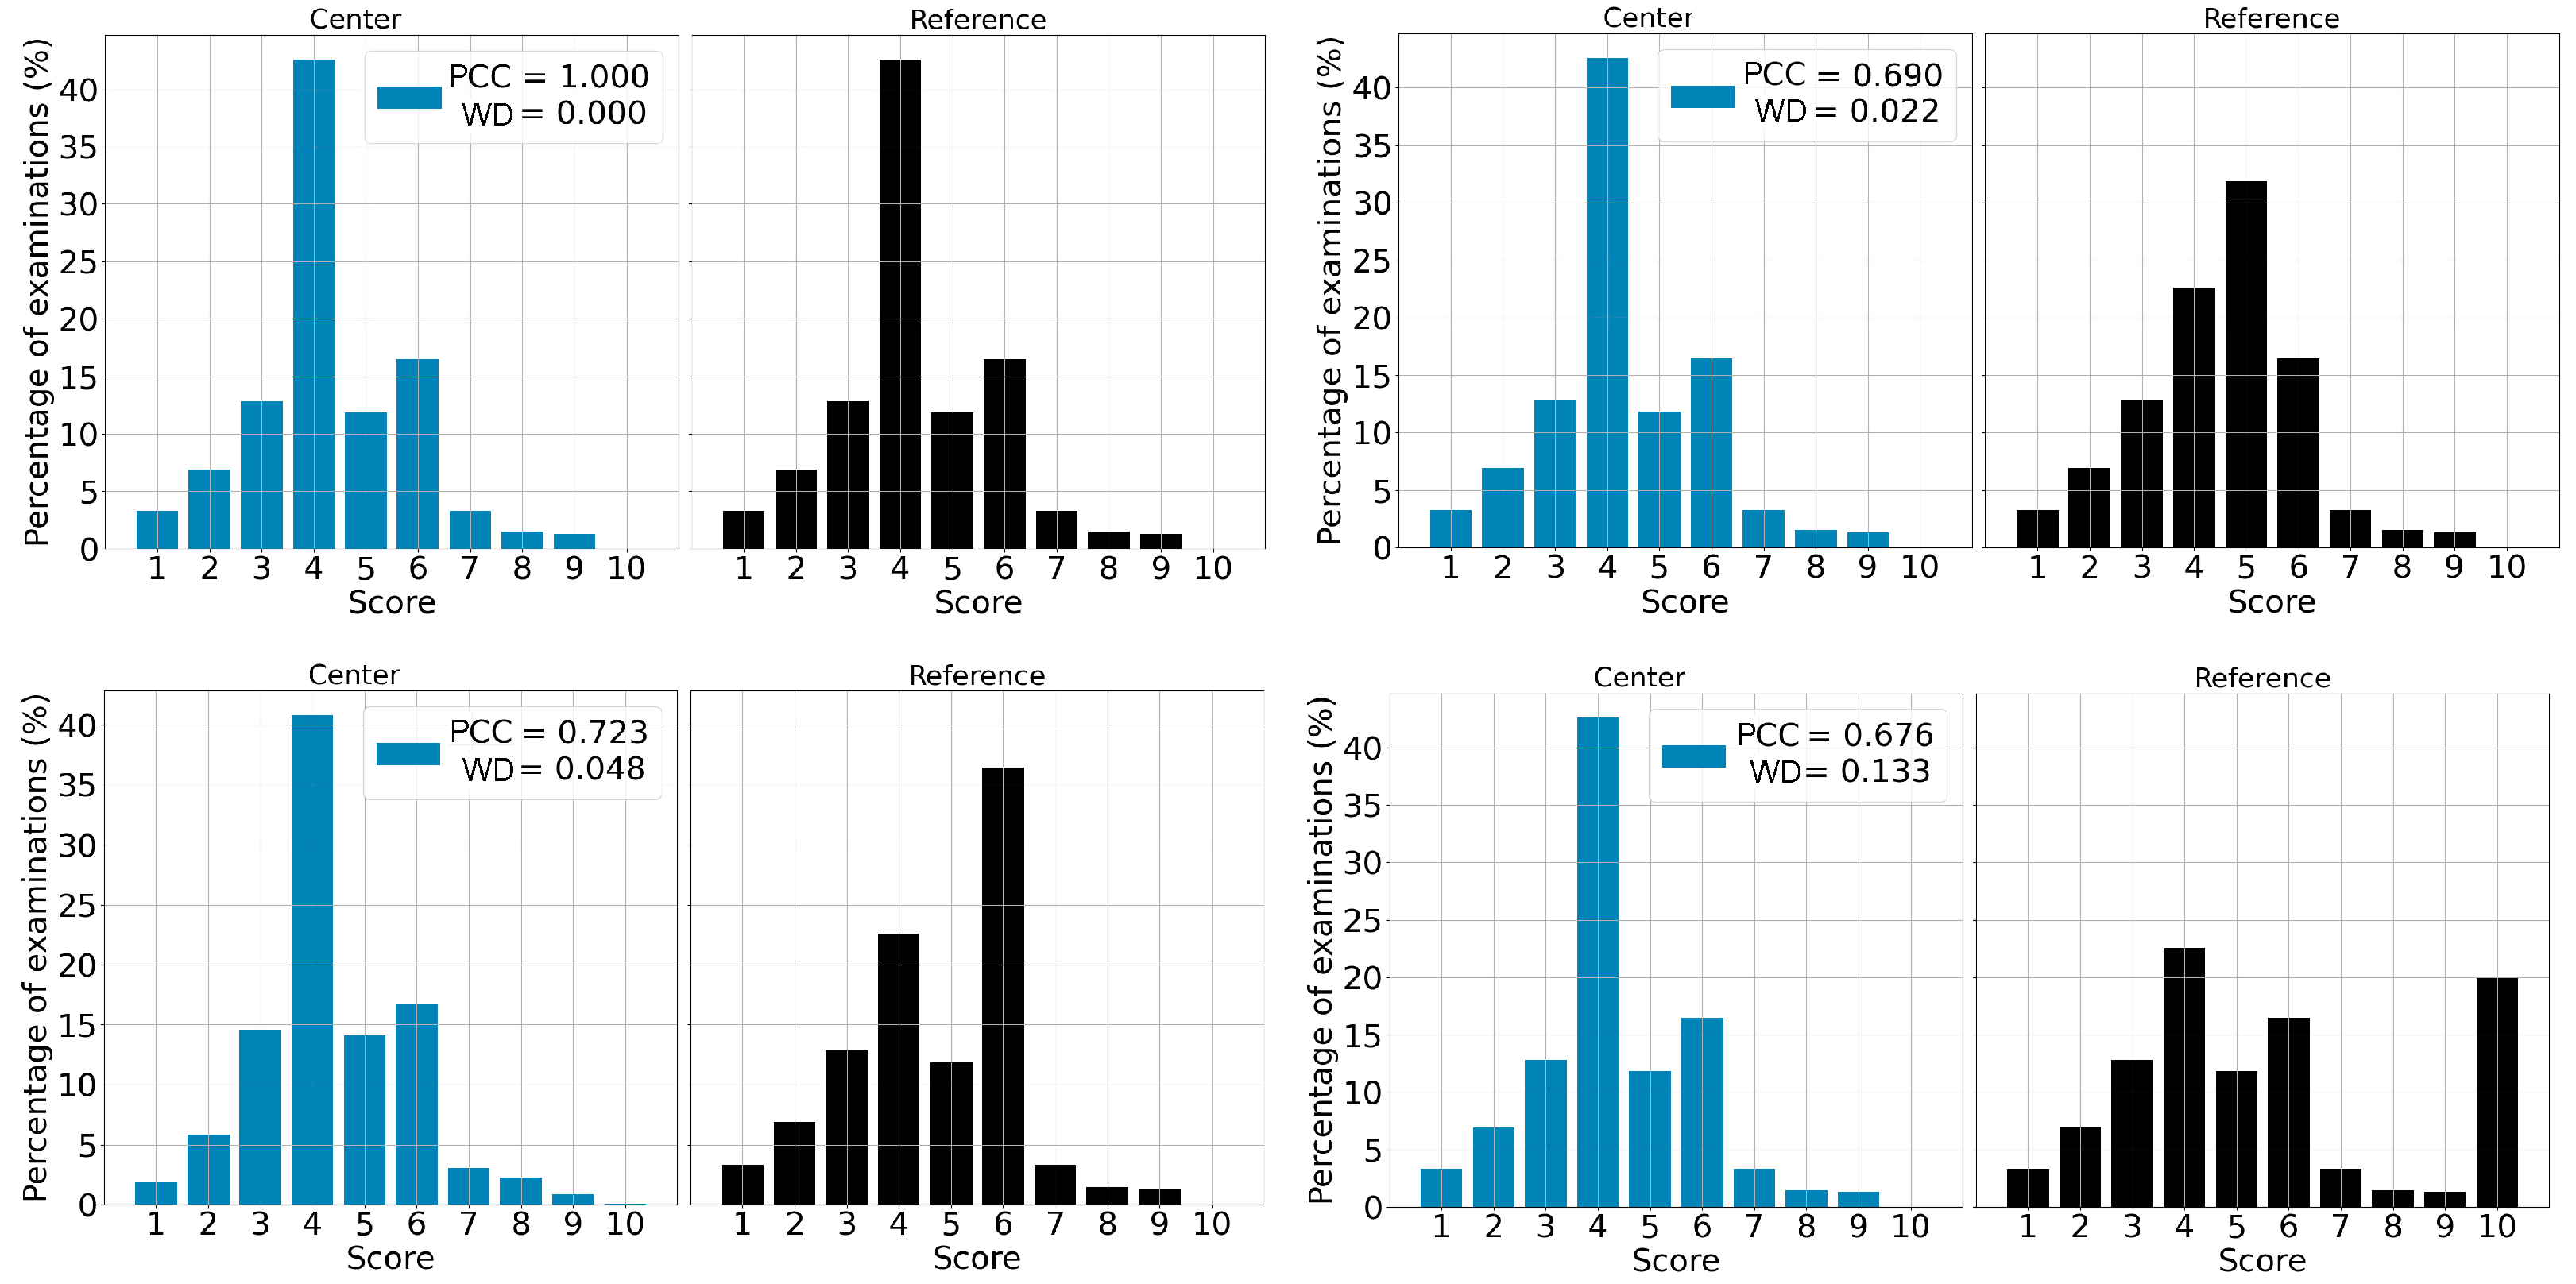
3.3. Score-by-Score Difference
3.4. Deviation Detection
3.5. Severity of a Shift
4. Discussion
5. Conclusions
Author Contributions
Funding
Institutional Review Board Statement
Informed Consent Statement
Data Availability Statement
Conflicts of Interest
References
- Yu, K.H.; Beam, A.L.; Kohane, I.S. Artificial intelligence in healthcare. Nat. Biomed. Eng. 2018, 2, 719–731. [Google Scholar] [CrossRef]
- Simonyan, K.; Zisserman, A. Very Deep Convolutional Networks for Large-Scale Image Recognition. arXiv 2015, arXiv:1409.1556. [Google Scholar] [CrossRef]
- Siegel, R.L.; Miller, K.D.; Fuchs, H.E.; Jemal, A. Cancer Statistics, 2021. CA Cancer J. Clin. 2021, 71, 7–33. [Google Scholar] [CrossRef] [PubMed]
- Hosny, A.; Parmar, C.; Quackenbush, J.; Schwartz, L.H.; Aerts, H.J.W.L. Artificial intelligence in radiology. Nat. Rev. Cancer 2018, 18, 500–510. [Google Scholar] [CrossRef] [PubMed]
- Vyborny, C.J.; Giger, M.L. Computer vision and artificial intelligence in mammography. Am. J. Roentgenol. 1994, 162, 699–708. [Google Scholar] [CrossRef]
- LeCun, Y.; Bengio, Y.; Hinton, G. Deep learning. Nature 2015, 521, 436–444. [Google Scholar] [CrossRef]
- Kopans, D.B. An open letter to panels that are deciding guidelines for breast cancer screening. Breast Cancer Res. Treat. 2015, 151, 19–25. [Google Scholar] [CrossRef]
- Park, S.H.; Han, K. Methodologic Guide for Evaluating Clinical Performance and Effect of Artificial Intelligence Technology for Medical Diagnosis and Prediction. Radiology 2018, 286, 800–809. [Google Scholar] [CrossRef] [PubMed]
- Yampolskiy, R.V.; Spellchecker, M.S. Artificial Intelligence Safety and Cybersecurity: A Timeline of AI Failures. arXiv 2016, arXiv:1610.07997. [Google Scholar] [CrossRef]
- Ryan, M. In AI We Trust: Ethics, Artificial Intelligence, and Reliability. Sci. Eng. Ethic 2020, 26, 2749–2767. [Google Scholar] [CrossRef]
- Feng, J.; Phillips, R.V.; Malenica, I.; Bishara, A.; Hubbard, A.E.; Celi, L.A.; Pirracchio, R. Clinical artificial intelligence quality improvement: Towards continual monitoring and updating of AI algorithms in healthcare. NPJ Digit. Med. 2022, 5, 66. [Google Scholar] [CrossRef] [PubMed]
- SPacilè, S.; Lopez, J.; Chone, P.; Bertinotti, T.; Grouin, J.M.; Fillard, P. Improving Breast Cancer Detection Accuracy of Mammography with the Concurrent Use of an Artificial Intelligence Tool. Radiol. Artif. Intell. 2020, 2, e190208. [Google Scholar] [CrossRef] [PubMed]
- Al Ridhawi, I.; Otoum, S.; Aloqaily, M.; Boukerche, A. Generalizing AI: Challenges and Opportunities for Plug and Play AI Solutions. IEEE Netw. 2021, 35, 372–379. [Google Scholar] [CrossRef]
- Bar, O.; Neimark, D.; Zohar, M.; Hager, G.D.; Girshick, R.; Fried, G.M.; Wolf, T.; Asselmann, D. Impact of data on generalization of AI for surgical intelligence applications. Sci. Rep. 2020, 10, 1–12. [Google Scholar] [CrossRef] [PubMed]
- Benesty, J.; Chen, J.; Huang, Y.; Cohen, I. Pearson Correlation Coefficient. In Noise Reduction in Speech Processing; Cohen, I., Huang, Y., Chen, J., Benesty, J., Eds.; Springer: Berlin, Heidelberg, Germany, 2009; pp. 1–4. [Google Scholar] [CrossRef]
- Ratner, B. The correlation coefficient: Its values range between +1/−1, or do they? J. Targeting, Meas. Anal. Mark. 2009, 17, 139–142. [Google Scholar] [CrossRef]
- Balakrishnan, N.; Voinov, V.; Nikulin, M. Chi-Squared Goodness of Fit Tests with Applications. Academic Press: Cambridge, MA, USA, 2013. [Google Scholar]
- Panaretos, V.M.; Zemel, Y. Statistical Aspects of Wasserstein Distances. Annu. Rev. Stat. Its Appl. 2019, 6, 405–431. [Google Scholar] [CrossRef]
- Welcome to Python.org, Python.org. Available online: https://www.python.org/ (accessed on 17 January 2023).
- Home, OpenCV. Available online: https://opencv.org/ (accessed on 17 January 2023).
- Scipy. Stats. Wasserstein_Distance—SciPy v1.10.0 Manual. Available online: https://docs.scipy.org/doc/scipy/reference/generated/scipy.stats.wasserstein_distance.html (accessed on 17 January 2023).
- Boracchi, G.; Carrera, D.; Cervellera, C.; Macciò, D. QuantTree: Histograms for Change Detection in Multivariate Data Streams. In Proceedings of the 35th International Conference on Machine Learning, Stockholm, Sweden, 10–15 July 2018; pp. 639–648. Available online: https://proceedings.mlr.press/v80/boracchi18a.html (accessed on 6 July 2022).
- Richards, M.; Westcombe, A.; Love, S.; Littlejohns, P.; Ramirez, A. Influence of delay on survival in patients with breast cancer: A systematic review. Lancet 1999, 353, 1119–1126. [Google Scholar] [CrossRef]
- Caplan, L. Delay in Breast Cancer: Implications for Stage at Diagnosis and Survival. Front. Public Health 2014, 2. Available online: https://www.frontiersin.org/articles/10.3389/fpubh.2014.00087 (accessed on 19 January 2023). [CrossRef]
- Cha, S.-H.; Srihari, S.N. On measuring the distance between histograms. Pattern Recognit. 2002, 35, 1355–1370. [Google Scholar] [CrossRef]
- Swain, M.J.; Ballard, D.H. Color indexing. Int. J. Comput. Vis. 1991, 7, 11–32. [Google Scholar] [CrossRef]
- Aherne, F.J.; Thacker, N.A.; Rockett, P.I. The Bhattacharyya metric as an absolute similarity measure for frequency coded data. Kybernetika 1998, 34, 363–368. [Google Scholar]
- Zeng, J.; Kruger, U.; Geluk, J.; Wang, X.; Xie, L. Detecting abnormal situations using the Kullback–Leibler divergence. Automatica 2014, 50, 2777–2786. [Google Scholar] [CrossRef]
- Joyce, J.M. Kullback-Leibler Divergence. In International Encyclopedia of Statistical Science; Lovric, M., Ed.; Springer: Berlin/Heidelberg, Germany, 2011; pp. 720–722. [Google Scholar] [CrossRef]
- Belov, D.I.; Armstrong, R.D. Distributions of the Kullback-Leibler divergence with applications. Br. J. Math. Stat. Psychol. 2011, 64, 291–309. [Google Scholar] [CrossRef] [PubMed]
- Rogerson, P.A. The Detection of Clusters Using a Spatial Version of the Chi-Square Goodness-of-Fit Statistic. Geogr. Anal. 1999, 31, 130–147. [Google Scholar] [CrossRef]


| Center | Manufacturer | Reports | AI-Version | Modality | Dates (Months) |
|---|---|---|---|---|---|
| US-1 | Hologic® | 18,470 (51 %) | 1.2 | FFDM | April 2021–February 2022 (11) |
| US-2 | Hologic® | 6227 (17 %) | 1.3 | FFDM | October 2021–March 2022 (6) |
| US-3 | Hologic® | 11,100 (30 %) | 2.0.1 | DBT | October 2021–October 2022 (13) |
| US-4 | Hologic® | 784 (2 %) | 1.2 | FFDM | July 2021–March 2022 (9) |
| Number of Exams | AI Version Assessed | Manufacturer | Modality | Dates |
|---|---|---|---|---|
| 13,433 (25.4%) | 1.2 | Hologic® | FFDM | December 2006–July 2019 |
| 25,330 (47.8%) | 1.3 | Hologic® | FFDM | October 2006–July 2019 |
| 14,187 (26.8%) | 2.0 | Hologic® | DBT | October 2006–July 2019 |
| Center | PCC Mean | PCC Standard Deviation |
|---|---|---|
| US-1 | 0.996 | 0.002 |
| US-2 | 0.968 | 0.023 |
| US-3 | 0.985 | 0.084 |
| US-4 | 0.971 | 0.083 |
| Center. | Manufacturer and Modality | Version | PCC | χ² p-Value | Reference |
|---|---|---|---|---|---|
| US-1 | Hologic FFDM | 1.2 | 0.998 [min: 0.993, max: 0.999] | 0.853 | Hologic (FFDM), V 1.2 |
| US-2 | Hologic FFDM | 1.3 | 0.975 [min: 0.923, max: 0.986] | 0.616 | Hologic (FFDM), V 1.3 |
| US-3 | Hologic DBT | 2.0 | 0.995 [min: 0.972, max: 0.998] | 0.743 | Hologic (DBT), V 2.0 |
| US-4 | Hologic FFDM | 1.2 | 0.994 [min: 0.962, max: 0.982] | 0.785 | Hologic (FFDM), V 1.2 |
| Center | AI Score | |||||||||
|---|---|---|---|---|---|---|---|---|---|---|
| 1 | 2 | 3 | 4 | 5 | 6 | 7 | 8 | 9 | 10 | |
| US-2 | +0.37 | −4.8 | +5.54 | +5.82 | −3.71 | −5.71 | +0.41 | +1.29 | +0.65 | +0.14 |
| US-3 | +0.94 | −1.64 | −2.21 | −0.95 | −0.11 | +1.22 | +0.76 | +1.18 | +0.7 | +0.11 |
| US-4 | +1.47 | +3.09 | −0.44 | −1.02 | −2.25 | −1.79 | +0.3 | −0.18 | +0.82 | +0 |
| Center | Manufacturer and Modality | Version | PCC | χ² p-Value | Reference | Mismatch Cause |
|---|---|---|---|---|---|---|
| US-1 | Hologic FFDM | 1.2 | 0.714 | 0.026 | Hologic (DBT), V 2.0 | Wrong modality, Wrong version |
| US-2 | Hologic FFDM | 1.3 | 0.825 | 0.320 | Fuji (FFDM), V 1.3 | Wrong manufacturer |
| US-3 | Hologic DBT | 2.0 | 0.707 | 0.221 | Fuji (FFDM), V 1.3 | Wrong manufacturer, Wrong version |
| US-4 | Hologic FFDM | 1.2 | 0.364 | 0.026 | Fuji (FFDM), V 1.3 | Wrong manufacturer, Wrong version |
Disclaimer/Publisher’s Note: The statements, opinions and data contained in all publications are solely those of the individual author(s) and contributor(s) and not of MDPI and/or the editor(s). MDPI and/or the editor(s) disclaim responsibility for any injury to people or property resulting from any ideas, methods, instructions or products referred to in the content. |
© 2023 by the authors. Licensee MDPI, Basel, Switzerland. This article is an open access article distributed under the terms and conditions of the Creative Commons Attribution (CC BY) license (https://creativecommons.org/licenses/by/4.0/).
Share and Cite
Aguilar, C.; Pacilè, S.; Weber, N.; Fillard, P. Monitoring Methodology for an AI Tool for Breast Cancer Screening Deployed in Clinical Centers. Life 2023, 13, 440. https://doi.org/10.3390/life13020440
Aguilar C, Pacilè S, Weber N, Fillard P. Monitoring Methodology for an AI Tool for Breast Cancer Screening Deployed in Clinical Centers. Life. 2023; 13(2):440. https://doi.org/10.3390/life13020440
Chicago/Turabian StyleAguilar, Carlos, Serena Pacilè, Nicolas Weber, and Pierre Fillard. 2023. "Monitoring Methodology for an AI Tool for Breast Cancer Screening Deployed in Clinical Centers" Life 13, no. 2: 440. https://doi.org/10.3390/life13020440
APA StyleAguilar, C., Pacilè, S., Weber, N., & Fillard, P. (2023). Monitoring Methodology for an AI Tool for Breast Cancer Screening Deployed in Clinical Centers. Life, 13(2), 440. https://doi.org/10.3390/life13020440