Article

Urinary Markers of Tubular Injury and Renal Fibrosis in Patients with Type 2 Diabetes and Different Phenotypes of Chronic Kidney Disease

by
Anton I. Korbut
,
Vyacheslav V. Romanov
and
Vadim V. Klimontov
*
Research Institute of Clinical and Experimental Lymphology—Branch of the Institute of Cytology and Genetics Siberian Branch of Russian Academy of Sciences (RICEL—Branch of IC&G SB RAS), 630060 Novosibirsk, Russia
*
Author to whom correspondence should be addressed.
Life 2023, 13(2), 343; https://doi.org/10.3390/life13020343
Submission received: 15 December 2022 / Revised: 21 January 2023 / Accepted: 22 January 2023 / Published: 27 January 2023
(This article belongs to the Special Issue Diabetes Metabolism: Molecular and Integrative Approaches)

Abstract

:
This study assessed the urinary excretion of markers and mediators of tubular injury and renal fibrosis in patients with type 2 diabetes (T2D) and non-albuminuric and albuminuric patterns of chronic kidney disease (CKD). One hundred and forty patients with long-term T2D and different patterns of CKD and twenty non-diabetic individuals were included. Urinary retinol-binding protein 4 (RBP-4), glutathione-S-transferase α1 and π (GST-α1 and GST-π), transforming growth factor β (TGF-β), type I and type IV collagen (Col1 and Col4), bone morphogenic protein 7 (BMP-7), and hepatocyte growth factor (HGF) were assessed by ELISA. Patients with T2D demonstrated increased urinary excretion of RBP-4, GST-π, Col4, BMP-7, and HGF (all p < 0.05 vs. control). The excretion of RBP-4, GST-π, Col1, and Col4 was increased in patients with elevated albumin-to-creatinine ratio (UACR; all p < 0.05 vs. control), while BMP-7 and HGF were increased innormoalbuminuric patients also (p < 0.05). Urinary RBP-4, GST-α1, Col1, Col4, and HGF correlated positively with UACR; meanwhile, no correlations with glomerular filtration rate were found. The results demonstrate that elevated urinary excretions of the markers of tubular injury (RBP-4, GST-π) and renal fibrosis (Col1, Col4), as well as HGF, an antifibrotic regulator, are associated with the albuminuric pattern of CKD in subjects with T2D.

1. Introduction

An increased prevalence of diabetes around the world and changes in the management of the disease have transformed the epidemiology and clinical course of chronic kidney disease (CKD) in recent years. A number of studies have documented an increasing proportion of patients with diabetes developing a reduction in renal function without a preceding or concomitant increase in albuminuria [1,2,3,4].
It was demonstrated that albuminuric and non-albuminuric CKD patterns differ in their pathogenic mechanisms, risk factors, and clinical course [2,5,6].Albuminuric CKD turned out to be associated with classical glomerular injury, whereas tubulointerstitial and vascular changes may be more prominent in the non-albuminuric CKD phenotype [7]. We have demonstrated recently that elevated urinary excretion of nephrin and podocin, the components of podocyte slit diaphragm, is associated with albuminuria in patients with type 2 diabetes (T2D). Meanwhile, elevated excretion of WAP four-disulfide core domain protein 2 (WFDC2), a marker of tubulointerstitial fibrosis, is associated with a decrease in renal function in these patients [5].
The study of markers of glomerular and tubular dysfunction and renal fibrosis is considered a promising approach to the diagnosis and prognosis of diabetic kidney diseases [8,9,10]. We hypothesized that urinary markers of tubular dysfunction, as well as factors involved in renal fibrosis, may respond differently in albuminuric and non-albuminuric phenotypes of diabetic CKD. Therefore, we aimed to assess the urinary excretion of some tubular markers and fibrotic and antifibrotic mediators in patients with T2D and non-albuminuric and albuminuric CKD.

2. Materials and Methods

2.1. Study Design

This observational, single-center, and cross-sectional study included adult participants with long-term T2D. Men and women with the disease duration of more than 10 years since diagnosis were enrolled. The following set of exclusion criteria was established: end-stage renal disease, verified non-diabetic CKD, current urinary tract infection, ketoacidosis or hyperosmolar state at the time of the survey, malignant neoplasms, inflammatory or autoimmune diseases in the medical history, and high-protein diet.To reduce the risk of misclassification of CKD variants, we also excluded patients receiving antihyperglycemic drugs with established antialbuminuric effects: dipeptidyl peptidase 4 (DPP-4) inhibitors, glucagon-like receptor 1 (GLP-1) receptor agonists and/or sodium-glucose cotransporter 2 (SGLT-2) inhibitors for three months prior to inclusion.
Patients were recruited from the institutional database(2012–2018) as described previously [5,11].We formed 4 groups of patients, 35 people each, based on the estimated glomerular filtration rate (eGFR) and urinary albumin-to-creatinine ratio (UACR). We considered eGFR below 60 mL/min/1.73 m2 as a sign of decreased renal function (DRF) and UACR ≥ 3.0 mg/mmol as elevated albuminuria (EA). The values of eGFR ≥ 60 mL/min/1.73 m2 and UACR < 3.0 mg/mmol were referred to as normal renal function (NRF) and normal albuminuria (NA), respectively. Therefore, NRF/NA, DRF/NA, NRF/EA, and DRF/EA groups were identified. The classification principle is shown in Table 1.
We also included 20 individuals without diabetes, obesity, or cardiovascular diseases as healthy control. The exclusion criteria were the same for control and diabetic subjects.
We assessed urinary excretion of retinol-binding protein 4 (RBP-4), glutation-S-transferase α1 (GST-α1), and glutation-S-transferase π (GST-π) as markers of tubular injury [12,13,14]. Among these markers, GST-α1 and GST-π are considered to be site-specific. GST-α1 is located predominantly in the proximal convoluted tubules. Additionally, low levels of GSTα have been detected in the loop of Henle [15]. Urinary GST-π is attributed to distal tubules and collecting ducts [13,14,16].
We measured urinary excretion of transforming growth factor β (TGF-β), a principalfibrotic mediator in the diabetic kidney [17,18]. In addition, urinary Col1 andCol4 were assessed as markers of fibrosis [16,19,20]. We also estimated urinary concentrations of two growth factors with antifibrotic potential: bone morphogenic protein 7 (BMP-7) [21,22] and hepatic growth factor (HGF) [23,24].

2.2. Methods

Routine laboratory measurements, including glycated hemoglobin A1C (HbA1C), serum creatinine, UACR, and urinary excretion of total protein, were performed on AU480 Chemical Analyzer (Beckman Coulter, Brea, CA, USA). The eGFR was calculated by the CKD-EPI formula (2009).
The concentrationsof RBP-4, GST-α1, GST-π, TGF-β, Col1, Col4, BMP-7, and HGF were assessed in the morning urine samples by ELISA. The commercially available kits: SEA929Hu for RBP-4; SEA609Hu for GST-α1; SEB090Hu for GST-π; SEU124Hu for TGF-β;HEA571Hu for Col1; HEA180Hu for Col4; SEA799Hu for BMP-7;and EA047Hu for HGF(Cloud Clone Corp., Katy, TX, USA) were used in this study. The activation reagent IS044 (Cloud Clone Corp., Katy, TX, USA) was applied additionally for the measurement of TGF-β concentration. None of the received results were out of the upper limit of the range defined by the kit manufacturer. The results which were below the lower limit of the range defined by the manufacturer were set as zero. The results were adjusted to the urinary creatinine.

2.3. Statistical Procedures

The sample size was preliminary calculated with parameters: α = 0.05 and 1 − β = 80% [25,26].The minimum number of participants was defined as 30 per group.
The Statistica 13.0 software package (Dell, Round Rock, TX, USA) was used for statistical procedures. The normality was tested by the Shapiro-Wilk test. As most of the quantitative variables were not distributed normally, Kruskal-Wallis H tests were used to assess the differences between the groups. Intergroup differences in discrete parameters were analyzed using the χ2 test. A difference was considered significant if the p-value was below 0.05.
Spearman rank correlation analysis was used to assess the associations between urinary markers and other parameters. The associations of markers with CKD patterns were checked in logistic regression models. The markers were adjusted on age, sex, body mass index (BMI), diabetes duration, and glycated hemoglobin (HbA1C). The contributor in regression analysis was defined as significant if the standard deviation of the coefficient beta did not exceed the coefficient beta and the p-value was less than 0.05.

3. Results

3.1. Clinical Characteristics of Patients

One hundred and forty individuals with T2D were included in the study. Clinical characteristics of patient groups are presented in Table 2. Patients with different CKD phenotypes did not differ significantly in age, sex, BMI, diabetes duration, and treatment modalities (all p > 0.05). Patients with elevated albuminuria and normal renal function (NRF/EA group) had higher HbA1C as compared with those without CKD (NRF/NA group; p = 0.04).

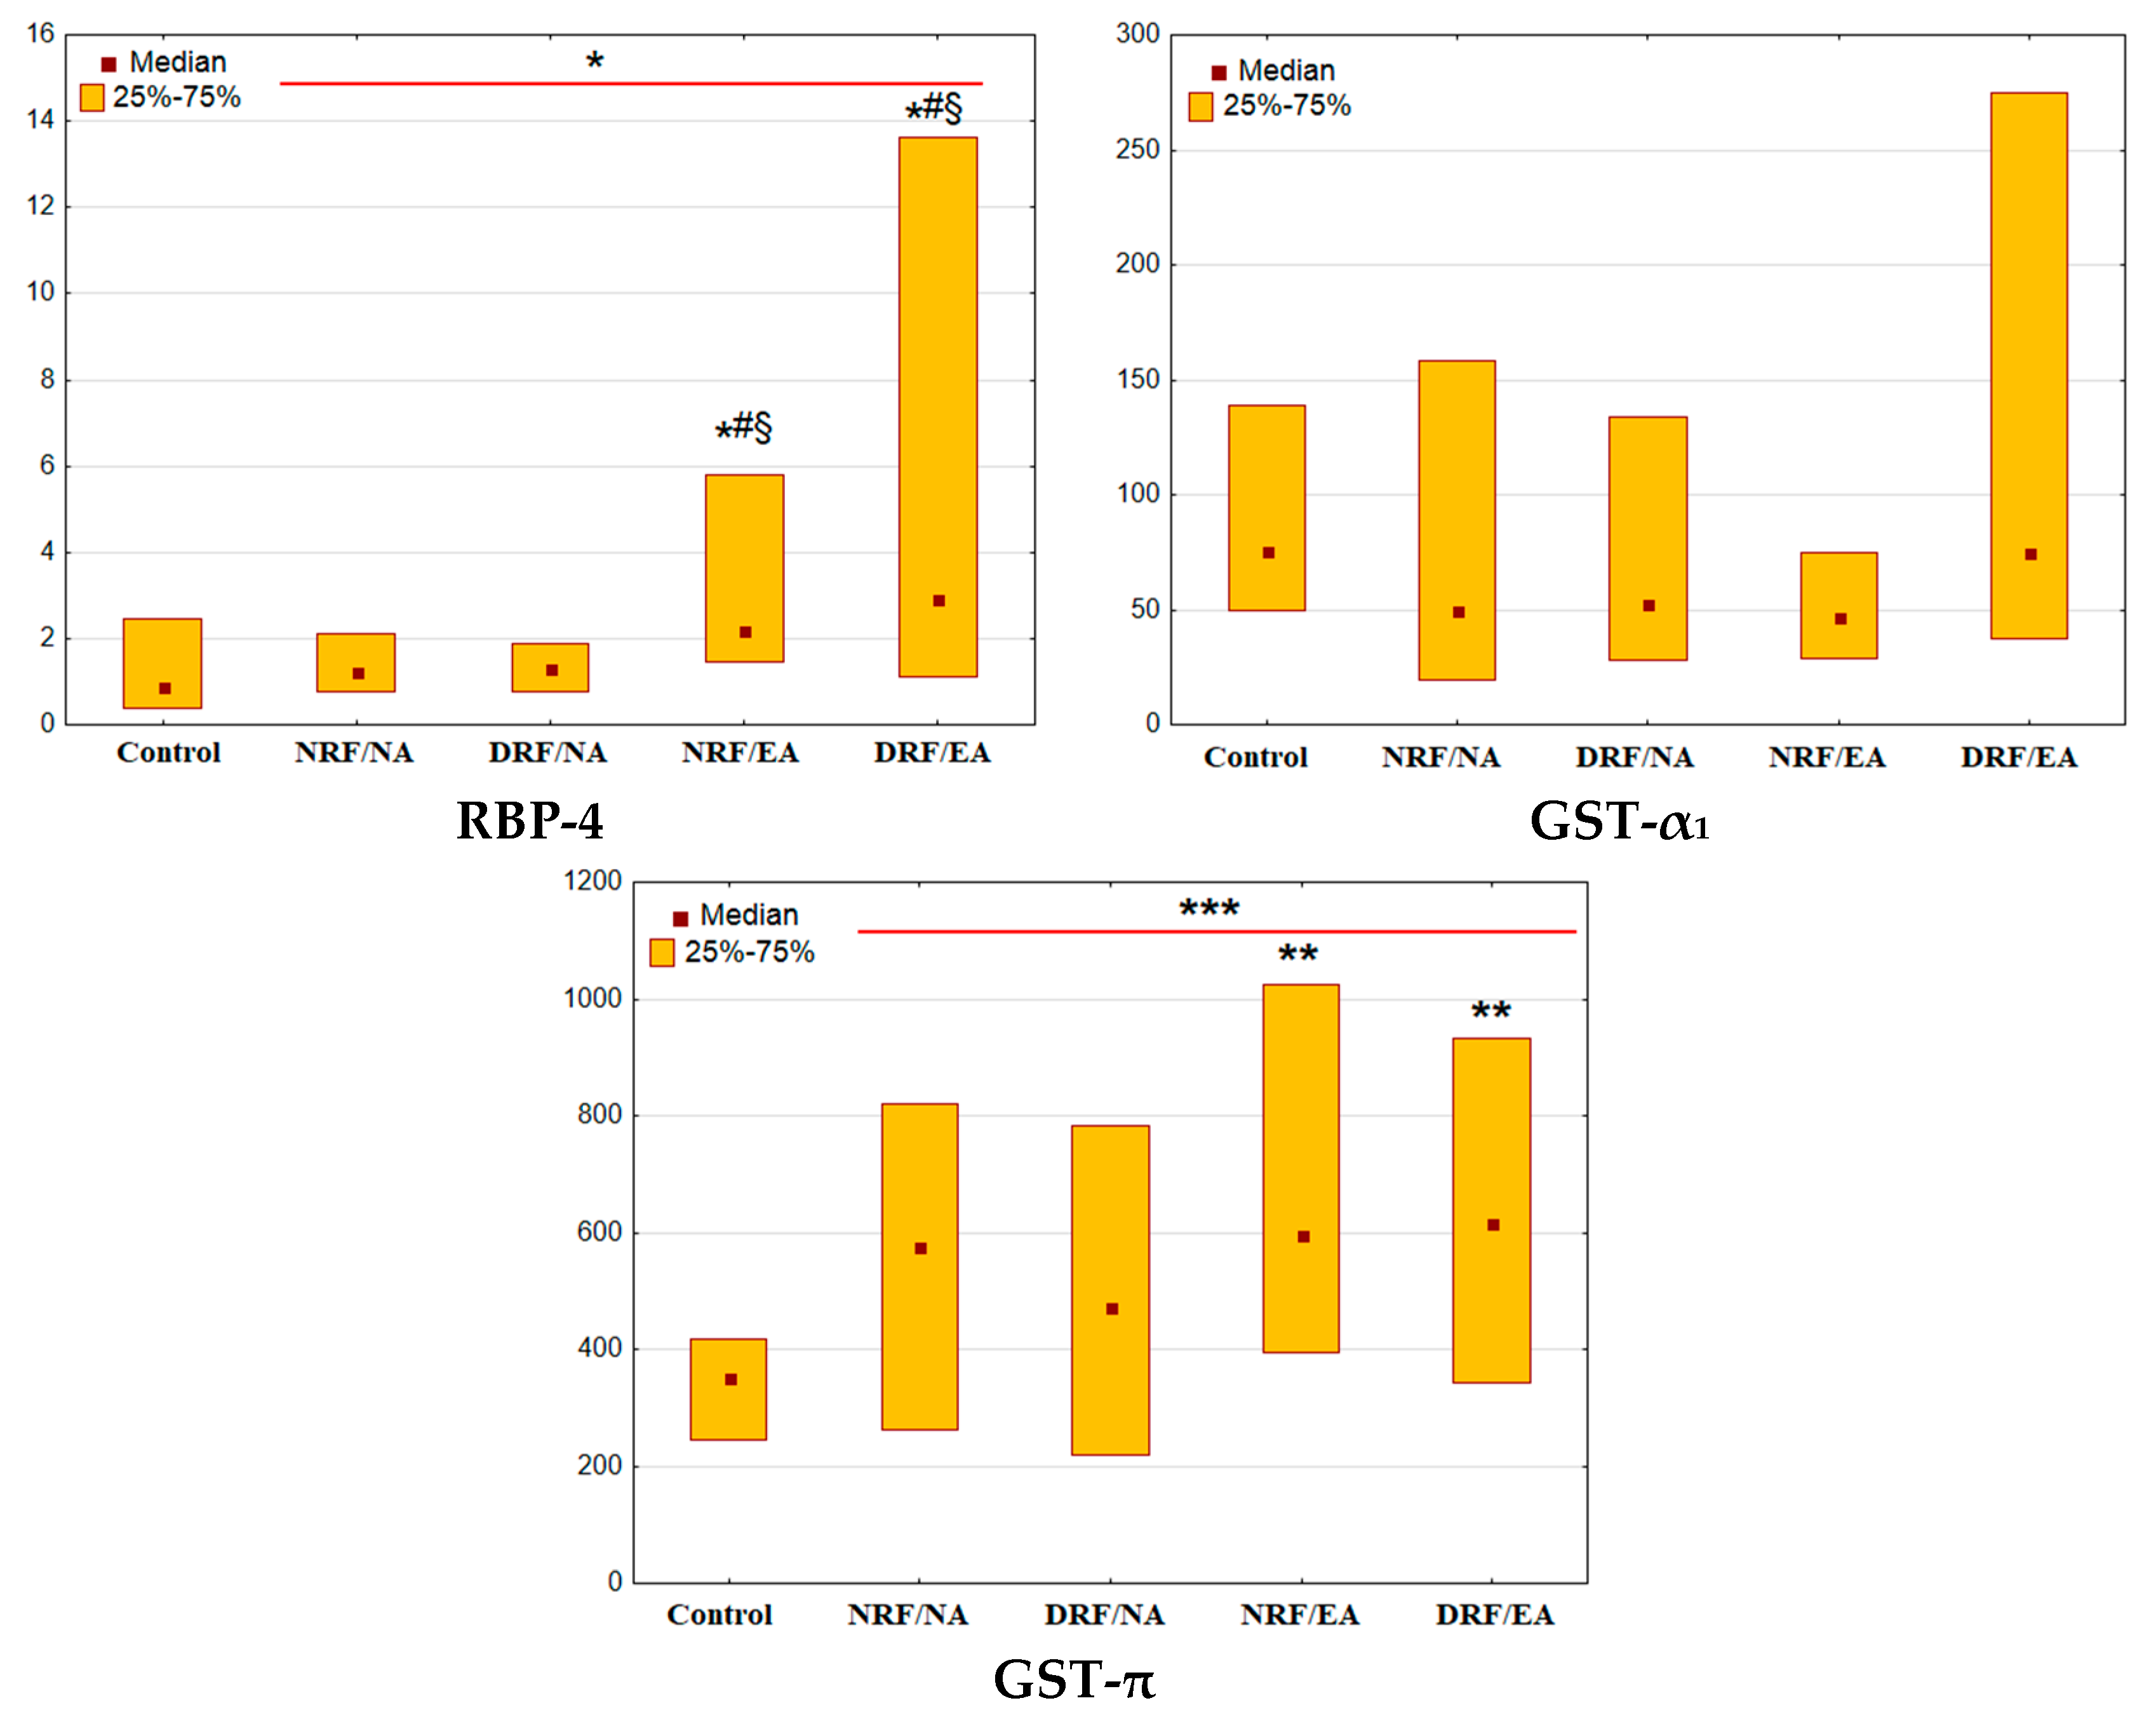
3.2. Urinary Excretion of Tubular Markers

Patients with T2D had higher urinary excretion of RBP-4 and GST-π than control individuals (p = 0.03 and p < 0.001, respectively, Figure 1). However, no differences were found in GST-α1 excretion.
The changes in the RBP-4 and GST-π excretion were more prominent in albuminuric groups (NRF/EA group: p = 0.01 and p = 0.004, respectively; DRF/EA group: p = 0.02 and GST-π: p = 0.005). The increase in RBP-4 excretion in both NRF/EA and DRF/EA groups was significant in comparison with NRF/NA and DRF/NA groups (NRF/EA vs. NRF/NA, p = 0.02; DRF/EA vs. NRF/EA, p = 0.01;DRF/EA vs. NRF/NA, p = 0.03;DRF/EA vs. DRF/NA, p = 0.02).
Urinary RBP-4 and GST-π, but not GST-α1, correlated positively with UACR (r = 0.55, p < 0.001; r = 0.27, p = 0.003; r = 0.07, p = 0.44, respectively). No correlations were found between tubular markers and eGFR (RBP-4 and GST-α1: r = −0.08, p = 0.33; GST-π: r = − 0.10, p = 0.26).

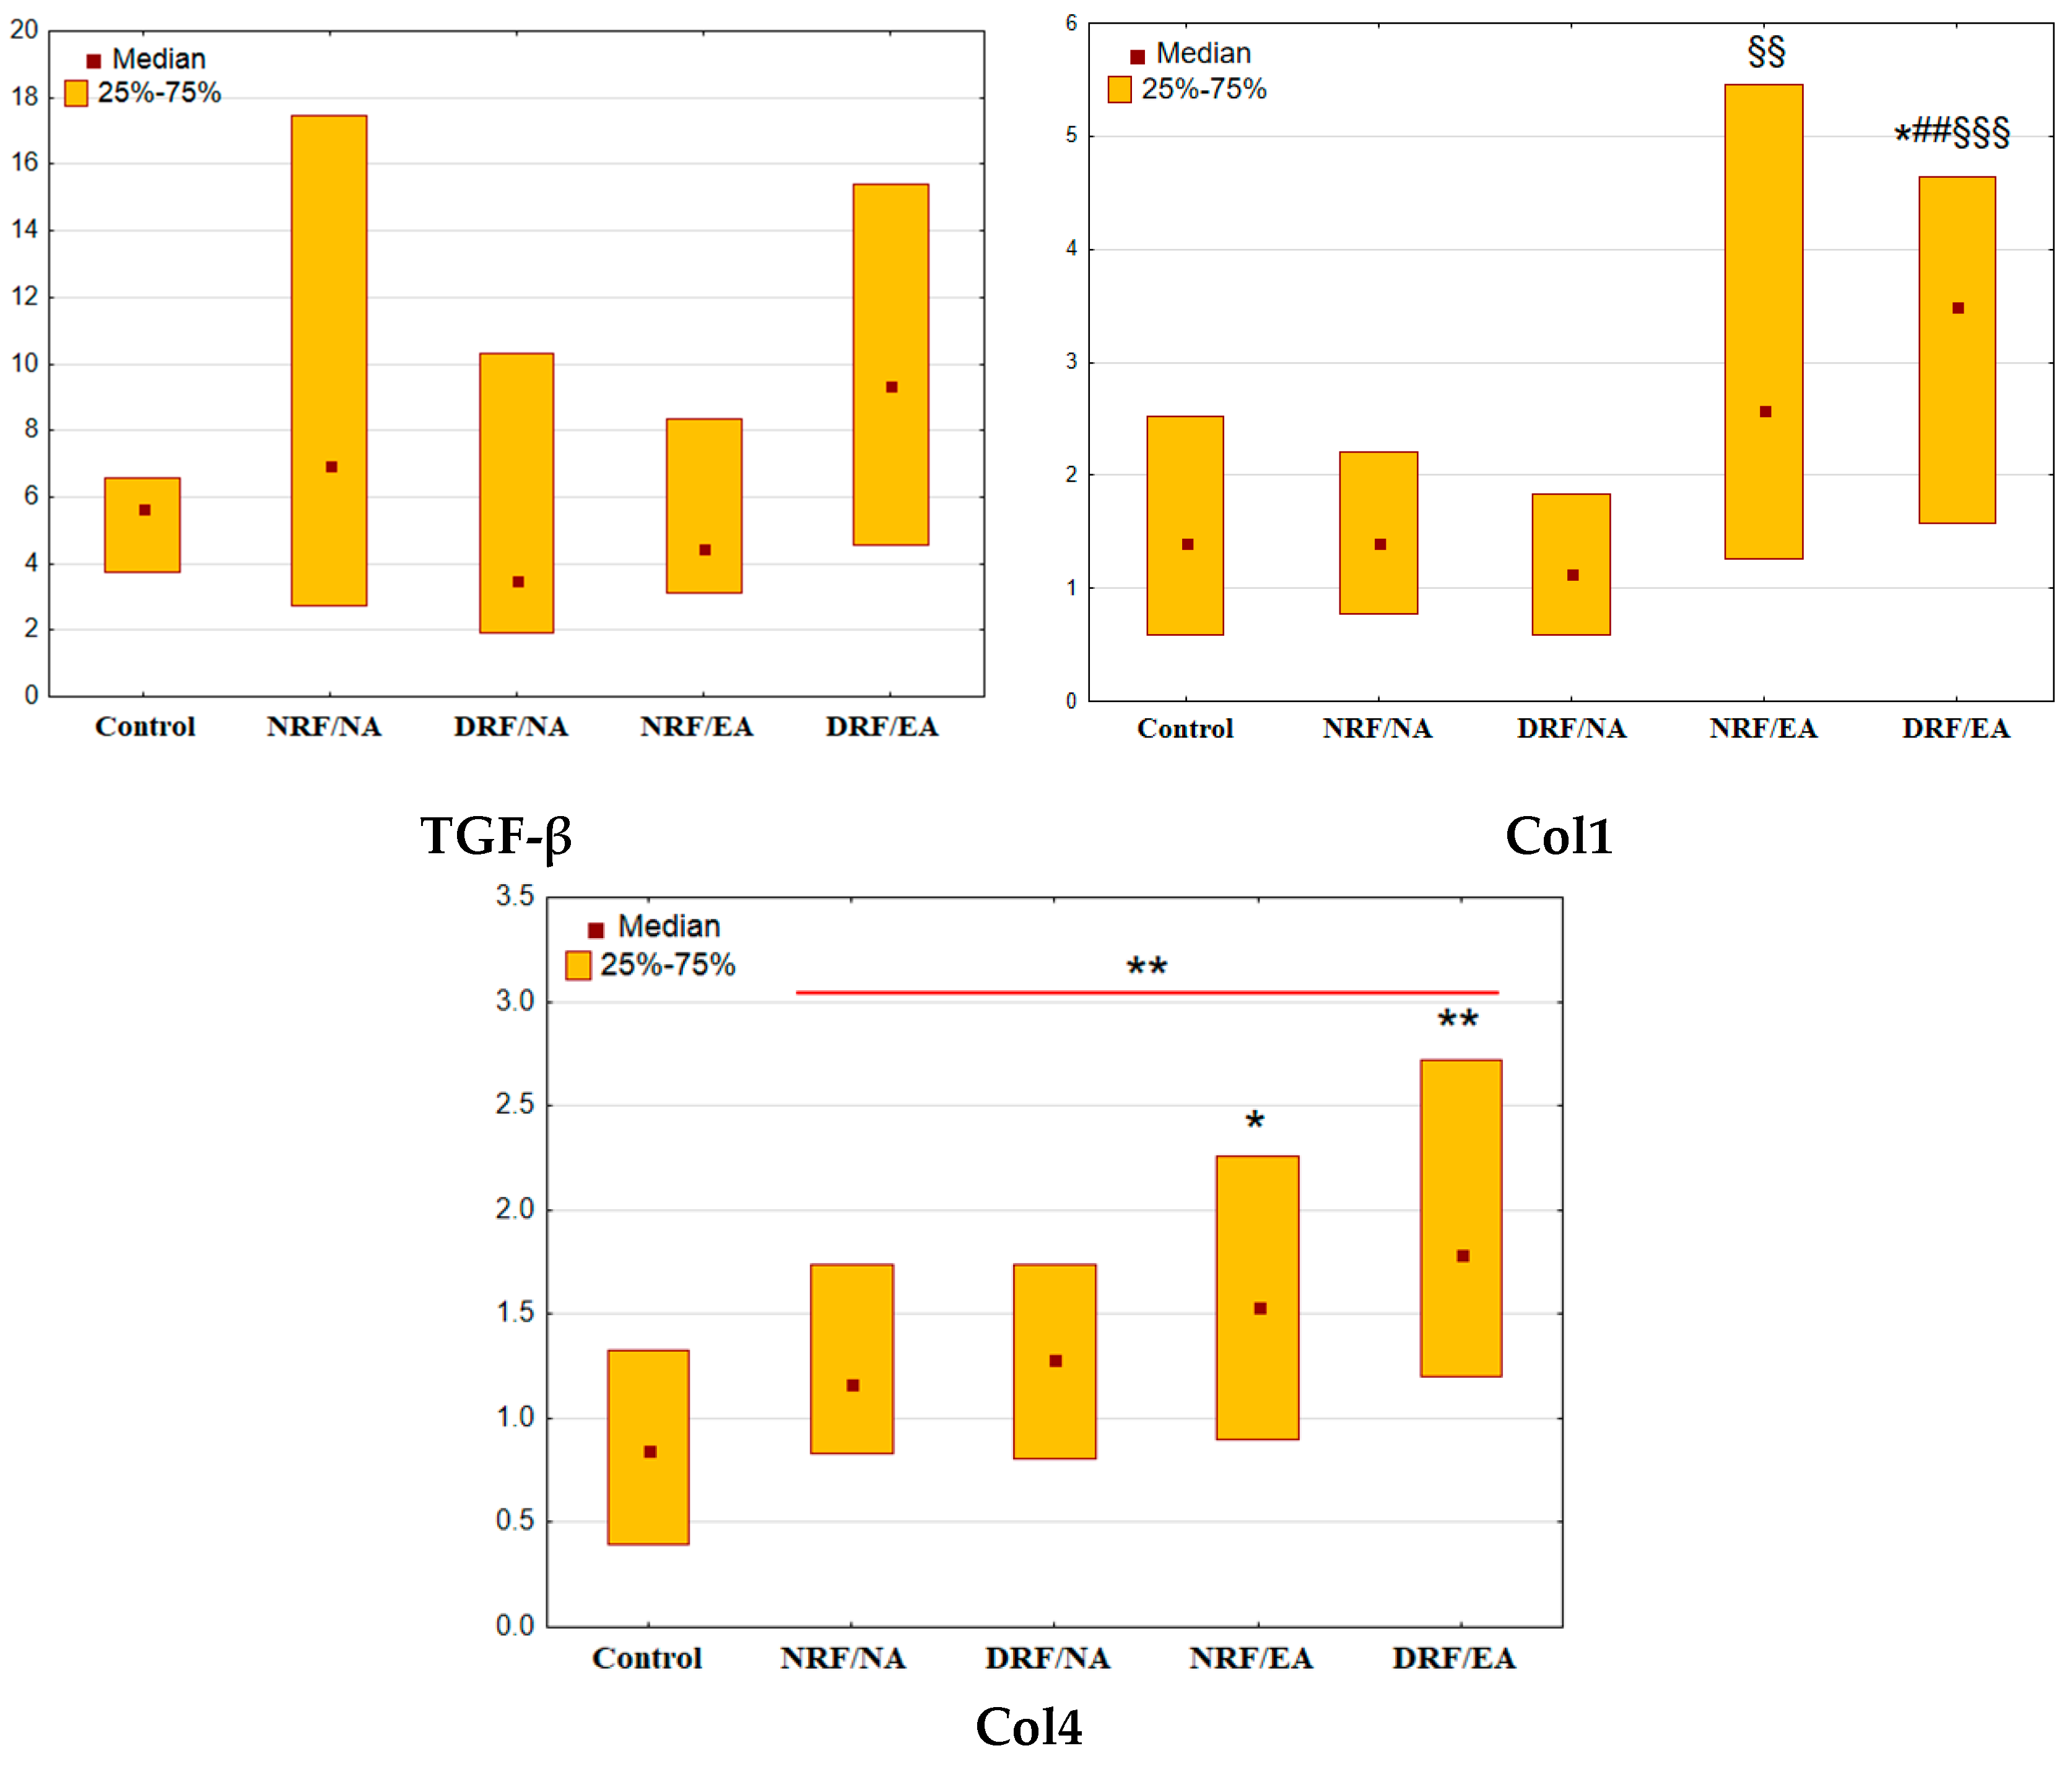
3.3. Urinary Excretion of TGF-β, Col1, and Col4

Patients with T2D demonstrated no significant changes in TGF-β and Col1 excretion (p = 0.56and p = 0.11 vs. control, respectively, Figure 2). Diabetic groups were not different from each other in the urinary TGF-β (all p > 0.05). Nonetheless, the patients with elevated albuminuria were characterized by higher levels of urinary Col1 as compared with other groups of the participants (NRF/EA: p = 0.006 vs. DRF/NA; DRF/EA: p = 0.02 vs. control, p = 0.008 vs. NRF/NA, p < 0.001 vs. DRF/NA).
Patients with T2D as a whole group had elevated Col4 excretion (p = 0.002, Figure 2). Diabetic groups with elevated albuminuria, but not those with normal UACR, demonstrated increased Col4 excretion when compared to control (NRF/EA: p = 0.03; DRF/EA: p = 0.002; NRF/NA: p = 0.45; DRF/NA: p = 0.48).
The excretion of Col1 and Col4, but not TGF-β, correlated positively with UACR (Col1: r = 0.49, p < 0.001; Col4: r = 0.34, p < 0.001; TGF-β: r = 0.17, p = 0.06). No correlations with eGFR were found (Col1: r = −0.05, p = 0.50; Col4: r = −0.09, p = 0.28; TGF-β: r = −0.06, p = 0.49).

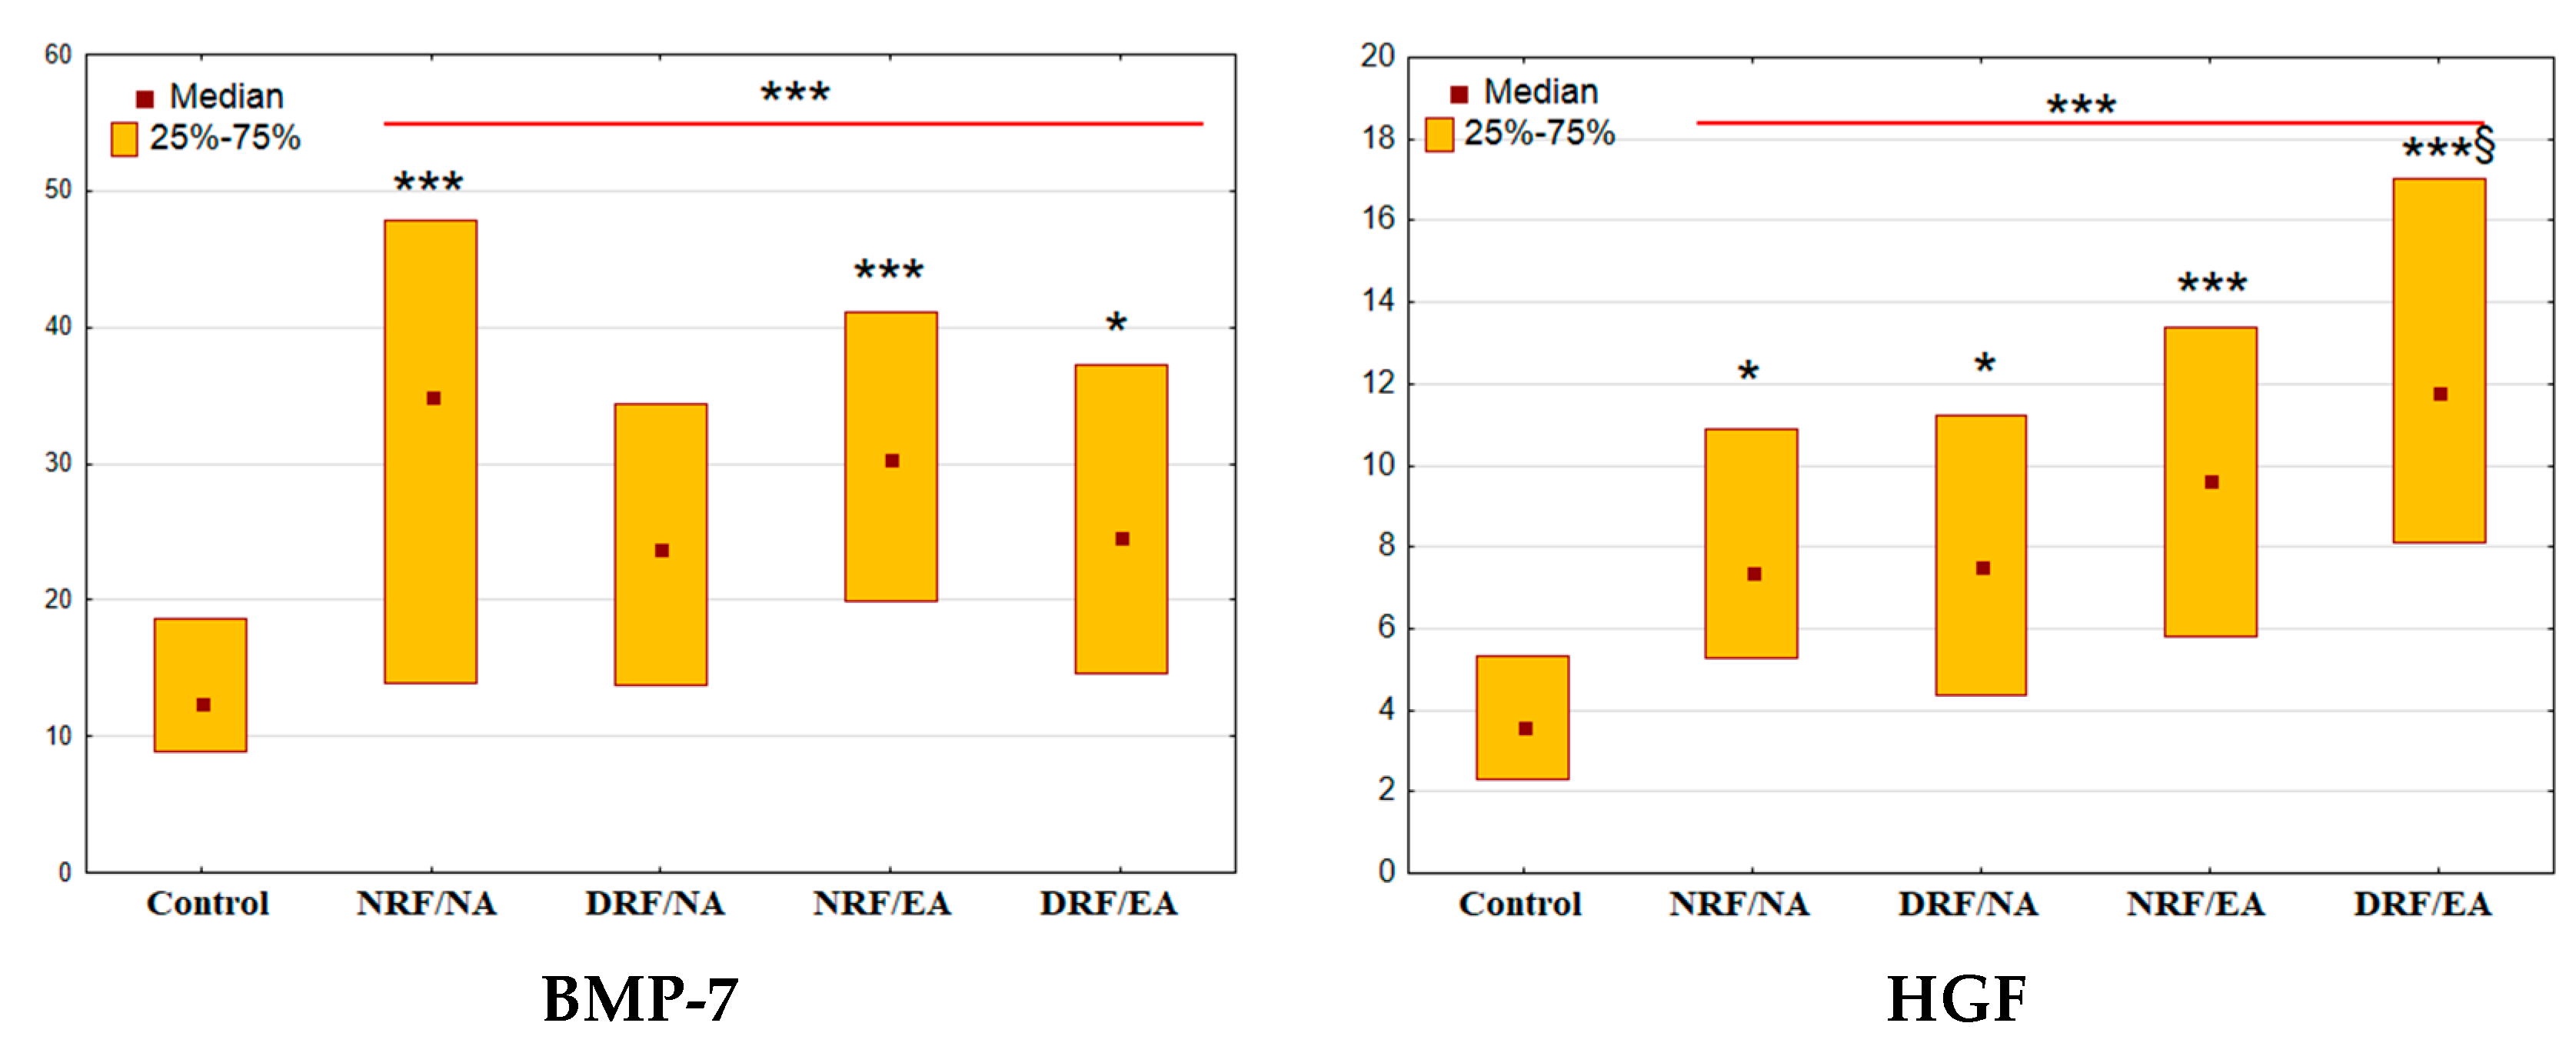
3.4. Urinary Excretion of BMP-7 and HGF

The excretion of BMP-7 and HGF in patients with T2D was increased significantly compared to the control (both p < 0.001, Figure 3).
Among subjects with diabetes, the elevation of BMP-7 was significant in NFR/NA, NRF/EA, and DRF/EA groups (p < 0.001, p < 0.001, and p = 0.03 vs. control, respectively). Meantime, the excretion of HGF was increased in all diabetic groups (NRF/NA: p = 0.02; DRF/NA: p = 0.03, NRF/EA and DRF/EA: both p < 0.001). Additionally, DRF/EA group demonstrated higher urinary excretion of HGF when compared to the DRF/NA group (p = 0.02).
The excretion of HGF correlated positively with UACR (r = 0.33, p < 0.001) but not with eGFR (r = −0.10, p = 0.26). The excretion of BMP-7 did not correlate with UACR (r = 0.05, p = 0.57) and demonstrated a weak correlation with eGFR (r = 0.20, p = 0.02).

3.5. Urinary Markers in Multivariate Models

In logistic regression models, RBP-4, Col1,and HGF were associated with increased albuminuria(UACR ≥ 3.0 mg/mmol) after adjustment for age, sex, BMI, duration of diabetes, and HbA1C (Table 3). No independent associations were found between studied markers and declined renal function (eGFR < 60 mL/min/1.73 m2).
Urinary Col1 was associated with the DRF/EA phenotype after adjustment for age, sex, duration of diabetes, and HbA1C. RBP-4 was associated with both albuminuric phenotypes (NRF/EA and DRF/EA) after adjustment for these factors(Table 4).However, we could not build any reliable model with assessed renal markers for non-albuminuric CKD.

4. Discussion

In this study, we tested the hypothesis that urinary tubular markers, as well as factors involved in renal fibrosis, may respond differently in albuminuric and non-albuminuric phenotypes of diabetic CKD. We demonstrated that urinary excretion of RBP-4, GST-π,and Col4 was increased in patients with T2D and that change was more prominent in patients with albuminuria independently from the renal function decline. Additionally, we found an elevation of urinary Col1 in patients with T2D and albuminuria. We also found an elevation of the urinary excretion of BMP-7 and HGF in patients with T2D. The elevation of BMP-7 was more reliable in patients with preserved renal function, while the excretion of HGF was higher in patients with albuminuria.

4.1. Tubular Markers

In our patients, urinary RBP-4 demonstrated a clear association with albuminuric CKD.RBP-4, a member of the lipocalin family, is the major transport protein for retinol in circulation. The expression of RBP-4 is highest in the liver and adipose tissue. Besides, RBP-4 mRNA was also detected in the kidney [27]. An increased serum concentration of RBP-4 with a positive correlation with serum creatinine and cystatin C was reported in patients with proteinuric CKD [28]. Inverse relations between eGFR and serum RBP-4 were found in Chronic Kidney Disease: Determinants of Progression and Cardiovascular Risk (PROGREDIR)study [29].
The associations between urinary excretion RBP-4 and UACR were found previously [30]. The elevated urinary RBP-4 is assumed to be a consequence of disrupted reabsorption of RBP-4 in the proximal renal tubule by the megalin-cubilin receptor complex [27]. RBP is a ligand of megalin [31]. Megalin gene knock-out was associated with decreased urinary reabsorption of albumin and RBP in mice with streptozotocin-induced diabetes and Akita mice [32]. The elevated expression of megalin was found in normoalbuminuric streptozotocin-induced diabetic rats and in immortalized human proximal tubular cells (HK-2) [33]. These data are consistent with our results demonstrating elevated excretion of RBP-4 in T2D patients with albuminuric CKD patterns.
The predictive value of urinary RBP-4 was assessed in some previous studies. Urinary RBP-4 was associated with rapid renal function decline in kidney transplant recipients [34]. High urinary level of RBP-4 was an independent predictor of progressive CKD during a 24-month follow-up in severe non-alcoholic fatty liver disease(NAFLD) patients with hypertension [35].
GSTs are a superfamily of ubiquitous detoxification isoenzymes that conjugate substrates to reduced glutathione [15]. Our study did not reveal the elevation of urinary excretion of GST-α1 in patients with T2D. Groups of participants with albuminuric and non-albuminuric CKD did not demonstrate changes in urinary excretion of GST-α1 either. Similar results were obtained in patients with type 1 diabetes (T1D) [13]. The study with a larger number of participants (N = 457) with T2D, T1D, and other types of diabetes and prediabetes also failed to demonstrate the difference in urinary excretion of GST-α between individuals with different grades of albuminuria [16].
We found increased urinary excretion of GST-π in patients with T2D; this increase was associated with albuminuria regardless of renal function. Increased urinary excretion of GST-π can be a result of the enzyme release from damaged tubular cells into urine [13,14,16]. Thus, elevated urinary GST-π may indicate damage of distal tubules in patients with long-term T2D and increased albuminuria.

4.2. TGF-β, Col1, and Col4

TGF-β is a key signaling molecule in the development of renal fibrosis [17,18,21]. Increased urinary excretion of TGF-β may reflect an increase inTGF-β production in the kidney [36]. The elevated excretion of TGF-β was described previously in patients with T1D [37,38] and T2D [39].
In our study, we failed to find any differences in urinary TGF-β between control subjects and patients with diabetes, as well as between patients with albuminuric and non-albuminuric CKD. The decreased renal production and urinary excretion of TGF-β were observed previously under an ACE inhibitor administration in rats with subtotal renal ablation [40]. Similarly, treatment with losartan reduced urinary excretion of TGF-β in patients with T2D [41,42]. In our study, the vast majority of patients were treated with renin-angiotensin system blockers. This may explain the lack of intergroup differences in the excretion of this factor.
Col1 is considered to be a component of normal kidney interstitium and glomerular basement membrane. The deposition of Col1 in these renal compartments is increased intubulo interstitial fibrosis. Glomerulosclerosis is associated with de novo expression of Col1in the mesangial matrix [19]. In a large multicenter prospective study (N = 1767, including 935 patients with diabetes),associations of urinary excretion of Col1 α1-chain with baseline eGFR, stage of CKD, and eGFR slope per year were demonstrated [20]. Our study did not reveal the association between eGFR and urinary Col1, while we found a strong association with albuminuria. In a previous cross-sectional study, an association between serum concentrations of carboxy-terminal propeptide of type I procollagen and albuminuria was found in patients with T2D [43].
Col4 is a major component of the glomerular and tubular basal membrane and mesangial matrix [18]. An association between urinary excretion of Col4 and albuminuria was revealed in some previous studies that enrolled patients with diabetes [44,45,46].These findings are in agreement with our results demonstrating increased urinary Col4 excretion in T2D patients with an albuminuric pattern of CKD. At the same time, we found no association between the excretion of Col4 and eGFR. The lack of association between urinary Col4 and eGFR was also noted in a cross-sectional study involving1554 individuals with diabetes [47] and in a prospective study with 1067 participants without diabetes in Japan [48]. However, high urinary excretion of Col4 was recognized as a risk factor for progressive renal function decline in the non-diabetic population [48].
Col1 and Col4 are considered as molecules associated with kidney fibrosis [19]. In turn, renal fibrosis is a determinant of CKD progression [49]. In our study, the urinary excretion of Col1 and Col4 was higher in albuminuric patterns of CKD. The data correspond to the results of studies demonstrating that patients with non-albuminuric CKD have a lower risk of CKD progression compared to those with elevated albuminuria [50,51].

4.3. BMP-7 and HGF

BMP-7, a member of the TGF-β superfamily, demonstrated an anti-fibrotic effect in diabetic nephropathy [52]. It was found that overexpression of renal BMP-7 can inhibit TGF-β/Smad3 signaling and protect the kidney from TGF-β-mediated injury [53,54]. BMP-7 represses albumin-induced chemokine synthesis in tubular epithelial cells through the destabilization of NF-κB-inducing kinase [55]. In this study, we revealed hyperexcretion of BMP-7 in patients with T2D, mainly in those with preserved renal function. Therefore, it can be assumed that the increase in BMP-7 synthesis in diabetic kidneys is a protective event.
In experimental models of diabetic nephropathy, a decreased expression of BMP-7 was found in mesangial cells and renal tissues [56,57]. A high level of BMP-7 expression in proximal tubules and podocytes was revealed at the early stages of human diabetic nephropathy; however, low expression of BMP-7 was found at advanced stages of the disease [58]. The increased expression of BMP-7 was noted under pitavastatin treatment in podocyte cell culture [59] and streptozotocin-induced diabetes in Wistar rats [60]. In our study, a substantial proportion of participants with T2D were treated with statins. Therefore, the effect of treatment on factor synthesis cannot be ruled out.
HGF is a multifunctional cytokine that plays an important role in development, regeneration, and tissue repair [23,54]. In the diabetic kidney, HGF targets glomerular cells and reduces both glomerular and tubulointerstitial fibrosis [23,61].Another possible mechanism involves the activation of autophagy-lysosome pathwaysin podocytes [55,62,63].Unexpectedly, we found elevated excretion of HGF in patients with T2D, especially in those with albuminuric CKD. We also found an association between urinary HGF and albuminuria in the logistic regression model. Therefore, the role of HGF in the pathogenesis of diabetic kidney diseases needs further research.

4.4. Why do Urinary Markers Play Differently in Albuminuric and Non-Albuminuric CKD?

Various hypotheses can be proposed to explain the preferential association of the studied renal markers with the albuminuric phenotype of CKD.
Albuminuria is considered to be the result of an increased glomerular filter permeability and disrupted tubular absorption of albumin [64]. Similar to RBP-4, urinary albumin is reabsorbed by megalin in tubules [65,66]. As a result, elevated urinary excretion of the studied molecules could be a consequence of higher glomerular barrier permeability or disrupted tubular reabsorption of these proteins. Disrupted reabsorption is the most probable pathway for elevated urinary excretion of RBP-4 [27]. However, higher serum RBP-4 was described in patients with T2D previously [66].
Some molecules can enter the urine from damaged kidney structures. This could be a probable explanation for elevated excretion of GST-π, a marker of a tubular injury [13,14,16], Col1, a component of the mesangial matrix in glomerulosclerosis, glomerular basal membrane and interstitium [19], and Col4, a component of the glomerular and tubular basal membrane [16,19].
One could speculate that altered bone metabolism may contribute to the elevation of urinary Col1 excretion in albuminuric patients with diabetesand CKD. However, previously, aninverse association of UACR with bone turnover markers, such as procollagen type 1 N-terminal propeptide (P1NP) and β-C-terminal telopeptide of type I collagen (β-CTx),was reported [67].
Finally, activation of the synthesis of the studied molecules in the kidney may increase their urinary concentrations. Elevated production of BMP-7 in renal tissues was demonstrated previously at the early stages of diabetic nephropathy [58] and under statin treatment [59,60]. Increased renal expression of Col1 and Col4 has been recognized as a sign of diabetic nephropathy [19]. The association between renal expression and urinary excretion of Col4 was described [68].

4.5. Limitations of the Study

Our study is not without limitations. Due to the variability in albuminuria and eGFR, some patients could be misclassified when divided into groups. Some intergroup differences may not have been found due to the limited sample size. The cross-sectional design is another obvious limitation. Future prospective studies are needed to elucidate the value of urinary RBP-4, GST-π, Col1, Col4, BMP-7, and HGF as predictors of albuminuric and non-albuminuric CKD in T2D subjects.

5. Conclusions

Patients with T2D have elevated urinary excretion of markers of tubular injury (RBP-4, GST-π), renal fibrosis (Col1, Col4), and antifibrotic growth factors (BMP-7, HGF). In these patients, urinary RBP-4, GST-π, Col1, Col4, and HGF areassociated with albuminuria independently from renal function. The identification of markers of non-albuminuric CKD in T2D remains a challenge for future research.

Author Contributions

Conceptualization, V.V.K.; methodology, V.V.K. and V.V.R.; software, A.I.K.; validation, V.V.K. and V.V.R.; formal analysis, A.I.K.; investigation, A.I.K. and V.V.R.; resources, V.V.K.; data curation, A.I.K.; writing—original draft preparation, A.I.K. and V.V.K.; writing—review and editing, V.V.K.; visualization, A.I.K.; supervision, V.V.K.; project administration, V.V.K.; funding acquisition, V.V.K. All authors have read and agreed to the published version of the manuscript.

Funding

The study was carried out at the expense of the state funding of the RICEL—Branch of IC&G SB RAS.

Institutional Review Board Statement

The study was conducted in accordance with the Declaration of Helsinki, and approved by the Ethics Committee of RICEL—Branch of IC&G SB RAS (Protocol 88, 22 November 2012).

Informed Consent Statement

Informed consent was obtained from all subjects involved in the study.

Data Availability Statement

The data presented in this study are available on request from the corresponding author.

Conflicts of Interest

The authors declare no conflict of interest. The funders had no role in the design of the study; in the collection, analyses, or interpretation of data; in the writing of the manuscript; or in the decision to publish the results.

References

  1. Viazzi, F.; Russo, G.T.; Ceriello, A.; Fioretto, P.; Giorda, C.; De Cosmo, S.; Pontremoli, R. Natural history and risk factors for diabetic kidney disease in patients with T2D: Lessons from the AMD-annals. J. Nephrol. 2019, 32, 517–525. [Google Scholar] [CrossRef] [PubMed]
  2. Klimontov, V.V.; Korbut, A.I. Albuminuric and non-albuminuric patterns of chronic kidney disease in type 2 diabetes. Diabetes Metab.Syndr. 2019, 13, 474–479. [Google Scholar] [CrossRef] [PubMed]
  3. Pugliese, G.; Solini, A.; Bonora, E.; Fondelli, C.; Orsi, E.; Nicolucci, A.; Penno, G.; RIACE Study Group. Chronic kidney disease in type 2 diabetes: Lessons from the renal insufficiency and cardiovascular events (RIACE) Italian multicentre study. Nutr. Metab. Cardiovasc. Dis. 2014, 24, 815–822. [Google Scholar] [CrossRef] [PubMed]
  4. Mottl, A.K.; Kwon, K.-S.; Mauer, M.; Mayer-Davis, E.J.; Hogan, S.L.; Kshirsagar, A.V. Normoalbuminuric diabetic kidney disease in the U.S. population. J. Diabetes Complicat. 2013, 27, 123–127. [Google Scholar] [CrossRef] [Green Version]
  5. Korbut, A.I.; Klimontov, V.V.; Vinogradov, I.V.; Romanov, V.V. Risk factors and urinary biomarkers of non-albuminuric and albuminuric chronic kidney disease in patients with type 2 diabetes. World J. Diabetes 2019, 10, 517–533. [Google Scholar] [CrossRef]
  6. Buyadaa, O.; Salim, A.; Morton, J.I.; Jandeleit-Dahm, K.; Magliano, D.J.; Shaw, J.E. Examining the factors contributing to the association between non-albuminuric CKD and a low rate of kidney function decline in diabetes. Ther. Adv. Endocrinol. Metab. 2022, 13, 20420188221083518. [Google Scholar] [CrossRef]
  7. Ekinci, E.I.; Jerums, G.; Skene, A.; Crammer, P.; Power, D.; Cheong, K.Y.; Panagiotopoulos, S.; McNeil, K.; Baker, S.T.; Fioretto, P.; et al. Renal structure in normoalbuminuric and albuminuric patients with type 2 diabetes and impaired renal function. Diabetes Care 2013, 36, 3620–3626. [Google Scholar] [CrossRef] [Green Version]
  8. Barutta, F.; Bellini, S.; Canepa, S.; Durazzo, M.; Gruden, G. Novel biomarkers of diabetic kidney disease: Current status and potential clinical application. Acta Diabetol. 2021, 58, 819–830. [Google Scholar] [CrossRef]
  9. Lin, Y.-C.; Chang, Y.-H.; Yang, S.-Y.; Wu, K.-D.; Chu, T.-S. Update of pathophysiology and management of diabetic kidney disease. J. Formos. Med. Assoc. 2018, 117, 662–675. [Google Scholar] [CrossRef] [PubMed]
  10. Thakur, V.; Chattopadhyay, M. Early urinary markers for diabetic and other kidney diseases. Curr. Drug Targets 2018, 19, 825–831. [Google Scholar] [CrossRef] [PubMed]
  11. Klimontov, V.V.; Korbut, A.I.; Orlov, N.B.; Dashkin, M.V.; Konenkov, V.I. Multiplex bead array assay of a panel of circulating cytokines and growth factors in patients with albuminuric and non-albuminuric diabetic kidney disease. J. Clin. Med. 2020, 9, 3006. [Google Scholar] [CrossRef] [PubMed]
  12. Norden, A.G.; Lapsley, M.; Unwin, R.J. Urine retinol-binding protein 4: A functional biomarker of the proximal renal tubule. Adv. Clin. Chem. 2014, 63, 85–122. [Google Scholar] [CrossRef] [PubMed]
  13. Von Scholten, B.J.; Theilade, S.; Lajer, M.; Rossing, P. Urinary alpha- and Pi-glutathione s-transferases in adult patients with type 1 diabetes. Nephron Extra 2014, 4, 127–133. [Google Scholar] [CrossRef] [PubMed]
  14. Branten, A.J.; Mulder, T.P.; Peters, W.H.; Assmann, K.J.; Wetzels, J.F. Urinary excretion of glutathione S transferases alpha and Pi in patients with proteinuria: Reflection of the site of tubular injury. Nephron 2000, 85, 120–126. [Google Scholar] [CrossRef] [PubMed]
  15. Faustino, L.C.; Almeida, N.A.S.; Pereira, G.F.; Ramos, R.G.; Soares, R.M.; Morales, M.M.; Pazos-Moura, C.C.; Ortiga-Carvalho, T.M. Thyroid hormone and estradiol have overlapping effects on kidney glutathione S-transferase-α gene expression. Am. J. Physiol. Endocrinol. Metab. 2012, 303, E787–E797. [Google Scholar] [CrossRef] [PubMed] [Green Version]
  16. Cawood, T.J.; Bashir, M.; Brady, J.; Murray, B.; Murray, P.T.; O’Shea, D. Urinary collagen IV and πGST: Potential biomarkers for detecting localized kidney injury in diabetes—A pilot study. Am. J. Nephrol. 2010, 32, 219–225. [Google Scholar] [CrossRef] [PubMed]
  17. Meng, X.-M.; Nikolic-Paterson, D.J.; Lan, H.Y. TGF-β: The master regulator of fibrosis. Nat. Rev. Nephrol. 2016, 12, 325–338. [Google Scholar] [CrossRef]
  18. Isaka, Y. Targeting TGF-β signaling in kidney fibrosis. Int. J. Mol. Sci. 2018, 19, 2532. [Google Scholar] [CrossRef] [PubMed] [Green Version]
  19. Bülow, R.D.; Boor, P. Extracellular matrix in kidney fibrosis: More than just a scaffold. J. Histochem. Cytochem. 2019, 67, 643–661. [Google Scholar] [CrossRef] [Green Version]
  20. Schanstra, J.P.; Zürbig, P.; Alkhalaf, A.; Argiles, A.; Bakker, S.J.L.; Beige, J.; Bilo, H.J.G.; Chatzikyrkou, C.; Dakna, M.; Dawson, J.; et al. Diagnosis and prediction of CKD progression by assessment of urinary peptides. J. Am. Soc. Nephrol. 2015, 26, 1999–2010. [Google Scholar] [CrossRef]
  21. Manson, S.R.; Austin, P.F.; Guo, Q.; Moore, K.H. BMP-7 signaling and its critical roles in kidney development, the responses to renal injury, and chronic kidney disease. Vitam. Horm. 2015, 99, 91–144. [Google Scholar] [CrossRef] [PubMed]
  22. Tsujimura, T.; Idei, M.; Yoshikawa, M.; Takase, O.; Hishikawa, K. Roles and regulation of bone morphogenetic protein-7 in kidney development and diseases. World J. Stem Cells 2016, 8, 288–296. [Google Scholar] [CrossRef] [PubMed]
  23. Mizuno, S.; Matsumoto, K.; Nakamura, T. HGF as a renotrophic and anti-fibrotic regulator in chronic renal disease. Front. Biosci. 2008, 13, 7072–7086. [Google Scholar] [CrossRef] [PubMed] [Green Version]
  24. Gaião, S.M.; de Carvalho Paiva, J.A.O. Biomarkers of renal recovery after acute kidney injury. Rev. Bras. Ter. Intensiv. 2017, 29, 373–381. [Google Scholar] [CrossRef] [PubMed]
  25. Noordzij, M.; Dekker, F.W.; Zoccali, C.; Jager, K.J. Sample size calculations. Nephron Clin. Pract. 2011, 118, c319–c323. [Google Scholar] [CrossRef] [Green Version]
  26. Serdar, C.C.; Cihan, M.; Yücel, D.; Serdar, M.A. Sample size, power and effect size revisited: Simplified and practical approaches in pre-clinical, clinical and laboratory studies. Biochem. Med. 2021, 31, 27–53. [Google Scholar] [CrossRef]
  27. Steinhoff, J.S.; Lass, A.; Schupp, M. Biological functions of RBP4 and its relevance for human diseases. Front. Physiol. 2021, 12, 659977. [Google Scholar] [CrossRef]
  28. Xun, C.; Zhao, Y.; Wang, W.; Chen, C. Circulating RBP4 increase and its diagnosis of chronic kidney disease. Ann. Clin. Lab. Sci. 2018, 48, 205–207. [Google Scholar]
  29. Domingos, M.A.M.; Queiroz, M.; Lotufo, P.A.; Benseñor, I.J.; de Oliveira Titan, S.M. Serum RBP4 and CKD: Association with Insulin Resistance and Lipids. J. Diabetes Complicat. 2017, 31, 1132–1138. [Google Scholar] [CrossRef]
  30. Park, S.E.; Lee, N.S.; Park, J.W.; Rhee, E.-J.; Lee, W.-Y.; Oh, K.-W.; Park, S.-W.; Park, C.-Y.; Youn, B.-S. Association of urinary RBP4 with insulin resistance, inflammation, and microalbuminuria. Eur. J. Endocrinol. 2014, 171, 443–449. [Google Scholar] [CrossRef] [Green Version]
  31. Nielsen, R.; Christensen, E.I.; Birn, H. Megalin and cubilin in proximal tubule protein reabsorption: From experimental models to human disease. Kidney Int. 2016, 89, 58–67. [Google Scholar] [CrossRef] [PubMed]
  32. Mori, K.P.; Yokoi, H.; Kasahara, M.; Imamaki, H.; Ishii, A.; Kuwabara, T.; Koga, K.; Kato, Y.; Toda, N.; Ohno, S.; et al. Increase of total nephron albumin filtration and reabsorption in diabetic nephropathy. J. Am. Soc. Nephrol. 2017, 28, 278–289. [Google Scholar] [CrossRef] [PubMed] [Green Version]
  33. Kurosaki, Y.; Imoto, A.; Kawakami, F.; Yokoba, M.; Takenaka, T.; Ichikawa, T.; Katagiri, M.; Ishii, N. Oxidative stress increases megalin expression in the renal proximal tubules during the normoalbuminuric stage of diabetes mellitus. Am. J. Physiol. Renal. Physiol. 2018, 314, F462–F470. [Google Scholar] [CrossRef] [Green Version]
  34. Jeon, H.J.; Shin, D.H.; Oh, J.; Kee, Y.K.; Park, J.Y.; Ko, K.; Lee, S. Urinary retinol-binding protein 4 is associated with renal function and rapid renal function decline in kidney transplant recipients. Transplant. Proc. 2022, 54, 362–366. [Google Scholar] [CrossRef]
  35. Tsai, Y.-L.; Liu, C.-W.; Huang, S.-F.; Yang, Y.-Y.; Lin, M.-W.; Huang, C.-C.; Li, T.-H.; Huang, Y.-H.; Hou, M.-C.; Lin, H.-C. Urinary fatty acid and retinol binding protein-4 predict CKD progression in severe NAFLD patients with hypertension: 4-year study with clinical and experimental approaches. Medicine 2020, 99, e18626. [Google Scholar] [CrossRef] [PubMed]
  36. Rivarola, E.W.; Moyses-Neto, M.; Dantas, M.; Da-Silva, C.G.; Volpini, R.; Coimbra, T.M. Transforming growth factor beta activity in urine of patients with type 2 diabetes and diabetic nephropathy. Braz. J. Med. Biol. Res. 1999, 32, 1525–1528. [Google Scholar] [CrossRef] [PubMed] [Green Version]
  37. Bondar’, I.A.; Klimontov, V.V.; Nadeev, A.P. Urinary excretion of proinflammatory cytokines and transforming growth factor beta at early stages of diabetic nephropathy. Ter. Arkhiv 2008, 80, 52–56. [Google Scholar]
  38. Bondar’, I.A.; Klimontov, V.V.; Parfent’eva, E.M.; Romanov, V.V.; Nadeev, A.P. Urinary excretion of fibrogenic and antifibrotic growth factors in type 1 diabetic patients: The interrelationship with diabetic nephropathy. Ter. Arkhiv 2012, 84, 36–40. [Google Scholar]
  39. Sato, H.; Iwano, M.; Akai, Y.; Kurioka, H.; Kubo, A.; Yamaguchi, T.; Hirata, E.; Kanauchi, M.; Dohi, K. Increased excretion of urinary transforming growth factor beta 1 in patients with diabetic nephropathy. Am. J. Nephrol. 1998, 18, 490–494. [Google Scholar] [CrossRef]
  40. Monteiro de Freitas, A.S.; Coimbra, T.M.; Costa, R.S.; Baroni, E.A. Urinary transforming growth factor-beta (TGF-beta) excretion and renal production of TGF-beta in rats with subtotal renal ablation: Effect of enalapril and nifedipine. Nephron 1998, 78, 302–309. [Google Scholar] [CrossRef]
  41. Esmatjes, E.; Flores, L.; Iñigo, P.; Lario, S.; Ruilope, L.M.; Campistol, J.M. Effect of losartan on TGF-Beta1 and urinary albumin excretion in patients with type 2 diabetes mellitus and microalbuminuria. Nephrol. Dial. Transplant. 2001, 16, 90–93. [Google Scholar] [CrossRef] [PubMed] [Green Version]
  42. Houlihan, C.A.; Akdeniz, A.; Tsalamandris, C.; Cooper, M.E.; Jerums, G.; Gilbert, R.E. Urinary transforming growth factor-beta excretion in patients with hypertension, type 2 diabetes, and elevated albumin excretion rate: Effects of angiotensin receptor blockade and sodium restriction. Diabetes Care 2002, 25, 1072–1077. [Google Scholar] [CrossRef] [PubMed] [Green Version]
  43. Inukai, T.; Fujiwara, Y.; Tayama, K.; Aso, Y.; Takemura, Y. Serum levels of carboxy-terminal propeptide of human type I procollagen are an indicator for the progression of diabetic nephropathy in patients with type 2 diabetes mellitus. Diabetes Res. Clin. Pract. 2000, 48, 23–28. [Google Scholar] [CrossRef]
  44. Klimontov, V.V.; Eremenko, N.V.; Myakina, N.E.; Fazullina, O.N. Cystatin C and collagen type IV in diagnostics of chronic kidney disease in type 2 diabetic patients. Diabetes Mellit. 2015, 18, 87–93. [Google Scholar] [CrossRef] [Green Version]
  45. Nakamura, T.; Ushiyama, C.; Suzuki, S.; Shimada, N.; Sekizuka, K.; Ebihara, L.; Koide, H. Effect of troglitazone on urinary albumin excretion and serum type IV collagen concentrations in type 2 diabetic patients with microalbuminuria or macroalbuminuria. Diabet. Med. 2001, 18, 308–313. [Google Scholar] [CrossRef]
  46. Nie, J.-M.; Li, H.-F. Therapeutic effects of salvia miltiorrhiza injection combined with telmisartan in patients with diabetic nephropathy by influencing collagen IV and fibronectin: A case-control study. Exp. Ther. Med. 2018, 16, 3405–3412. [Google Scholar] [CrossRef] [PubMed] [Green Version]
  47. Takamatsu, N.; Abe, H.; Tominaga, T.; Nakahara, K.; Ito, Y.; Okumoto, Y.; Kim, J.; Kitakaze, M.; Doi, T. Risk factors for chronic kidney disease in Japan: A community-based study. BMC Nephrol. 2009, 10, 34. [Google Scholar] [CrossRef] [Green Version]
  48. Kishi, F.; Nagai, K.; Takamatsu, N.; Tominaga, T.; Tamaki, M.; Shibata, E.; Murakami, T.; Kishi, S.; Abe, H.; Koezuka, Y.; et al. Urinary type IV collagen excretion is involved in the decline in estimated glomerular filtration rate in the Japanese general population without diabetes: A 5-year observational study. PLoS ONE 2018, 13, e0195523. [Google Scholar] [CrossRef] [Green Version]
  49. Hung, P.-H.; Hsu, Y.-C.; Chen, T.-H.; Lin, C.-L. Recent advances in diabetic kidney diseases: From kidney injury to kidney fibrosis. Int. J. Mol. Sci. 2021, 22, 11857. [Google Scholar] [CrossRef]
  50. Koye, D.N.; Magliano, D.J.; Reid, C.M.; Jepson, C.; Feldman, H.I.; Herman, W.H.; Shaw, J.E. Risk of progression of nonalbuminuric CKD to end-stage kidney disease in people with diabetes: The CRIC (Chronic Renal Insufficiency Cohort) study. Am. J. Kidney Dis. 2018, 72, 653–661. [Google Scholar] [CrossRef] [Green Version]
  51. Go, A.S.; Yang, J.; Tan, T.C.; Cabrera, C.S.; Stefansson, B.V.; Greasley, P.J.; Ordonez, J.D.; Kaiser Permanente Northern California. CKD outcomes study contemporary rates and predictors of fast progression of chronic kidney disease in adults with and without diabetes mellitus. BMC Nephrol. 2018, 19, 146. [Google Scholar] [CrossRef] [PubMed] [Green Version]
  52. Liu, L.; Wang, Y.; Yan, R.; Liang, L.; Zhou, X.; Liu, H.; Zhang, X.; Mao, Y.; Peng, W.; Xiao, Y.; et al. BMP-7 inhibits renal fibrosis in diabetic nephropathy via MiR-21 downregulation. Life Sci. 2019, 238, 116957. [Google Scholar] [CrossRef] [PubMed]
  53. Meng, X.-M.; Chung, A.C.K.; Lan, H.Y. Role of the TGF-β/BMP-7/Smad pathways in renal diseases. Clin. Sci. 2013, 124, 243–254. [Google Scholar] [CrossRef]
  54. Lv, W.; Booz, G.W.; Wang, Y.; Fan, F.; Roman, R.J. Inflammation and renal fibrosis: Recent developments on key signaling molecules as potential therapeutic targets. Eur. J. Pharmacol. 2018, 820, 65–76. [Google Scholar] [CrossRef]
  55. Lim, A.I.; Chan, L.Y.Y.; Tang, S.C.W.; Yiu, W.H.; Li, R.; Lai, K.N.; Leung, J.C.K. BMP-7 Represses albumin-induced chemokine synthesis in kidney tubular epithelial cells through destabilization of NF-ΚB-inducing kinase. Immunol. Cell Biol. 2014, 92, 427–435. [Google Scholar] [CrossRef] [PubMed]
  56. Yeh, C.H.; Chang, C.K.; Cheng, M.F.; Lin, H.J.; Cheng, J.T. Decrease of bone morphogenetic protein-7 (BMP-7) and its type II receptor (BMP-RII) in kidney of type 1-like diabetic rats. Horm. Metab. Res. 2009, 41, 605–611. [Google Scholar] [CrossRef] [PubMed]
  57. Feng, Y.; Jin, M.-Y.; Liu, D.-W.; Wei, L. Bone morphogenetic protein (BMP) 7 expression is regulated by the E3 ligase UBE4A in diabetic nephropathy. Arch. Physiol. Biochem. 2020, 126, 416–419. [Google Scholar] [CrossRef] [PubMed]
  58. Ivanac-Janković, R.; Ćorić, M.; Furić-Čunko, V.; Lovičić, V.; Bašić-Jukić, N.; Kes, P. BMP-7 protein expression is downregulated in human diabetic nephropathy. Acta Clin. Croat. 2015, 54, 164–168. [Google Scholar]
  59. Ohigashi, M.; Kobara, M.; Takahashi, T.; Toba, H.; Wada, T.; Nakata, T. Pitavastatin suppresses hyperglycaemia-induced podocyte injury via bone morphogenetic protein-7 preservation. Clin. Exp. Pharmacol. Physiol. 2017, 44, 378–385. [Google Scholar] [CrossRef] [PubMed]
  60. Ohigashi, M.; Imai, N.; Toba, H.; Kobara, M.; Nakata, T. Pitavastatin exhibits protective effects on podocytes accompanied by BMP-7 up-regulation and rho suppression. Pharmacology 2016, 97, 265–276. [Google Scholar] [CrossRef]
  61. Mizuno, S.; Nakamura, T. Suppressions of chronic glomerular injuries and TGF-beta 1 production by HGF in attenuation of murine diabetic nephropathy. Am. J. Physiol. Renal. Physiol. 2004, 286, F134–F143. [Google Scholar] [CrossRef] [Green Version]
  62. Zhang, C.; Hou, B.; Yu, S.; Chen, Q.; Zhang, N.; Li, H. HGF alleviates high glucose-induced injury in podocytes by GSK3β inhibition and autophagy restoration. Biochim. Biophys. Acta 2016, 1863, 2690–2699. [Google Scholar] [CrossRef]
  63. Hou, B.; Li, Y.; Li, X.; Zhang, C.; Zhao, Z.; Chen, Q.; Zhang, N.; Li, H. HGF protected against diabetic nephropathy via autophagy-lysosome pathway in podocyte by modulating PI3K/Akt-GSK3β-TFEB axis. Cell. Signal. 2020, 75, 109744. [Google Scholar] [CrossRef] [PubMed]
  64. Moriyama, T.; Karasawa, K.; Nitta, K. The role of caveolae on albumin passage through glomerular endothelial and epithelial cells: The new etiology of urinary albumin excretion. Contrib. Nephrol. 2018, 195, 1–11. [Google Scholar] [CrossRef] [PubMed]
  65. Molitoris, B.A.; Sandoval, R.M.; Yadav, S.P.S.; Wagner, M.C. Albumin uptake and processing by the proximal tubule: Physiological, pathological, and therapeutic implications. Physiol. Rev. 2022, 102, 1625–1667. [Google Scholar] [CrossRef] [PubMed]
  66. Olsen, T.; Blomhoff, R. Retinol, retinoic acid, and retinol-binding protein 4 are differentially associated with cardiovascular disease, type 2 diabetes, and obesity: An overview of human studies. Adv. Nutr. 2020, 11, 644–666. [Google Scholar] [CrossRef]
  67. Ren, H.; Ma, X.; Shao, Y.; Han, J.; Yang, M.; Wang, Q. Correlation between serum MiR-154-5p and osteocalcin in males and postmenopausal females of type 2 diabetes with different urinary albumin creatinine ratios. Front. Endocrinol. 2019, 10, 542. [Google Scholar] [CrossRef]
  68. Okonogi, H.; Nishimura, M.; Utsunomiya, Y.; Hamaguchi, K.; Tsuchida, H.; Miura, Y.; Suzuki, S.; Kawamura, T.; Hosoya, T.; Yamada, K. Urinary type IV collagen excretion reflects renal morphological alterations and type IV collagen expression in patients with type 2 diabetes mellitus. Clin. Nephrol. 2001, 55, 357–364. [Google Scholar]
Figure 1. Urinary excretion of tubular markers in patients with T2D and different patterns of CKD. RBP-4, retinol-binding protein 4 (μg/mmol); GST-α1, glutation-S-transferase α1 (ng/mmol); GST-π, glutation-S-transferase π (ng/mmol); * p < 0.05, ** p < 0.01, *** p < 0.001 vs. control group, # p < 0.05 vs. NRF/NA; § p < 0.05 vs. DRF/NA (Mann-Whitney U-test or Kruskal-Wallis H-test for comparison of two groups or multiple comparisons, respectively).
Life 13 00343 g001
Figure 2. Urinary excretion of TGF-β, Col1 andCol4 in patients with T2D and different patterns of CKD. Col1, type I collagen (pg/mmol); Col4, type IV collagen (ng/mmol); TGF-β, transforming growth factor β (ng/mmol); * p < 0.05, ** p < 0.01 vs. control group, ## p < 0.01 vs. NRF/NA group, §§ p < 0.01, §§§ p < 0.001 vs. DRF/NA (Mann-Whitney U-test or Kruskal-Wallis H-test for comparison of two groups or multiple comparisons, respectively).
Life 13 00343 g002
Figure 3. Urinary excretion of BMP-7 and HGF in patients with T2D and different patterns of CKD. BMP-7, bone morphogenetic protein 7, μg/mmol; HGF, hepatocyte growth factor, ng/mmol. * p< 0.05, *** p < 0.001 vs. control group, § p < 0.05 vs. DRF/NA group (Mann-Whitney U-test or Kruskal-Wallis H-test for comparison of two groups or multiple comparisons, respectively).
Life 13 00343 g003
Table 1. Patient groups.
GroupeGFRUACRN
NRF/NA≥60 mL/min/1.73 m2<3.0 mg/mmol35
DRF/NA<60 mL/min/1.73 m2≥3.0 mg/mmol35
NRF/EA≥60 mL/min/1.73 m2<3.0 mg/mmol35
DRF/EA<60 mL/min/1.73 m2≥3.0 mg/mmol35
eGFR, estimated glomerular filtration rate; UACR, urinary albumin-to-creatinine ratio; NRF, normal renal function; NA, normal albuminuria; DRF, decreased renal function; EA, elevated albuminuria.
Table 2. Clinical characteristics of patients with T2D and different patterns of CKD.
ParameterNRF/NADRF/NANRF/EADRF/EA
N35353535
Age, years64 (58–71)65 (58–67)64 (58–68)66 (58–72)
Sex, m/f (n, %)12/23 (34.3/65.7)12/23 (34.3/65.7)13/22 (37.1/62.9)12/23 (34.3/65.7)
Body weight, kg88 (75–98)95 (80–104)95 (80–108)88 (73–100)
BMI, kg/m234.4 (28.1–38)34.1 (30.1–37.5)33.3 (30.8–39.6)32.2 (28.8–36.2)
Obesity, n (%)23 (65.7)26 (74.3)27 (77.1)25 (71.4)
Waist circumference, cm110 (99–130)115 (106–123)110 (105–124)107 (104–112)
WHR0.97 (0.93–1.10)1.05 (0.90–1.10)1.00 (0.93–1.09)1.00 (0.91–1.07)
Current smokers, n (%)3 (8.6)4 (11.4)5 (14.3)3 (8.6)
Duration of T2D, years12 (10–17)13 (10–20)14 (10–17)14.5(11–18)
Insulin, n (%)23 (65.7)23 (65.7)23 (65.7)26 (74.8)
Metformin, n (%)28 (80.0)22 (62.8)24 (68.6)20 (57.1)
SU, n (%)9 (25.7)14 (40.8)14 (40.0)11 (31.4)
ACE inhibitors or ARBs, n (%)24 (68.6)29 (82.9)28 (80.0)30 (85.7)
Statins, n (%)14 (40.0)26 (74.3)17 (48.6)19 (54.3)
HbA1C, %8.48 (7.5–10.3)8.8 (7.88–9.81)9.37 (8.17–11.8) §8.39 (7.46–9.53)
HbA1C, mmol/mol69.2 (58.5–88.8)72.7 (62.6–83.7)78.9 (65.8–105) §68.1 (58–80.6)
CKD G1/G2/G3a/G3b, n (%)10/25/0/0
(28.6/71.4/0/0)
0/0/23/12
(0/0/65.7/34.3)
3/32/0/0
(8.6/91.4/0/0)
0/0/23/12
(0/0/65.7/34.3)
eGFR, mL/min/1.73 m284 (71–94)51 (45–55) ***70 (65–78)51 (43–54) ***
UACR, mg/mmol0.6 (0.3–0.9)0.65 (0.45–0.9)10.5 (6.3–36.7) ###12.0 (6.3–80.6) ###
CKD A1/A2/A3, n (%)35/0/0 (100/0/0)35/0/0 (100/0/0)0/23/12 (0/65.7/34.3)0/25/10 (0/71.4/28.6)
Protein excretion, g/day0.07 (0.05–0.1)0.07 (0.05–0.15)0.17 (0.09–0.53) ###0.2 (0.13–0.52) ###
Diabetic retinopathy, n (%)19 (54.3)19 (54.3)23 (65.7)24 (65.7)
Arterial hypertension, n (%)33 (94.3)35 (100)34 (97.1)35 (100)
Myocardial infarction in medical history, n (%)4 (11.4)7 (20.0)5 (14.3)11 (31.4)
Chronic heart failure NYHA class III/IV, n (%)0 (0)2 (5.7)5 (14.3)1 (2.9)
Cerebrovascular event in medical history, n (%)1 (2.9)7 (20.0)3 (8.6)3 (8.6)
Peripheral artery disease, n (%)19 (54.3)25 (71.4)22 (62.9)25 (71.4)
Continual parameters are presented as medians (interquartile range). Categorical data are presented as numbers (n) and percentage. § p < 0.05 vs. NRF/NA group (Mann-Whitney U-test), *** p < 0,001 vs. NRF/NA and DRF/NA groups, ### p < 0.001 vs. NRF/NA and NRF/EA groups (Kruskal–Wallis H test); ACE, angiotensin-converting enzyme; ARBs, angiotensin II receptor blockers; BMI, body mass index; eGFR, estimated glomerular filtration rate; HbA1C, hemoglobin A1C; SU, sulfonylurea; T2D, type 2 diabetes; UACR, urinary albumin-to-creatinine ratio; WHR, waist-to-hip ratio.
Table 3. Factors associated with albuminuria in patients with T2D.
ParameterAdjusted OR95% CIp-Value
Urinary RBP-4, μg/mmol1.111.02–1.210.02
Urinary Col1, pg/mmol1.161.01–1.320.03
Urinary HGF, ng/mmol1.081.01–1.150.03
The results of logistic regression analysis. CI, confidence interval; OR, odds ratio. Parameters of the model with RBP-4: KS p-value < 0.001, area under ROC curve (AUC) = 0.71, sensitivity (Se) = 0.63, specificity (Sp) = 0.66for cut-off point LP = 0.47, coefficients β: intercept (β0) = −3.09 (p>0.05), for RBP-4 = 0.10 (p = 0.02), for age = 0.023 (p > 0.05), for female sex = −0.019 (p > 0.05), for BMI = 0.0052 (p > 0.05), for duration of diabetes = −0.039 (p > 0.05), for HbA1C = 0.16 (p > 0.05). Parameters of the model with Col1: KS p-value = 0.003, AUC = 0.71, Se = 0.63, Sp = 0.63for LP = 0.473, coefficients β: β0 = −3.01 (p > 0.05), for Col1 = 0.15 (p = 0.03), for age = 0.025 (p > 0.05), for female sex = 0.059 (p > 0.05), for BMI = 0.00011 (p > 0.05), for duration of diabetes = −0.041 (p > 0.05), for HbA1C = 0.18 (p > 0.05). Parameters of the model with HGF: KS p-value = 0.005,AUC = 0.67, Se = 0.64, Sp = 0.61 for LP = 0.47; coefficients β: β0 = −3.34 (p > 0.05), for HGF = 0.075 (p = 0.03), for age = 0.016 (p > 0.05), for female sex = 0.15 (p > 0.05), for BMI = 0.011 (p > 0.05), for duration of diabetes = −0.034 (p > 0.05), for HbA1C = 0.20 (p = 0.047).
Table 4. Factors associated with albuminuric CKD patternsin patients with T2D.
ParameterAdjusted OR95% CIp-Value
NRF/EA
Urinary RBP-4, μg/mmol1.541.07–2.220.02
DRF/EA
Urinary RBP-4, μg/mmol1.361.02–1.830.04
Urinary Col1, pg/mmol1.431.03–2.000.03
The results of logistic regression analysis with stepwise selection. CI, confidence interval; OR, odds ratio. Parameters of the model of NRF/EA: KS p-value < 0.001, area under ROC curve (AUC) = 0.78, sensitivity (Se) = 0.71, specificity (Sp) = 0.69for cut-off point LP = 0.42; coefficients β: intercept (β0) = −1.47 (p > 0.05), for RBP-4 = 0.43 (p = 0.02), for age = −0.033 (p > 0.05), for female sex = 0.15 (p > 0.05), for BMI = 0.022 (p > 0.05), for duration of diabetes = −0.012 (p > 0.05), for HbA1C = 0.20 (p > 0.05). Parameters of the model of DRF/EA with RBP-4: KS p-value = 0.003, AUC = 0.73, Se = 0.67, Sp = 0.69 for LP = 0.42; coefficients β: β0 = −3.03 (p > 0.05), for RBP-4 = 0.31 (p = 0.04), for age = 0.037 (p > 0.05), for female sex = −0.26 (p > 0.05), for BMI = 0.0037 (p > 0.05), for duration of diabetes = −0.059 (p > 0.05), for HbA1C = 0.044 (p > 0.05). Parameters of the model of DRF/EA with Col1: KS p-value = 0.02, AUC = 0.72, Se = 0.64, Sp = 0.71for LP = 0.483; coefficients β: β0 = −3.01 (p > 0.05), for Col1 = 0.36 (p = 0.03), for age = 0.036 (p > 0.05), for female sex = 0.28 (p > 0.05), for BMI = −0.019 (p > 0.05), for duration of diabetes = −0.058 (p > 0.05), for HbA1C = 0.14 (p > 0.05).
Disclaimer/Publisher’s Note: The statements, opinions and data contained in all publications are solely those of the individual author(s) and contributor(s) and not of MDPI and/or the editor(s). MDPI and/or the editor(s) disclaim responsibility for any injury to people or property resulting from any ideas, methods, instructions or products referred to in the content.

