
Evaluation of Blood Levels of Omentin-1 and Orexin-A in Adults with Obstructive Sleep Apnea: A Systematic Review and Meta-Analysis


 , , ,
, , , 
Abstract
1. Introduction
2. Materials and Methods
2.1. Search Strategy
2.2. Eligibility Criteria
2.3. Data Collection
2.4. Quality Assessment
2.5. Statistical Analyses
3. Results
3.1. Study Selection
3.2. Characteristics of Studies
3.3. Quality Assessment
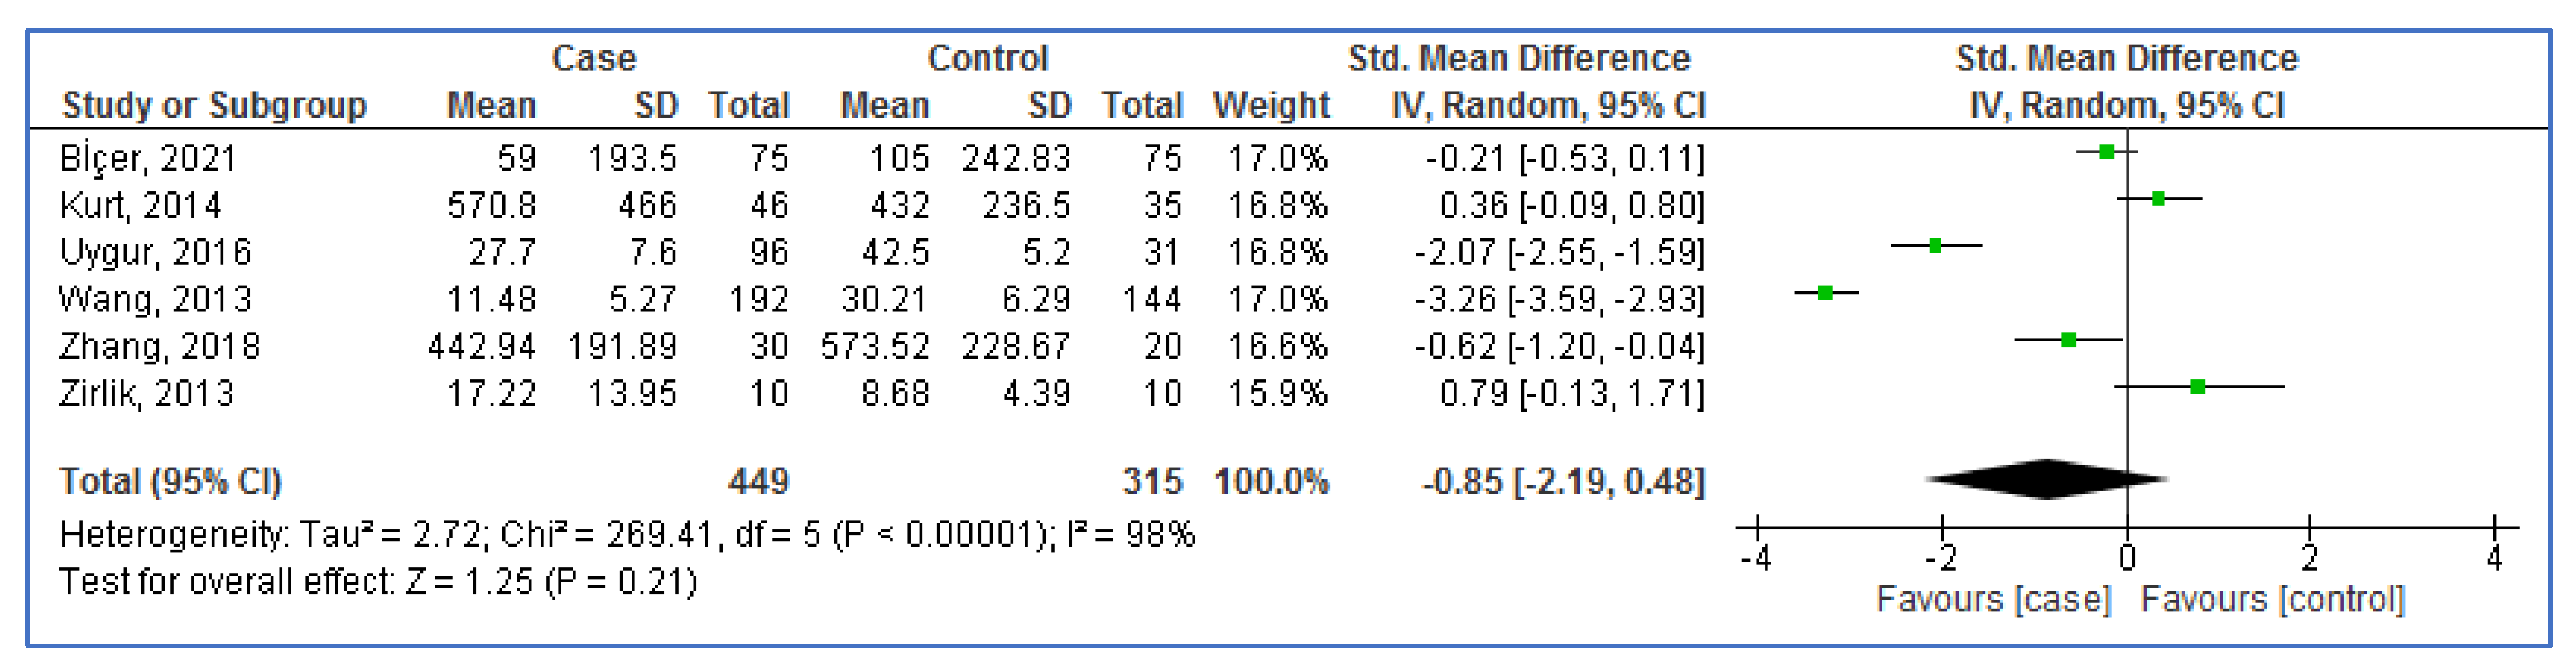
3.4. Meta-Analysis for OM-1 Levels
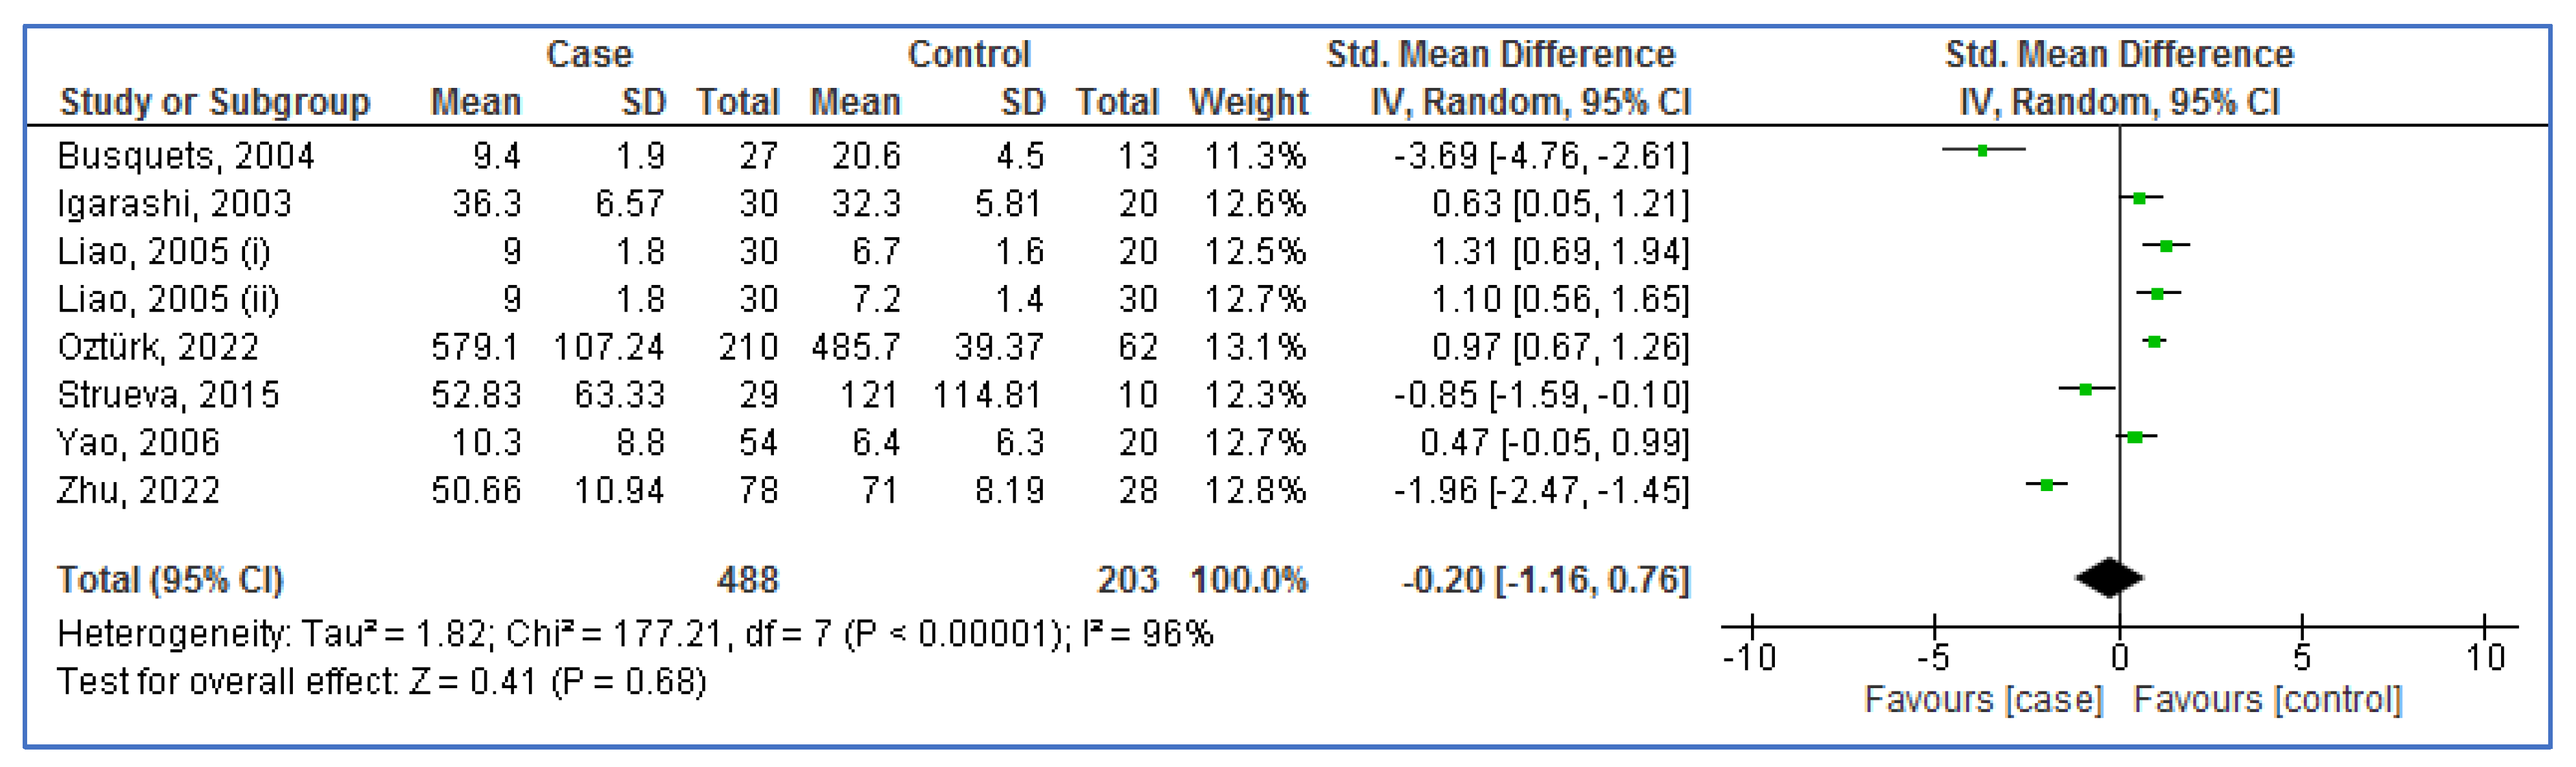
3.5. Meta-Analysis for OXA Levels
3.6. Subgroup Analysis for OM-1 Levels
3.7. Subgroup Analysis for OXA Levels
3.8. Meta-Regression Analysis
3.9. Radial Plot
3.10. Sensitivity Analysis
3.11. Trial Sequential Analysis (TSA)
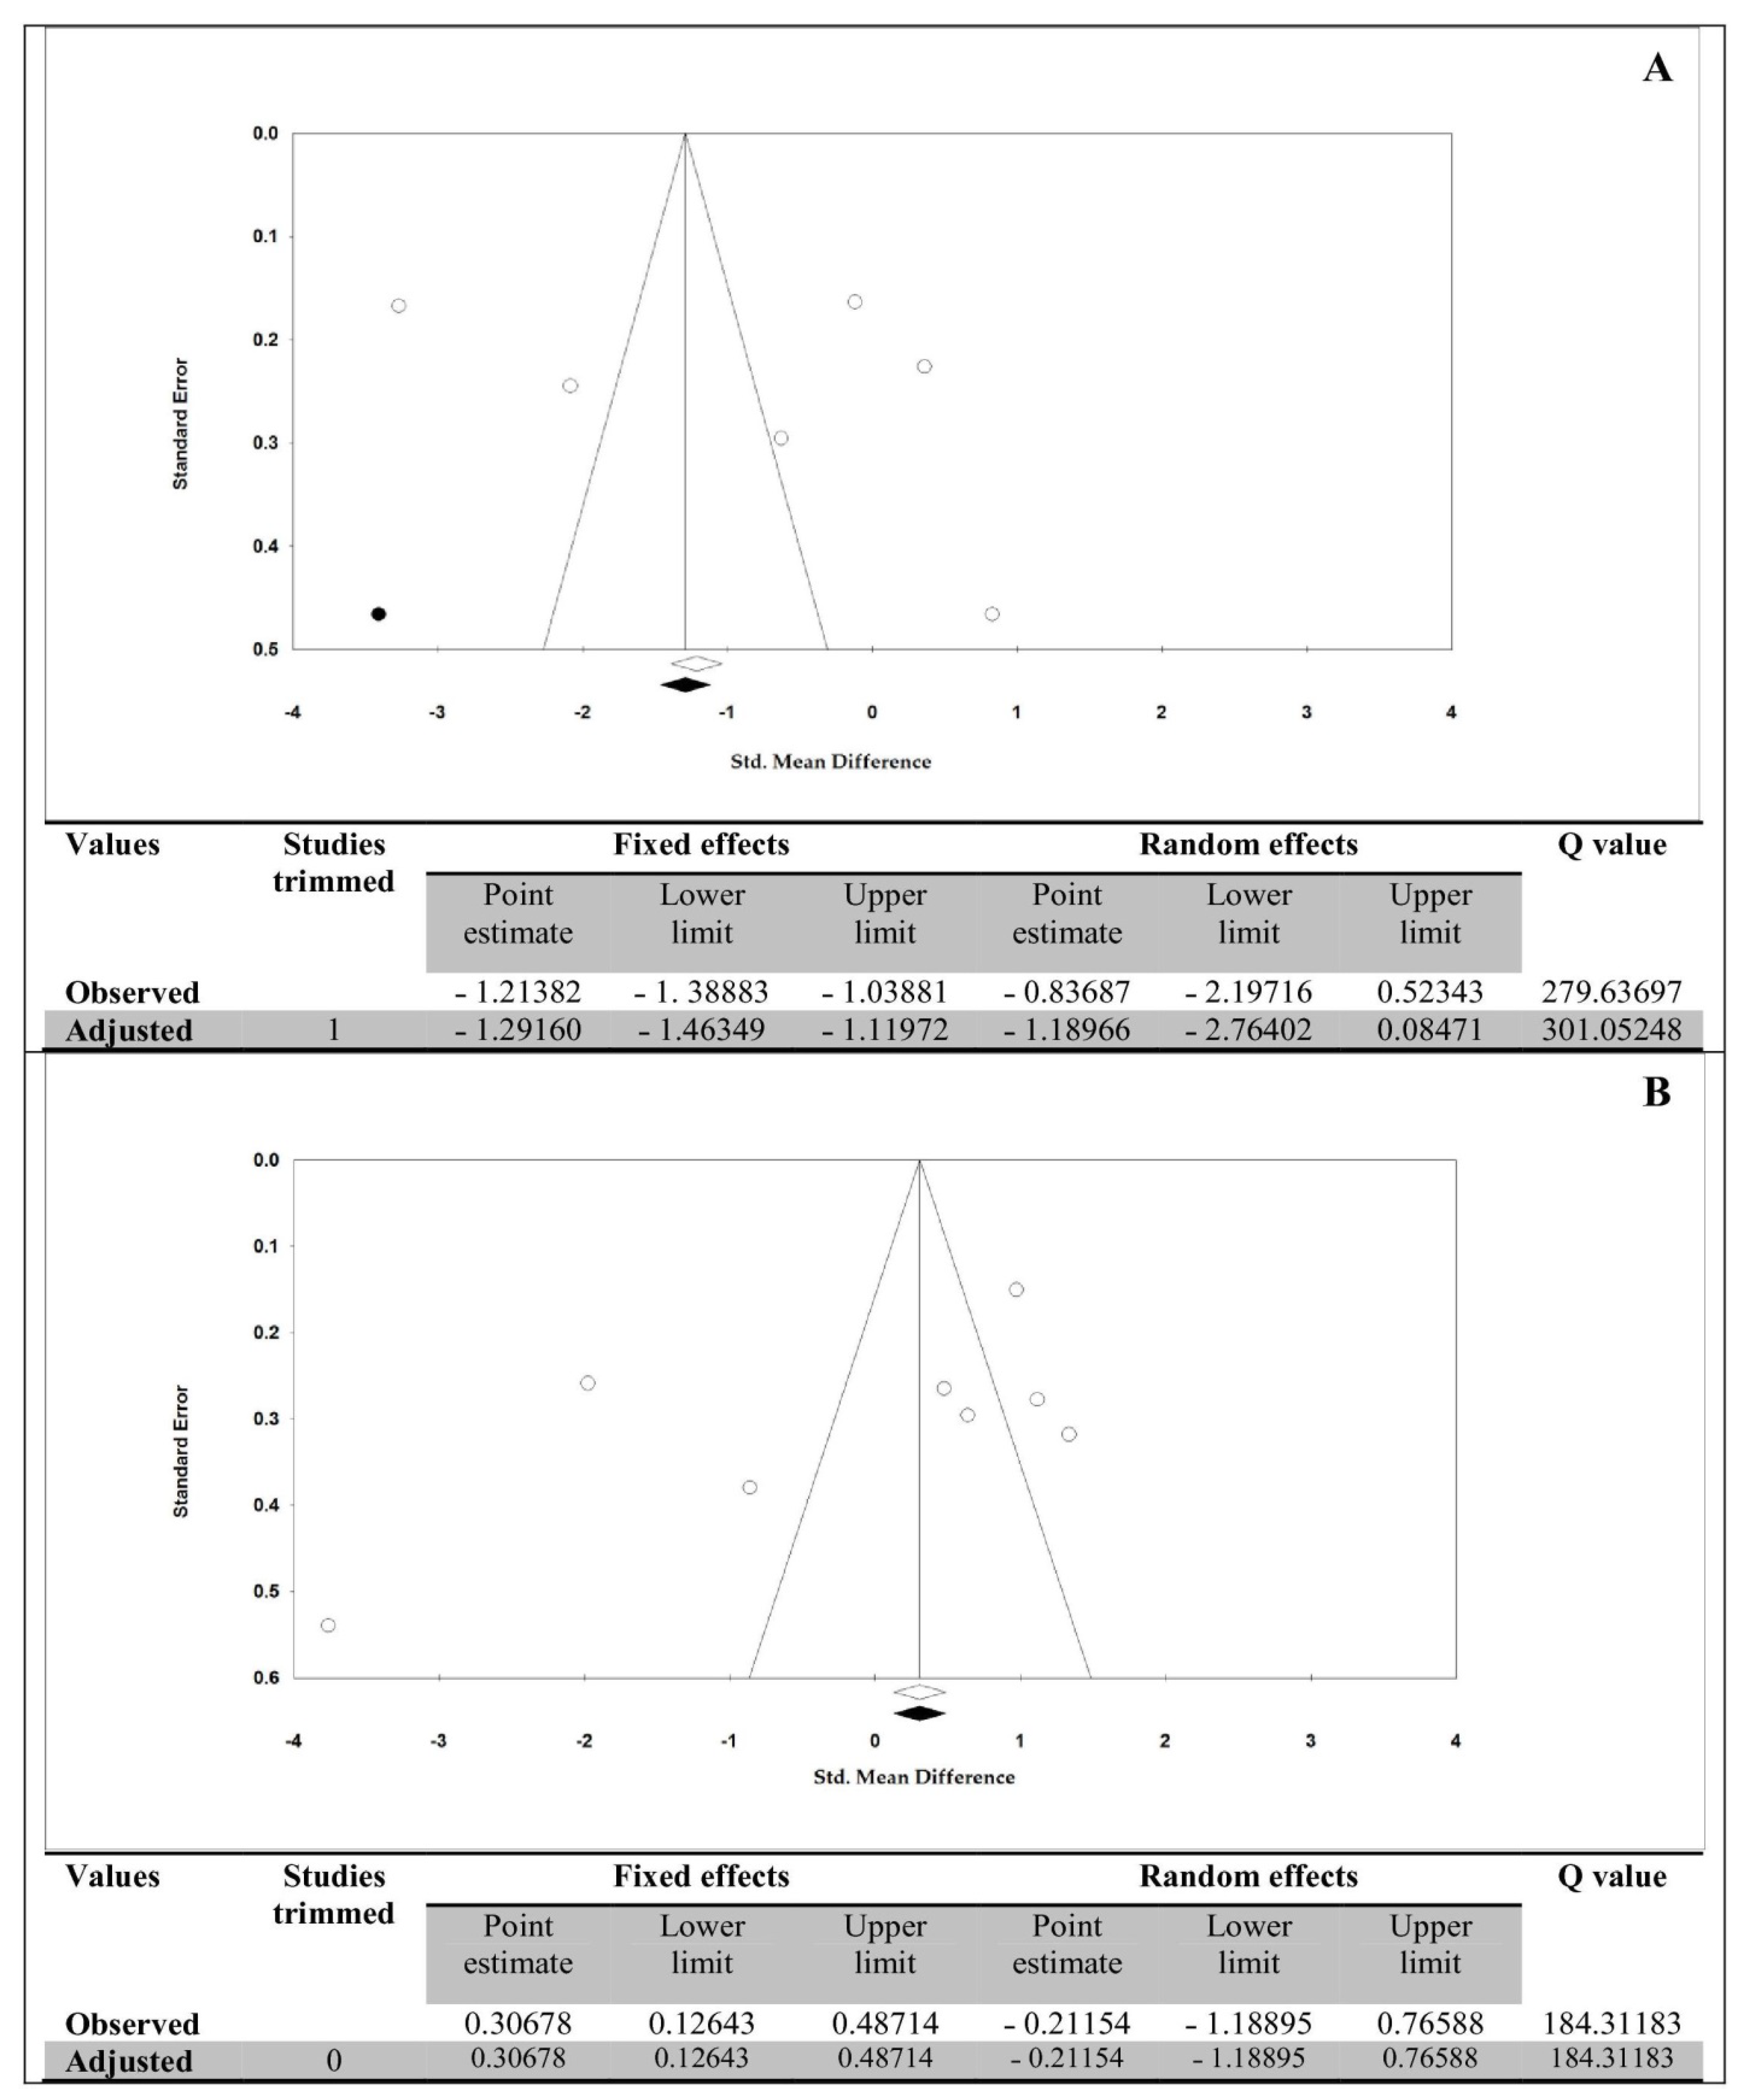
3.12. Publication Bias
4. Discussion
5. Conclusions
Supplementary Materials
Author Contributions
Funding
Institutional Review Board Statement
Informed Consent Statement
Data Availability Statement
Conflicts of Interest
References
- Pretto, J.J.; Gyulay, S.G.; Hensley, M.J. Trends in anthropometry and severity of sleep-disordered breathing over two decades of diagnostic sleep studies in an Australian adult sleep laboratory. Med. J. Aust. 2010, 193, 213–216. [Google Scholar] [CrossRef] [PubMed]
- Park, J.G.; Ramar, K.; Olson, E.J. Updates on definition, consequences, and management of obstructive sleep apnea. Mayo Clin. Proc. 2011, 86, 549–554, quiz 554–555. [Google Scholar] [CrossRef] [PubMed]
- Kuczyński, W.; Mokros, Ł.; Stolarz, A.; Białasiewicz, P. The utility of STOP-BANG questionnaire in the sleep-lab setting. Sci. Rep. 2019, 9, 6676. [Google Scholar] [CrossRef] [PubMed]
- Senaratna, C.V.; Perret, J.L.; Lodge, C.J.; Lowe, A.J.; Campbell, B.E.; Matheson, M.C.; Hamilton, G.S.; Dharmage, S.C. Prevalence of obstructive sleep apnea in the general population: A systematic review. Sleep Med. Rev. 2017, 34, 70–81. [Google Scholar] [CrossRef] [PubMed]
- Lechat, B.; Naik, G.; Reynolds, A.; Aishah, A.; Scott, H.; Loffler, K.A.; Vakulin, A.; Escourrou, P.; McEvoy, R.D.; Adams, R.J. Multinight prevalence, variability, and diagnostic misclassification of obstructive sleep apnea. Am. J. Respir. Crit. Care Med. 2022, 205, 563–569. [Google Scholar] [CrossRef]
- Cielo, C.M.; Tapia, I.E. Diving deeper: Rethinking AHI as the primary measure of OSA severity. J. Clin. Sleep Med. 2019, 15, 1075–1076. [Google Scholar] [CrossRef]
- Quan, S.; Gillin, J.C.; Littner, M.; Shepard, J. Sleep-related breathing disorders in adults: Recommendations for syndrome definition and measurement techniques in clinical research. editorials. Sleep 1999, 22, 662–689. [Google Scholar] [CrossRef]
- Goyal, M.; Johnson, J. Obstructive sleep apnea diagnosis and management. Mo. Med. 2017, 114, 120. [Google Scholar]
- Epstein, L.J.; Kristo, D.; Strollo, P.J., Jr.; Friedman, N.; Malhotra, A.; Patil, S.P.; Ramar, K.; Rogers, R.; Schwab, R.J.; Weaver, E.M.; et al. Clinical guideline for the evaluation, management and long-term care of obstructive sleep apnea in adults. J. Clin. Sleep Med. 2009, 5, 263–276. [Google Scholar]
- Franklin, K.A.; Lindberg, E. Obstructive sleep apnea is a common disorder in the population—A review on the epidemiology of sleep apnea. J. Thorac. Dis. 2015, 7, 1311. [Google Scholar]
- Schwartz, M.; Acosta, L.; Hung, Y.-L.; Padilla, M.; Enciso, R. Effects of CPAP and mandibular advancement device treatment in obstructive sleep apnea patients: A systematic review and meta-analysis. Sleep Breath. 2018, 22, 555–568. [Google Scholar] [CrossRef]
- Bielicki, P.; Trojnar, A.; Sobieraj, P. The impact of smoking status on obstructive sleep apnea (OSA) severity. Eur. Respir. J. 2018, 52, PA4356. [Google Scholar]
- Simou, E.; Britton, J.; Leonardi-Bee, J. Alcohol and the risk of sleep apnoea: A systematic review and meta-analysis. Sleep Med. 2018, 42, 38–46. [Google Scholar] [CrossRef]
- Imani, M.M.; Sadeghi, M.; Gholamipour, M.A.; Brühl, A.B.; Sadeghi-Bahmani, D.; Brand, S. Evaluation of Blood Intercellular Adhesion Molecule-1 (ICAM-1) Level in Obstructive Sleep Apnea: A Systematic Review and Meta-Analysis. Medicina 2022, 58, 1499. [Google Scholar] [CrossRef]
- Imani, M.M.; Sadeghi, M.; Mohammadi, M.; Brühl, A.B.; Sadeghi-Bahmani, D.; Brand, S. Association of Blood MCP-1 Levels with Risk of Obstructive Sleep Apnea: A Systematic Review and Meta-Analysis. Medicina 2022, 58, 1266. [Google Scholar] [CrossRef]
- Najafi, A.; Mohammadi, I.; Sadeghi, M.; Brühl, A.B.; Sadeghi-Bahmani, D.; Brand, S. Evaluation of Plasma/Serum Adiponectin (an Anti-Inflammatory Factor) Levels in Adult Patients with Obstructive Sleep Apnea Syndrome: A Systematic Review and Meta-Analysis. Life 2022, 12, 738. [Google Scholar] [CrossRef]
- Imani, M.M.; Sadeghi, M.; Farokhzadeh, F.; Khazaie, H.; Brand, S.; Dürsteler, K.M.; Brühl, A.; Sadeghi-Bahmani, D. Evaluation of Blood Levels of C-Reactive Protein Marker in Obstructive Sleep Apnea: A Systematic Review, Meta-Analysis and Meta-Regression. Life 2021, 11, 362. [Google Scholar] [CrossRef]
- Imani, M.M.; Sadeghi, M.; Khazaie, H.; Sanjabi, A.; Brand, S.; Brühl, A.; Sadeghi Bahmani, D. Associations Between Morning Salivary and Blood Cortisol Concentrations in Individuals With Obstructive Sleep Apnea Syndrome: A Meta-Analysis. Front. Endocrinol. 2020, 11, 568823. [Google Scholar] [CrossRef]
- Imani, M.M.; Sadeghi, M.; Khazaie, H.; Emami, M.; Sadeghi Bahmani, D.; Brand, S. Evaluation of Serum and Plasma Interleukin-6 Levels in Obstructive Sleep Apnea Syndrome: A Meta-Analysis and Meta-Regression. Front. Immunol. 2020, 11, 1343. [Google Scholar] [CrossRef]
- Imani, M.M.; Sadeghi, M.; Khazaie, H.; Emami, M.; Sadeghi Bahmani, D.; Brand, S. Serum and Plasma Tumor Necrosis Factor Alpha Levels in Individuals with Obstructive Sleep Apnea Syndrome: A Meta-Analysis and Meta-Regression. Life 2020, 10, 87. [Google Scholar] [CrossRef]
- Rezaei, F.; Abbasi, H.; Sadeghi, M.; Imani, M.M. The effect of obstructive sleep apnea syndrome on serum S100B and NSE levels: A systematic review and meta-analysis of observational studies. BMC Pulm. Med. 2020, 20, 31. [Google Scholar] [CrossRef] [PubMed]
- Bhatt, S.P.; Guleria, R. Association of IRS1 (Gly972Arg) and IRS2 (Gly1057Asp) genes polymorphisms with OSA and NAFLD in Asian Indians. PLoS ONE 2021, 16, e0245408. [Google Scholar] [CrossRef] [PubMed]
- Kerget, B.; Kerget, F.; Kahraman, Ç.Y.; Aksakal, A.; Araz, Ö. The relationship between NLRP3 rs10159239 and Vaspin rs2236242 gene variants and obstructive sleep apnea. Upsala J. Med. Sci. 2021, 126, e7603. [Google Scholar] [CrossRef]
- Behboudi, A.; Thelander, T.; Yazici, D.; Celik, Y.; Yucel-Lindberg, T.; Thunström, E.; Peker, Y. Association of TNF-α (-308G/A) Gene Polymorphism with Circulating TNF-α Levels and Excessive Daytime Sleepiness in Adults with Coronary Artery Disease and Concomitant Obstructive Sleep Apnea. J. Clin. Med. 2021, 10, 3413. [Google Scholar] [CrossRef] [PubMed]
- Netzer, N.C.; Stoohs, R.A.; Netzer, C.M.; Clark, K.; Strohl, K.P. Using the Berlin Questionnaire to identify patients at risk for the sleep apnea syndrome. Ann. Intern. Med. 1999, 131, 485–491. [Google Scholar] [CrossRef]
- Shamsuzzaman, A.S.; Gersh, B.J.; Somers, V.K. Obstructive sleep apnea: Implications for cardiac and vascular disease. JAMA 2003, 290, 1906–1914. [Google Scholar] [CrossRef]
- Gunta, S.P.; Jakulla, R.S.; Ubaid, A.; Mohamed, K.; Bhat, A.; López-Candales, A.; Norgard, N. Obstructive Sleep Apnea and Cardiovascular Diseases: Sad Realities and Untold Truths regarding Care of Patients in 2022. Cardiovasc. Ther. 2022, 2022, 6006127. [Google Scholar] [CrossRef]
- Young, T.; Peppard, P.E.; Taheri, S. Excess weight and sleep-disordered breathing. J. Appl. Physiol. 2005, 99, 1592–1599. [Google Scholar] [CrossRef]
- Patel, S.R.; White, D.P.; Malhotra, A.; Stanchina, M.L.; Ayas, N.T. Continuous positive airway pressure therapy for treating gess in a diverse population with obstructive sleep apnea: Results of a meta-analysis. Arch. Intern. Med. 2003, 163, 565–571. [Google Scholar] [CrossRef]
- Patil, S.P.; Ayappa, I.A.; Caples, S.M.; Kimoff, R.J.; Patel, S.R.; Harrod, C.G. Treatment of adult obstructive sleep apnea with positive airway pressure: An American Academy of Sleep Medicine clinical practice guideline. J. Clin. Sleep Med. 2019, 15, 335–343. [Google Scholar] [CrossRef]
- Jaacks, L.M.; Vandevijvere, S.; Pan, A.; McGowan, C.J.; Wallace, C.; Imamura, F.; Mozaffarian, D.; Swinburn, B.; Ezzati, M. The obesity transition: Stages of the global epidemic. Lancet Diabetes Endocrinol. 2019, 7, 231–240. [Google Scholar] [CrossRef]
- Bi, X.; Loo, Y.T.; Henry, C.J. Does circulating leptin play a role in energy expenditure? Nutrition 2019, 60, 6–10. [Google Scholar] [CrossRef]
- Sartin, J.; Dyer, C.; Matteri, R.; Buxton, D.; Buonomo, F.; Shores, M.; Baker, J.; Osborne, J.; Braden, T.; Steele, B. Effect of intracerebroventricular orexin-B on food intake in sheep. J. Anim. Sci. 2001, 79, 1573–1577. [Google Scholar] [CrossRef]
- Taheri, S.; Ward, H.; Ghatei, M.; Bloom, S. Role of orexins in sleep and arousal mechanisms. Lancet 2000, 355, 847. [Google Scholar] [CrossRef]
- Imperatore, R.; Palomba, L.; Cristino, L. Role of orexin-A in hypertension and obesity. Curr. Hypertens. Rep. 2017, 19, 34. [Google Scholar] [CrossRef]
- Yin, J.; Hou, P.; Wu, Z.; Nie, Y. Decreased levels of serum omentin-1 in patients with inflammatory bowel disease. Med. Sci. Monit. Int. Med. J. Exp. Clin. Res. 2015, 21, 118. [Google Scholar]
- El-Mesallamy, H.; El-Derany, M.; Hamdy, N. Serum omentin-1 and chemerin levels are interrelated in patients with Type 2 diabetes mellitus with or without ischaemic heart disease. Diabet. Med. 2011, 28, 1194–1200. [Google Scholar] [CrossRef]
- Elsaid, N.H.; Sadik, N.A.; Ahmed, N.R.; Fayez, S.E.; Mohammed, N.A.E.-G. Serum omentin-1 levels in type 2 diabetic obese women in relation to glycemic control, insulin resistance and metabolic parameters. J. Clin. Transl. Endocrinol. 2018, 13, 14–19. [Google Scholar] [CrossRef]
- Shechter, A. Obstructive sleep apnea and energy balance regulation: A systematic review. Sleep Med. Rev. 2017, 34, 59–69. [Google Scholar] [CrossRef]
- Kurt, O.K.; Tosun, M.; Alcelik, A.; Yilmaz, B.; Talay, F. Serum omentin levels in patients with obstructive sleep apnea. Sleep Breath. 2014, 18, 391–395. [Google Scholar] [CrossRef]
- Wang, Q.; Feng, X.; Zhou, C.; Li, P.; Kang, J. Decreased levels of serum omentin-1 in patients with obstructive sleep apnoea syndrome. Ann. Clin. Biochem. 2013, 50, 230–235. [Google Scholar] [CrossRef] [PubMed]
- Busquets, X.; Barbé, F.; Barceló, A.; de la Peña, M.; Sigritz, N.; Mayoralas, L.R.; Ladaria, A.; Agustí, A. Decreased plasma levels of orexin-A in sleep apnea. Respiration 2004, 71, 575–579. [Google Scholar] [CrossRef] [PubMed]
- Liao, X.; Yu, Q. The changes and implications of plasma orexin-A levels in patients with obstructive sleep apnea-hypopnea syndrome. Zhonghua Jie He He Hu Xi Za Zhi/Zhonghua Jiehe He Huxi Zazhi/Chin. J. Tuberc. Respir. Dis. 2005, 28, 368–371. [Google Scholar]
- Moher, D.; Shamseer, L.; Clarke, M.; Ghersi, D.; Liberati, A.; Petticrew, M.; Shekelle, P.; Stewart, L.A. Preferred reporting items for systematic review and meta-analysis protocols (PRISMA-P) 2015 statement. Syst. Rev. 2015, 4, 1. [Google Scholar] [CrossRef] [PubMed]
- Morgan, R.L.; Thayer, K.A.; Bero, L.; Bruce, N.; Falck-Ytter, Y.; Ghersi, D.; Guyatt, G.; Hooijmans, C.; Langendam, M.; Mandrioli, D. GRADE: Assessing the quality of evidence in environmental and occupational health. Environ. Int. 2016, 92, 611–616. [Google Scholar] [CrossRef]
- Morgan, R.L.; Thayer, K.A.; Santesso, N.; Holloway, A.C.; Blain, R.; Eftim, S.E.; Goldstone, A.E.; Ross, P.; Guyatt, G.; Schünemann, H.J. Evaluation of the risk of bias in non-randomized studies of interventions (ROBINS-I) and the ‘target experiment’concept in studies of exposures: Rationale and preliminary instrument development. Environ. Int. 2018, 120, 382–387. [Google Scholar] [CrossRef]
- Institute, J. The Joanna Briggs Institute Critical Appraisal Tools for Use in JBI Systematic Reviews Checklist for Analytical Clinical Trial Studies. 2017. Available online: https://jbi.global/critical-appraisal-tools (accessed on 27 November 2022).
- DerSimonian, R.; Laird, N. Meta-analysis in clinical trials revisited. Contemp. Clin. Trials 2015, 45, 139–145. [Google Scholar] [CrossRef]
- Mantel, N.; Haenszel, W. Statistical aspects of the analysis of data from retrospective studies of disease. J. Natl. Cancer Inst. 1959, 22, 719–748. [Google Scholar]
- Begg, C.B.; Mazumdar, M. Operating characteristics of a rank correlation test for publication bias. Biometrics 1994, 50, 1088–1101. [Google Scholar] [CrossRef]
- Egger, M.; Smith, G.D.; Schneider, M.; Minder, C. Bias in meta-analysis detected by a simple, graphical test. Bmj 1997, 315, 629–634. [Google Scholar] [CrossRef]
- Imberger, G.; Thorlund, K.; Gluud, C.; Wetterslev, J. False-positive findings in Cochrane meta-analyses with and without application of trial sequential analysis: An empirical review. BMJ Open 2016, 6, e011890. [Google Scholar] [CrossRef]
- Wetterslev, J.; Jakobsen, J.C.; Gluud, C. Trial sequential analysis in systematic reviews with meta-analysis. BMC Med. Res. Methodol. 2017, 17, 39. [Google Scholar] [CrossRef]
- Wan, X.; Wang, W.; Liu, J.; Tong, T. Estimating the sample mean and standard deviation from the sample size, median, range and/or interquartile range. BMC Med. Res. Methodol. 2014, 14, 135. [Google Scholar] [CrossRef]
- Hozo, S.P.; Djulbegovic, B.; Hozo, I. Estimating the mean and variance from the median, range, and the size of a sample. BMC Med. Res. Methodol. 2005, 5, 13. [Google Scholar] [CrossRef]
- Bİçer, Ü.; Kutlu, R.; Yosunkaya, S.; Kilinç, İ. Evaluation of Plasma Ghrelin, Omentin–1 Levels and Insulin Resistance in Patients With Obstructive Sleep Apnea Syndrome. Konuralp Med. J. 2021, 13, 114–121. [Google Scholar] [CrossRef]
- Igarashi, N.; Tatsumi, K.; Nakamura, A.; Sakao, S.; Takiguchi, Y.; Nishikawa, T.; Kuriyama, T. Plasma orexin-A levels in obstructive sleep apnea-hypopnea syndrome. Chest 2003, 124, 1381–1385. [Google Scholar] [CrossRef]
- Öztürk, Ö.; Cebeci, D.; Şahin, U.; Tülüceoğlu, E.E.; Calapoğlu, N.Ş.; Gonca, T.; Calapoğlu, M. Circulating levels of ghrelin, galanin, and orexin-A orexigenic neuropeptides in obstructive sleep apnea syndrome. Sleep Breath. 2022, 26, 1209–1218. [Google Scholar] [CrossRef]
- Strueva, N.; Poluektov, M.; Melnichenko, G.; Savelyeva, L.; Katsya, G.; Goncharov, N. Decreased plasma orexin-A levels in obese patients with and without obstructive sleep apnea. Sleep Med. 2015, 16, S86. [Google Scholar] [CrossRef]
- Uygur, F.; Tanrıverdi, H.; Can, M.; Erboy, F.; Altınsoy, B.; Atalay, F.; Ornek, T.; Damar, M.; Kokturk, F.; Tor, M. Association between continuous positive airway pressure and circulating omentin levels in patients with obstructive sleep apnoea. Sleep Breath. 2016, 20, 939–945. [Google Scholar] [CrossRef]
- Yao, X.; Yang, H.; Zhang, G.; Tang, Y. Plasma orexin-A level in patients with obstructive apnea-hypopnea syndrome. Lin Chuang Er Bi Yan Hou Ke Za Zhi/J. Clin. Otorhinolaryngol. 2006, 20, 547–549. [Google Scholar]
- Zhang, D.-m.; Pang, X.-l.; Huang, R.; Gong, F.-y.; Zhong, X.; Xiao, Y. Adiponectin, omentin, ghrelin, and visfatin levels in obese patients with severe obstructive sleep apnea. BioMed Res. Int. 2018, 2018, 3410135. [Google Scholar] [CrossRef] [PubMed]
- Zhu, J.; Zeng, Z.; Xiong, M.; Mo, H.; Jin, M.; Hu, K. Associations between daytime and nighttime plasma orexin A levels and cognitive function in patients with obstructive sleep apnea. Sleep Biol. Rhythm. 2022, 20, 421–429. [Google Scholar] [CrossRef]
- Zirlik, S.; Hildner, K.; Targosz, A.; Neurath, M.; Fuchs, F.; Brzozowski, T.; Konturek, P.C. Melatonin and omentin: Influence factors in the obstructive sleep apnoea syndrome. J Physiol Pharm. 2013, 64, 353–360. [Google Scholar]
- Casale, M.; Pappacena, M.; Rinaldi, V.; Bressi, F.; Baptista, P.; Salvinelli, F. Obstructive sleep apnea syndrome: From phenotype to genetic basis. Curr. Genom. 2009, 10, 119–126. [Google Scholar] [CrossRef] [PubMed]
- Glicksman, A.; Hadjiyannakis, S.; Barrowman, N.; Walker, S.; Hoey, L.; Katz, S.L. Body fat distribution ratios and obstructive sleep apnea severity in youth with obesity. J. Clin. Sleep Med. 2017, 13, 545–550. [Google Scholar] [CrossRef]
- Unnikrishnan, D.; Jun, J.; Polotsky, V. Inflammation in sleep apnea: An update. Rev. Endocr. Metab. Disord. 2015, 16, 25–34. [Google Scholar] [CrossRef]
- Yilmaz Avci, A.; Avci, S.; Lakadamyali, H.; Can, U. Hypoxia and inflammation indicate significant differences in the severity of obstructive sleep apnea within similar apnea-hypopnea index groups. Sleep Breath. 2017, 21, 703–711. [Google Scholar] [CrossRef]
- Vicente, E.; Marin, J.M.; Carrizo, S.J.; Osuna, C.S.; González, R.; Marin-Oto, M.; Forner, M.; Vicente, P.; Cubero, P.; Gil, A.V. Upper airway and systemic inflammation in obstructive sleep apnoea. Eur. Respir. J. 2016, 48, 1108–1117. [Google Scholar] [CrossRef]
- St-Onge, M.-P.; Shechter, A. Sleep disturbances, body fat distribution, food intake and/or energy expenditure: Pathophysiological aspects. Horm. Mol. Biol. Clin. Investig. 2014, 17, 29–37. [Google Scholar] [CrossRef]
- Shechter, A. Effects of continuous positive airway pressure on energy balance regulation: A systematic review. Eur. Respir. J. 2016, 48, 1640–1657. [Google Scholar] [CrossRef]
- Li, S.; Xue, J.; Hong, P. Relationships between serum omentin-1 concentration, body composition and physical activity levels in older women. Medicine 2021, 100, e25020. [Google Scholar] [CrossRef]
- Alissa, E.M.; Maisa’a, M.; Alama, N.A.; Ferns, G.A. Role of omentin-1 and C-reactive protein in obese subjects with subclinical inflammation. J. Clin. Transl. Endocrinol. 2016, 3, 7–11. [Google Scholar] [CrossRef]
- Wang, D.; Jiang, T.-J.; Liao, L.; Huang, J. Relationships between serum omentin-1 concentration and bone mineral density, and bone biochemical markers in Chinese women. Clin. Chim. Acta 2013, 426, 64–67. [Google Scholar] [CrossRef]
- Nixon, J.P.; Kotz, C.M.; Novak, C.M.; Billington, C.J.; Teske, J.A. Neuropeptides controlling energy balance: Orexins and neuromedins. Appet. Control 2012, 209, 77–109. [Google Scholar]
- Biscetti, F.; Nardella, E.; Bonadia, N.; Angelini, F.; Pitocco, D.; Santoliquido, A.; Filipponi, M.; Landolfi, R.; Flex, A. Association between plasma omentin-1 levels in type 2 diabetic patients and peripheral artery disease. Cardiovasc. Diabetol. 2019, 18, 74. [Google Scholar] [CrossRef]
- Knaus, C. Diagnosis and treatment of obstructive sleep apnea syndrome. Ther. Umschau. Rev. Ther. 2016, 73, 209–212. [Google Scholar] [CrossRef]
- Pan, X.; Kaminga, A.C.; Wen, S.W.; Acheampong, K.; Liu, A. Omentin-1 in diabetes mellitus: A systematic review and meta-analysis. PLoS ONE 2019, 14, e0226292. [Google Scholar] [CrossRef]
- Svatikova, A.; Wolk, R.; Gami, A.S.; Pohanka, M.; Somers, V.K. Interactions between obstructive sleep apnea and the metabolic syndrome. Curr. Diabetes Rep. 2005, 5, 53–58. [Google Scholar] [CrossRef]
- Watanabe, K.; Watanabe, R.; Konii, H.; Shirai, R.; Sato, K.; Matsuyama, T.-a.; Ishibashi-Ueda, H.; Koba, S.; Kobayashi, Y.; Hirano, T. Counteractive effects of omentin-1 against atherogenesis. Cardiovasc. Res. 2016, 110, 118–128. [Google Scholar] [CrossRef]
- Yoo, H.J.; Hwang, S.Y.; Hong, H.C.; Choi, H.Y.; Yang, S.J.; Seo, J.A.; Kim, S.G.; Kim, N.H.; Choi, K.M.; Choi, D.S. Association of circulating omentin-1 level with arterial stiffness and carotid plaque in type 2 diabetes. Cardiovasc. Diabetol. 2011, 10, 103. [Google Scholar] [CrossRef]
- Wang, W.; Pan, Y.; Li, Q.; Wang, L. Orexin: A potential role in the process of obstructive sleep apnea. Peptides 2013, 42, 48–54. [Google Scholar] [CrossRef] [PubMed]
- Rilling, F.L.; Reyes, M.; Blanco, E.; Burrows, R.; Peirano, P.; Algarín, C.; Meroño, T.; Gahagan, S. Association of fasting Orexin-A levels with energy intake at breakfast and subsequent snack in Chilean adolescents. Psychoneuroendocrinology 2022, 140, 105718. [Google Scholar] [CrossRef] [PubMed]


| First Author, Publication Year | Country | Ethnicity | Case | Control | Sample | Measured Factor | ||||||
| Number | Mean Age, Years | Mean BMI, kg/m2 | Mean AHI, events/h | Number | Mean Age, Years | Mean BMI, kg/m2 | Mean AHI, events/h | |||||
| Igarashi, 2003 [57] | Japan | Asian | 30 | 45.3 | 28.6 | 31.8 | 20 | 46.5 | 26.4 | 1.9 | Plasma | Orexin-A |
| Busquets, 2004 [42] | Spain | Caucasian | 27 | 52 | 31 | 54 | 13 | 46 | 24 | <5 | Plasma | Orexin-A |
| Liao, 2005 (i) [43] | China | Asian | 30 | 53 | 30.2 | ≥5 | 20 | 48 | 22.1 | 1.7 | Plasma | Orexin-A |
| Liao, 2005 (ii) [43] | China | Asian | 30 | 53 | 30.2 | ≥5 | 30 | 51 | 30.9 | 2.3 | Plasma | Orexin-A |
| Yao, 2006 [61] | China | Asian | 54 | 47 | 34 | 64 | 20 | 45 | 32 | 3.5 | Plasma | Orexin-A |
| Wang, 2013 [41] | China | Asian | 192 | 49.2 | 26.7 | 24 | 144 | 48.7 | 27.1 | 2 | Serum | Omentin-1 |
| Zirlik, 2013 [64] | Germany | Caucasian | 10 | 58.9 | 31.7 | 40.4 | 10 | 53.6 | 26.7 | 2.7 | Plasma | Omentin-1 |
| Kurt, 2014 [40] | Turkey | Caucasian | 46 | 48.1 | 30.4 | ≥5 | 35 | 42.8 | 26.4 | <5 | Serum | Omentin-1 |
| Strueva, 2015 [59] | Russia | Caucasian | 29 | 41 | 39.2 | ≥30 | 10 | 38 | 22.4 | <5 | Plasma | Orexin-A |
| Uygur, 2016 [60] | Turkey | Caucasian | 96 | 51.4 | 30.8 | 27.9 | 31 | 50.6 | 29.6 | 1.9 | Serum | Omentin-1 |
| Zhang, 2018 [62] | China | Asian | 30 | 40.7 | 28.8 | 61.5 | 20 | 36.1 | 27.6 | 1.9 | Plasma | Omentin-1 |
| Bİçer, 2021 [56] | Turkey | Caucasian | 75 | 44.2 | 29.4 | ≥5 | 75 | 34.1 | 25.9 | <5 | Plasma | Omentin-1 |
| Oztürk, 2022 [58] | Turkey | Caucasian | 210 | 46.4 | 32.6 | 31.6 | 62 | 42.2 | 30.3 | 2.8 | Serum | Orexin-A |
| Zhu, 2022 [63] | China | Asian | 78 | 56.6 | 26.9 | 25.8 | 28 | 55.6 | 26.2 | 3.4 | Plasma | Orexin-A |
| First Author, Publication Year | The Joanna Briggs Institute (JBI) Critical Appraisal Checklist | Quality (Total Quality Score) | |||||||||
| Q1 | Q2 | Q3 | Q4 | Q5 | Q6 | Q7 | Q8 | Q9 | Q10 | ||
| Igarashi, 2003 [57] | No | Yes | Yes | Yes | Yes | No | No | Yes | Yes | Yes | Moderate (7) |
| Busquets, 2004 [42] | No | No | Yes | Yes | Yes | Yes | Yes | Yes | Yes | Yes | Moderate (7) |
| Liao, 2005 (i) [43] | No | No | Yes | Yes | Yes | Yes | No | Yes | Yes | Yes | Moderate (6) |
| Liao, 2005 (ii) [43] | No | No | Yes | Yes | Yes | Yes | No | Yes | Yes | Yes | Moderate (6) |
| Yao, 2006 [61] | No | Yes | Yes | Yes | Yes | Yes | No | Yes | Yes | Yes | Moderate (7) |
| Wang, 2013 [41] | Yes | Yes | Yes | Yes | Yes | Yes | No | Yes | Yes | Yes | High (9) |
| Zirlik, 2013 [64] | Yes | No | Yes | Yes | Yes | Yes | Yes | Yes | Yes | Yes | High (9) |
| Kurt, 2014 [40] | Yes | No | Yes | Yes | Yes | Yes | Yes | Yes | Yes | Yes | High (9) |
| Strueva, 2015 [59] | Un | No | No | Yes | Un | Un | Un | Yes | Yes | Yes | Low (4) |
| Uygur, 2016 [60] | No | Yes | Yes | Yes | Yes | Yes | Yes | Yes | Yes | Yes | High (9) |
| Zhang, 2018 [62] | Yes | Yes | Yes | Yes | Yes | Yes | No | Yes | Yes | Yes | High (9) |
| Bİçer, 2021 [56] | Yes | No | Yes | Yes | Yes | No | No | Yes | Yes | Yes | Moderate (7) |
| Oztürk, 2022 [58] | Yes | No | Yes | Yes | Yes | Yes | No | Yes | Yes | Yes | Moderate (8) |
| Zhu, 2022 [63] | Yes | Yes | Yes | Yes | Yes | Yes | No | Yes | Yes | Yes | High (10) |
| Variable | Subgroup (N) | SMD | 95%CI | p-Value | I2, % | |
|---|---|---|---|---|---|---|
| Min. | Max. | |||||
| Ethnicity | ||||||
| Caucasian (4) | −0.29 | −1.42 | 0.84 | 0.62 | 96 | |
| Asian (2) | −1.95 | −4.54 | 0.64 | 0.14 | 98 | |
| Sample | ||||||
| Serum (3) | −1.66 | −3.83 | 0.51 | 0.13 | 99 | |
| Plasma (3) | −0.08 | −0.68 | 0.52 | 0.79 | 70 | |
| Sample size | ||||||
| ≥100 (3) | −1.82 | −3.85 | 0.21 | 0.08 | 99 | |
| <100 (3) | 0.13 | −0.64 | 0.91 | 0.74 | 79 | |
| Mean BMI of aOSA, kg/m2 | ||||||
| ≥30 (3) | −0.33 | −2.17 | 1.51 | 0.73 | 97 | |
| <30 (3) | −1.34 | −3.52 | 0.85 | 0.23 | 99 | |
| Mean BMI of controls, kg/m2 | ||||||
| ≥30 (0) | - | - | - | - | - | |
| <30 (6) | −0.84 | −2.19 | 0.52 | 0.23 | 98 | |
| Mean age of aOSA, year | ||||||
| ≥45 (4) | −1.07 | −3.01 | 0.88 | 0.28 | 98 | |
| <45 (2) | −0.31 | −0.79 | 0.17 | 0.20 | 54 | |
| Mean age of controls, year | ||||||
| ≥45 (3) | −1.57 | −3.36 | 0.23 | 0.09 | 97 | |
| <45 (3) | −0.10 | −0.58 | 0.38 | 0.68 | 72 | |
| Mean AHI of aOSA, events/h | ||||||
| ≥40 (2) | 0.04 | −1.34 | 1.42 | 0.96 | 85 | |
| <40 (2) | −2.68 | −3.85 | −1.52 | <0.00001 | 94 | |
| Quality | ||||||
| Moderate (5) | −0.98 | −2.59 | 0.62 | 0.23 | 98 | |
| High (1) | −0.12 | −0.44 | 0.20 | 0.46 | - | |
| Variable | Subgroup (N) | SMD | 95%CI | p-Value | I2, % | |
| Min. | Max. | |||||
| Ethnicity | ||||||
| Caucasian (3) | −1.14 | −3.58 | 1.29 | 0.36 | 98 | |
| Asian (5) | 0.30 | −0.90 | 1.51 | 0.62 | 96 | |
| Sample | ||||||
| Serum (1) | 0.97 | 0.67 | 1.26 | <0.00001 | - | |
| Plasma (7) | −0.39 | −1.54 | 0.76 | 0.51 | 96 | |
| Sample size | ||||||
| ≥100 (2) | −0.49 | −3.36 | 2.38 | 0.74 | 99 | |
| <100 (4) | −0.10 | −1.15 | 0.95 | 0.85 | 94 | |
| Mean BMI of aOSA, kg/m2 | ||||||
| ≥30 (6) | −0.02 | −0.98 | 0.94 | 0.97 | 94 | |
| <30 (2) | −0.67 | −3.21 | 1.87 | 0.60 | 98 | |
| Mean BMI of controls, kg/m2 | ||||||
| ≥30 (3) | 0.89 | 0.66 | 1.12 | <0.00001 | 41 | |
| <30 (5) | −0.88 | 2.45 | 0.69 | 0.27 | 96 | |
| Mean age of aOSA, year | ||||||
| ≥45 (7) | −0.11 | −1.16 | 0.93 | 0.83 | 96 | |
| <45 (1) | −0.85 | −1.59 | −0.10 | 0.03 | - | |
| Mean age of controls, year | ||||||
| ≥45 (6) | −0.32 | −1.62 | 0.99 | 0.64 | 96 | |
| <45 (2) | 0.10 | −1.68 | 1.87 | 0.92 | 95 | |
| Mean AHI of aOSA, events/h | ||||||
| ≥40 (2) | −1.58 | −5.65 | 2.49 | 0.45 | 98 | |
| <40 (2) | −0.12 | −1.93 | 1.70 | 0.90 | 98 | |
| Quality | ||||||
| Moderate (6) | 0.25 | −0.59 | 1.08 | 0.56 | 93 | |
| High (1) | −1.96 | −2.74 | −1.45 | <0.00001 | - | |
| Low (1) | −0.85 | −1.59 | −0.10 | 0.03 | - | |
| Omentin-1 | ||||||
| Variable | Point Estimate | Standard Error | Lower Limit | Upper Limit | Z-Value | p-Value |
| Publication year | 0.08398 | 0.24376 | −0.39379 | 0.56175 | 0.34450 | 0.73047 |
| Sample size | −0.01156 | 0.00406 | −0.01952 | −0.00359 | −2.84445 | 0.00445 |
| Mean BMI of aOSA | 0.62114 | 0.33477 | −0.03499 | 1.27727 | 1.85545 | 0.06353 |
| Mean BMI of controls | −0.62930 | 0.57486 | −1.75600 | 0.49740 | −1.09471 | 0.27364 |
| Mean age of aOSA | 0.03104 | 0.12756 | −0.21897 | 0.28106 | 0.24335 | 0.80773 |
| Mean age of controls | −0.04958 | 0.08698 | −0.22006 | 0.12090 | −0.057001 | 0.56867 |
| Mean AHI of aOSA | 0.06554 | 0.04650 | −0.02560 | 0.15668 | 1.40940 | 0.15872 |
| Quality score | −0.42984 | 0.99973 | −2.38927 | 1.52959 | −0.42996 | 0.66722 |
| Orexin-A | ||||||
| Variable | Point estimate | Standard error | Lower limit | Upper limit | Z-value | p-value |
| Publication year | −0.02853 | 0.07419 | −0.17393 | 0.11687 | −0.38457 | 0.70056 |
| Sample size | 0.00559 | 0.00772 | −0.00954 | 0.02072 | 0.72432 | 0.46887 |
| Mean BMI of aOSA | 0.01832 | 0.14761 | −0.27099 | 0.30763 | 0.12411 | 0.90123 |
| Mean BMI of controls | 0.17726 | 0.13499 | −0.08731 | 0.44183 | 1.31314 | 0.18914 |
| Mean age of aOSA | −0.07771 | 0.10418 | −0.28190 | 0.12647 | −0.74595 | 0.45570 |
| Mean age of controls | −0.03628 | 0.10193 | −0.23607 | 0.16351 | −0.35589 | 0.72192 |
| Mean AHI of aOSA | −0.32946 | 0.60582 | −151685 | 0.85793 | −0.54382 | 0.58657 |
| Quality score | −0.24502 | 0.31513 | −0.82267 | 0.37262 | −0.77753 | 0.43685 |
Disclaimer/Publisher’s Note: The statements, opinions and data contained in all publications are solely those of the individual author(s) and contributor(s) and not of MDPI and/or the editor(s). MDPI and/or the editor(s) disclaim responsibility for any injury to people or property resulting from any ideas, methods, instructions or products referred to in the content. |
© 2023 by the authors. Licensee MDPI, Basel, Switzerland. This article is an open access article distributed under the terms and conditions of the Creative Commons Attribution (CC BY) license (https://creativecommons.org/licenses/by/4.0/).
Share and Cite
Mohammadi, I.; Sadeghi, M.; Tajmiri, G.; Brühl, A.B.; Sadeghi Bahmani, L.; Brand, S. Evaluation of Blood Levels of Omentin-1 and Orexin-A in Adults with Obstructive Sleep Apnea: A Systematic Review and Meta-Analysis. Life 2023, 13, 245. https://doi.org/10.3390/life13010245
Mohammadi I, Sadeghi M, Tajmiri G, Brühl AB, Sadeghi Bahmani L, Brand S. Evaluation of Blood Levels of Omentin-1 and Orexin-A in Adults with Obstructive Sleep Apnea: A Systematic Review and Meta-Analysis. Life. 2023; 13(1):245. https://doi.org/10.3390/life13010245
Chicago/Turabian StyleMohammadi, Iman, Masoud Sadeghi, Golnaz Tajmiri, Annette Beatrix Brühl, Laleh Sadeghi Bahmani, and Serge Brand. 2023. "Evaluation of Blood Levels of Omentin-1 and Orexin-A in Adults with Obstructive Sleep Apnea: A Systematic Review and Meta-Analysis" Life 13, no. 1: 245. https://doi.org/10.3390/life13010245
APA StyleMohammadi, I., Sadeghi, M., Tajmiri, G., Brühl, A. B., Sadeghi Bahmani, L., & Brand, S. (2023). Evaluation of Blood Levels of Omentin-1 and Orexin-A in Adults with Obstructive Sleep Apnea: A Systematic Review and Meta-Analysis. Life, 13(1), 245. https://doi.org/10.3390/life13010245