
Diabetes without Overt Cardiac Disease Is Associated with Markers of Abnormal Repolarization: A Case-Control Study


Abstract
:1. Introduction
2. Materials and Methods
2.1. Study Overview
2.2. Study Participants
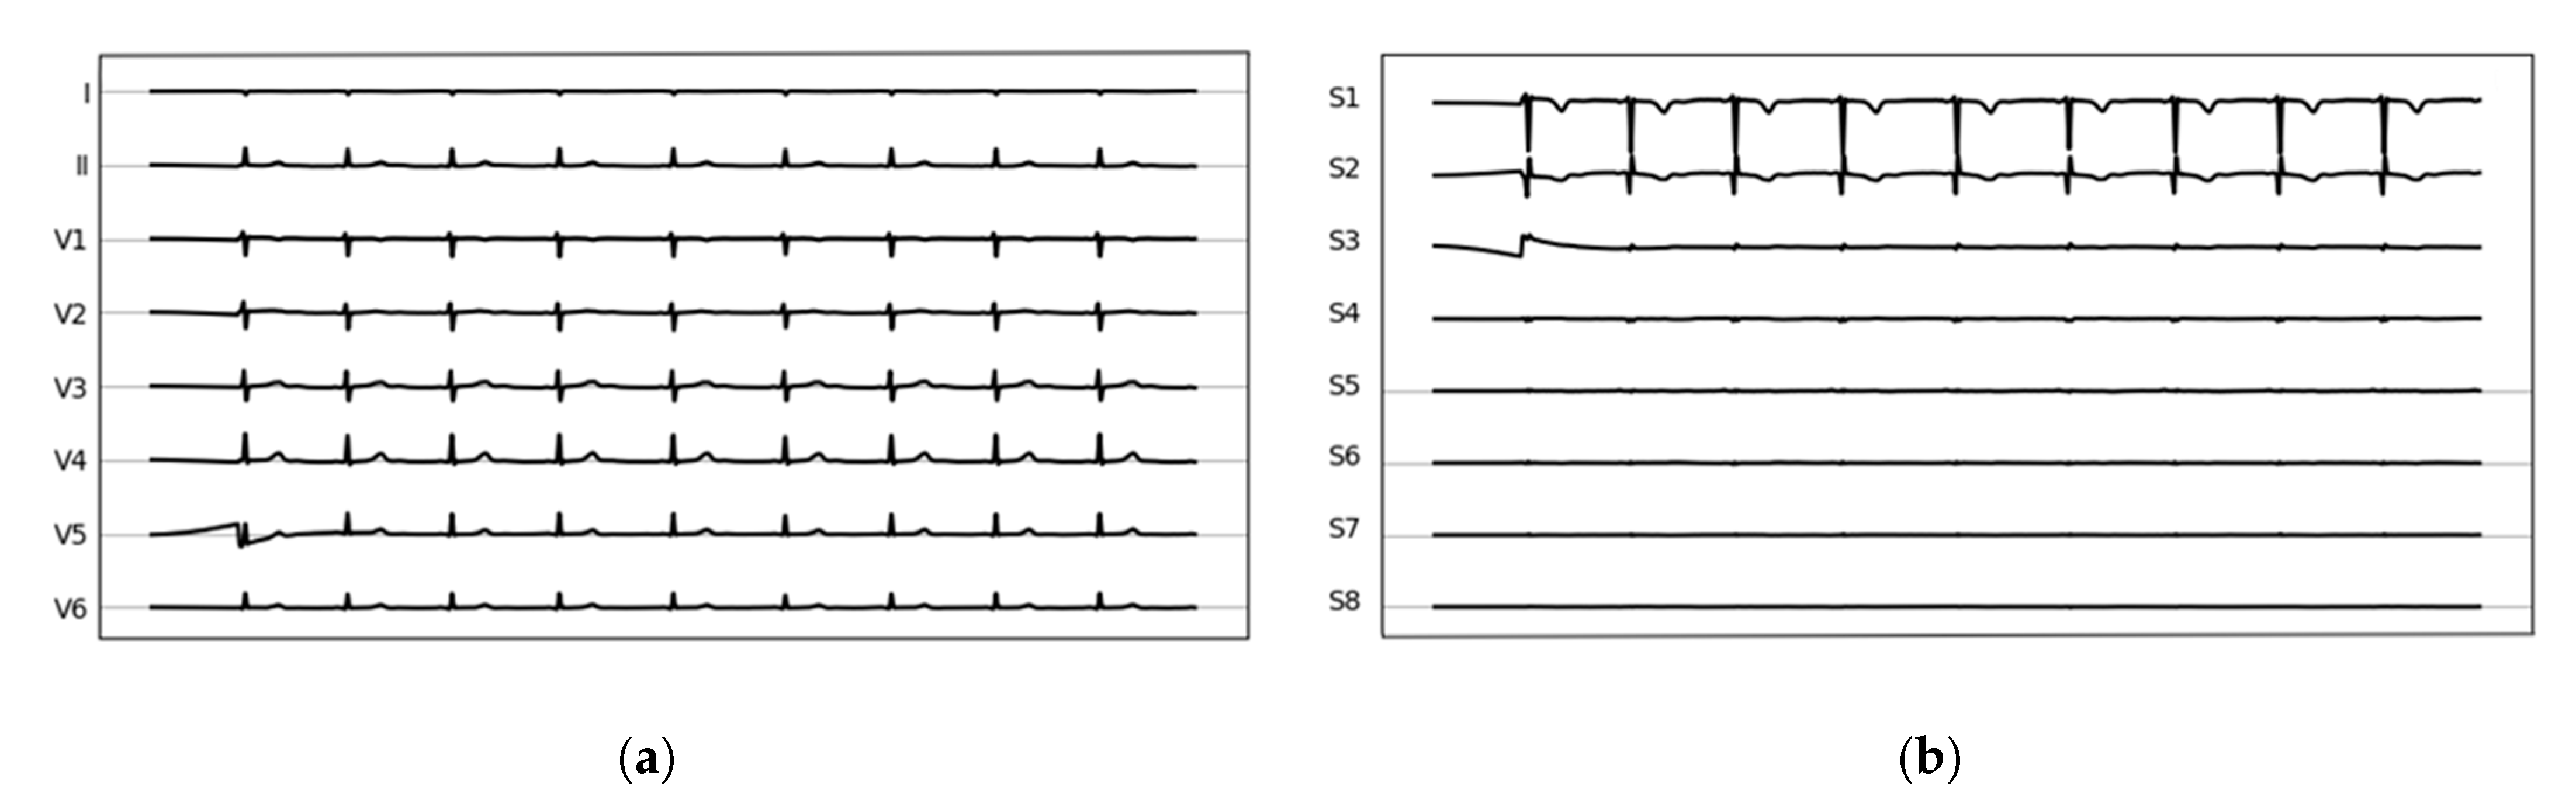
2.3. Electrocardiograph Procedure
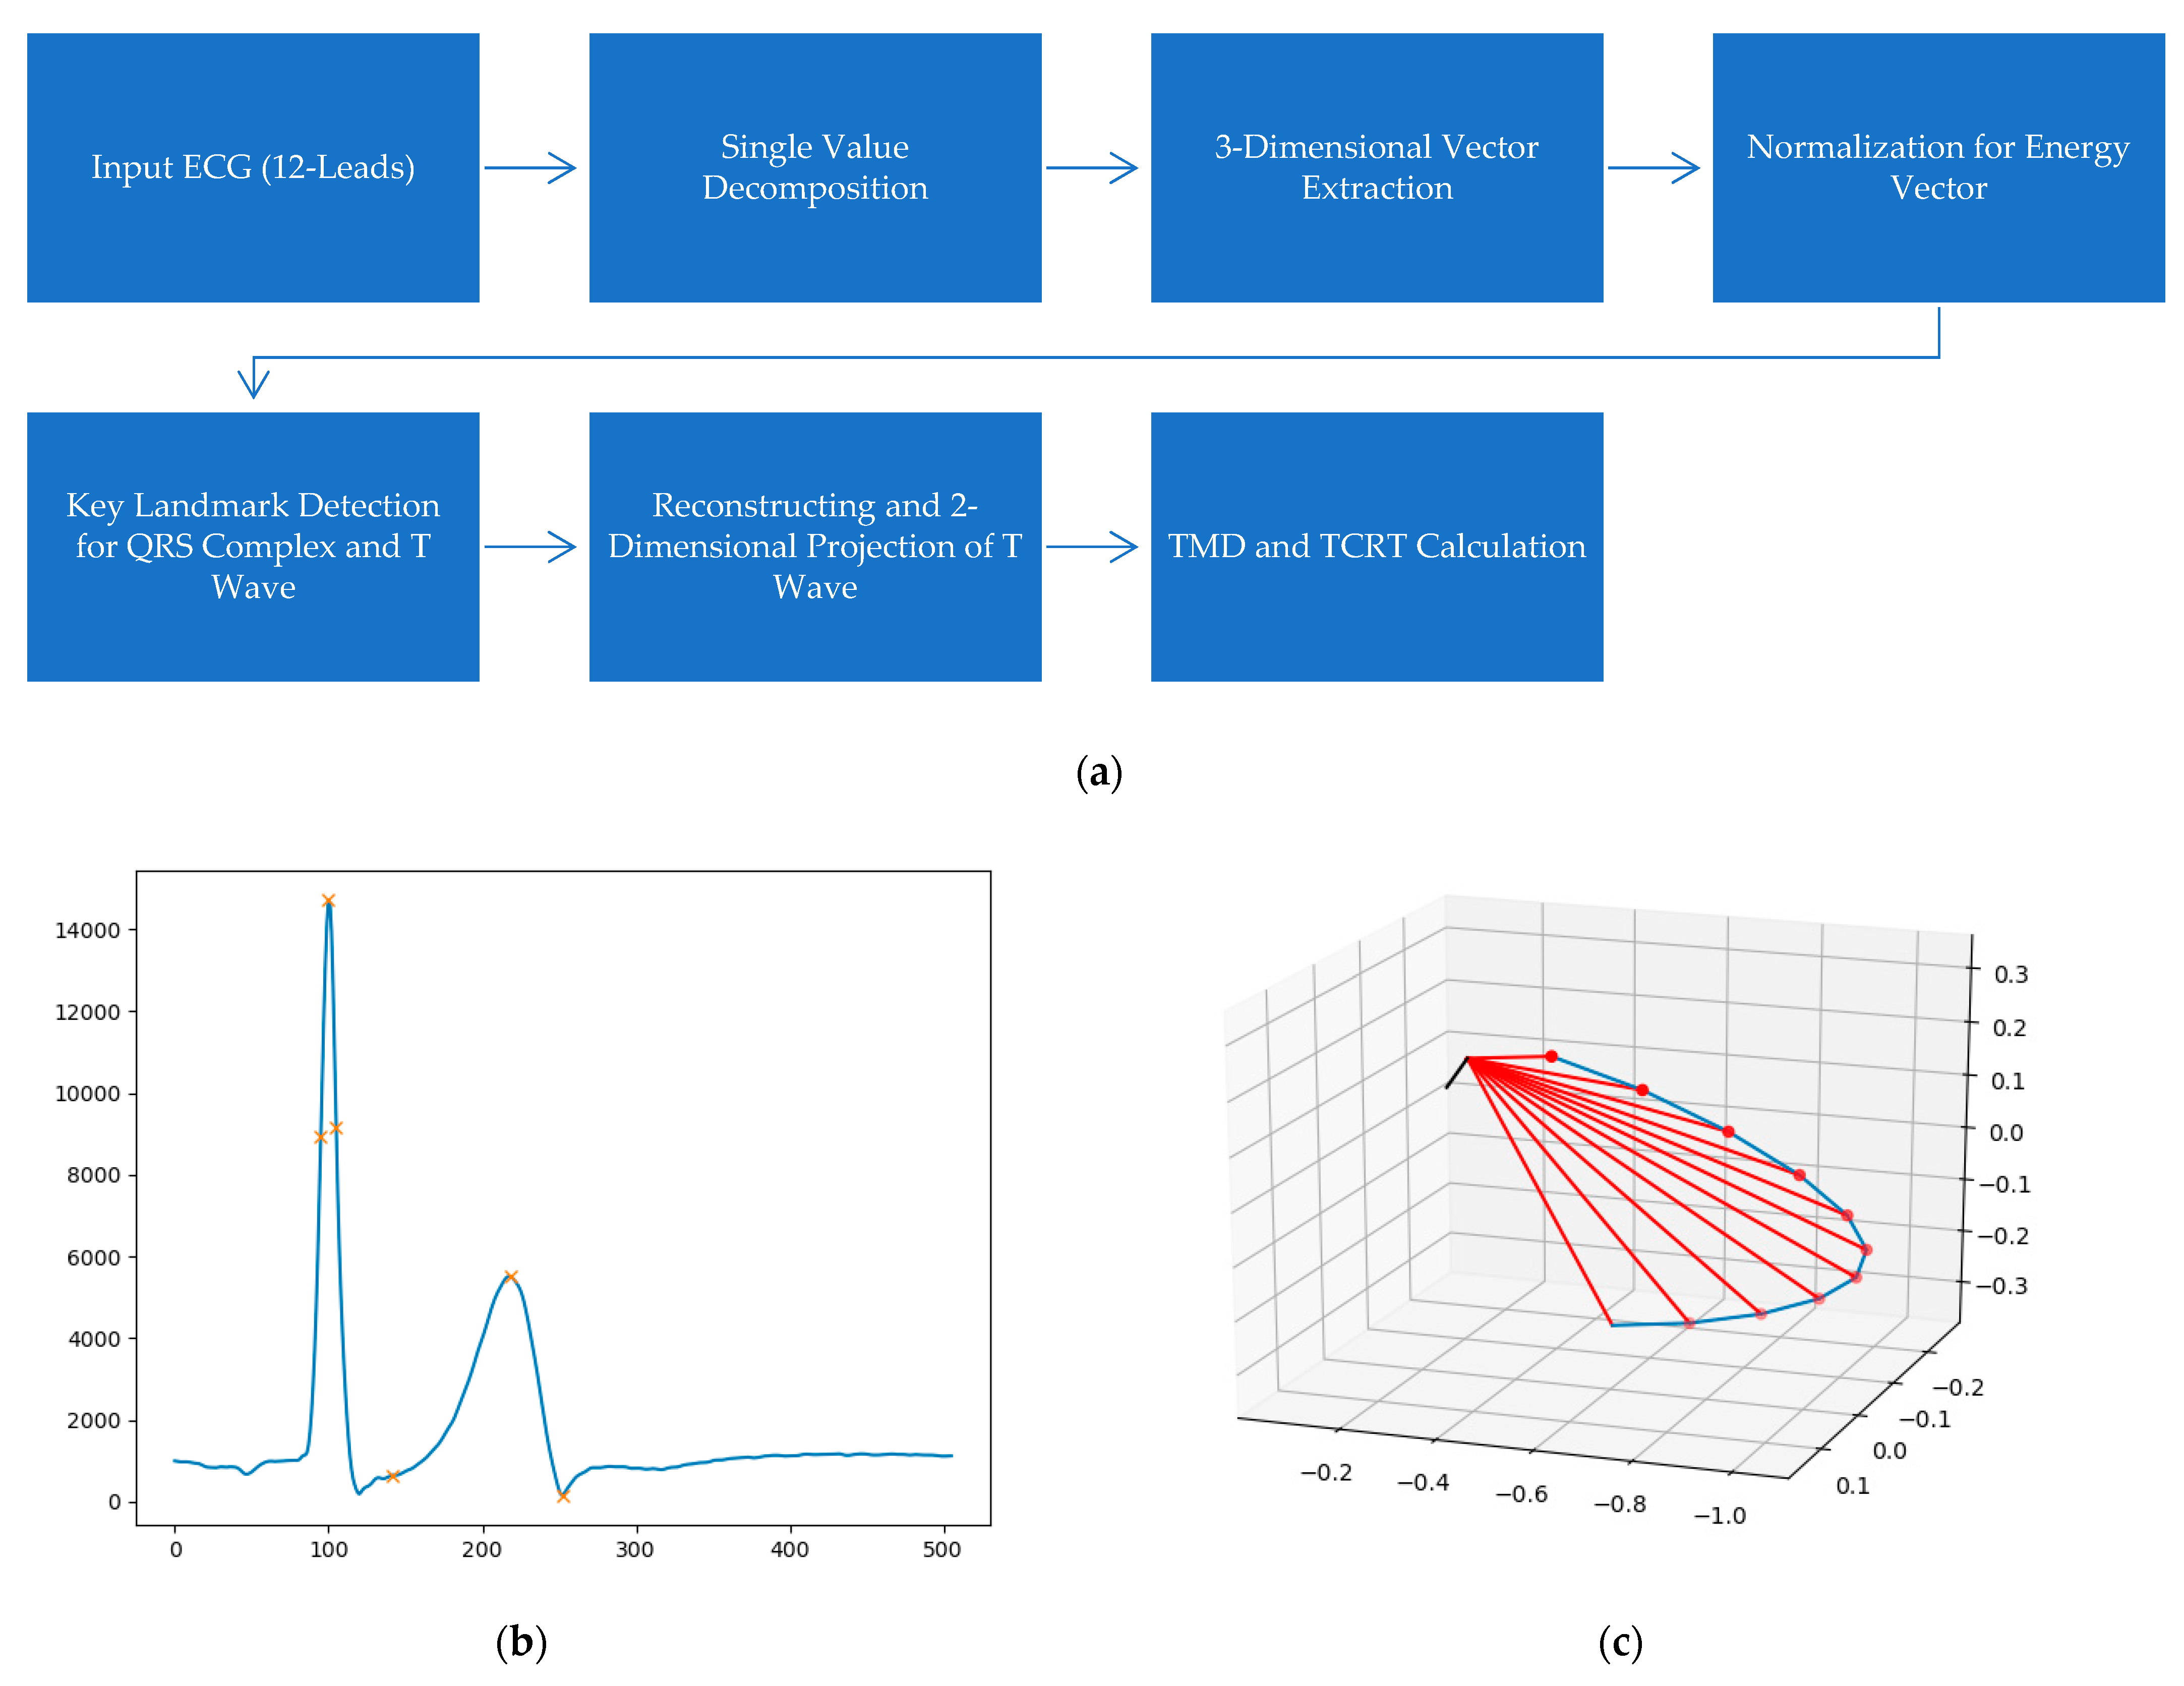
2.4. Repolarization Analysis
2.5. Statistical Analysis
3. Results
4. Discussion
5. Conclusions
Author Contributions
Funding
Institutional Review Board Statement
Informed Consent Statement
Data Availability Statement
Acknowledgments
Conflicts of Interest
References
- Guariguata, L.; Whiting, D.R.; Hambleton, I.; Beagley, J.; Linnenkamp, U.; Shaw, J.E. Global estimates of diabetes prevalence for 2013 and projections for 2035. Diabetes Res. Clin. Pract. 2014, 103, 137–149. [Google Scholar] [CrossRef] [PubMed]
- Low Wang, C.C.; Hess, C.N.; Hiatt, W.R.; Goldfine, A.B. Clinical Update: Cardiovascular Disease in Diabetes Mellitus: Atherosclerotic Cardiovascular Disease and Heart Failure in Type 2 Diabetes Mellitus—Mechanisms, Management, and Clinical Considerations. Circulation 2016, 133, 2459–2502. [Google Scholar] [CrossRef] [PubMed]
- Nussinovitch, U.; Cohen, O.; Kaminer, K.; Ilani, J.; Nussinovitch, N. Evaluating reliability of ultra-short ECG indices of heart rate variability in diabetes mellitus patients. J. Diabetes Complicat. 2012, 26, 450–453. [Google Scholar] [CrossRef] [PubMed]
- Mauricio, D.; Alonso, N.; Gratacos, M. Chronic Diabetes Complications: The Need to Move beyond Classical Concepts. Trends Endocrinol. Metab. 2020, 31, 287–295. [Google Scholar] [CrossRef] [PubMed]
- Jia, G.; Hill, M.A.; Sowers, J.R. Diabetic Cardiomyopathy: An Update of Mechanisms Contributing to This Clinical Entity. Circ. Res. 2018, 122, 624–638. [Google Scholar] [CrossRef] [PubMed]
- Eren, H.; Kaya, U.; Ocal, L.; Ocal, A.G.; Genc, O.; Genc, S.; Evlice, M. Presence of fragmented QRS may be associated with complex ventricular arrhythmias in patients with type-2 diabetes mellitus. Acta Cardiol. 2019, 76, 67–75. [Google Scholar] [CrossRef]
- Grisanti, L.A. Diabetes and Arrhythmias: Pathophysiology, Mechanisms and Therapeutic Outcomes. Front. Physiol. 2018, 9, 1669. [Google Scholar] [CrossRef]
- Nussinovitch, U. Normal ranges and potential modifiers of T-wave morphology parameters among healthy individuals: A meta-analysis. Pacing Clin. Electrophysiol. 2020, 43, 655–663. [Google Scholar] [CrossRef]
- Batchvarov, V.; Hnatkova, K.; Ghuran, A.; Poloniecki, J.; Camm, A.J.; Malik, M. Ventricular gradient as a risk factor in survivors of acute myocardial infarction. Pace 2003, 26, 373–376. [Google Scholar] [CrossRef] [PubMed]
- Tse, G.; Gong, M.; Wong, C.W.; Chan, C.; Georgopoulos, S.; Chan, Y.S.; Yan, B.P.; Li, G.; Whittaker, P.; Ciobanu, A.; et al. Total cosine R-to-T for predicting ventricular arrhythmic and mortality outcomes: A systematic review and meta-analysis. Ann. Noninvasive Electrocardiol. 2018, 23, e12495. [Google Scholar] [CrossRef]
- Hnatkova, K.; Seegers, J.; Barthel, P.; Novotny, T.; Smetana, P.; Zabel, M.; Schmidt, G.; Malik, M. Clinical value of different QRS-T angle expressions. Europace 2018, 20, 1352–1361. [Google Scholar] [CrossRef] [PubMed] [Green Version]
- Pirkola, J.M.; Konttinen, M.; Kentta, T.V.; Holmstrom, L.T.A.; Junttila, M.J.; Ukkola, O.H.; Huikuri, H.V.; Perkiomaki, J.S. Prognostic value of T-wave morphology parameters in coronary artery disease in current treatment era. Ann. Noninvasive Electrocardiol. 2018, 23, e12539. [Google Scholar] [CrossRef] [PubMed] [Green Version]
- Chow, E.; Bernjak, A.; Walkinshaw, E.; Lubina-Solomon, A.; Freeman, J.; Macdonald, I.A.; Sheridan, P.J.; Heller, S.R. Cardiac Autonomic Regulation and Repolarization During Acute Experimental Hypoglycemia in Type 2 Diabetes. Diabetes 2017, 66, 1322–1333. [Google Scholar] [CrossRef] [Green Version]
- Koivikko, M.L.; Karsikas, M.; Salmela, P.I.; Tapanainen, J.S.; Ruokonen, A.; Seppanen, T.; Huikuri, H.V.; Perkiomaki, J.S. Effects of controlled hypoglycaemia on cardiac repolarisation in patients with type 1 diabetes. Diabetologia 2008, 51, 426–435. [Google Scholar] [CrossRef] [Green Version]
- Huang, H.C.; Lin, L.Y.; Yu, H.Y.; Ho, Y.L. Risk stratification by T-wave morphology for cardiovascular mortality in patients with systolic heart failure. Europace 2009, 11, 1522–1528. [Google Scholar] [CrossRef] [PubMed]
- Friedman, H.S. Determinants of the total cosine of the spatial angle between the QRS complex and the T wave (TCRT): Implications for distinguishing primary from secondary T-wave abnormalities. J. Electrocardiol. 2007, 40, 12–17. [Google Scholar] [CrossRef]
- Poulikakos, D.; Hnatkova, K.; Banerjee, D.; Malik, M. Association of QRS-T angle and heart rate variability with major cardiac events and mortality in hemodialysis patients. Ann. Noninvasive Electrocardiol. 2018, 23, e12570. [Google Scholar] [CrossRef] [PubMed] [Green Version]
- Pippitt, K.; Li, M.; Gurgle, H.E. Diabetes Mellitus: Screening and Diagnosis. Am. Fam. Physician 2016, 93, 103–109. [Google Scholar]
- Acar, B.; Yi, G.; Hnatkova, K.; Malik, M. Spatial, temporal and wavefront direction characteristics of 12-lead T-wave morphology. Med. Biol. Eng. Comput. 1999, 37, 574–584. [Google Scholar] [CrossRef] [PubMed]
- Nayyar, S.; Hasan, M.A.; Roberts-Thomson, K.C.; Sullivan, T.; Baumert, M. Effect of Loss of Heart Rate Variability on T-Wave Heterogeneity and QT Variability in Heart Failure Patients: Implications in Ventricular Arrhythmogenesis. Cardiovasc. Eng. Technol. 2017, 8, 219–228. [Google Scholar] [CrossRef]
- Available online: https://github.com/PIA-Group/BioSPPy (accessed on 10 January 2021).
- Kentta, T.; Karsikas, M.; Junttila, M.J.; Perkiomaki, J.S.; Seppanen, T.; Kiviniemi, A.; Nieminen, T.; Lehtimaki, T.; Nikus, K.; Lehtinen, R.; et al. QRS-T morphology measured from exercise electrocardiogram as a predictor of cardiac mortality. Europace 2011, 13, 701–707. [Google Scholar] [CrossRef] [PubMed]
- May, O.; Graversen, C.B.; Johansen, M.O.; Arildsen, H. The prognostic value of the frontal QRS-T angle is comparable to cardiovascular autonomic neuropathy regarding long-term mortality in people with diabetes—A population based study. Diabetes Res. Clin. Pract. 2018, 142, 264–268. [Google Scholar] [CrossRef] [PubMed]
- Tanriverdi, Z.; Besli, F.; Gungoren, F.; Tascanov, M.B. What is the normal range of the frontal QRS-T angle? Diabetes Res. Clin. Pract. 2020, 160, 107645. [Google Scholar] [CrossRef] [PubMed]
- Smetana, G.W.; Nathan, D.M.; Dugdale, D.C.; Burns, R.B. To What Target Hemoglobin A1c Level Would You Treat This Patient With Type 2 Diabetes?: Grand Rounds Discussion From Beth Israel Deaconess Medical Center. Ann. Intern. Med. 2019, 171, 505–513. [Google Scholar] [CrossRef] [PubMed]
- Tokatli, A.; Kilicaslan, F.; Alis, M.; Yiginer, O.; Uzun, M. Prolonged Tp-e Interval, Tp-e/QT Ratio and Tp-e/QTc Ratio in Patients with Type 2 Diabetes Mellitus. Endocrinol. Metab. 2016, 31, 105–112. [Google Scholar] [CrossRef] [Green Version]
- Kittnar, O. Electrocardiographic changes in diabetes mellitus. Physiol. Res. 2015, 64 (Suppl. S5), S559–S566. [Google Scholar] [CrossRef]
- Tokatli, A.; Yiginer, O.; Kilicaslan, F.; Uzun, M. Effect of cardiac rehabilitation on ventricular repolarization in patients with type 2 diabetes and coronary heart disease: Non-invasive quantification via transmural dispersion of repolarization. Heart Lung 2015, 44, 459–460. [Google Scholar] [CrossRef]
- Zinman, B.; Wanner, C.; Lachin, J.M.; Fitchett, D.; Bluhmki, E.; Hantel, S.; Mattheus, M.; Devins, T.; Johansen, O.E.; Woerle, H.J.; et al. Empagliflozin, Cardiovascular Outcomes, and Mortality in Type 2 Diabetes. N. Engl. J. Med. 2015, 373, 2117–2128. [Google Scholar] [CrossRef] [Green Version]
- Wiviott, S.D.; Raz, I.; Bonaca, M.P.; Mosenzon, O.; Kato, E.T.; Cahn, A.; Silverman, M.G.; Zelniker, T.A.; Kuder, J.F.; Murphy, S.A.; et al. Dapagliflozin and Cardiovascular Outcomes in Type 2 Diabetes. N. Engl. J. Med. 2019, 380, 347–357. [Google Scholar] [CrossRef] [PubMed]
- Sato, T.; Miki, T.; Furukawa, S.; Matsuura, B.; Hiasa, Y.; Ohnishi, H.; Tanno, M.; Miura, T. Longitudinal impact of dapagliflozin treatment on ventricular repolarization heterogeneity in patients with type 2 diabetes. J. Diabetes Investig. 2019, 10, 1593–1594. [Google Scholar] [CrossRef] [PubMed] [Green Version]

| Parameter | Non-DM/IFG (n = 74) | DM/IFG (n = 50) | p Value |
|---|---|---|---|
| Age (years) | 57.3 ± 1.5 | 58.4 ± 1.8 | NS |
| M/F | 40/34 | 26/24 | NS |
| Height (m) | 1.69 ± 0.01 | 1.71 ± 0.01 | NS |
| Weight (kg) | 79.2 ± 1.9 | 82.1 ± 2.0 | NS |
| BMI (kg/m2) | 27.5 ± 0.5 | 28.1 ± 0.7 | NS |
| Obesity * (%) | 23.0 | 36.0 | NS |
| Current smoker (%) | 14.9 | 14.0 | NS |
| Past smoker (%) | 24.7 | 26.0 | NS |
| Hypertension (%) | 39.5 | 68.0 | NS |
| CVD ** (%) | 0 | 0 | NS |
| s/p angiography (%) | 0 | 0 | NS |
| FHx of IHD (%) | 37.8 | 40 | NS |
| Dyslipidemia (%) | 66.2 | 76.0 | NS |
| SBP (mmHg) | 130.5 ± 2.2 | 134.4 ± 2.6 | NS |
| DBP (mmHg) | 79.0 ± 1.1 | 75.5 ± 1.5 | NS |
| Aspirin (%) | 35.1 | 50.0 | NS |
| ACEI/ARBs (%) | 36.5 | 52.0 | NS |
| CCB (%) | 20.3 | 30.0 | NS |
| Beta blockers (%) | 29.7 | 34.0 | NS |
| Thiazides (%) | 16.2 | 26.0 | NS |
| Statins (%) | 36.5 | 60.0 | <0.01 |
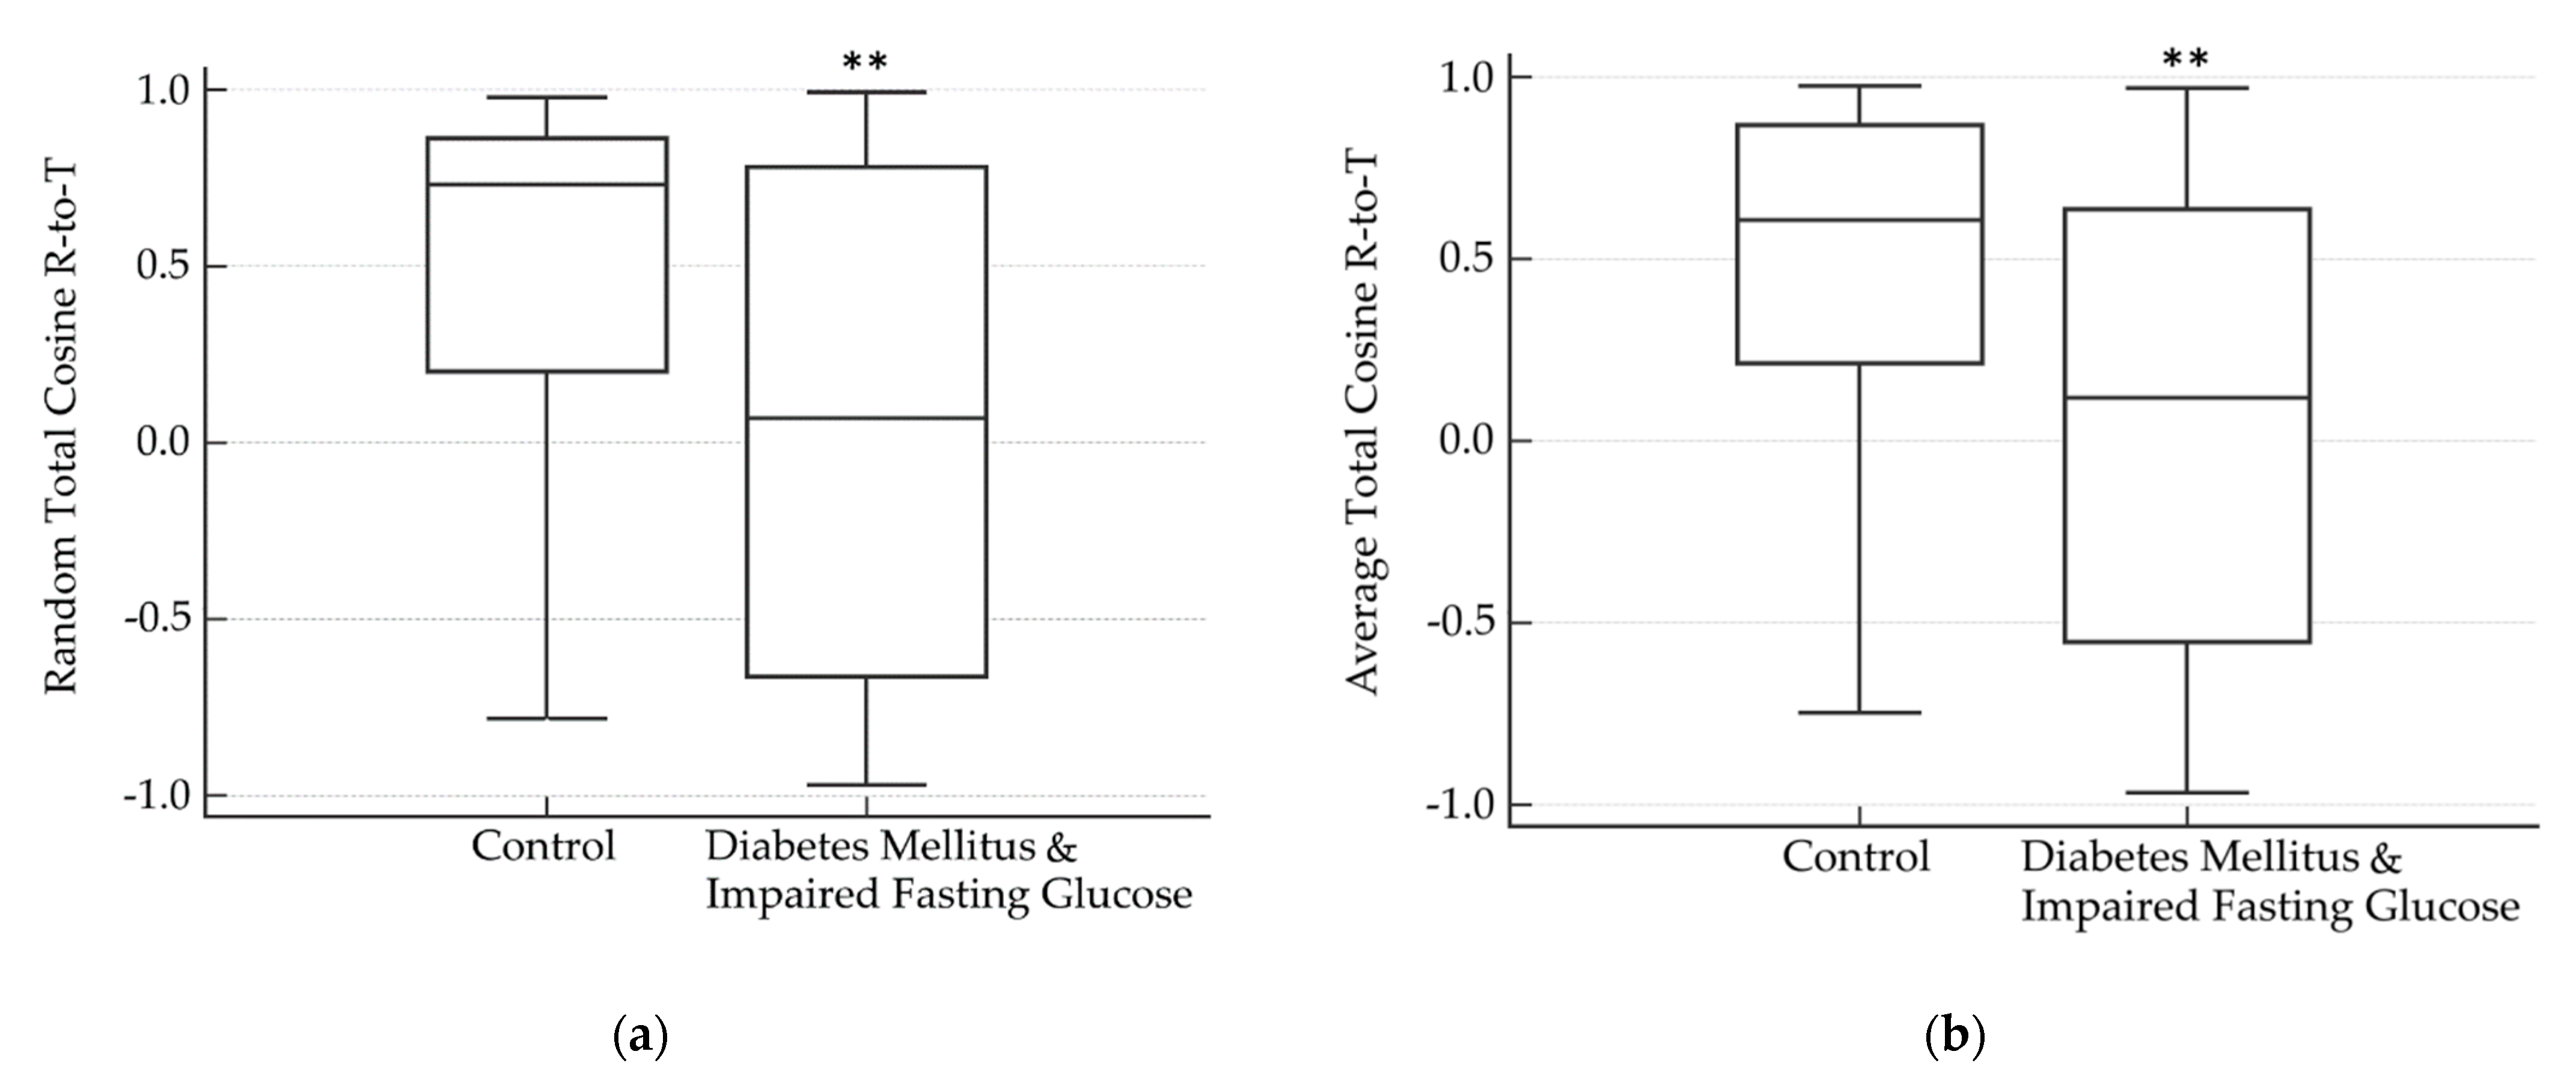
| Random TCRT | 0.43 ± 0.07 | 0.06 ± 0.10 | <0.01 |
| Random TMD (deg) | 19.6 ± 1.9 | 21.5 ± 2.5 | NS |
| Random TMDpre | 18.0 ± 2.0 | 21.3 ± 2.7 | NS |
| Random TMDpost | 16.8 ± 2.2 | 19.7 ± 3.1 | NS |
| Average TCRT | 0.44 ± 0.06 | 0.08 ± 0.09 | <0.01 |
| Average TMD (deg) | 19.7 ± 1.8 | 21.0 ± 2.5 | NS |
| Average TMDpre | 18.7 ± 1.8 | 20.9 ± 2.4 | NS |
| Average TMDpost | 16.8 ± 2.1 | 18.8 ± 2.9 | NS |
| QT (ms) | 380.6 ± 3.4 | 371.5 ± 4.8 | NS |
| QTc (ms) | 387.4 ± 2.4 | 393.1 ± 3.3 | NS |
| Tp-e (ms) | 65.5 ± 1.3 | 69.8 ± 1.8 | 0.01 |
| Tp-e/QT | 0.17 ± 0.00 | 0.19 ± 0.01 | <0.01 |
| Tp-e/QTc | 0.17 ± 0.00 | 0.18 ± 0.00 | NS |
Publisher’s Note: MDPI stays neutral with regard to jurisdictional claims in published maps and institutional affiliations. |
© 2022 by the authors. Licensee MDPI, Basel, Switzerland. This article is an open access article distributed under the terms and conditions of the Creative Commons Attribution (CC BY) license (https://creativecommons.org/licenses/by/4.0/).
Share and Cite
Stahi, T.; Kaminer, K.; Shavit, I.; Nussinovitch, U. Diabetes without Overt Cardiac Disease Is Associated with Markers of Abnormal Repolarization: A Case-Control Study. Life 2022, 12, 1173. https://doi.org/10.3390/life12081173
Stahi T, Kaminer K, Shavit I, Nussinovitch U. Diabetes without Overt Cardiac Disease Is Associated with Markers of Abnormal Repolarization: A Case-Control Study. Life. 2022; 12(8):1173. https://doi.org/10.3390/life12081173
Chicago/Turabian StyleStahi, Tomer, Keren Kaminer, Itay Shavit, and Udi Nussinovitch. 2022. "Diabetes without Overt Cardiac Disease Is Associated with Markers of Abnormal Repolarization: A Case-Control Study" Life 12, no. 8: 1173. https://doi.org/10.3390/life12081173
APA StyleStahi, T., Kaminer, K., Shavit, I., & Nussinovitch, U. (2022). Diabetes without Overt Cardiac Disease Is Associated with Markers of Abnormal Repolarization: A Case-Control Study. Life, 12(8), 1173. https://doi.org/10.3390/life12081173