
Delayed Maturation of Oligodendrocyte Progenitors by Microgravity: Implications for Multiple Sclerosis and Space Flight

Abstract
1. Introduction
2. Materials and Methods
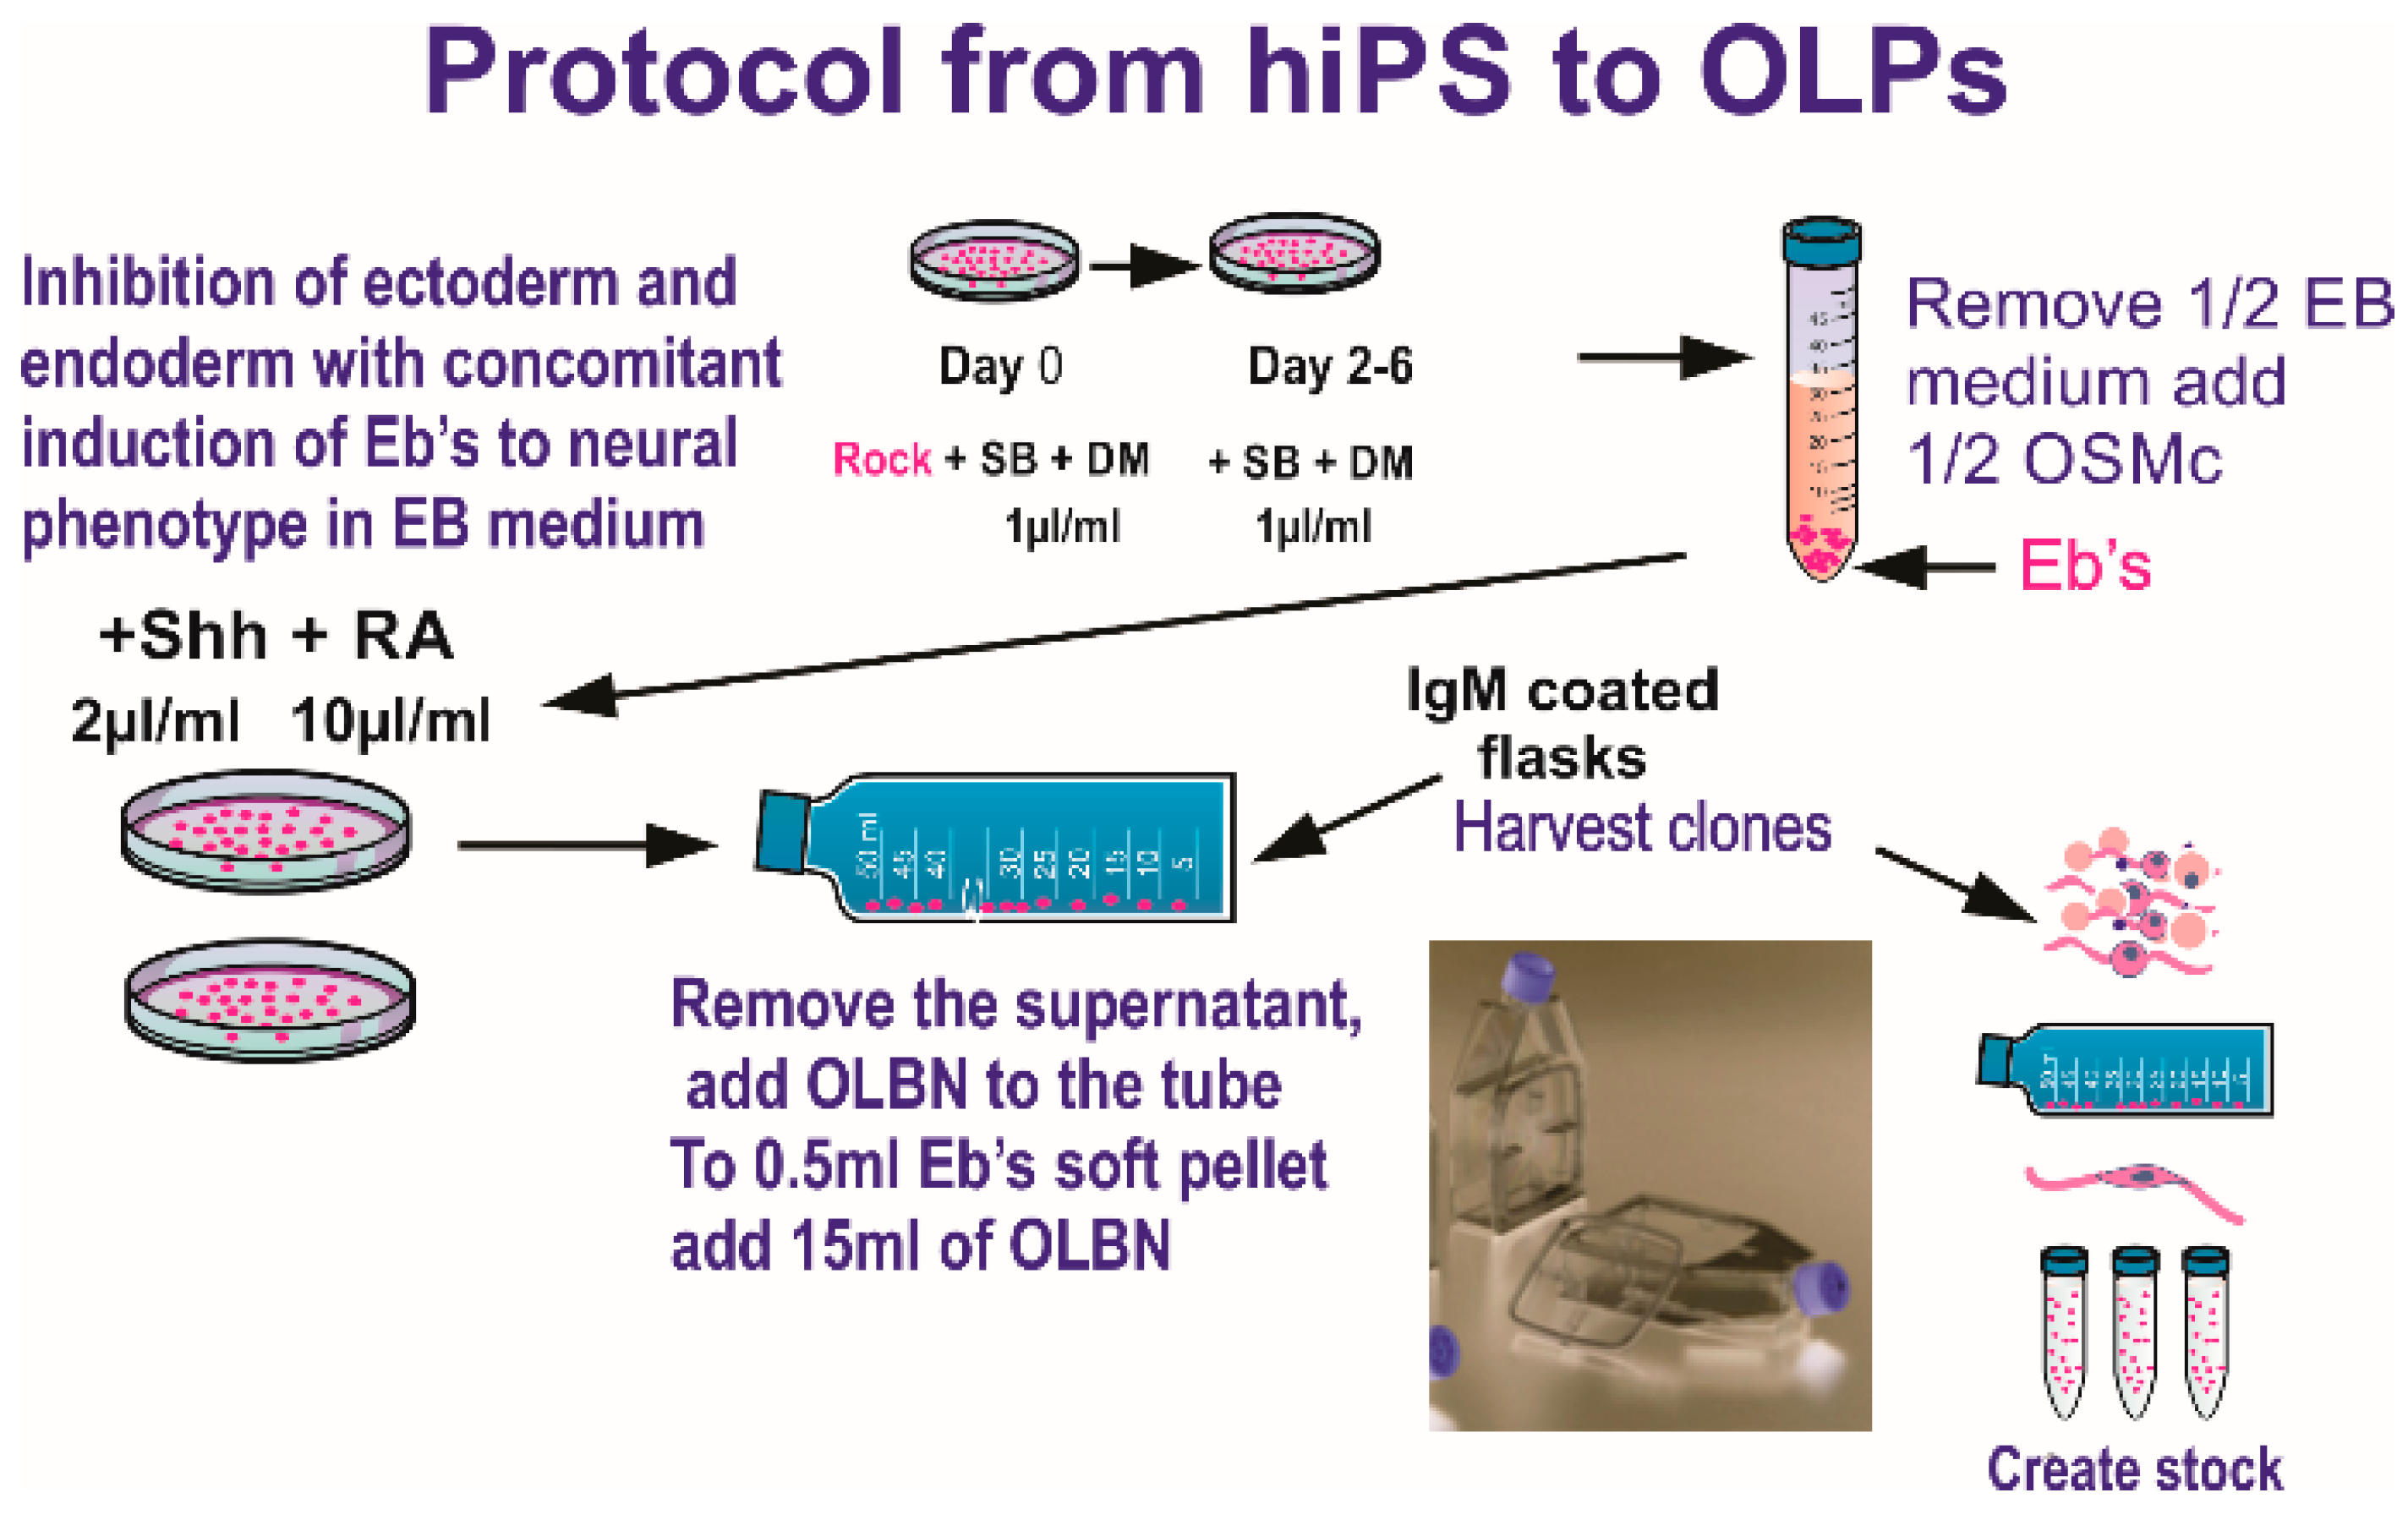
2.1. Cells and Culture System

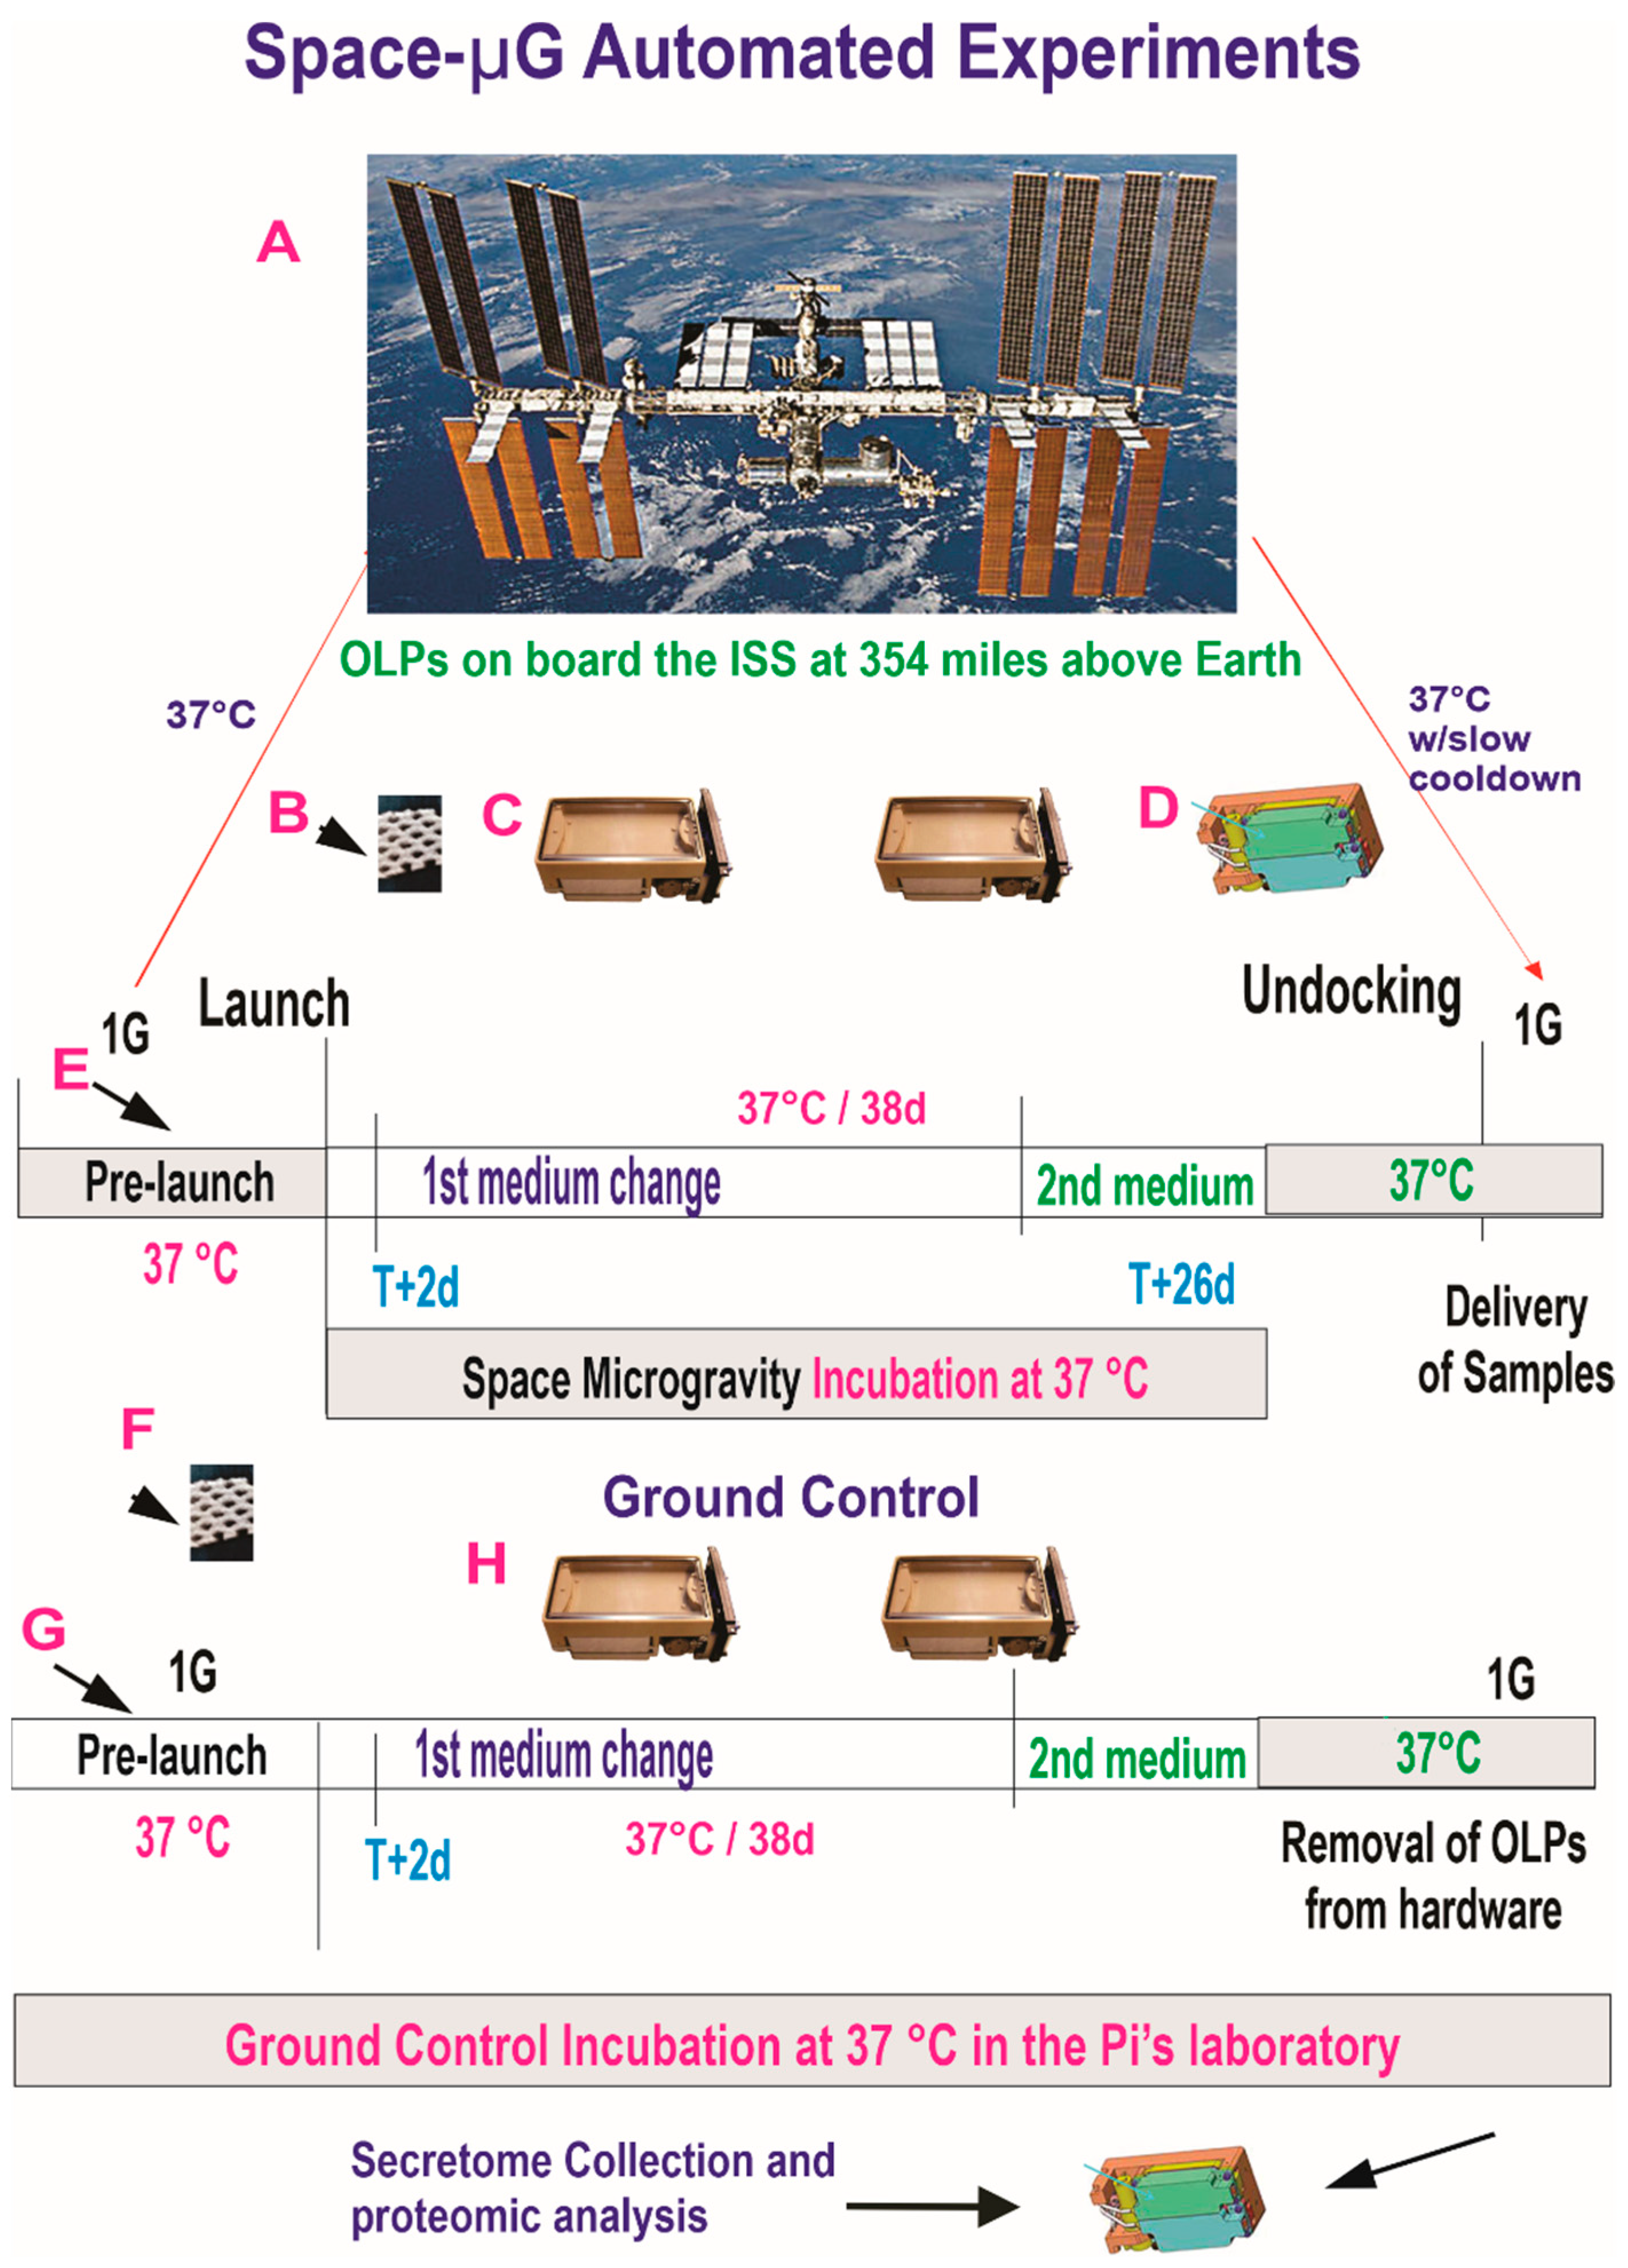
2.2. Hardware and Space Flight
2.3. Time-Lapse of SPC-OLPs Behavior
2.4. Immunofluorescence
2.5. Proteomics and Secretome
2.5.1. Synopsis of the Space Flight for the Active Experiment Using Automated Type IV Units
2.5.2. Preparation of Samples 2-D DIGE
2.5.3. IEF and SDS-PAGE
2.5.4. Image Scan and Data Analysis
2.5.5. Spot Picking and Trypsin Digestion
2.5.6. Mass Spectrometry
2.5.7. Database Search
2.6. Statistics
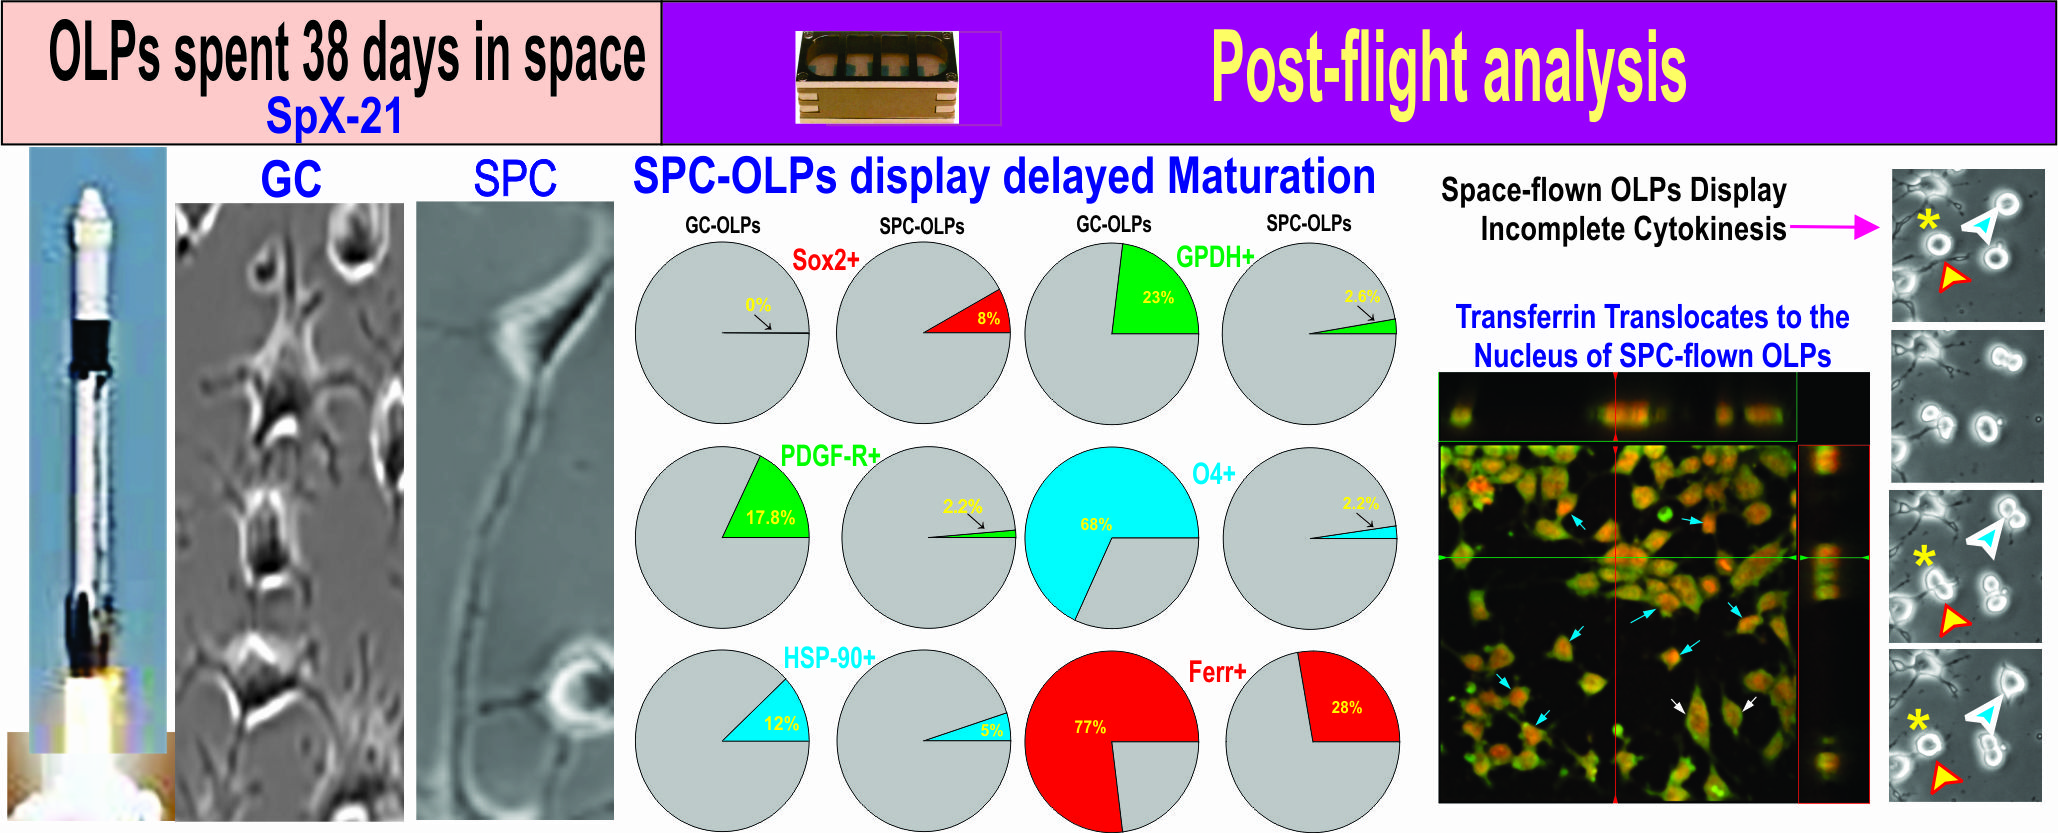
3. Results
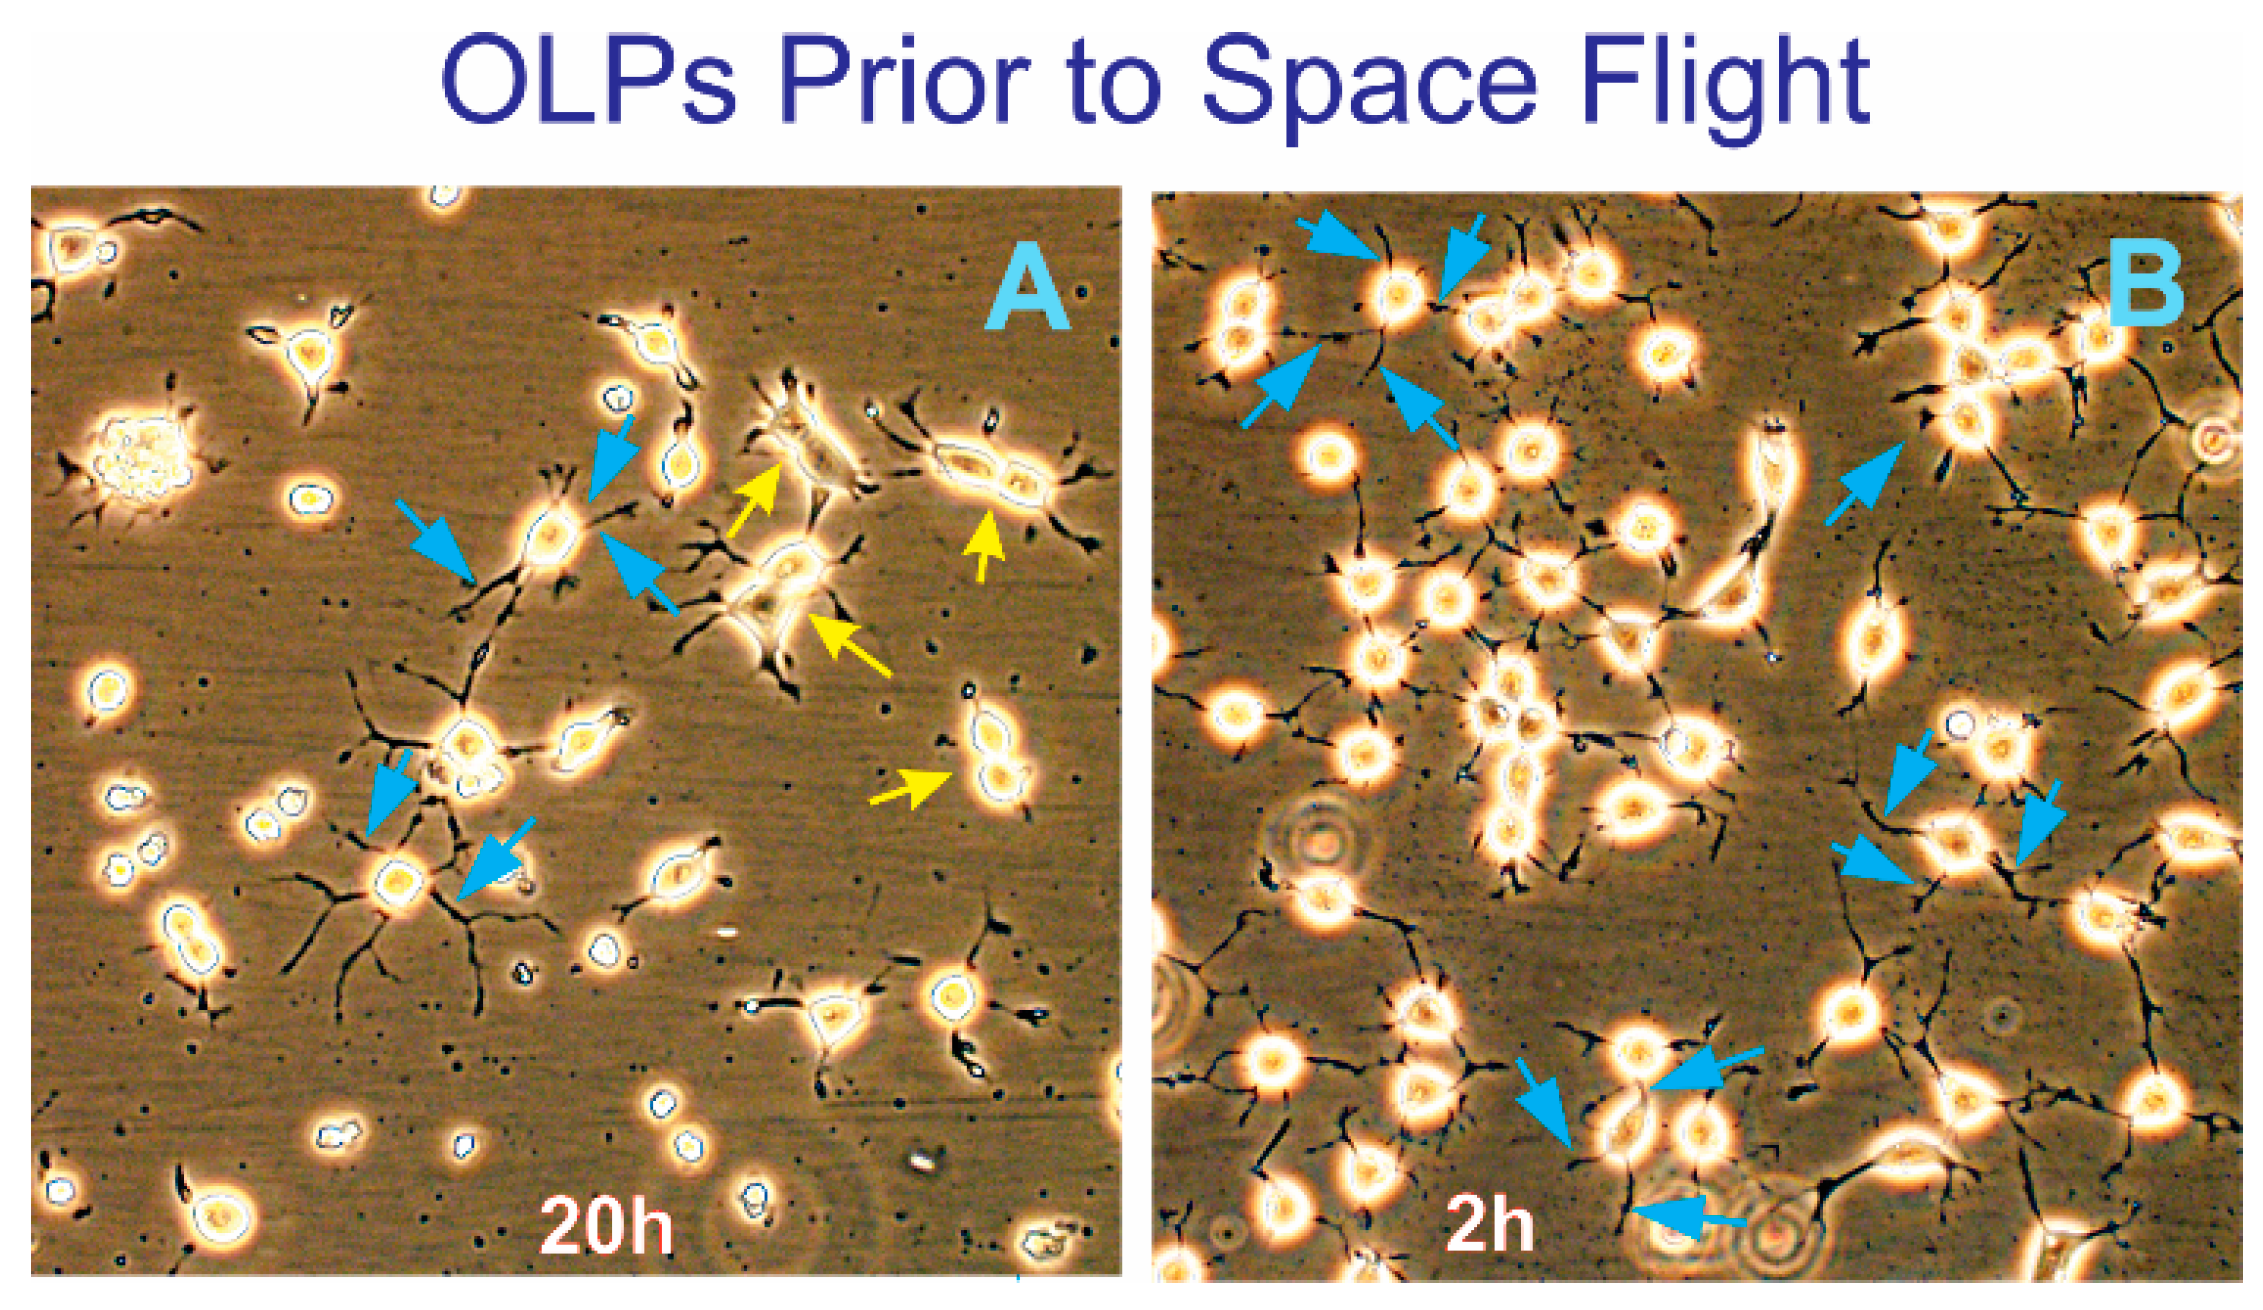
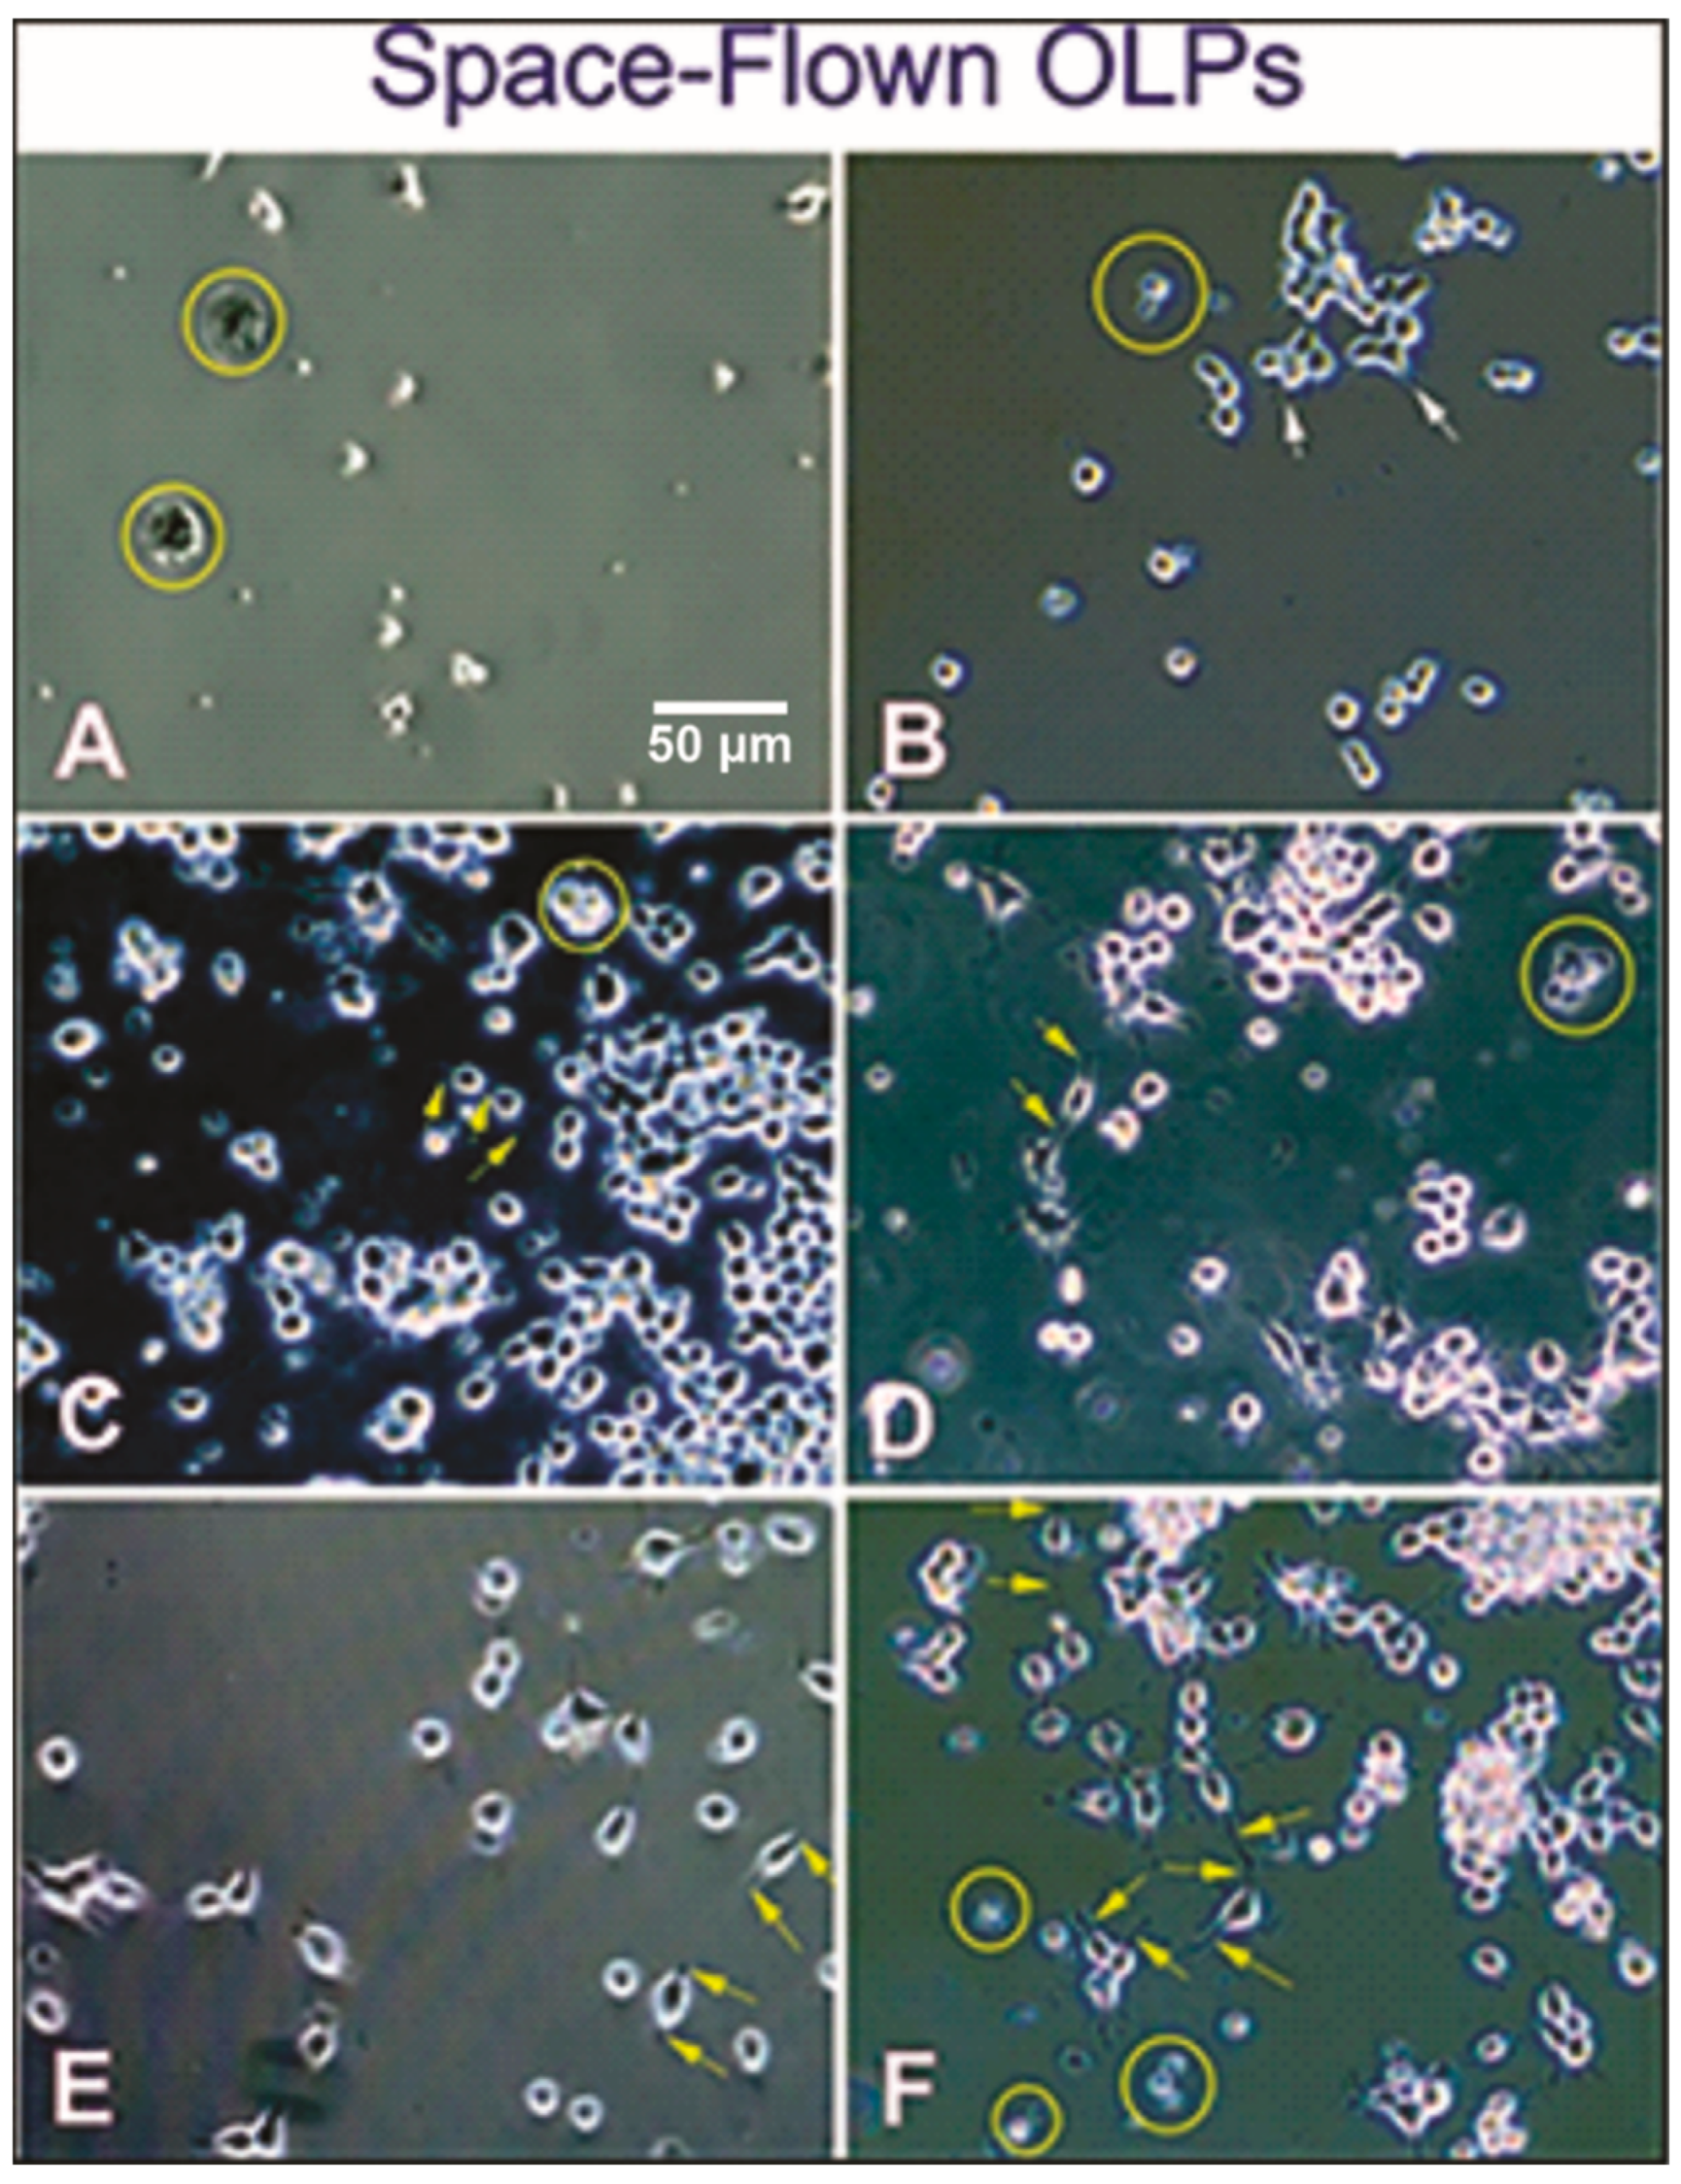
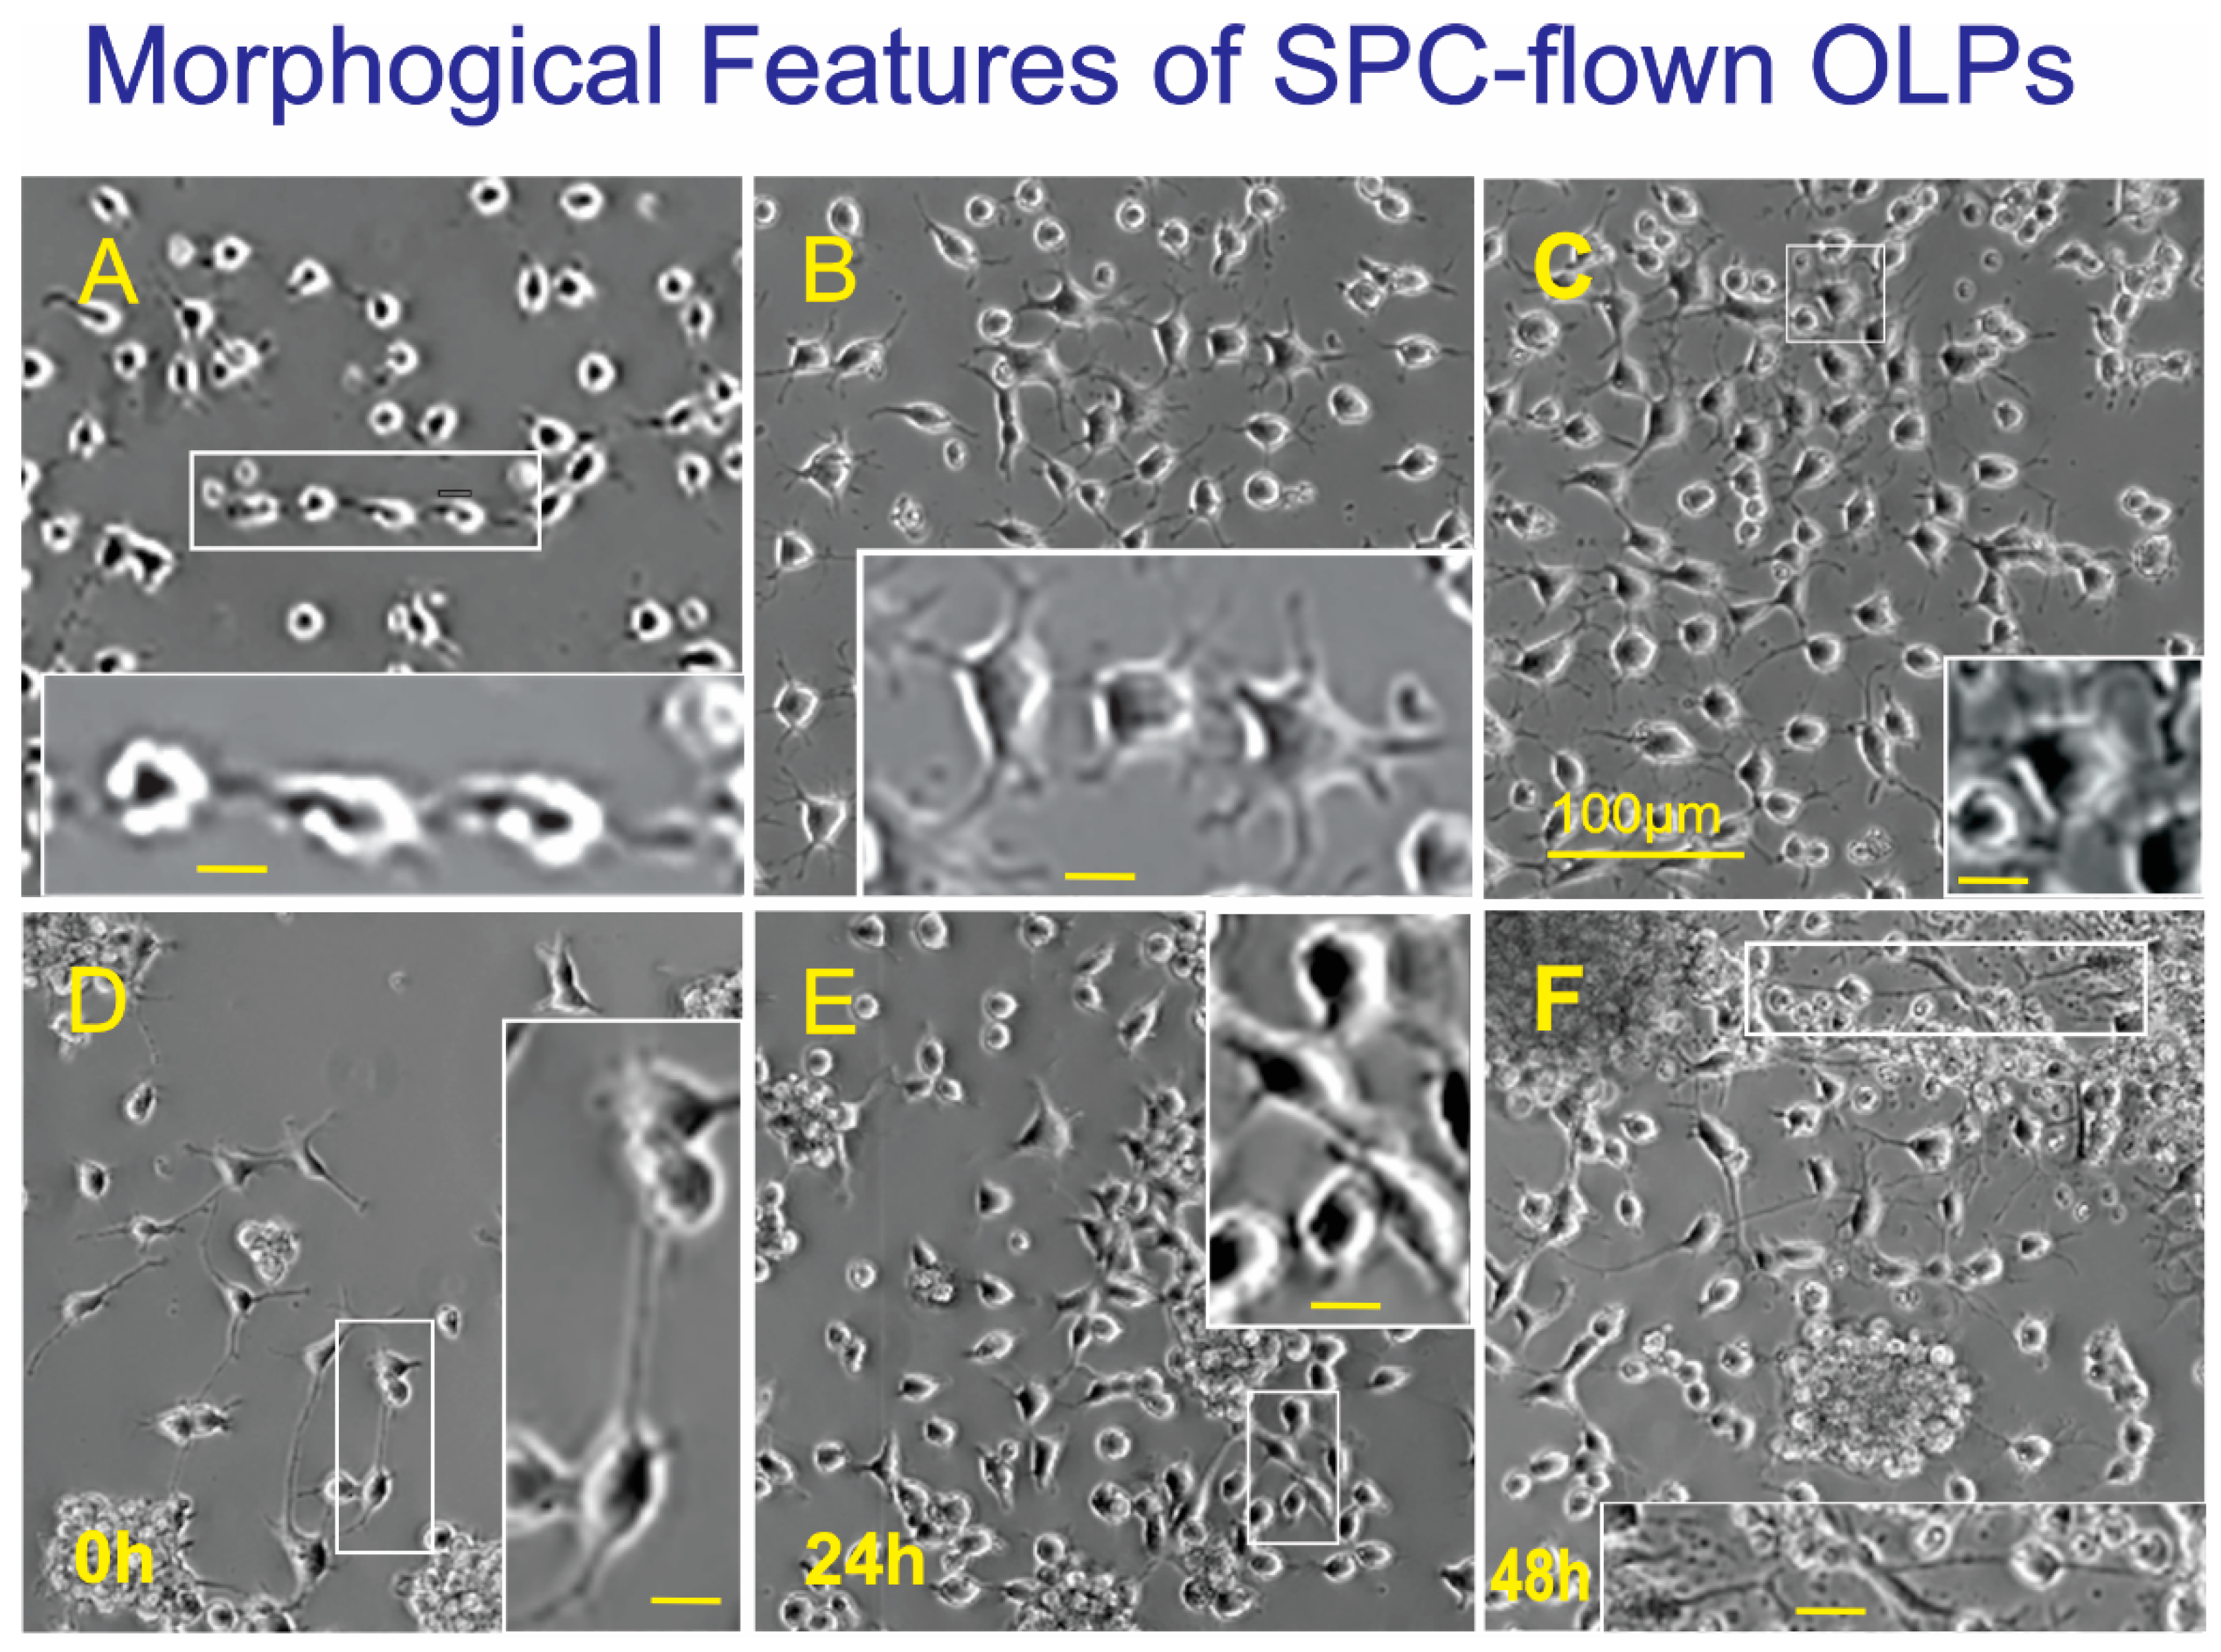
3.1. Live OLPs Back from Space
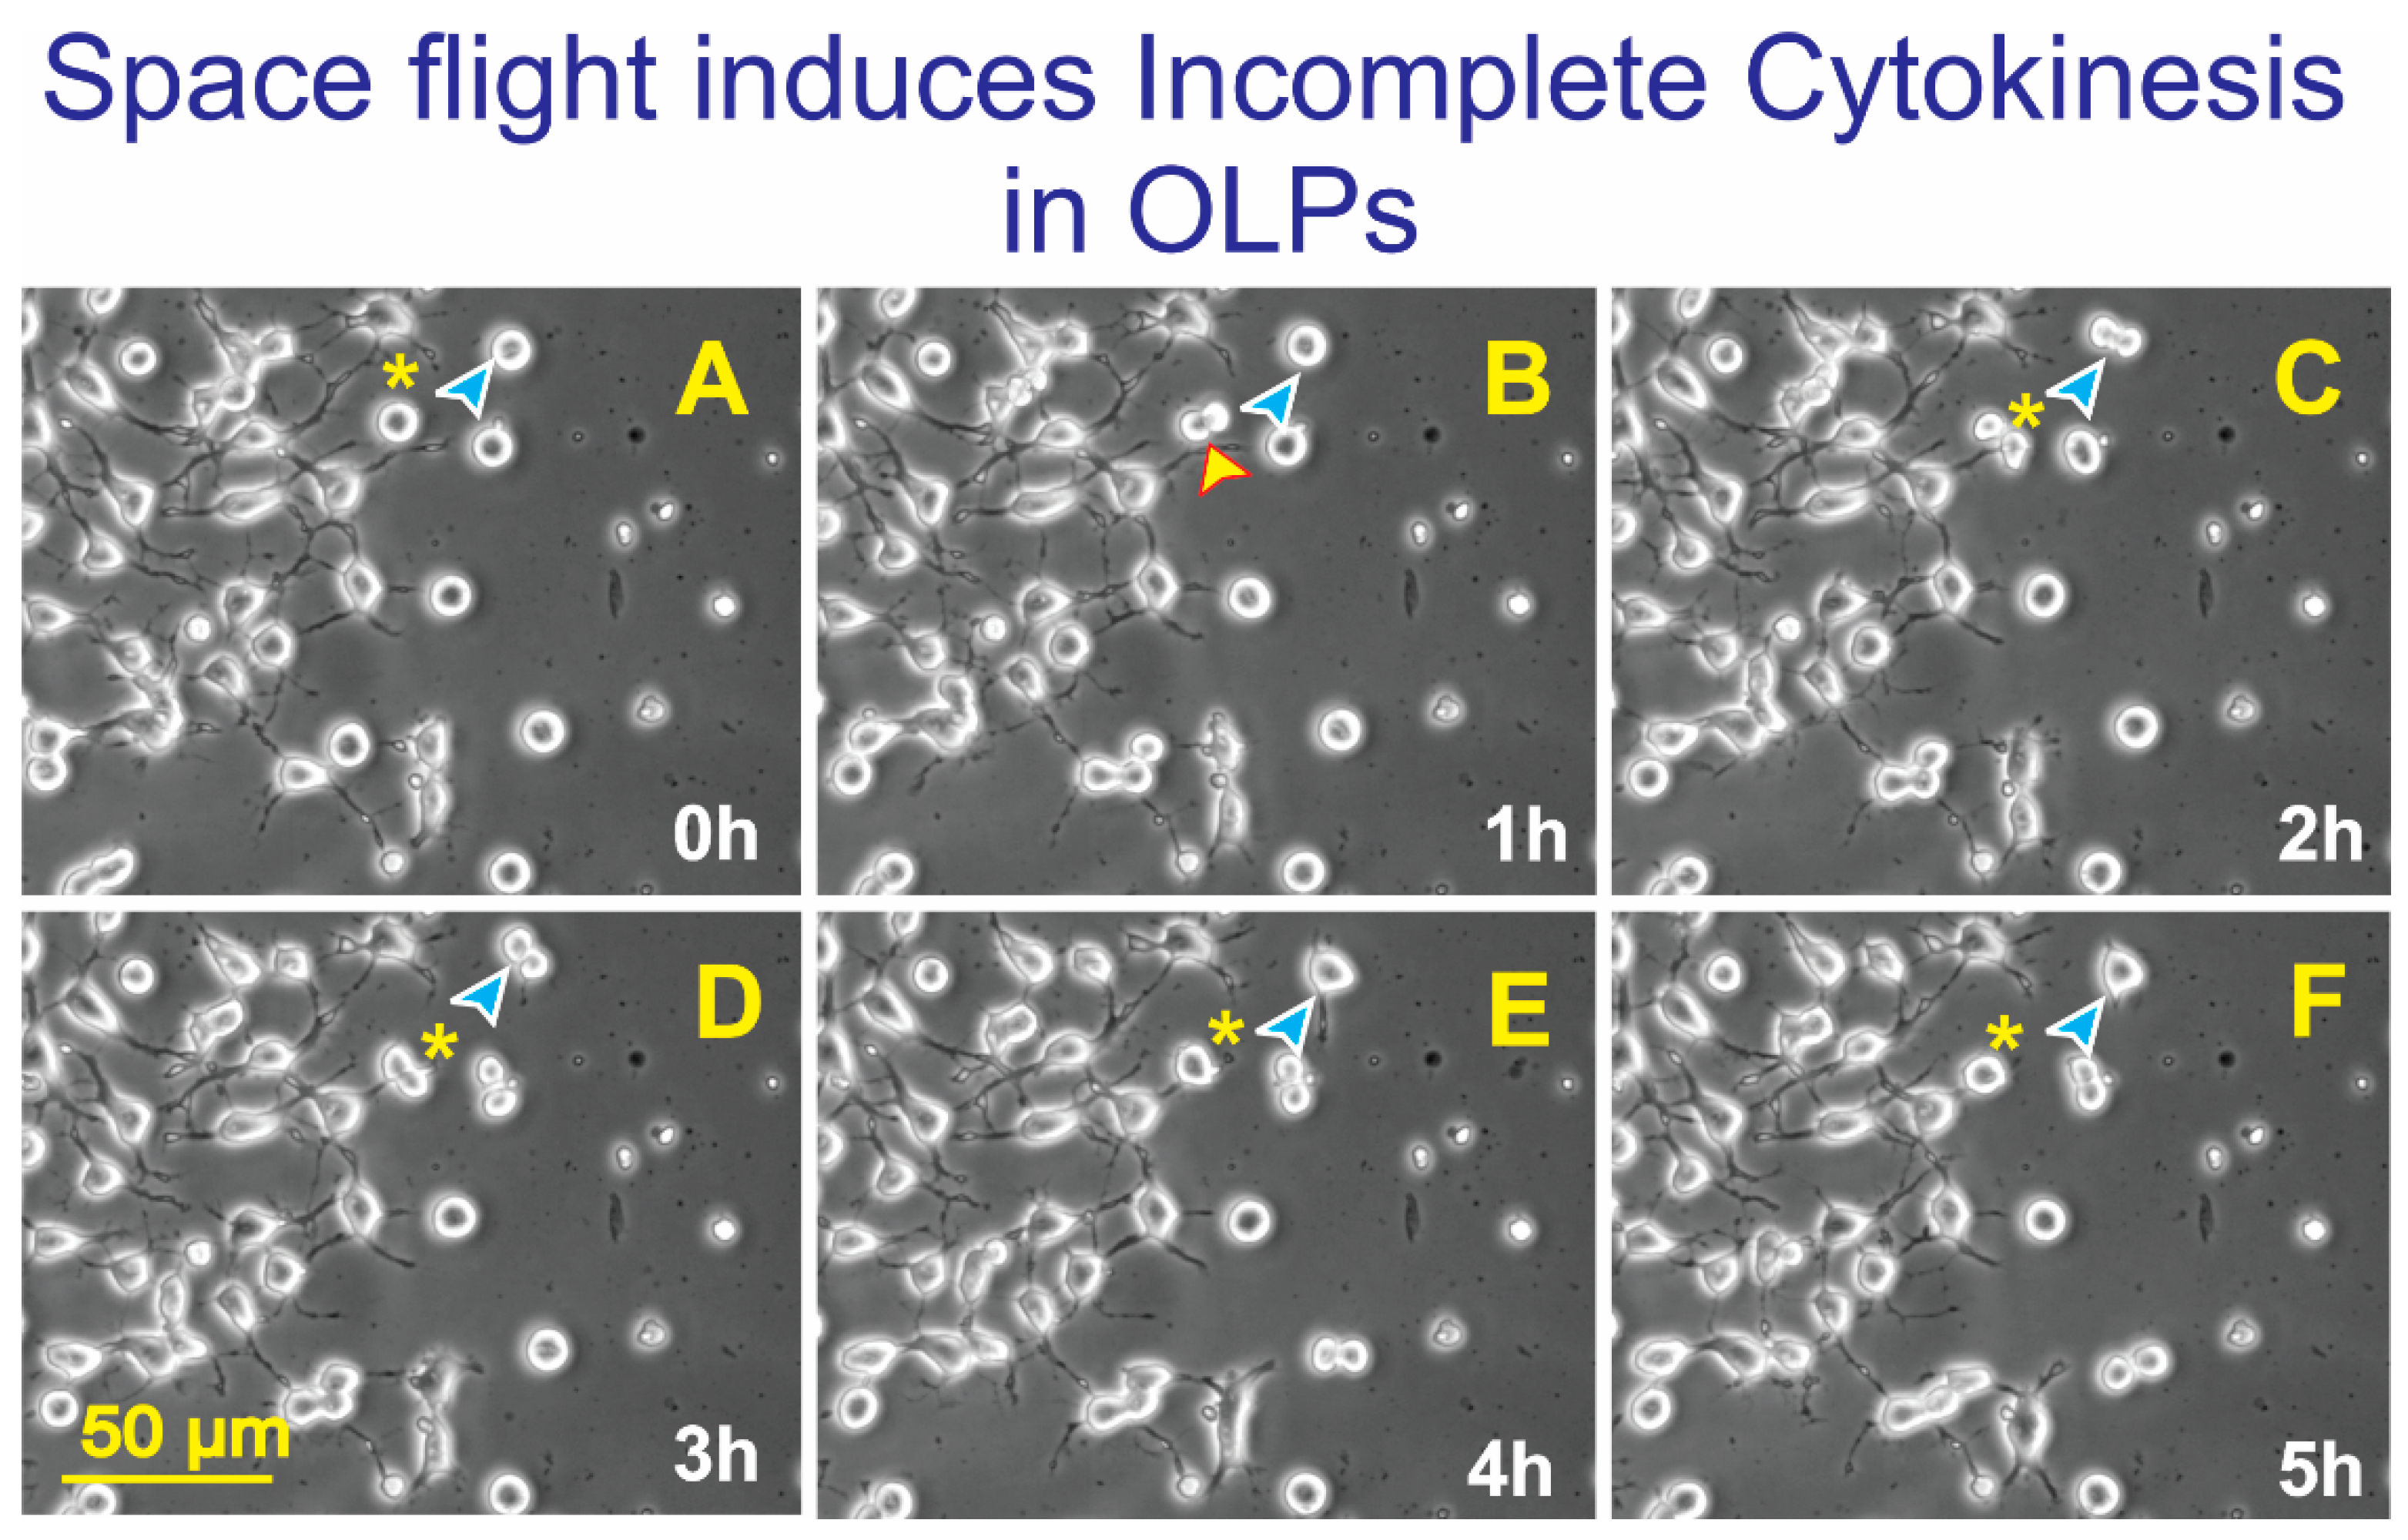
3.2. Space-Flight Induced Incomplete Cytokinesis in OLPs
4. Discussion
5. Conclusions
Supplementary Materials
Author Contributions
Funding
Institutional Review Board Statement
Informed Consent Statement
Data Availability Statement
Acknowledgments
Conflicts of Interest
References
- Bhatt, A.; Fan, L.W.; Pang, Y. Strategies for myelin regeneration: Lessons learned from development. Neural Regen. Res. 2014, 9, 1347–1350. [Google Scholar] [CrossRef] [PubMed]
- Bauer, N.G.; Richter-Landsberg, C.; Ffrench-Constant, C. Role of the oligodendroglial cytoskeleton in differentiation and myelination. Glia 2009, 57, 1691–1705. [Google Scholar] [CrossRef] [PubMed]
- Franklin, R.J.M.; Ffrench-Constant, C. Remyelination in the CNS: From biology to therapy. Nat. Rev. Neurosci. 2008, 9, 839–855. [Google Scholar] [CrossRef] [PubMed]
- Patel, J.R.; Klein, R.S. Mediators of oligodendrocyte differentiation during remyelination. FEBS Lett. 2011, 585, 3730–3737. [Google Scholar] [CrossRef] [PubMed]
- Bankston, A.N.; Mandler, M.D.; Feng, Y. Oligodendroglia and neurotrophic factors in neurodegeneration. Neurosci. Bull. 2013, 29, 216–228. [Google Scholar] [CrossRef]
- Kawachi, I.; Lassmann, H. Neurodegeneration in multiple sclerosis and neuromyelitis optica. J. Neurol. Neurosurg. Psychiatry 2017, 8, 137–145. [Google Scholar] [CrossRef]
- Münzel, E.J.; Williams, A. Promoting remyelination in multiple sclerosis-recent advances. Drugs 2013, 73, 2017–2029. [Google Scholar] [CrossRef]
- Espinosa, A.E.; Roussel, G.; Neskovic, N.M.; Nussbaum, J.L. A chemically defined medium for the culture of mature oligodendrocytes. J. Neurosci. Res. 1988, 19, 202–211. [Google Scholar] [CrossRef]
- Espinosa-Jeffrey, A.; Blanchi, B.; Biancotti, J.C.; Kumar, S.; Hirose, M.; Mandefro, B.; Talavera-Adame, D.; Benvenisty, N.; de Vellis, J. Efficient generation of viral and integration-free human induced pluripotent stem cell-derived oligodendrocytes. Curr. Protoc. Stem Cell Biol. 2016, 38, 2D.18.1–2D.18.27. [Google Scholar] [CrossRef]
- Park, K.I.; Ourednik, J.; Ourednik, V.; Taylor, R.M.; Aboody, K.S.; Auguste, K.I.; Lachyankar, M.B.; Redmond, D.E.; Snyder, E.Y. Global gene and cell replacement strategies via stem cells. Gene Ther. 2002, 9, 613–624. [Google Scholar] [CrossRef]
- Müller, F.-J.; Snyder, E.Y.; Loring, J.F. Gene therapy: Can neural stem cells deliver? Nat. Rev. Neurosci. 2007, 7, 75–84. [Google Scholar] [CrossRef] [PubMed]
- Ahn, S.-M.; Byun, K.; Kim, D.; Lee, K.; Yoo, J.S.; Kim, S.U.; Jho, E.-H.; Simpson, R.J.; Lee, B. Olig2-induced neural stem cell differentiation involves downregulation of Wnt signaling and induction of Dickkopf-1 expression. PLoS ONE 2008, 3, e3917. [Google Scholar] [CrossRef] [PubMed]
- Espinosa-Jeffrey, A.; Nguyen, K.; Kumar, S.; Toshimasa, O.; Hirose, R.; Reue, K.; Vergnes, L.; Kinchen, J.; de Vellis, J. Simulated microgravity enhances oligodendrocyte mitochondrial function and lipid metabolism. J. Neurosci. Res. 2016, 94, 1434–1450. [Google Scholar] [CrossRef] [PubMed]
- Sim, F.J.; Windrem, M.S.; Goldman, S.A. Fate determination of adult human glial progenitor cells. Neuron Glia Biol. 2009, 5, 45–55. [Google Scholar] [CrossRef]
- Studer, M.; Bradacs, G.; Hilliger, A.; Hürlimann, E.; Engeli, S.; Thiel, C.S.; Zeitner, P.; Denier, B.; Binggeli, M.; Syburra, T.; et al. Parabolic maneuvers of the Swiss Air Force fighter jet F-5E as a research platform for cell culture experiments in microgravity. Acta Astronaut. 2011, 68, 1729–1741. [Google Scholar] [CrossRef]
- Blaber, E.A.; Finkelstein, H.; Dvorochkin, N.; Sato, K.Y.; Yousuf, R.; Burns, B.P.; Globus, R.K.; Almeida, E.A.C. Microgravity reduces the differentiation and regenerative potential of embryonic stem cells. Stem Cells Dev. 2015, 24, 2605–2621. [Google Scholar] [CrossRef]
- Silvano, M.; Miele, E.; Valerio, M.; Casadei, L.; Begalli, F.; Campese, A.; Mersini, Z.; Besharat, V.A.; Abballe, L.; Catanzaro, G.; et al. Consequences of Simulated Microgravity in Neural Stem Cells: Biological Effects and Metabolic Response. J. Stem Cell Res. Ther. 2015, 5, 289. [Google Scholar] [CrossRef]
- Espinosa-Jeffrey, A.; Barajas, S.A.R.; Arrazola, A.R.; Taniguchi, A.; Zhao, P.M.; Bokhoor, P.; Holley, S.M.; Dejarme, D.P.; Chu, B.; Cepeda, C.; et al. White matter loss in a mouse model of periventricular leukomalacia is rescued by trophic factors. Brain Sci. 2013, 3, 1461–1482. [Google Scholar] [CrossRef]
- Cepeda, C.; Vergnes, L.; Carpo, N.; Schibler, M.J.; Bentolila, L.A.; Karouia, F.; Espinosa-Jeffrey, A. Human neural stem cells flown into space proliferate and generate young neurons. Appl. Sci. 2019, 9, 4042. [Google Scholar] [CrossRef]
- Shaka, S.; Carpo, N.; Tran, V.; Ma, Y.Y.; Karouia, F.; Espinosa-Jeffrey, A. Human neural stem cells in space proliferate more than ground control cells: Implications for long-term space travel. J. Stem Cells Res. Dev. Ther. 2021, 7, 69. [Google Scholar] [CrossRef]
- Lee, A.G.; Mader, T.H.; Gibson, C.R.; Brunstetter, T.J.; Tarver, W.J. Space flight-associated neuro-ocular syndrome (Sans). Eye 2018, 32, 1164–1167. [Google Scholar] [CrossRef] [PubMed]
- Zhang, S.; Zhu, X.; Gui, X.; Croteau, C.; Song, L.; Xu, J.; Wang, A.; Bannerman, P.; Guo, F. Sox2 is essential for oligodendroglial proliferation and differentiation during postnatal brain myelination and cns remyelination. J. Neurosci. 2018, 38, 1802–1820. [Google Scholar] [CrossRef] [PubMed]
- Zhao, C.; Ma, D.; Zawadzka, M.; Fancy, S.P.J.; Elis-Williams, L.; Bouvier, G.; Stockley, J.H.; de Castro, G.M.; Wang, B.; Jacobs, S.; et al. Sox2 sustains recruitment of oligodendrocyte progenitor cells following cns demyelination and primes them for differentiation during remyelination. J. Neurosci. 2015, 35, 11482–11499. [Google Scholar] [CrossRef]
- Espinosa, A.E.; de Vellis, J. Myelin basic protein and transferrin characterize different subpopulations of oligodendrocytes in rat primary glial cultures. J. Neurosci. Res. 1988, 21, 181–187. [Google Scholar] [CrossRef]
- Watanabe, M.; Hadzic, T.; Nishiyama, A. Transient upregulation of Nkx2.2 expression in oligodendrocyte lineage cells during remyelination. Glia 2004, 46, 311–322. [Google Scholar] [CrossRef]
- Zhu, Q.; Zhao, X.; Zheng, K.; Li, H.; Huang, H.; Zhang, Z.; Mastracci, T.; Wegner, M.; Chen, Y.; Sussel, L.; et al. Genetic evidence that Nkx2.2 and PDGFR-αa are major determinants of the timing of oligodendrocyte differentiation in the developing CNS. Development 2014, 141, 548–555. [Google Scholar] [CrossRef] [PubMed]
- Pituch, K.C.; Moyano, A.L.; Lopez-Rosas, A.; Marottoli, F.M.; Li, G.; Hu, C.; van Breemen, R.; Månsson, J.E.; Givogri, M.I. Dysfunction of platelet-derived growth factor receptor α (PDGFR-αα) represses the production of oligodendrocytes from arylsulfatase a-deficient multipotential neural precursor cells*. J. Biol. Chem. 2015, 290, 7040–7053. [Google Scholar] [CrossRef]
- Leveille, P.J.; McGinnis, J.F.; Maxwell, D.S.; de Vellis, J. Immunocytochemical localization of glycerol-3-phosphate dehydrogenase in rat oligodendrocytes. Brain Res. 1980, 196, 287–305. [Google Scholar] [CrossRef]
- Fabregat, A.; Jupe, S.; Matthews, L.; Sidiropoulos, K.; Gillespie, M.; Garapati, P.; Haw, R.; Jassal, B.; Korninger, F.; May, B.; et al. The reactome pathway knowledgebase. Nucleic Acids Res. 2018, 46, D649–D655. [Google Scholar] [CrossRef]
- Yuan, J.; McCartney, D.G.; Monge, M.; De los Monteros, A.E.; Zalc, B.; de Vellis, J.; Kanfer, J.N. Glycerophosphorylcholine phosphocholine phosphodiesterase activity in cultured oligodendrocytes, astrocytes, and central nervous tissue of dysmyelinating rodent mutants. J. Neurosci. Res. 1992, 31, 68–74. [Google Scholar] [CrossRef]
- Kroemer, G. Tetraploid cancer cell precursors. Nat. Rev. Mol. Cell Biol. 2010, 11, 539. [Google Scholar] [CrossRef] [PubMed]
- Padgett, J.; Santos, S.D.M. From clocks to dominoes: Lessons on cell cycle remodelling from embryonic stem cells. FEBS Lett. 2020, 594, 2031–2045. [Google Scholar] [CrossRef] [PubMed]
- Straight, A.F.; Field, C.M. Microtubules, membranes and cytokinesis. Curr. Biol. 2000, 10, R760–R770. [Google Scholar] [CrossRef]
- Janmaleki, M.; Pachenari, M.; Seyedpour, S.M.; Shahghadami, R.; Sanati-Nezhad, A. Impact of simulated microgravity on cytoskeleton and viscoelastic properties of endothelial cell. Sci. Rep. 2016, 6, 32418. [Google Scholar] [CrossRef] [PubMed]
- Corydon, T.J.; Kopp, S.; Wehland, M.; Braun, M.; Schütte, A.; Mayer, T.; Hülsing, T.; Oltmann, H.; Schmitz, B.; Hemmersbach, R.; et al. Alterations of the cytoskeleton in human cells in space proved by life-cell imaging. Sci. Rep. 2016, 6, 20043. [Google Scholar] [CrossRef]
- Coupé, M.; Fortrat, J.O.; Larina, I.; Gauquelin-Koch, G.; Gharib, C.; Custaud, M.A. Cardiovascular deconditioning: From autonomic nervous system to microvascular dysfunctions. Respir. Physiol. Neurobiol. 2009, 169, S10–S12. [Google Scholar] [CrossRef]
- Grimm, D.; Bauer, J.; Ulbrich, C.; Westphal, K.; Wehland, M.; Infanger, M.; Aleshcheva, G.; Pietsch, J.; Ghardi, M.; Beck, M.; et al. Different responsiveness of endothelial cells to vascular endothelial growth factor and basic fibroblast growth factor added to culture media under gravity and simulated microgravity. Tissue Eng. Part A 2010, 16, 1559–1573. [Google Scholar] [CrossRef]
- Zhang, M.; Skirkanich, J.; Lampson, M.A.; Klein, P.S. Cell cycle remodeling and zygotic gene activation at the midblastula transition. Adv. Exp. Med. Biol. 2017, 953, 441–487. [Google Scholar] [CrossRef]
- Espinosa, A.E.; Chiapelli, F.; Fisher, R.S.; de Vellis, J. Transferrin: An early marker of oligodendrocytes in culture. Int. J. Dev. Neurosci. 1988, 6, 167–175. [Google Scholar] [CrossRef]
- Espinosa, A.E.; Kumar, S.; Zhao, P.; Huang, C.J.; Nazarian, R.; Pan, T.; Scully, S.; Chang, R.; & de Vellis, J. Transferrin is an essential factor for myelination. Neurochem. Res. 1999, 24, 235–248. [Google Scholar] [CrossRef]
- Espinosa-Jeffrey, A.; Becker-Catania, S.; Zhao, P.M.; Cole, R.; de Vellis, J. Phenotype Specification and Development of Oligodendrocytes and Neurons from Rat Stem Cell Cultures Using two Chemically Defined Media. J. Neurosci. Res. 2002, 69, 810–825. [Google Scholar] [CrossRef] [PubMed]
- Kumar, S.; Macklin, W.B.; Gordon, M.N.; de los Monteros, A.E.; Cole, R.; Scully, S.A.; de Vellis, J. Transcriptional regulation studies of myelin-associated genes in myelin-deficient mutant rats. Dev. Neurosci. 1990, 12, 316–325. [Google Scholar] [CrossRef] [PubMed]
- McMorris, F.A.; Dubois-Dalcq, M. Insulin-like growth factor I promotes cell proliferation and oligodendroglial commitment in rat glial progenitor cells developing in vitro. J. Neurosci. Res. 1988, 21, 199–209. [Google Scholar] [CrossRef] [PubMed]
- Mozell, R.L.; McMorris, F.A. Insulin-like growth factor I stimulates oligodendrocyte development and myelination in rat brain aggregate cultures. J. Neurosci. Res. 1991, 30, 382–390. [Google Scholar] [CrossRef]
- Espinosa-Jeffrey, A.; Paez, P.M.; Cheli, V.T.; Spreuer, V.; Wanner, I.; de Vellis, J. Impact of simulated microgravity on oligodendrocyte development: Implications for central nervous system repair. PLoS ONE 2013, 8, e76963. [Google Scholar] [CrossRef][Green Version]
- Kaller, M.S.; Lazari, A.; Blanco-Duque, C.; Sampaio-Baptista, C.; Johansen-Berg, H. Myelin plasticity and behaviour—Connecting the dots. Curr. Opin. Neurobiol. 2017, 47, 86–92. [Google Scholar] [CrossRef]
- Steadman, P.E.; Xia, F.; Ahmed, M.; Mocle, A.J.; Penning, A.R.A.; Geraghty, A.C.; Steenland, H.W.; Monje, M.; Josselyn, S.A.; Frankland, P.W. Disruption of oligodendrogenesis impairs memory consolidation in adult mice. Neuron 2020, 105, 150–164.e6. [Google Scholar] [CrossRef]
- Castro-Borrero, W.; Graves, D.; Frohman, T.C.; Flores, A.B.; Hardeman, P.; Logan, D.; Orchard, M.; Greenberg, B.; Frohman, E.M. Current and emerging therapies in multiple sclerosis: A systematic review. Ther. Adv. Neurol. Disord. 2012, 5, 205–220. [Google Scholar] [CrossRef]
- Kremer, D.; Küry, P.; Dutta, R. Promoting remyelination in multiple sclerosis: Current drugs and future prospects. Mult. Scler. 2015, 21, 541–549. [Google Scholar] [CrossRef]
- Sumowski, J.F.; Benedict, R.; Enzinger, C.; Filippi, M.; Geurts, J.J.; Hamalainen, P.; Hulst, H.; Inglese, M.; Leavitt, V.M.; Rocca, M.A.; et al. Cognition in multiple sclerosis: State of the field and priorities for the future. Neurology 2018, 90, 278–288. [Google Scholar] [CrossRef]
- Cucinotta, F.A.; To, K.; Cacao, E. Predictions of space radiation fatality risk for exploration missions. Life Sci. Space Res. 2017, 13, 1–11. [Google Scholar] [CrossRef] [PubMed]
- Acharya, M.M.; Baulch, J.E.; Klein, P.M.; Baddour, A.A.D.; Apodaca, L.A.; Kramár, E.A.; Alikhani, L.; Garcia, C.; Angulo, M.C.; Batra, R.S.; et al. New concerns for neurocognitive function during deep space exposures to chronic, low dose rate, neutron radiation. Eneuro 2019, 4, ENEURO.0094-19. [Google Scholar] [CrossRef] [PubMed]
- Berger, N.D.; Brownlee, P.M.; Chen, M.J.; Morrison, H.; Osz, K.; Ploquin, N.P.; Chan, J.A.; Goodarzi, A.A. High replication stress and limited Rad51-mediated DNA repair capacity, but not oxidative stress, underlie oligodendrocyte precursor cell radiosensitivity. NAR Cancer 2022, 4, zcac012. [Google Scholar] [CrossRef] [PubMed]
- Begolly, S.; Olschowka, J.A.; Love, T.; Williams, J.P.; O’Banion, M.K. Fractionation enhances acute oligodendrocyte progenitor cell radiation sensitivity and leads to long term depletion. Glia 2018, 66, 846–861. [Google Scholar] [CrossRef]
- Kumar, S.; Peluso, M.; Chaudhary, P.; Dhawan, J.; Beheshti, A.; Manickam, K.; Thapar, J.; Pena, L.; Natarajan, M.; Hlatky, L.; et al. Fractionated Radiation exposure of Rat Spinal cords leads to Latent Neuro-inflammation in Brain, Cognitive Deficits, and Alterations in Apurinic Endonuclease 1. PLoS ONE 2014, 10, e0133016. [Google Scholar]


| Reagents | Measurements |
|---|---|
| Insulin | 5 mg |
| Transferrin | 50 mg |
| Putrescine | 16.1 mg |
| Sodium Bicarbonate | 2.2 g |
| * Sodium Selenite | 4 µL |
| D( + ) galactose | 4.6 g |
| Kanamycin | 500 mL |
| Activity | Time (GMT) | Time (PDT) |
|---|---|---|
| SpX21 Launch | GMT 341 at 16:17 GMT | 6 December 2020 @ 08:17 |
| Installation of Ecs into | GMT 343:14:44 (2020) | 8 December 2020 @ 06:44 |
| STaARS-1 EF | ||
| First media exchange | GMT 345:16:32 (2020) | 10 December 2020 @ 08:32 |
| 2nd media exchange | GMT 008:15:09 (2021) | 8 January 2021 @ 07:09 |
| Removal of 4 Ecs from EF-1 | GMT 008:15:09 (2021) | 8 January 2021 @ 07:09 |
| SpX21 Undock | GMT 012 at 14:05 GMT | 12 January 2021 @ 06:05 |
| SpX21 Splashdown | GMT 014 at 1:26 GMT | 13 January 2021 @ 16:26 |
| Samples’ arrival at UCLA | GMT 015: 15:30 (2021) | 15 January 2021 @ 4:30 am |
| Relativity | Accession No. | Gene | Top Ranked Protein Name [Species] |
|---|---|---|---|
| 5.9 | TRFE_HUMAN | TF | Serotransferrin OS = Homo sapiens OX = 9606 GN = TF PE = 1 SV = 3 |
| 39.27 | TRFE_HUMAN | TF | Serotransferrin OS = Homo sapiens OX = 9606 GN = TF PE = 1 SV = 3 |
| 8.47 | TRFE_HUMAN | TF | Serotransferrin OS = Homo sapiens OX = 9606 GN = TF PE = 1 SV = 3 |
| 8.72 | TRFE_HUMAN | TF | Serotransferrin OS = Homo sapiens OX = 9606 GN = TF PE = 1 SV = 3 |
| 15.59 | MEAN |
Publisher’s Note: MDPI stays neutral with regard to jurisdictional claims in published maps and institutional affiliations. |
© 2022 by the authors. Licensee MDPI, Basel, Switzerland. This article is an open access article distributed under the terms and conditions of the Creative Commons Attribution (CC BY) license (https://creativecommons.org/licenses/by/4.0/).
Share and Cite
Tran, V.; Carpo, N.; Shaka, S.; Zamudio, J.; Choi, S.; Cepeda, C.; Espinosa-Jeffrey, A. Delayed Maturation of Oligodendrocyte Progenitors by Microgravity: Implications for Multiple Sclerosis and Space Flight. Life 2022, 12, 797. https://doi.org/10.3390/life12060797
Tran V, Carpo N, Shaka S, Zamudio J, Choi S, Cepeda C, Espinosa-Jeffrey A. Delayed Maturation of Oligodendrocyte Progenitors by Microgravity: Implications for Multiple Sclerosis and Space Flight. Life. 2022; 12(6):797. https://doi.org/10.3390/life12060797
Chicago/Turabian StyleTran, Victoria, Nicholas Carpo, Sophia Shaka, Joile Zamudio, Sungshin Choi, Carlos Cepeda, and Araceli Espinosa-Jeffrey. 2022. "Delayed Maturation of Oligodendrocyte Progenitors by Microgravity: Implications for Multiple Sclerosis and Space Flight" Life 12, no. 6: 797. https://doi.org/10.3390/life12060797
APA StyleTran, V., Carpo, N., Shaka, S., Zamudio, J., Choi, S., Cepeda, C., & Espinosa-Jeffrey, A. (2022). Delayed Maturation of Oligodendrocyte Progenitors by Microgravity: Implications for Multiple Sclerosis and Space Flight. Life, 12(6), 797. https://doi.org/10.3390/life12060797