
Anti-Inflammatory Effects of Melatonin in Rats with Induced Type 2 Diabetes Mellitus

 , ,
, ,  and
and
Abstract
1. Introduction
2. Materials and Methods
2.1. Animals and Experimental Protocol
2.2. Measurement of Biochemical Parameters
2.3. Immunohistochemistry (IHC) Protocol
2.4. Protein Extraction Protocol from Tissues
2.5. Western Blot Protocol
2.6. Real Time PCR (Quantitative-q-PCR)
2.7. Statistical Analyses
3. Results
3.1. Blood Glucose Levels and Biochemical Parameters
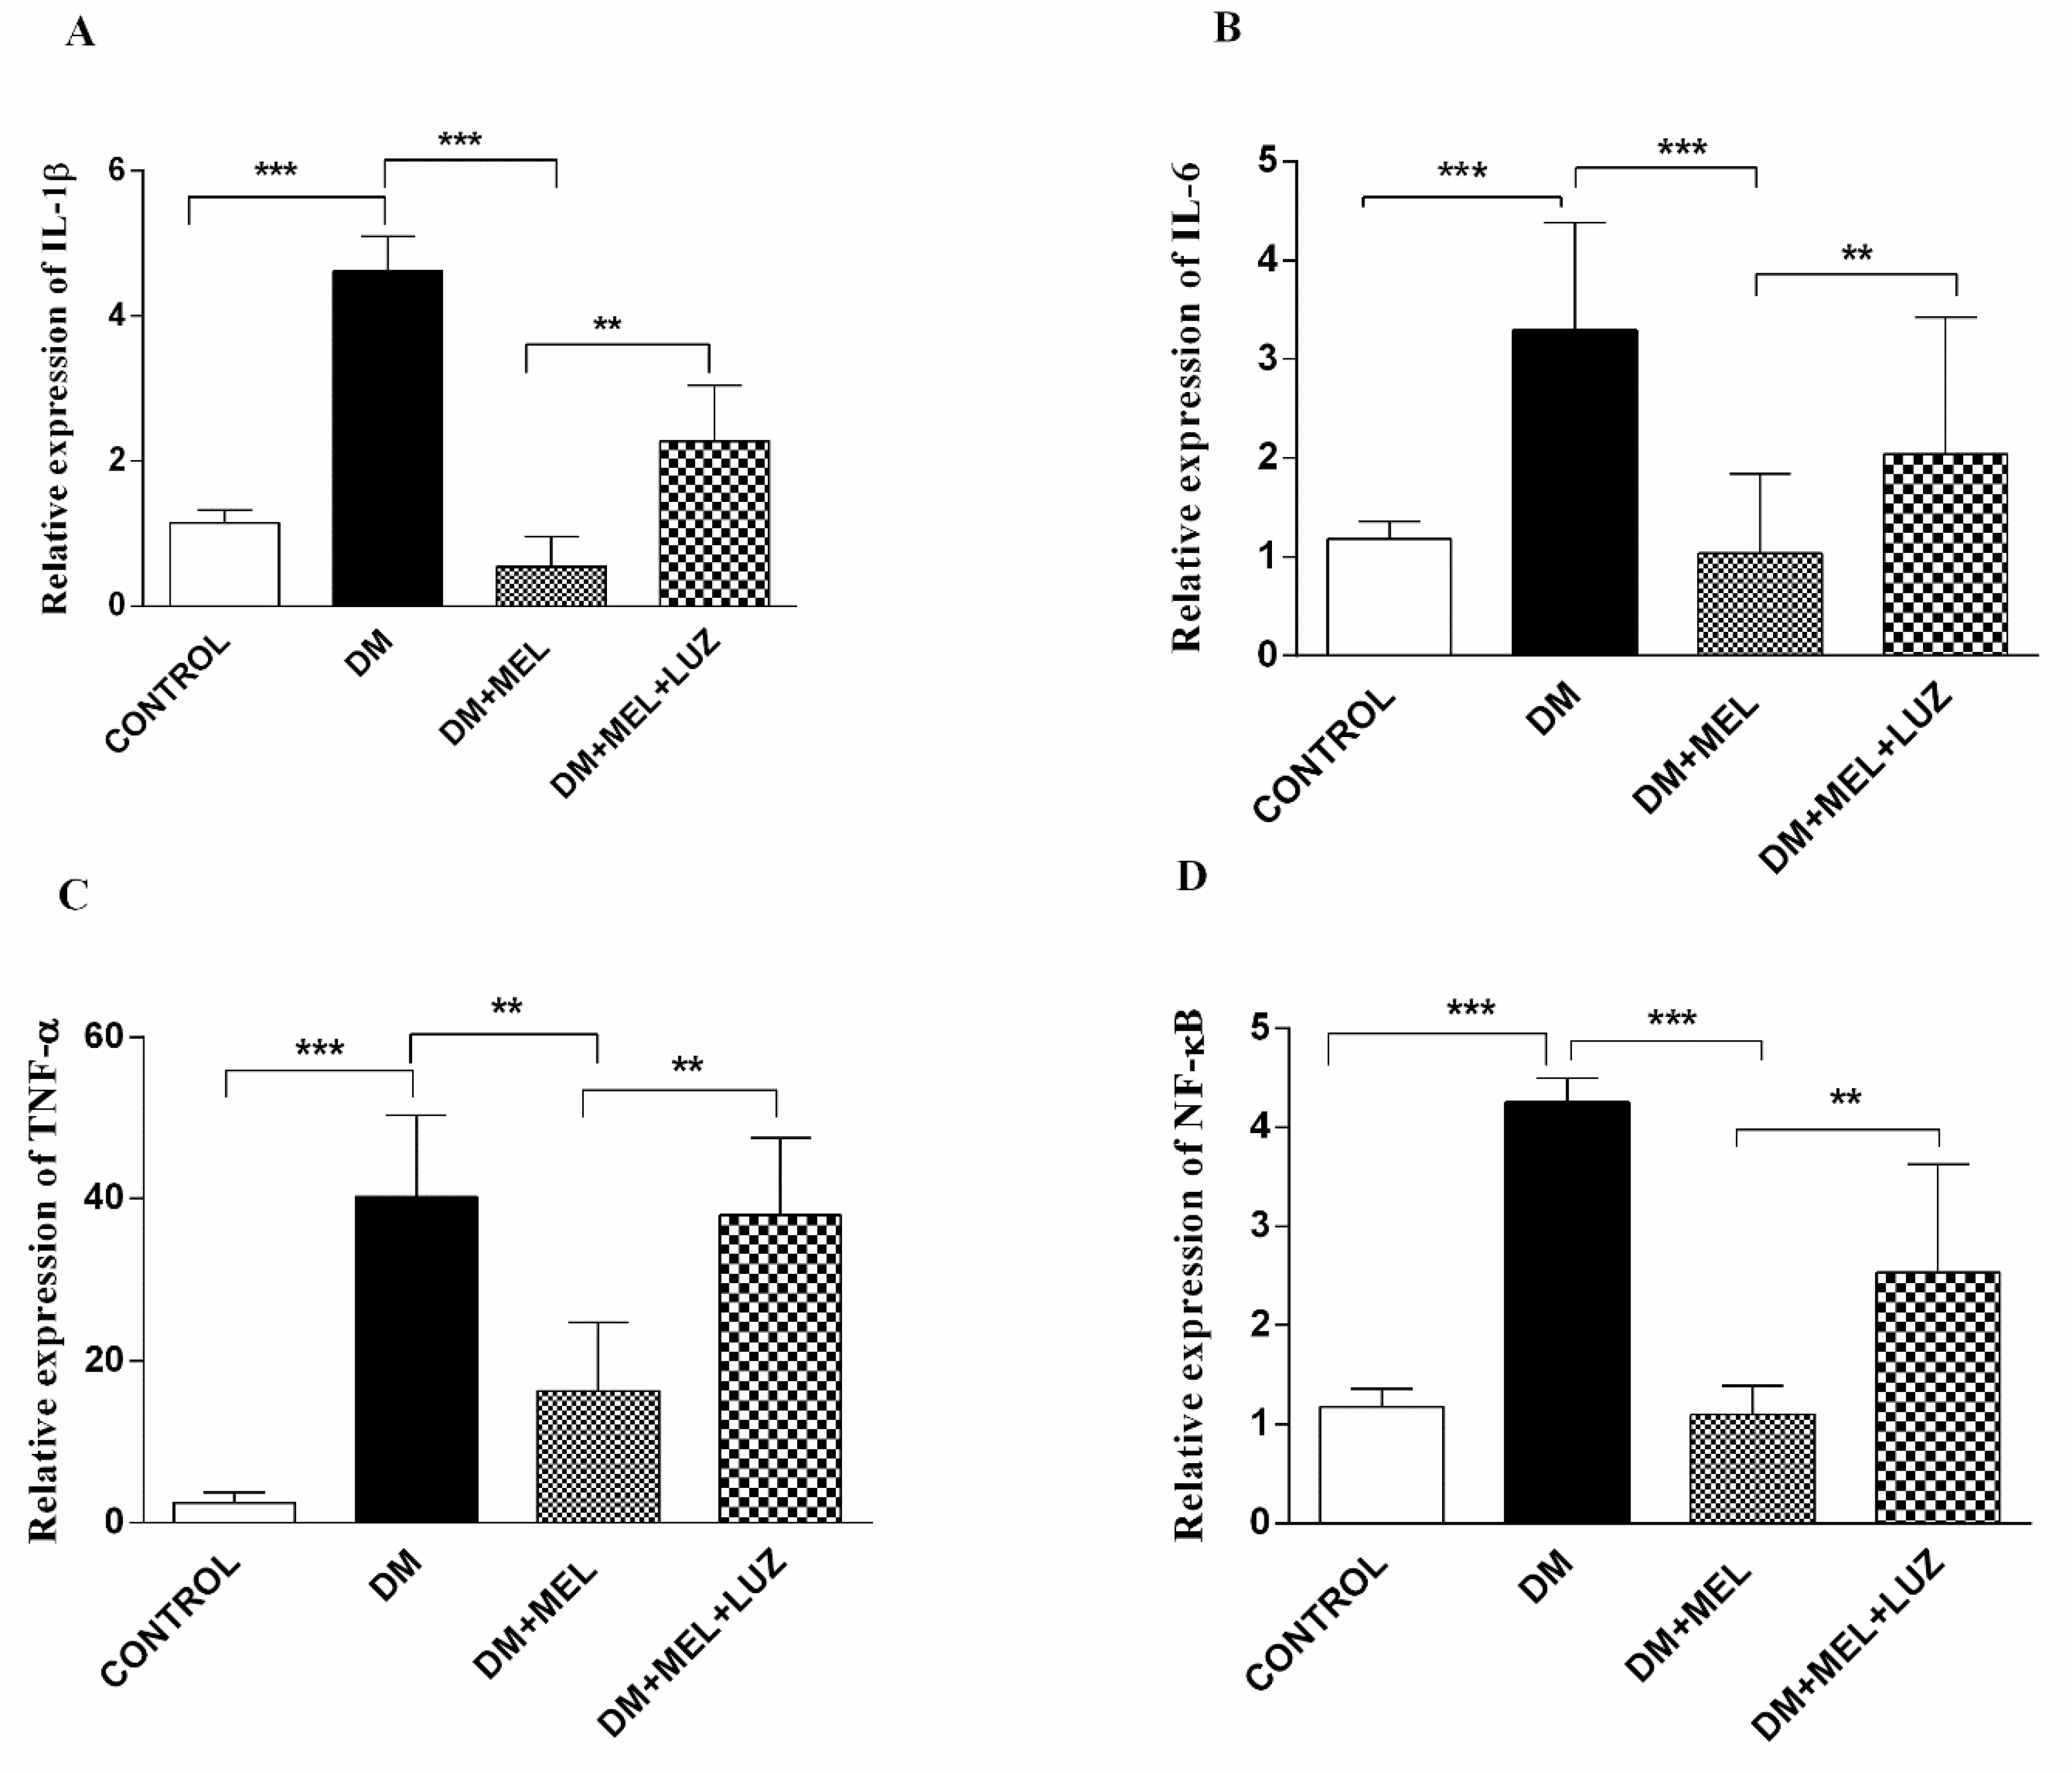
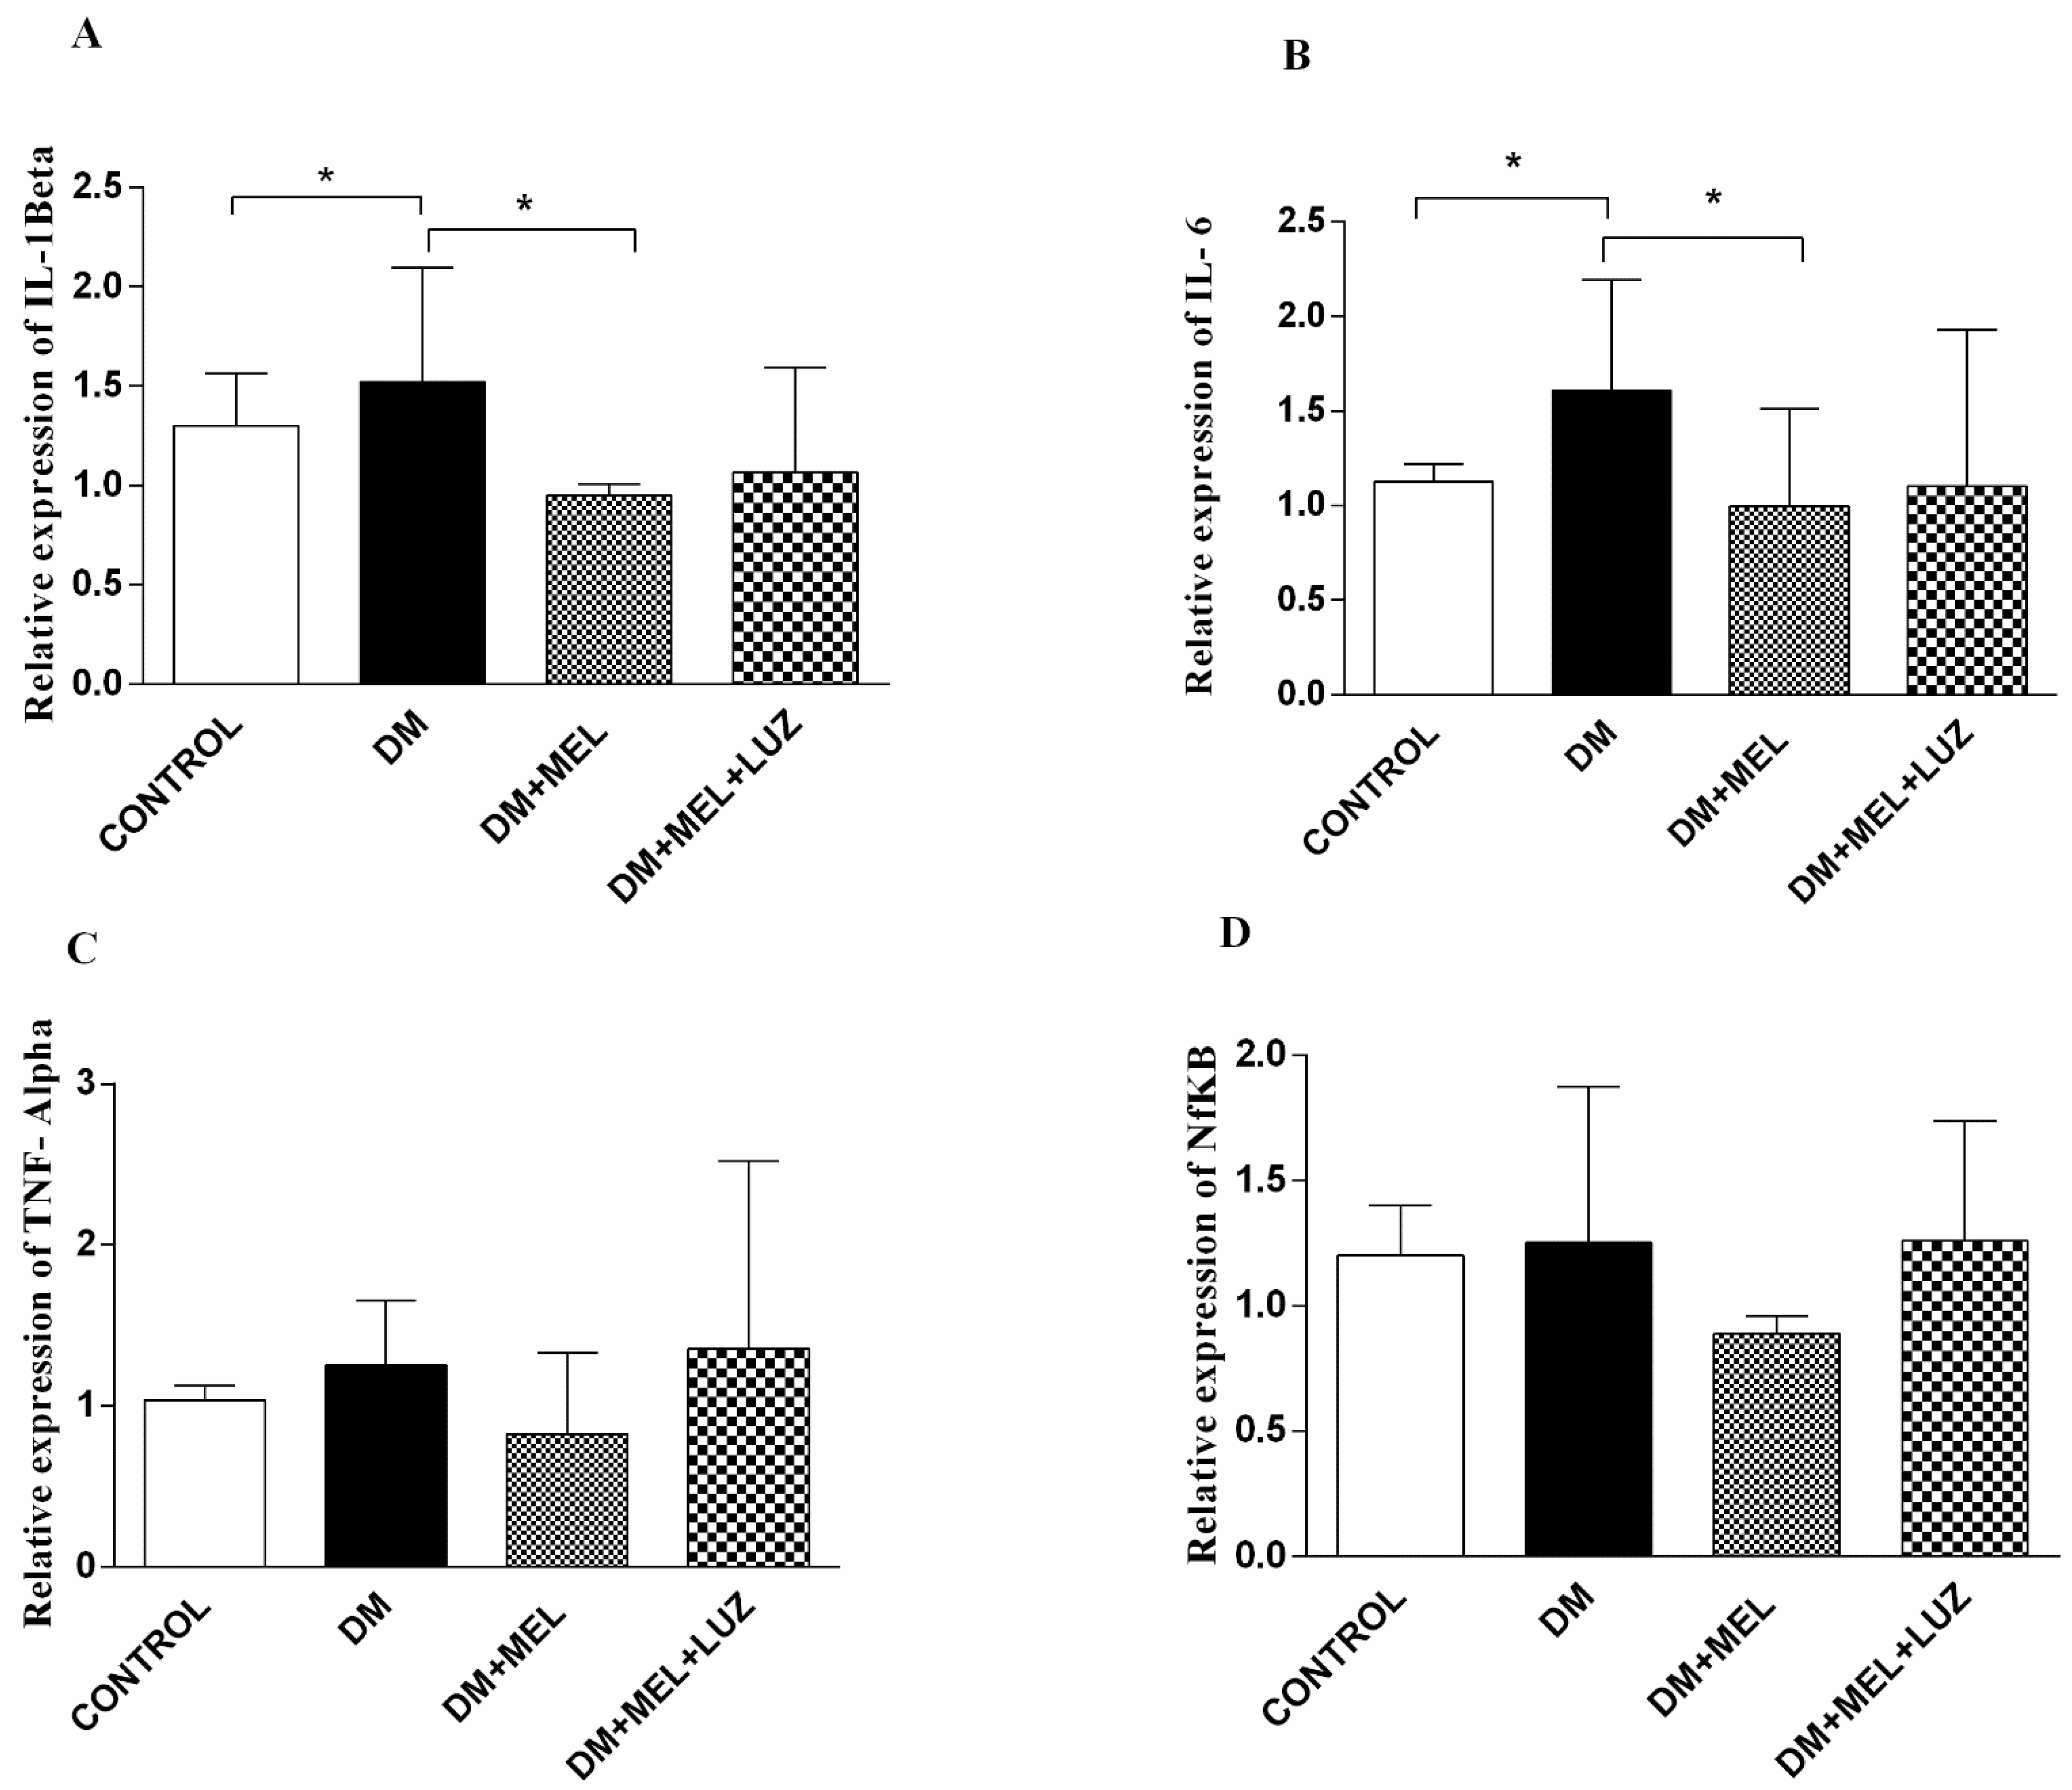
3.2. Q-PCR
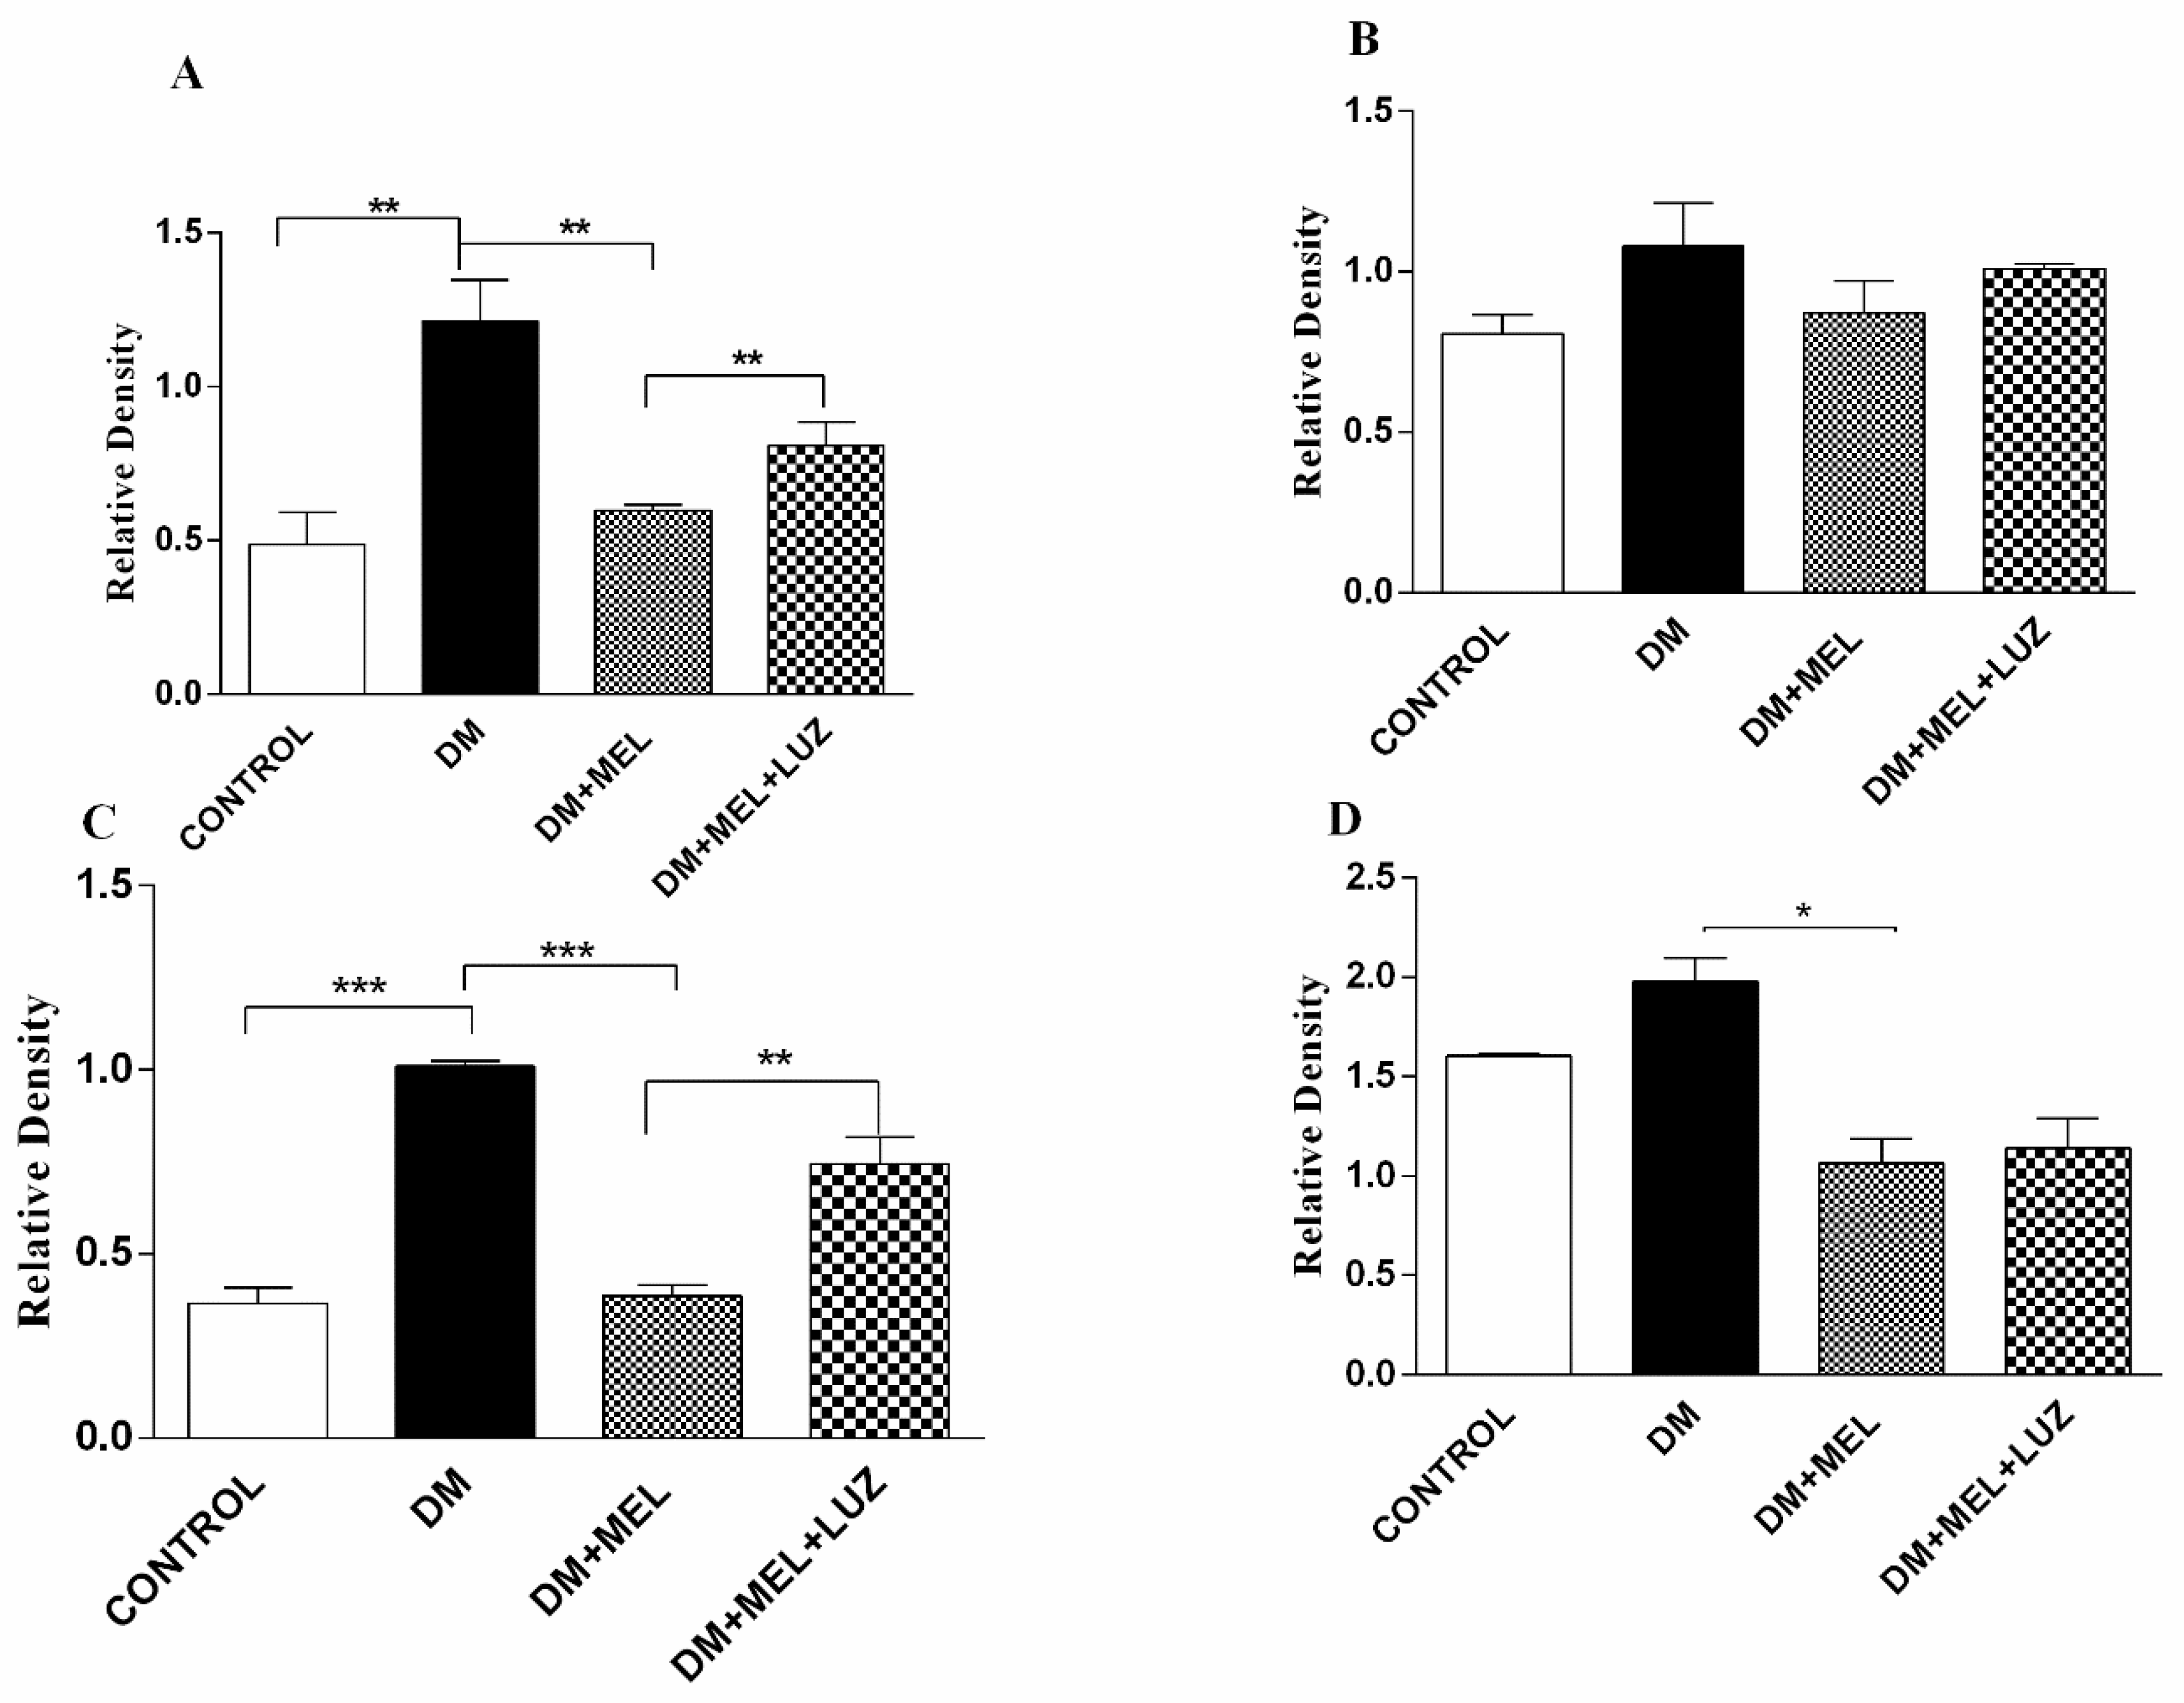
3.3. Western Blot
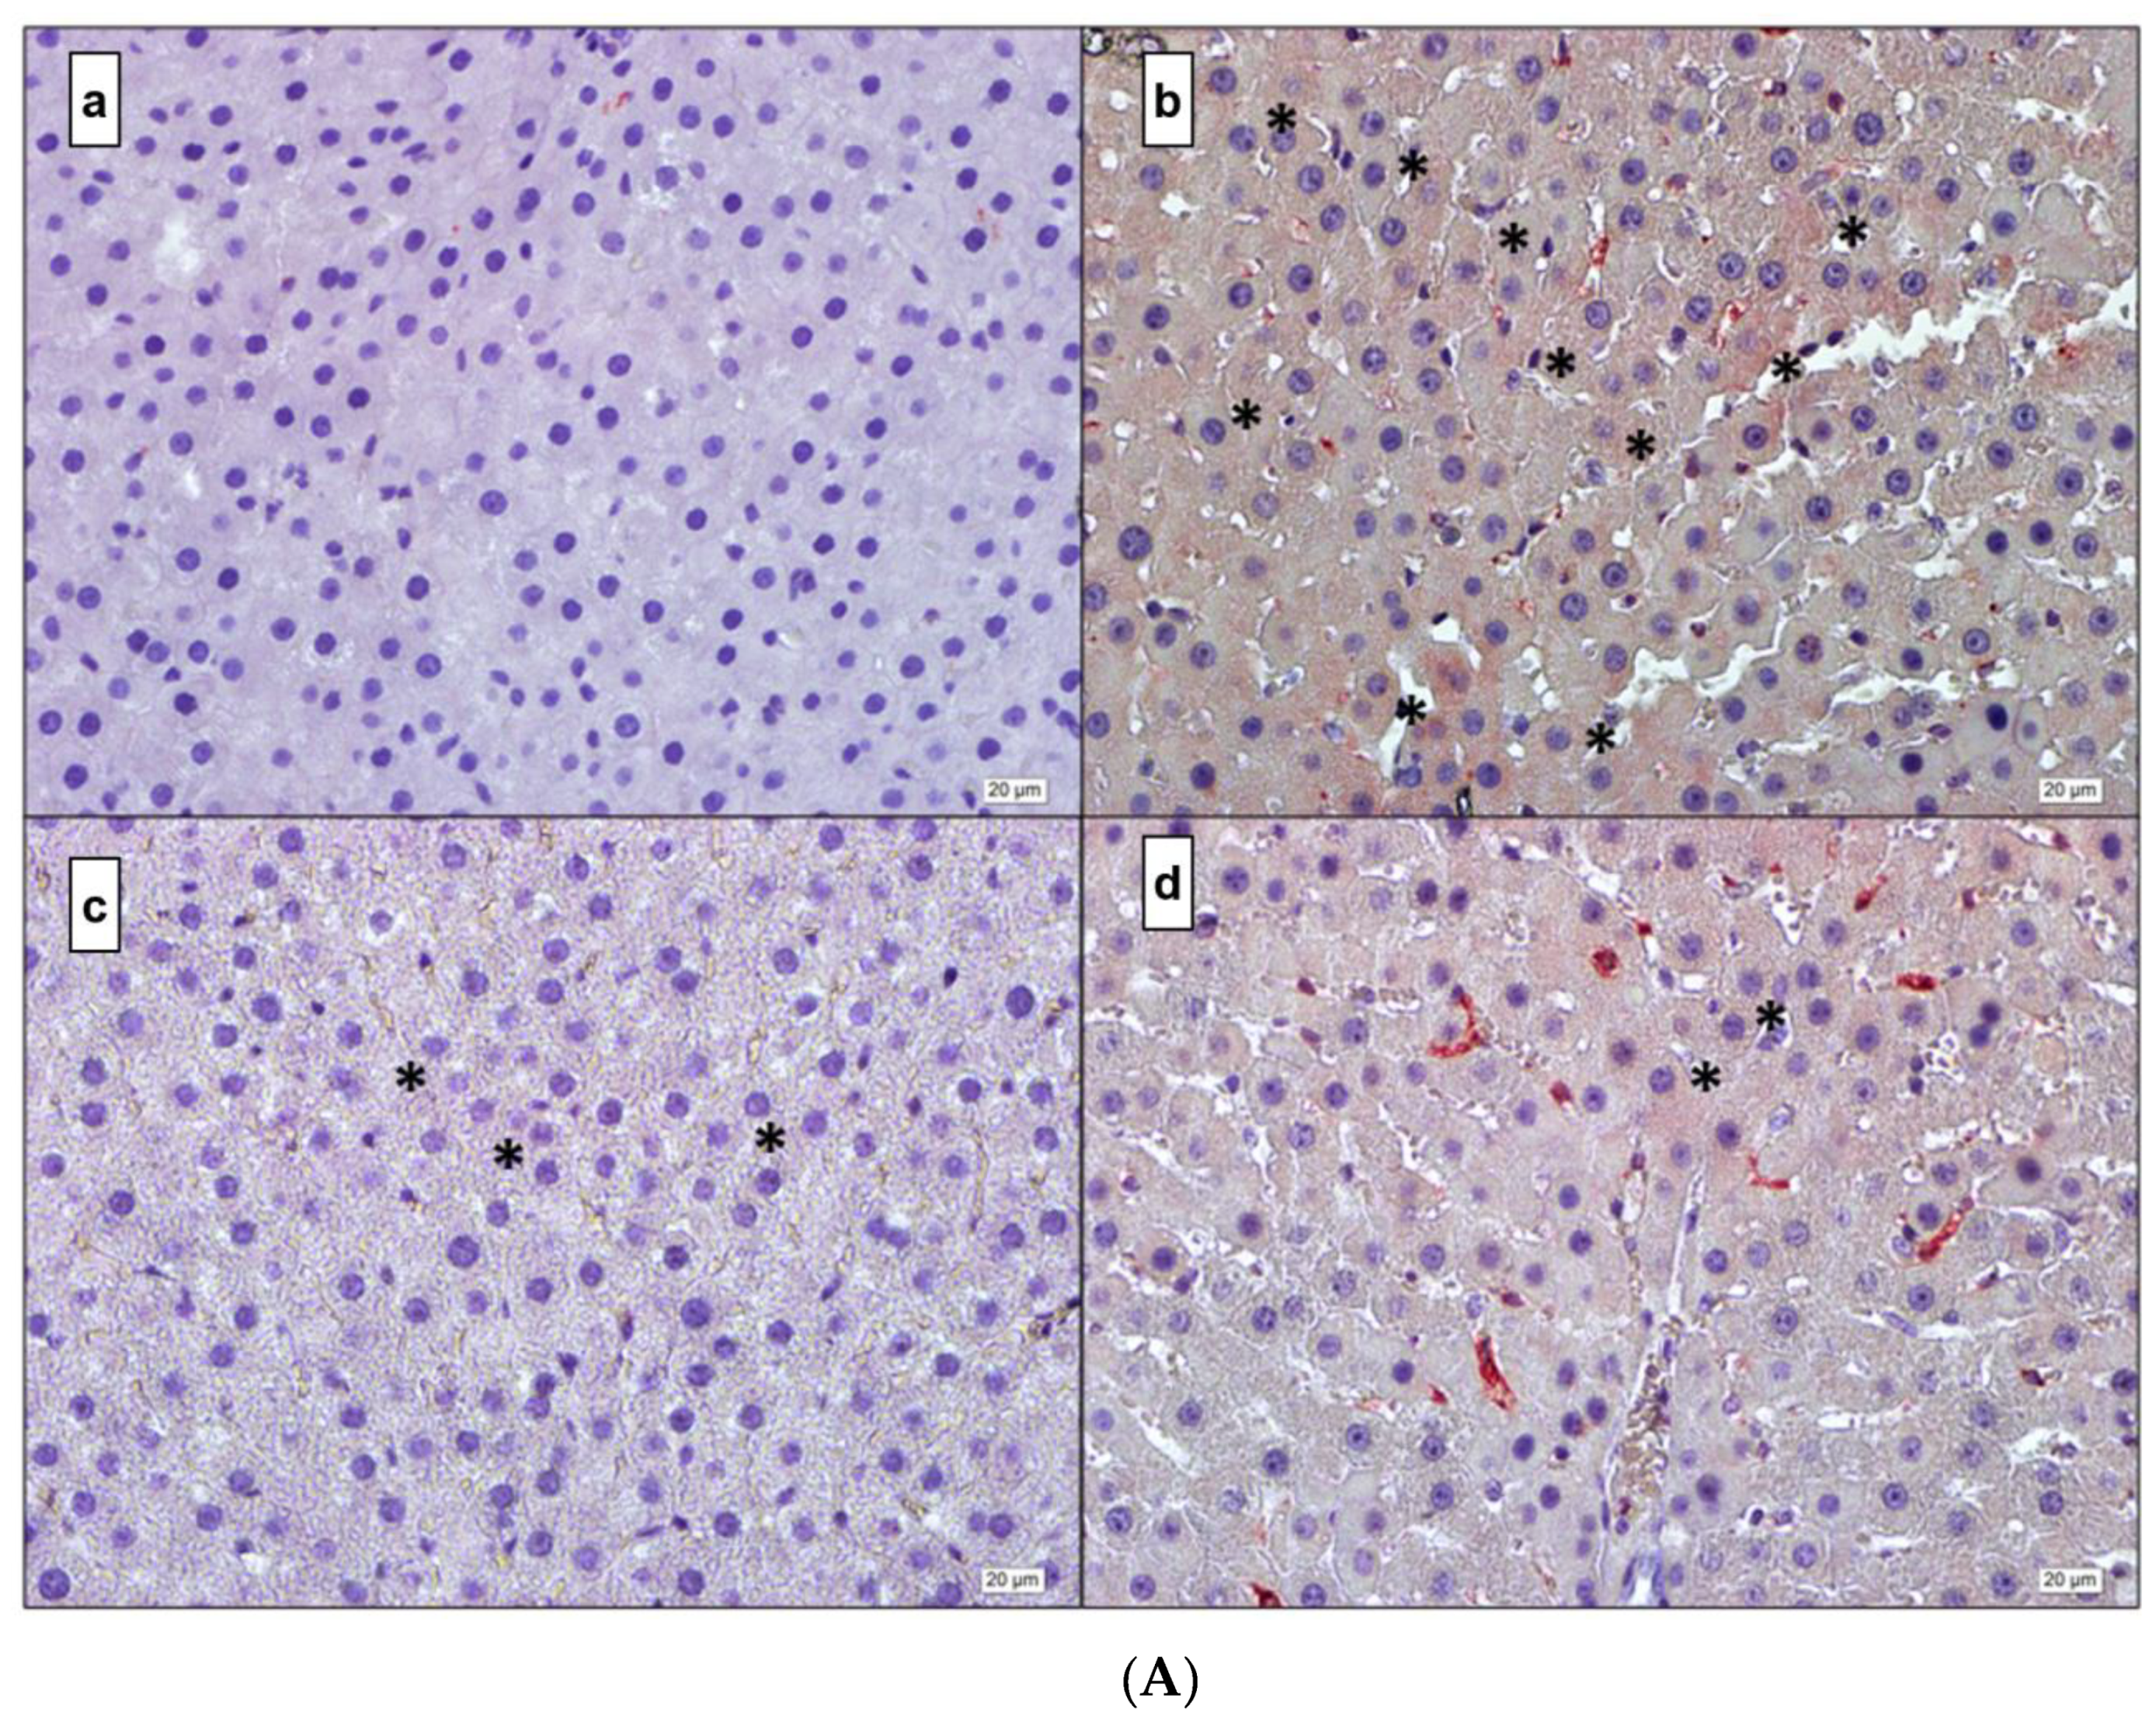
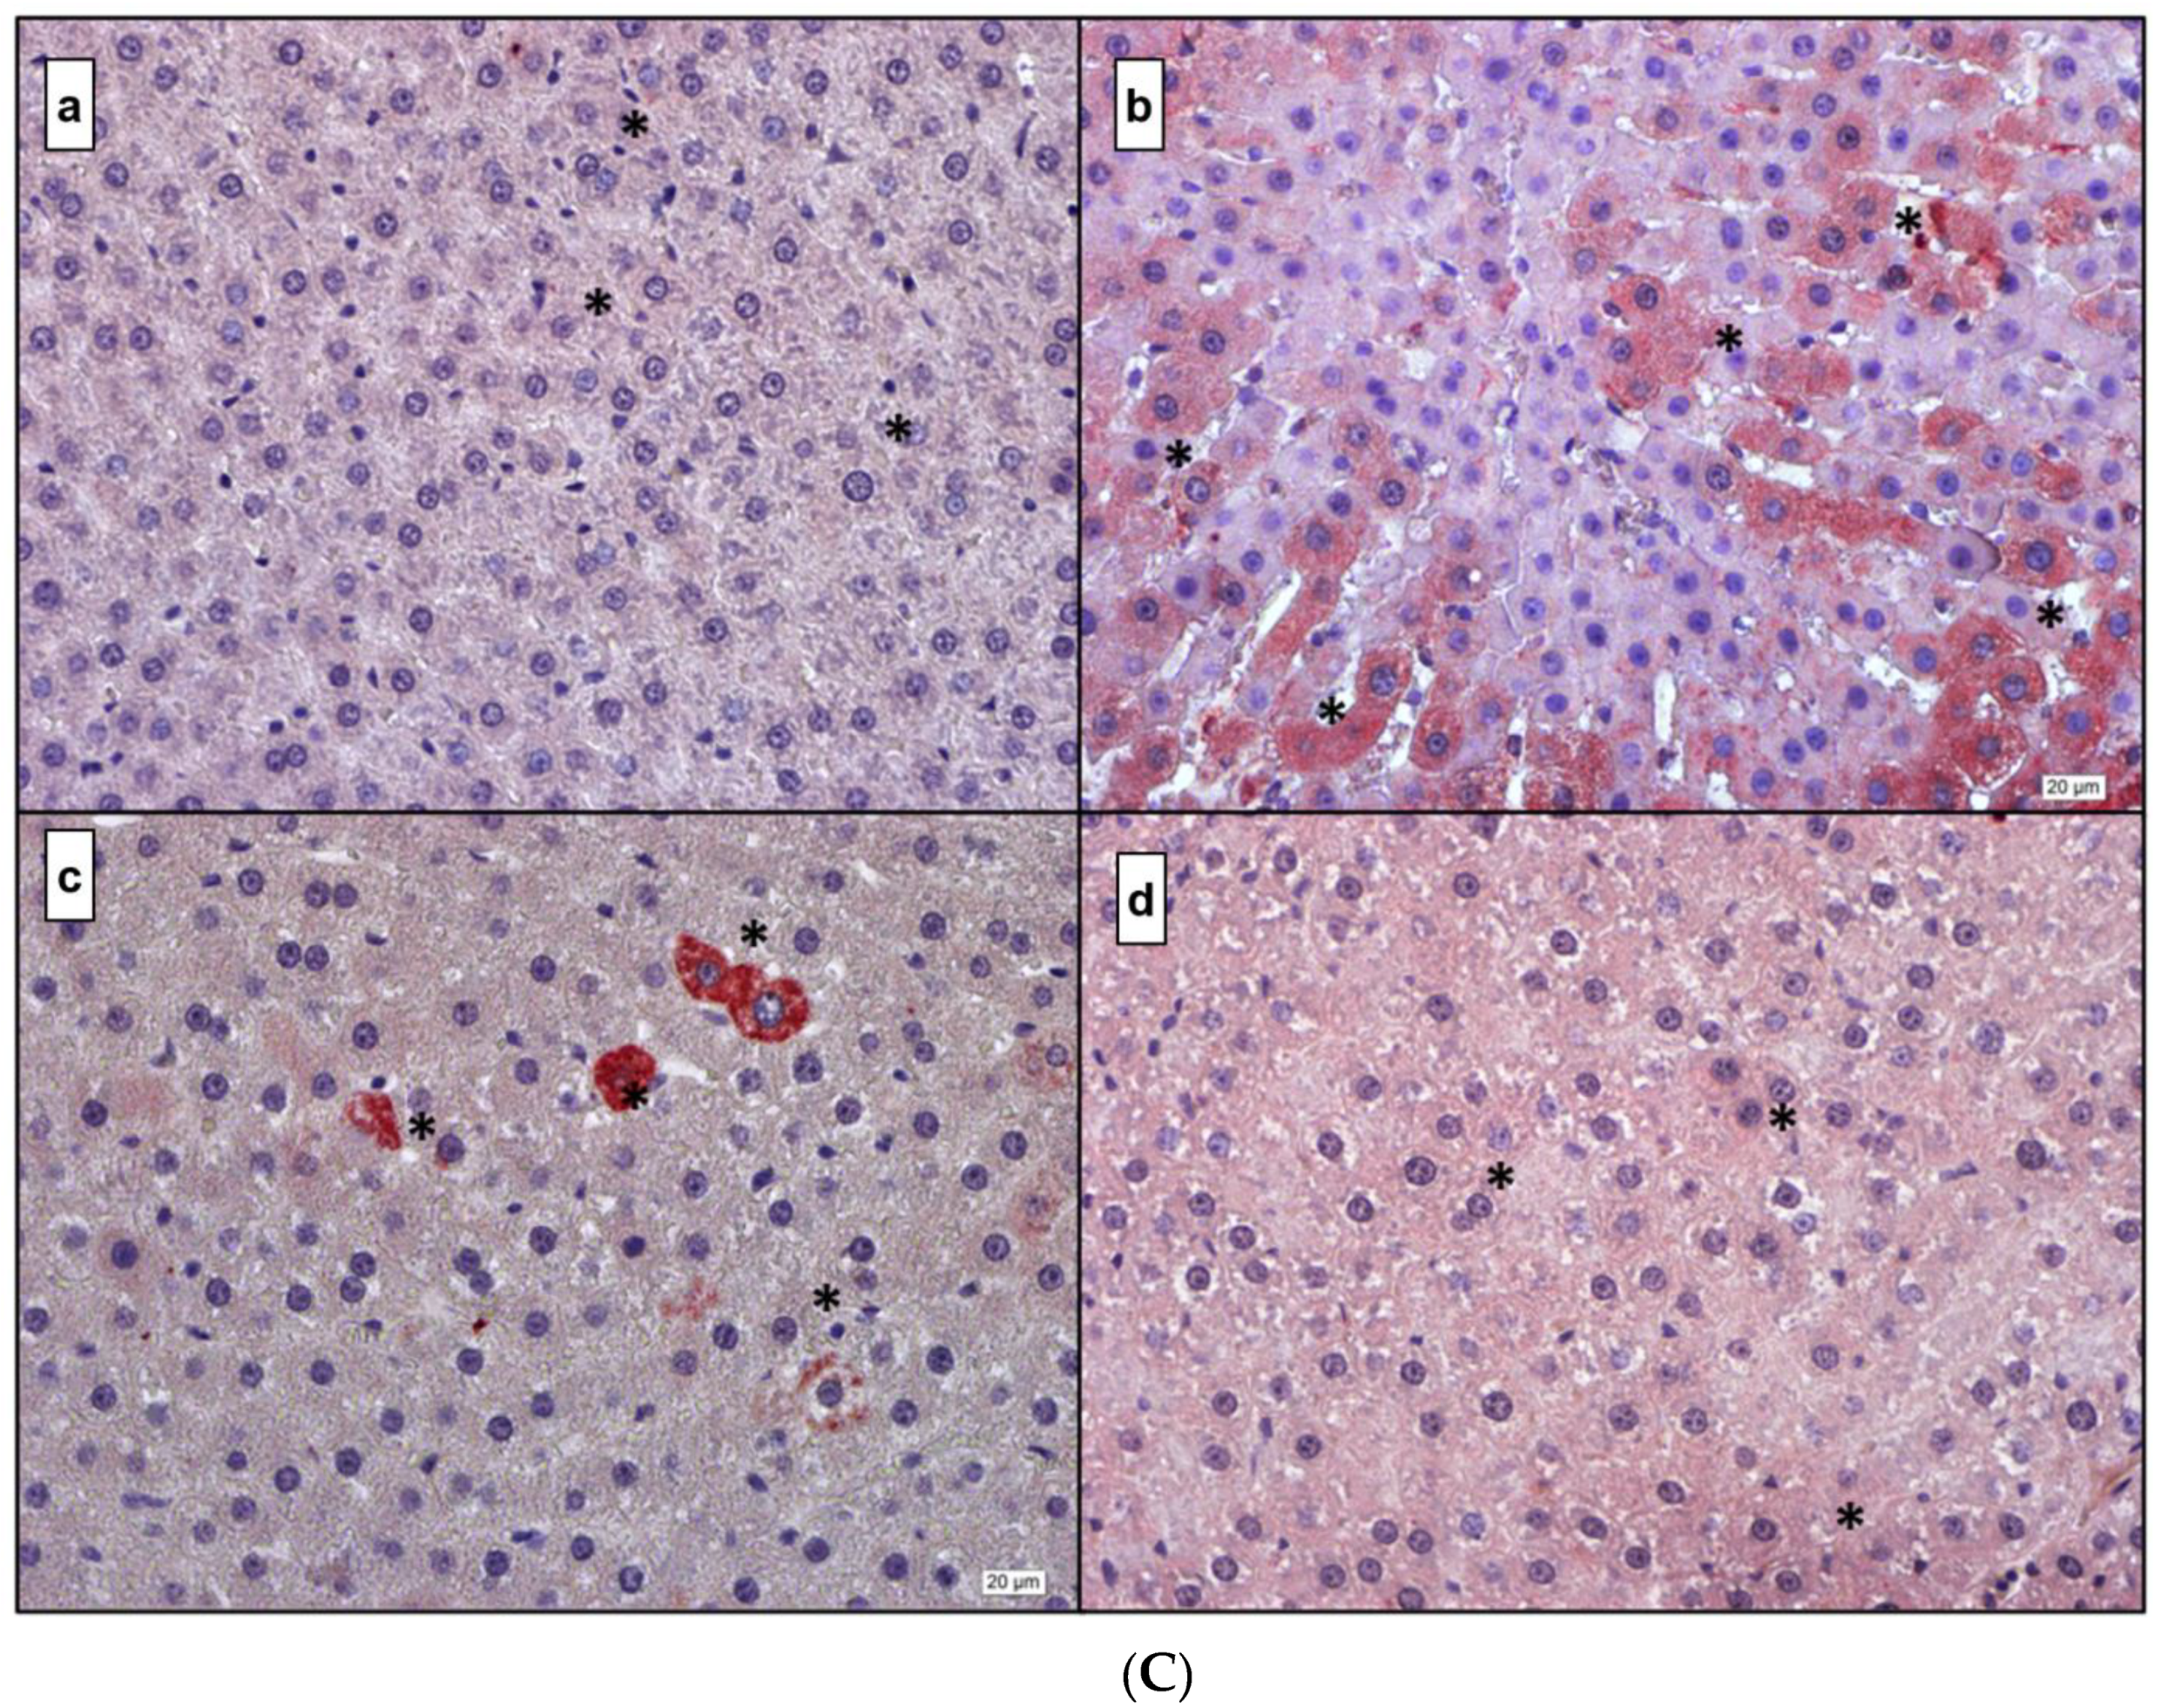
3.4. Immunohistochemistry
4. Discussion
5. Conclusions, Strengths and Limitations
6. Future Perspectives
Author Contributions
Funding
Institutional Review Board Statement
Informed Consent Statement
Data Availability Statement
Acknowledgments
Conflicts of Interest
References
- Mathers, C.D.; Loncar, D. Projections of global mortality and burden of disease from 2002 to 2030. PLoS Med. 2006, 3, e442. [Google Scholar] [CrossRef] [PubMed]
- Scheen, A.J.; Van Gaal, L.F. Combating the dual burden: Therapeutic targeting of common pathways in obesity and type 2 diabetes. Lancet Diabetes Endocrinol. 2014, 2, 911–922. [Google Scholar] [CrossRef]
- Mishra, M.; Kumar, H.; Bajpai, S.; Singh, R.K.; Tripathi, K. Level of serum IL-12 and its correlation with endothelial dysfunction, insulin resistance, proinflammatory cytokines and lipid profile in newly diagnosed type 2 diabetes. Diabetes Res. Clin. Pract. 2011, 94, 255–261. [Google Scholar] [CrossRef] [PubMed]
- Chen, W.; Balland, E.; Cowley, M. Hypothalamic Insulin Resistance in Obesity: Effects on Glucose Homeostasis. Neuroendocrinology 2017, 104, 364–381. [Google Scholar] [CrossRef] [PubMed]
- Peraldi, P.; Spiegelman, B. TNF-alpha and insulin resistance: Summary and future prospects. Mol. Cell. Biochem. 1998, 182, 169–175. [Google Scholar] [CrossRef] [PubMed]
- Morris, D.L. Minireview: Emerging Concepts in Islet Macrophage Biology in Type 2 Diabetes. Mol. Endocrinol. 2015, 29, 946–962. [Google Scholar] [CrossRef]
- Larsen, C.M.; Faulenbach, M.; Vaag, A.; Vølund, A.; Ehses, J.A.; Seifert, B.; Mandrup-Poulsen, T.; Donath, M.Y. Interleukin-1-receptor antagonist in type 2 diabetes mellitus. N. Engl. J. Med. 2007, 356, 1517–1526. [Google Scholar] [CrossRef]
- Grivas, T.B.; Savvidou, O.D. Melatonin the "light of night" in human biology and adolescent idiopathic scoliosis. Scoliosis 2007, 2, 6–14. [Google Scholar] [CrossRef]
- Esposito, E.; Cuzzocrea, S. Antiinflammatory activity of melatonin in central nervous system. Curr. Neuropharmacol. 2010, 8, 228–242. [Google Scholar] [CrossRef]
- Kostoglou-Athanassiou, I. Therapeutic applications of melatonin. Ther. Adv. Endocrinol. Metab. 2013, 4, 13–24. [Google Scholar] [CrossRef]
- MacDonald, I.J.; Huang, C.C.; Liu, S.C.; Tang, C.H. Reconsidering the Role of Melatonin in Rheumatoid Arthritis. Int. J. Mol. Sci. 2020, 21, 2877. [Google Scholar] [CrossRef] [PubMed]
- Chen, Y.; Zhao, Q.; Chen, Q.; Zhang, Y.; Shao, B.; Jin, Y.; Wu, J. Melatonin attenuated inflammatory reaction by inhibiting the activation of p38 and NFkappaB in taurocholateinduced acute pancreatitis. Mol. Med. Rep. 2018, 17, 5934–5939. [Google Scholar] [PubMed]
- Farez, M.F.; Calandri, I.L.; Correale, J.; Quintana, F.J. Anti-inflammatory effects of melatonin in multiple sclerosis. Bioessays 2016, 38, 1016–1026. [Google Scholar] [CrossRef] [PubMed]
- Shang, B.; Shi, H.; Wang, X.; Guo, X.; Wang, N.; Wang, Y.; Dong, L. Protective effect of melatonin on myenteric neuron damage in experimental colitis in rats. Fundam. Clin. Pharmacol. 2016, 30, 117–127. [Google Scholar] [CrossRef] [PubMed]
- Cuesta, S.; Kireev, R.; Forman, K.; García, C.; Escames, G.; Ariznavarreta, C.; Vara, E.; Tresguerres, J.A. Melatonin improves inflammation processes in liver of senescence-accelerated prone male mice (SAMP8). Exp. Gerontol. 2010, 45, 950–956. [Google Scholar] [CrossRef]
- Hu, S.; Yin, S.; Jiang, X.; Huang, D.; Shen, G. Melatonin protects against alcoholic liver injury by attenuating oxidative stress, inflammatory response, and apoptosis. Eur. J. Pharmacol. 2009, 616, 287–292. [Google Scholar] [CrossRef]
- Laste, G.; de Macedo, I.C.; Rozisky, J.R.; da Silva, F.R.; Caumo, W.; Torres, I.L. Melatonin administration reduces inflammatory pain in rats. J. Pain Res. 2012, 5, 359–362. [Google Scholar]
- Patel, R.; Parmar, N.; Palit, S.P.; Rathwa, N.; Ramachandran, A.V.; Begum, R. Diabetes mellitus and melatonin: Where are we? Biochimie 2022. [Google Scholar] [CrossRef]
- Peschke, E.; Fauteck, J.D.; Musshoff, U.; Schmidt, F.; Beckmann, A.; Peschke, D. Evidence for a melatonin receptor within pancreatic islets of neonate rats: Functional, autoradiographic, and molecular investigations. J. Pineal Res. 2000, 28, 156–164. [Google Scholar] [CrossRef]
- Picinato, M.C.; Haber, E.P.; Cipolla-Neto, J.; Curi, R.; de Oliveira Carvalho, C.R.; Carpinelli, A.R. Melatonin inhibits insulin secretion and decreases PKA levels without interfering with glucose metabolism in rat pancreatic islets. J. Pineal Res. 2002, 33, 156–160. [Google Scholar] [CrossRef]
- Rasmussen, D.D.; Boldt, B.M.; Wilkinson, C.W.; Yellon, S.M.; Matsumoto, A.M. Daily melatonin administration at middle age suppresses male rat visceral fat, plasma leptin, and plasma insulin to youthful levels. Endocrinology 1999, 140, 1009–1012. [Google Scholar] [CrossRef] [PubMed]
- Wolden-Hanson, T.; Mitton, D.R.; McCants, R.L.; Yellon, S.M.; Wilkinson, C.W.; Matsumoto, A.M.; Rasmussen, D.D. Daily melatonin administration to middle-aged male rats suppresses body weight, intraabdominal adiposity, and plasma leptin and insulin independent of food intake and total body fat. Endocrinology 2000, 141, 487–497. [Google Scholar] [CrossRef] [PubMed]
- Peschke, E.; Stumpf, I.; Bazwinsky, I.; Litvak, L.; Dralle, H.; Mühlbauer, E. Melatonin and type 2 diabetes—A possible link? J. Pineal Res. 2007, 42, 350–358. [Google Scholar] [CrossRef] [PubMed]
- Ekmekcioglu, C. Melatonin receptors in humans: Biological role and clinical relevance. Biomed. Pharmacother. 2006, 60, 97–108. [Google Scholar] [CrossRef] [PubMed]
- Ekmekcioglu, C.; Thalhammer, T.; Humpeler, S.; Mehrabi, M.R.; Glogar, H.D.; Hölzenbein, T.; Markovic, O.; Leibetseder, V.J.; Strauss-Blasche, G.; Marktl, W. The melatonin receptor subtype MT2 is present in the human cardiovascular system. J. Pineal Res. 2003, 35, 40–44. [Google Scholar] [CrossRef] [PubMed]
- Wongprayoon, P.; Govitrapong, P. Melatonin attenuates methamphetamine-induced neuroinflammation through the melatonin receptor in the SH-SY5Y cell line. Neurotoxicology 2015, 50, 122–130. [Google Scholar] [CrossRef]
- Söderquist, F.; Hellstrom, P.; Cunningham, J.L. Human gastroenteropancreatic expression of melatonin and its receptors MT1 and MT2. PLoS ONE 2015, 10, e0120195. [Google Scholar] [CrossRef]
- Boutin, J.A.; Audinot, V.; Ferry, G.; Delagrange, P. Molecular tools to study melatonin pathways and actions. Trends Pharmacol. Sci. 2005, 26, 412–419. [Google Scholar] [CrossRef]
- Das, N.; Mandala, A.; Naaz, S.; Giri, S.; Jain, M.; Bandyopadhyay, D.; Reiter, R.J.; Roy, S.S. Melatonin protects against lipid-induced mitochondrial dysfunction in hepatocytes and inhibits stellate cell activation during hepatic fibrosis in mice. J. Pineal Res. 2017, 62, e12404. [Google Scholar] [CrossRef]
- Ou, T.H.; Tung, Y.T.; Yang, T.H.; Chien, Y.W. Melatonin Improves Fatty Liver Syndrome by Inhibiting the Lipogenesis Pathway in Hamsters with High-Fat Diet-Induced Hyperlipidemia. Nutrients 2019, 11, 748. [Google Scholar] [CrossRef]
- Hajam, Y.A.; Rai, S. Melatonin and insulin modulates the cellular biochemistry, histoarchitecture and receptor expression during hepatic injury in diabetic rats. Life Sci. 2019, 239, 117046. [Google Scholar] [CrossRef] [PubMed]
- Cheshchevik, V.T.; Dremza, I.K.; Lapshina, E.A.; Zabrodskaya, S.V.; Kujawa, J.; Zavodnik, I.B. Corrections by melatonin of liver mitochondrial disorders under diabetes and acute intoxication in rats. Cell Biochem. Funct. 2011, 29, 481–488. [Google Scholar] [CrossRef] [PubMed]
- Baydas, G.; Canatan, H.; Turkoglu, A. Comparative analysis of the protective effects of melatonin and vitamin E on streptozocin-induced diabetes mellitus. J. Pineal Res. 2002, 32, 225–230. [Google Scholar] [CrossRef] [PubMed]
- Laemmli, U.K. Cleavage of structural proteins during the assembly of the head of bacteriophage T4. Nature 1970, 227, 680–685. [Google Scholar] [CrossRef]
- Koc, E.C.; Haciosmanoglu, E.; Claudio, P.P.; Wolf, A.; Califano, L.; Friscia, M.; Cortese, A.; Koc, H. Impaired mitochondrial protein synthesis in head and neck squamous cell carcinoma. Mitochondrion 2015, 24, 113–121. [Google Scholar] [CrossRef]
- Zanquetta, M.M.; Seraphim, P.M.; Sumida, D.H.; Cipolla-Neto, J.; Machado, U.F. Calorie restriction reduces pinealectomy-induced insulin resistance by improving GLUT4 gene expression and its translocation to the plasma membrane. J. Pineal Res. 2003, 35, 141–148. [Google Scholar] [CrossRef]
- Peschke, E.; Mühlbauer, E. New evidence for a role of melatonin in glucose regulation. Best Pract. Res. Clin. Endocrinol. Metab. 2010, 24, 829–841. [Google Scholar] [CrossRef]
- Peschke, E.; Mühlbauer, E. Diabetic Goto Kakizaki rats as well as type 2 diabetic patients show a decreased diurnal serum melatonin level and an increased pancreatic melatonin-receptor status. J. Pineal Res. 2006, 40, 135–143. [Google Scholar] [CrossRef]
- Kor, Y.; Geyikli, I.; Keskin, M.; Akan, M. Preliminary study: Evaluation of melatonin secretion in children and adolescents with type 1 diabetes mellitus. Indian J. Endocrinol. Metab. 2014, 18, 565–568. [Google Scholar] [CrossRef]
- Hajam, Y.A.; Rai, S.; Pandi-Perumal, S.R.; Brown, G.M.; Reiter, R.J.; Cardinali, D.P. Coadministration of Melatonin and Insulin Improves Diabetes-Induced Impairment of Rat Kidney Function. Neuroendocrinology 2021. [Google Scholar] [CrossRef]
- Abdulwahab, D.A.; El-Missiry, M.A.; Shabana, S.; Othman, A.I.; Amer, M.E. Melatonin protects the heart and pancreas by improving glucose homeostasis, oxidative stress, inflammation and apoptosis in T2DM-induced rats. Heliyon 2021, 7, e06474. [Google Scholar] [CrossRef] [PubMed]
- Sudnikovich, E.J.; Maksimchik, Y.Z.; Zabrodskaya, S.V.; Kubyshin, V.L.; Lapshina, E.A.; Bryszewska, M.; Reiter, R.J.; Zavodnik, I.B. Melatonin attenuates metabolic disorders due to streptozotocin-induced diabetes in rats. Eur. J. Pharmacol. 2007, 569, 180–187. [Google Scholar] [CrossRef]
- Li, X.; Zhang, M.; Tang, W. Effects of melatonin on streptozotocin-induced retina neuronal apoptosis in high blood glucose rat. Neurochem. Res. 2013, 38, 669–676. [Google Scholar] [CrossRef] [PubMed]
- Kedziora-Kornatowska, K.; Szewczyk-Golec, K.; Kozakiewic, M.; Pawluk, H.; Czuczejko, J.; Kornatowski, T.; Bartosz, G.; Kedziora, J. Melatonin improves oxidative stress parameters measured in the blood of elderly type 2 diabetic patients. J. Pineal Res. 2009, 46, 333–337. [Google Scholar] [CrossRef] [PubMed]
- Lontchi-Yimagou, E.; Sobngwi, E.; Matsha, T.E.; Kengne, A.P. Diabetes mellitus and inflammation. Curr. Diabetes Rep. 2013, 13, 435–444. [Google Scholar] [CrossRef]
- Karstoft, K.; Pedersen, B.K. Exercise and type 2 diabetes: Focus on metabolism and inflammation. Immunol. Cell Biol. 2016, 94, 146–150. [Google Scholar] [CrossRef] [PubMed]
- Amin, M.N.; Hussain, M.S.; Sarwar, M.S.; Moghal, M.M.R.; Das, A.; Hossain, M.Z.; Chowdhury, J.A.; Millat, M.S.; Islam, M.S. How the association between obesity and inflammation may lead to insulin resistance and cancer. Diabetes Metab. Syndr. Clin. Res. Rev. 2019, 13, 1213–1224. [Google Scholar] [CrossRef] [PubMed]
- Zhen, Y.; Sun, L.; Liu, H.; Duan, K.; Zeng, C.; Zhang, L.; Jin, D.; Peng, J.; Ding, W.; Zhao, Y. Alterations of peripheral CD4+CD25+Foxp3+ T regulatory cells in mice with STZ-induced diabetes. Cell. Mol. Immunol. 2012, 9, 75–85. [Google Scholar] [CrossRef]
- Zhang, H.; Potter, B.J.; Cao, J.M.; Zhang, C. Interferon-gamma induced adipose tissue inflammation is linked to endothelial dysfunction in type 2 diabetic mice. Basic Res. Cardiol. 2011, 106, 1135–1145. [Google Scholar] [CrossRef]
- Ventre, J.; Doebber, T.; Wu, M.; MacNaul, K.; Stevens, K.; Pasparakis, M.; Kollias, G.; Moller, D.E. Targeted disruption of the tumor necrosis factor-alpha gene: Metabolic consequences in obese and nonobese mice. Diabetes 1997, 46, 1526–1531. [Google Scholar] [CrossRef]
- Kaneto, H.; Nakatani, Y.; Miyatsuka, T.; Kawamori, D.; Matsuoka, T.A.; Matsuhisa, M.; Kajimoto, Y.; Ichijo, H.; Yamasaki, Y.; Hori, M. Possible novel therapy for diabetes with cell-permeable JNK-inhibitory peptide. Nat. Med. 2004, 10, 1128–1132. [Google Scholar] [CrossRef] [PubMed]
- Tuncman, G.; Hirosumi, J.; Solinas, G.; Chang, L.; Karin, M.; Hotamisligil, G.S. Functional in vivo interactions between JNK1 and JNK2 isoforms in obesity and insulin resistance. Proc. Natl. Acad. Sci. USA 2006, 103, 10741–10746. [Google Scholar] [CrossRef] [PubMed]
- Donath, M.Y. Multiple benefits of targeting inflammation in the treatment of type 2 diabetes. Diabetologia 2016, 59, 679–682. [Google Scholar] [CrossRef] [PubMed]
- Burhans, M.S.; Hagman, D.K.; Kuzma, J.N.; Schmidt, K.A.; Kratz, M. Contribution of Adipose Tissue Inflammation to the Development of Type 2 Diabetes Mellitus. Compr. Physiol. 2018, 9, 1–58. [Google Scholar] [PubMed]
- Agil, A.; Reiter, R.J.; Jiménez-Aranda, A.; Ibán-Arias, R.; Navarro-Alarcón, M.; Marchal, J.A.; Adem, A.; Fernández-Vázquez, G. Melatonin ameliorates low-grade inflammation and oxidative stress in young Zucker diabetic fatty rats. J. Pineal Res. 2013, 54, 381–388. [Google Scholar] [CrossRef]
- Ozkanlar, S.; Kara, A.; Sengul, E.; Simsek, N.; Karadeniz, A.; Kurt, N. Melatonin Modulates the Immune System Response and Inflammation in Diabetic Rats Experimentally-Induced by Alloxan. Horm. Metab. Res. 2016, 48, 137–144. [Google Scholar] [CrossRef][Green Version]
- Bazyar, H.; Gholinezhad, H.; Moradi, L.; Salehi, P.; Abadi, F.; Ravanbakhsh, M.; Zare Javid, A. The effects of melatonin supplementation in adjunct with non-surgical periodontal therapy on periodontal status, serum melatonin and inflammatory markers in type 2 diabetes mellitus patients with chronic periodontitis: A double-blind, placebo-controlled trial. Inflammopharmacology 2019, 27, 67–76. [Google Scholar]
- Jiang, T.; Chang, Q.; Cai, J.; Fan, J.; Zhang, X.; Xu, G. Protective Effects of Melatonin on Retinal Inflammation and Oxidative Stress in Experimental Diabetic Retinopathy. Oxidative Med. Cell. Longev. 2016, 2016, 3528274. [Google Scholar] [CrossRef]
- Li, J.H.; Yu, J.P.; Yu, H.G.; Xu, X.M.; Yu, L.L.; Liu, J.; Luo, H.S. Melatonin reduces inflammatory injury through inhibiting NF-kappaB activation in rats with colitis. Mediat. Inflamm. 2005, 2005, 185–193. [Google Scholar] [CrossRef]
- Sasaki, M.; Jordan, P.; Joh, T.; Itoh, M.; Jenkins, M.; Pavlick, K.; Minagar, A.; Alexander, S.J. Melatonin reduces TNF-a induced expression of MAdCAM-1 via inhibition of NF-kappaB. BMC Gastroenterol. 2002, 2, 9. [Google Scholar] [CrossRef]
- Chuang, J.I.; Mohan, N.; Meltz, M.L.; Reiter, R.J. Effect of melatonin on NF-kappa-B DNA-binding activity in the rat spleen. Cell Biol. Int. 1996, 20, 687–692. [Google Scholar] [CrossRef] [PubMed]
- Nayki, U.; Mohan, N.; Meltz, M.L.; Reiter, R.J. The effect of melatonin on oxidative stress and apoptosis in experimental diabetes mellitus-related ovarian injury. Gynecol. Endocrinol. 2016, 32, 421–426. [Google Scholar] [CrossRef] [PubMed]
- Negi, G.; Kumar, A.; Sharma, S.S. Melatonin modulates neuroinflammation and oxidative stress in experimental diabetic neuropathy: Effects on NF-kappaB and Nrf2 cascades. J. Pineal. Res. 2011, 50, 124–131. [Google Scholar] [CrossRef] [PubMed]
- Zibolka, J.; Bazwinsky-Wutschke, I.; Mühlbauer, E.; Peschke, E. Distribution and density of melatonin receptors in human main pancreatic islet cell types. J. Pineal Res. 2018, 65, e12480. [Google Scholar] [CrossRef] [PubMed]
- Ramracheya, R.D.; Muller, D.S.; Squires, P.E.; Brereton, H.; Sugden, D.; Huang, G.C.; Amiel, S.A.; Jones, P.M.; Persaud, S.J. Function and expression of melatonin receptors on human pancreatic islets. J. Pineal Res. 2008, 44, 273–279. [Google Scholar] [CrossRef] [PubMed]
- Muhlbauer, E.; Albrecht, E.; Hofmann, K.; Bazwinsky-Wutschke, I.; Peschke, E. Melatonin inhibits insulin secretion in rat insulinoma beta-cells (INS-1) heterologously expressing the human melatonin receptor isoform MT2. J. Pineal Res. 2011, 51, 361–372. [Google Scholar] [CrossRef]
- Poppema, S.; Hollema, H.; Visser, L.; Vos, H. Monoclonal antibodies (MT1, MT2, MB1, MB2, MB3) reactive with leukocyte subsets in paraffin-embedded tissue sections. Am. J. Pathol. 1987, 127, 418–429. [Google Scholar]
- Dubocovich, M.L.; Markowska, M. Functional MT1 and MT2 melatonin receptors in mammals. Endocrine 2005, 27, 101–110. [Google Scholar] [CrossRef]
- Glebezdina, N.S.; Olina, A.A.; Nekrasova, I.V.; Kuklina, E.M. Molecular Mechanisms of Control of Differentiation of Regulatory T-Lymphocytes by Exogenous Melatonin. Dokl. Biochem. Biophys. 2019, 484, 13–16. [Google Scholar] [CrossRef]
- Drazen, D.L.; Nelson, R.J. Melatonin receptor subtype MT2 (Mel 1b) and not mt1 (Mel 1a) is associated with melatonin-induced enhancement of cell-mediated and humoral immunity. Neuroendocrinology 2001, 74, 178–184. [Google Scholar] [CrossRef]
- Haldar, C.; Haussler, D.; Gupta, D. Effect of the pineal gland on circadian rhythmicity of colony forming units for granulocytes and macrophages (CFU-GM) from rat bone marrow cell cultures. J. Pineal Res. 1992, 12, 79–83. [Google Scholar] [CrossRef] [PubMed]
- Del Gobbo, V.; Libri, V.; Villani, N.; Caliò, R.; Nisticò, G. Pinealectomy inhibits interleukin-2 production and natural killer activity in mice. Int. J. Immunopharmacol. 1989, 11, 567–573. [Google Scholar] [CrossRef]
- Liu, X.; Gong, Y.; Xiong, K.; Ye, Y.; Xiong, Y.; Zhuang, Z.; Luo, Y.; Jiang, Q.; He, F. Melatonin mediates protective effects on inflammatory response induced by interleukin-1 beta in human mesenchymal stem cells. J. Pineal Res. 2013, 55, 14–25. [Google Scholar] [CrossRef] [PubMed]
- Cevik, H.; Erkanli, G.; Ercan, F.; Işman, C.A.; Yeğen, B.C. Exposure to continuous darkness ameliorates gastric and colonic inflammation in the rat: Both receptor and non-receptor-mediated processes. J. Gastroenterol. Hepatol. 2005, 20, 294–303. [Google Scholar] [CrossRef] [PubMed]
- Karamitri, A.; Plouffe, B.; Bonnefond, A.; Chen, M.; Gallion, J.; Guillaume, J.L.; Hegron, A.; Boissel, M.; Canouil, M.; Langenberg, C.; et al. Type 2 diabetes-associated variants of the MT2 melatonin receptor affect distinct modes of signaling. Sci. Signal. 2018, 11, eaan6622. [Google Scholar] [CrossRef]
- Lo, C.C.; Lin, S.H.; Chang, J.S.; Chien, Y.W. Effects of Melatonin on Glucose Homeostasis, Antioxidant Ability, and Adipokine Secretion in ICR Mice with NA/STZ-Induced Hyperglycemia. Nutrients 2017, 9, 1187. [Google Scholar] [CrossRef]
- Dandekar, A.; Mendez, R.; Zhang, K. Cross talk between ER stress, oxidative stress, and inflammation in health and disease. Methods Mol. Biol. 2015, 1292, 205–214. [Google Scholar]
- Hill, S.M.; Cheng, C.; Yuan, L.; Mao, L.; Jockers, R.; Dauchy, B.; Blask, D.E. Age-related decline in melatonin and its MT1 receptor are associated with decreased sensitivity to melatonin and enhanced mammary tumor growth. Curr. Aging Sci. 2013, 6, 125–133. [Google Scholar] [CrossRef]
- Waldhauser, F.; Weiszenbacher, G.; Tatzer, E.; Gisinger, B.; Waldhauser, M.; Schemper, M.; Frisch, H. Alterations in nocturnal serum melatonin levels in humans with growth and aging. J. Clin. Endocrinol. Metab. 1988, 66, 648–652. [Google Scholar] [CrossRef]
- Bektas, A.; Schurman, S.H.; Sen, R.; Ferrucci, L. Aging, inflammation and the environment. Exp. Gerontol. 2018, 105, 10–18. [Google Scholar] [CrossRef]


| Primer Name | Forward Primer Sequence (5′-3′) | Reverse Primer Sequence (3′-5′) |
|---|---|---|
| TNF-a (NM_012675.3) | GCAGATGGGCTGTACCTTATC | GAAATGGCAAATCGGCTGAC |
| IL-6 (NM_012589.2) | GTCTTCTGGAGTTCCGTTTCT | GGGTTTCAGTATTGCTCTGAATG |
| IL-1B (NM_031512.2) | CGTGGGATGATGACGACCTG | TGGGTGTGCCGTCTTTCATC |
| NF-kB (NM_001276711.1) | GGTTACGGGAGATGTGAAGATG | GTGGATGATGGCTAAGTGTAGG |
| HPRT (Housekeeping) (NM_012583.2) | GACCTCTCGAAGTGTTGGATAC | TCAAATCCCTGAAGTGCTCAT |
| Blood Glucose Levels (mg/dL) | Control | DM | DM + MEL | DM + MEL + LUZ | ||||
|---|---|---|---|---|---|---|---|---|
| B | A | B | A | B | A | B | A | |
| 92 ± 11 | 94 ± 9 | 423 ± 22 *** | 415 ± 28 *** | 416 ± 25 *** | 390 ± 24 *** | 421 ± 32 *** | 405 ± 20 *** | |
| CONTROL | DM | DM + MEL | DM + MEL + LUZ | |
|---|---|---|---|---|
| AST (U/L) | 127.0 ± 24.31 | 232.7 ± 65.84 * | 146.9 ± 17.42 § | 168.7 ± 16.25 |
| ALT (U/L) | 65.04 ± 10.98 | 120.1 ± 25.45 *** | 83.82 ± 13.61 § | 80.60 ± 23.93 |
| BUN (mg/dL) | 13.89 ± 1.65 | 29.08 ± 4.95 *** | 23.09 ± 1.15 §§ | 21.15 ± 5.69 |
| TRIGLYCERIDE (mg/dL) | 104.9 ± 26.13 | 247.2 ± 44.99 ** | 163.4 ± 21.58 § | 203.8 ± 42.73 # |
| VLDL (mg/dL) | 23.13 ± 6.7 | 68.00 ± 28.69 ** | 31.17 ± 5.269 § | 42.80 ± 12.26 # |
| CHOLESTEROL (mg/dL) | 49.70 ± 5.35 | 69.74 ± 8.71 *** | 51.06 ± 1.24 §§ | 57.33 ± 4.8 # |
Publisher’s Note: MDPI stays neutral with regard to jurisdictional claims in published maps and institutional affiliations. |
© 2022 by the authors. Licensee MDPI, Basel, Switzerland. This article is an open access article distributed under the terms and conditions of the Creative Commons Attribution (CC BY) license (https://creativecommons.org/licenses/by/4.0/).
Share and Cite
Yapislar, H.; Haciosmanoglu, E.; Sarioglu, T.; Degirmencioglu, S.; Sogut, I.; Poteser, M.; Ekmekcioglu, C. Anti-Inflammatory Effects of Melatonin in Rats with Induced Type 2 Diabetes Mellitus. Life 2022, 12, 574. https://doi.org/10.3390/life12040574
Yapislar H, Haciosmanoglu E, Sarioglu T, Degirmencioglu S, Sogut I, Poteser M, Ekmekcioglu C. Anti-Inflammatory Effects of Melatonin in Rats with Induced Type 2 Diabetes Mellitus. Life. 2022; 12(4):574. https://doi.org/10.3390/life12040574
Chicago/Turabian StyleYapislar, Hande, Ebru Haciosmanoglu, Turkan Sarioglu, Sevgin Degirmencioglu, Ibrahim Sogut, Michael Poteser, and Cem Ekmekcioglu. 2022. "Anti-Inflammatory Effects of Melatonin in Rats with Induced Type 2 Diabetes Mellitus" Life 12, no. 4: 574. https://doi.org/10.3390/life12040574
APA StyleYapislar, H., Haciosmanoglu, E., Sarioglu, T., Degirmencioglu, S., Sogut, I., Poteser, M., & Ekmekcioglu, C. (2022). Anti-Inflammatory Effects of Melatonin in Rats with Induced Type 2 Diabetes Mellitus. Life, 12(4), 574. https://doi.org/10.3390/life12040574