
HEK293T Cells with TFAM Disruption by CRISPR-Cas9 as a Model for Mitochondrial Regulation

 , , ,
, , ,
Abstract
:1. Introduction
2. Materials and Methods
2.1. Cell Line
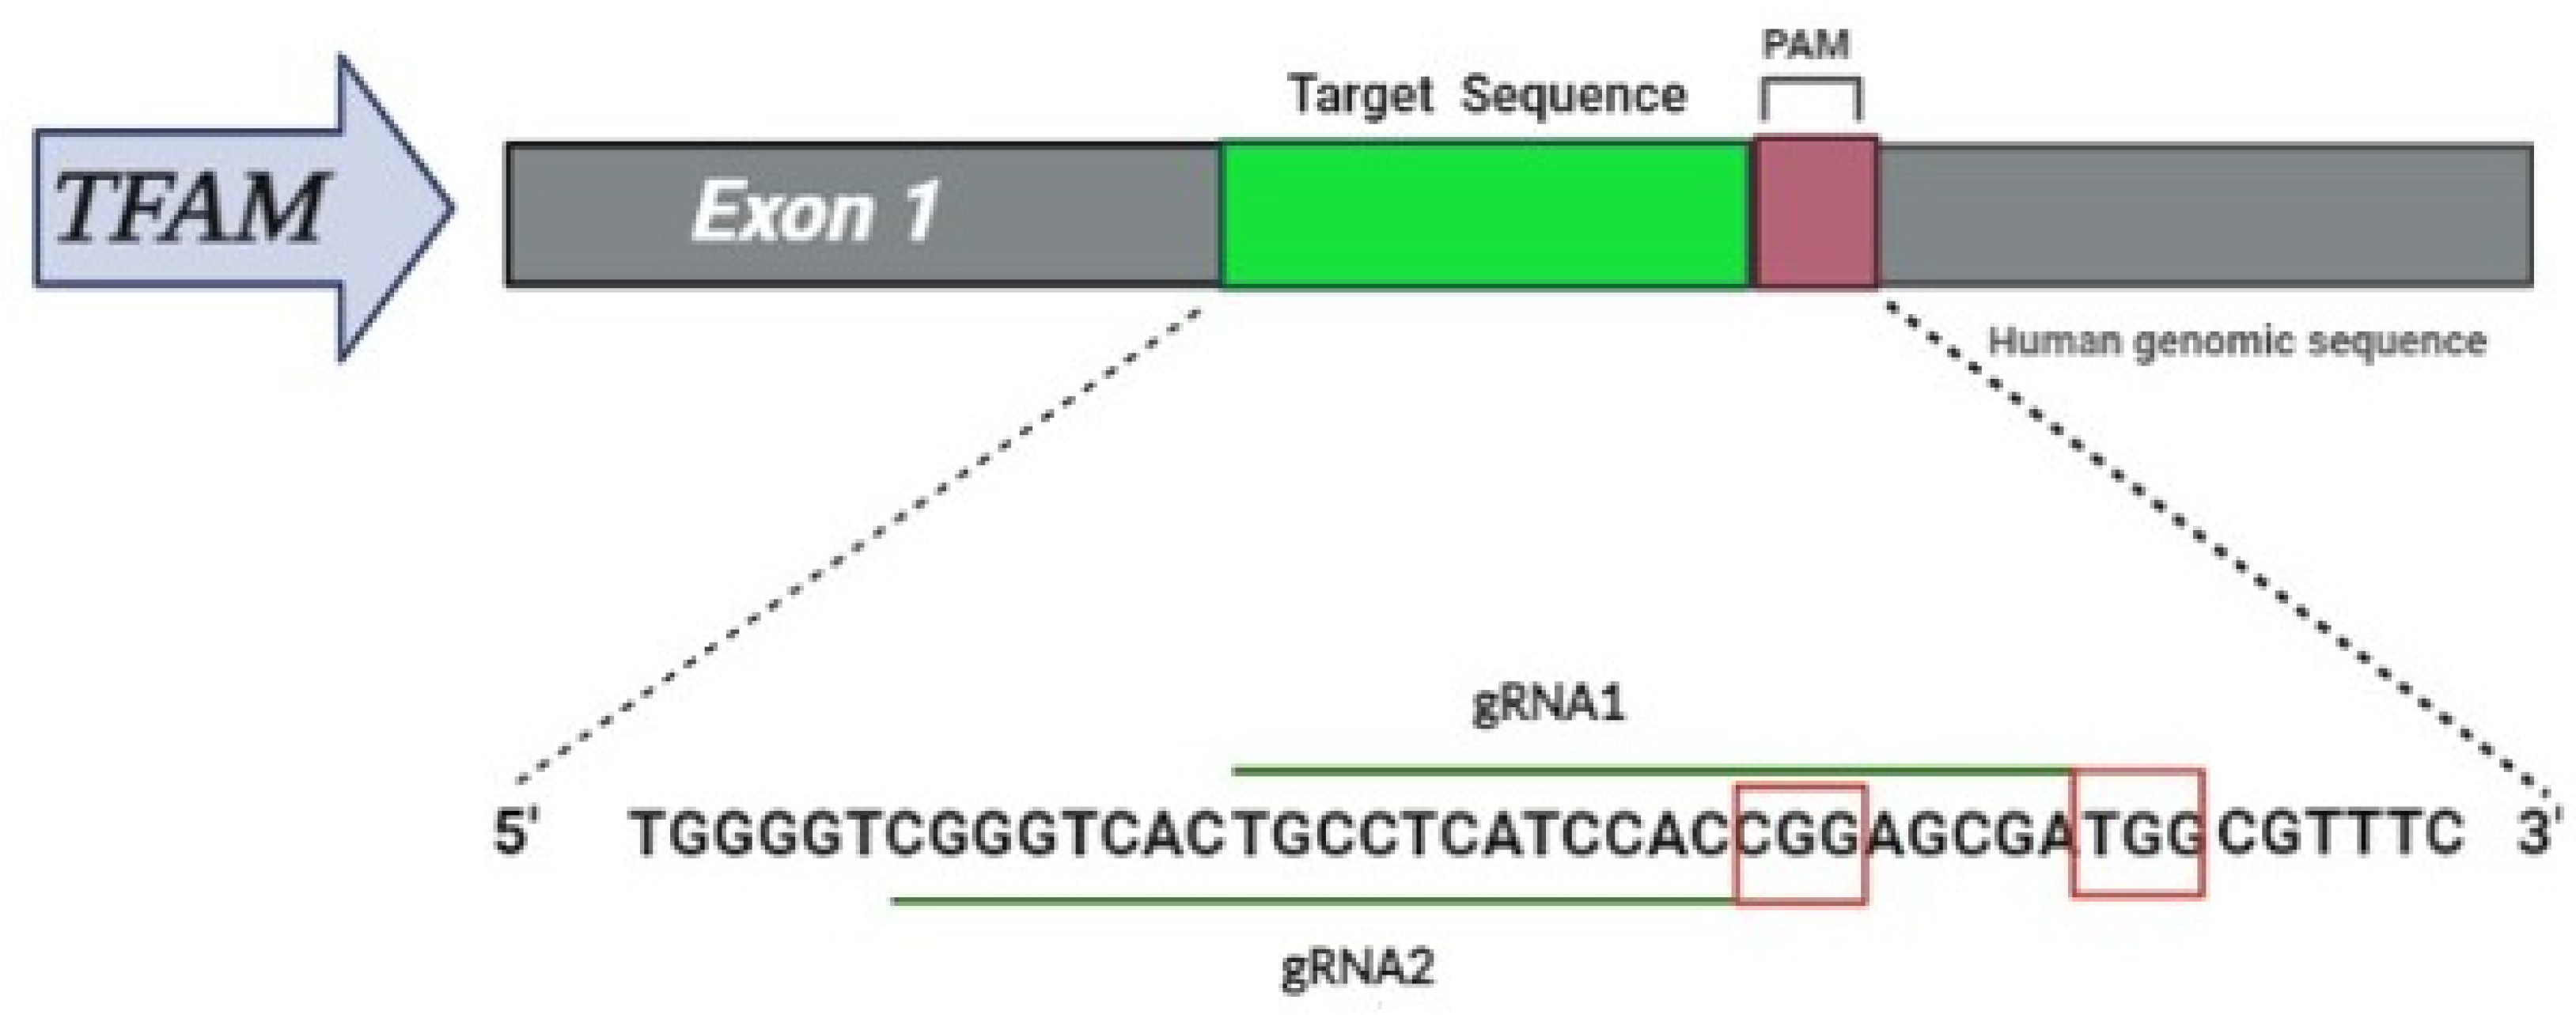
2.2. CRISPR Design
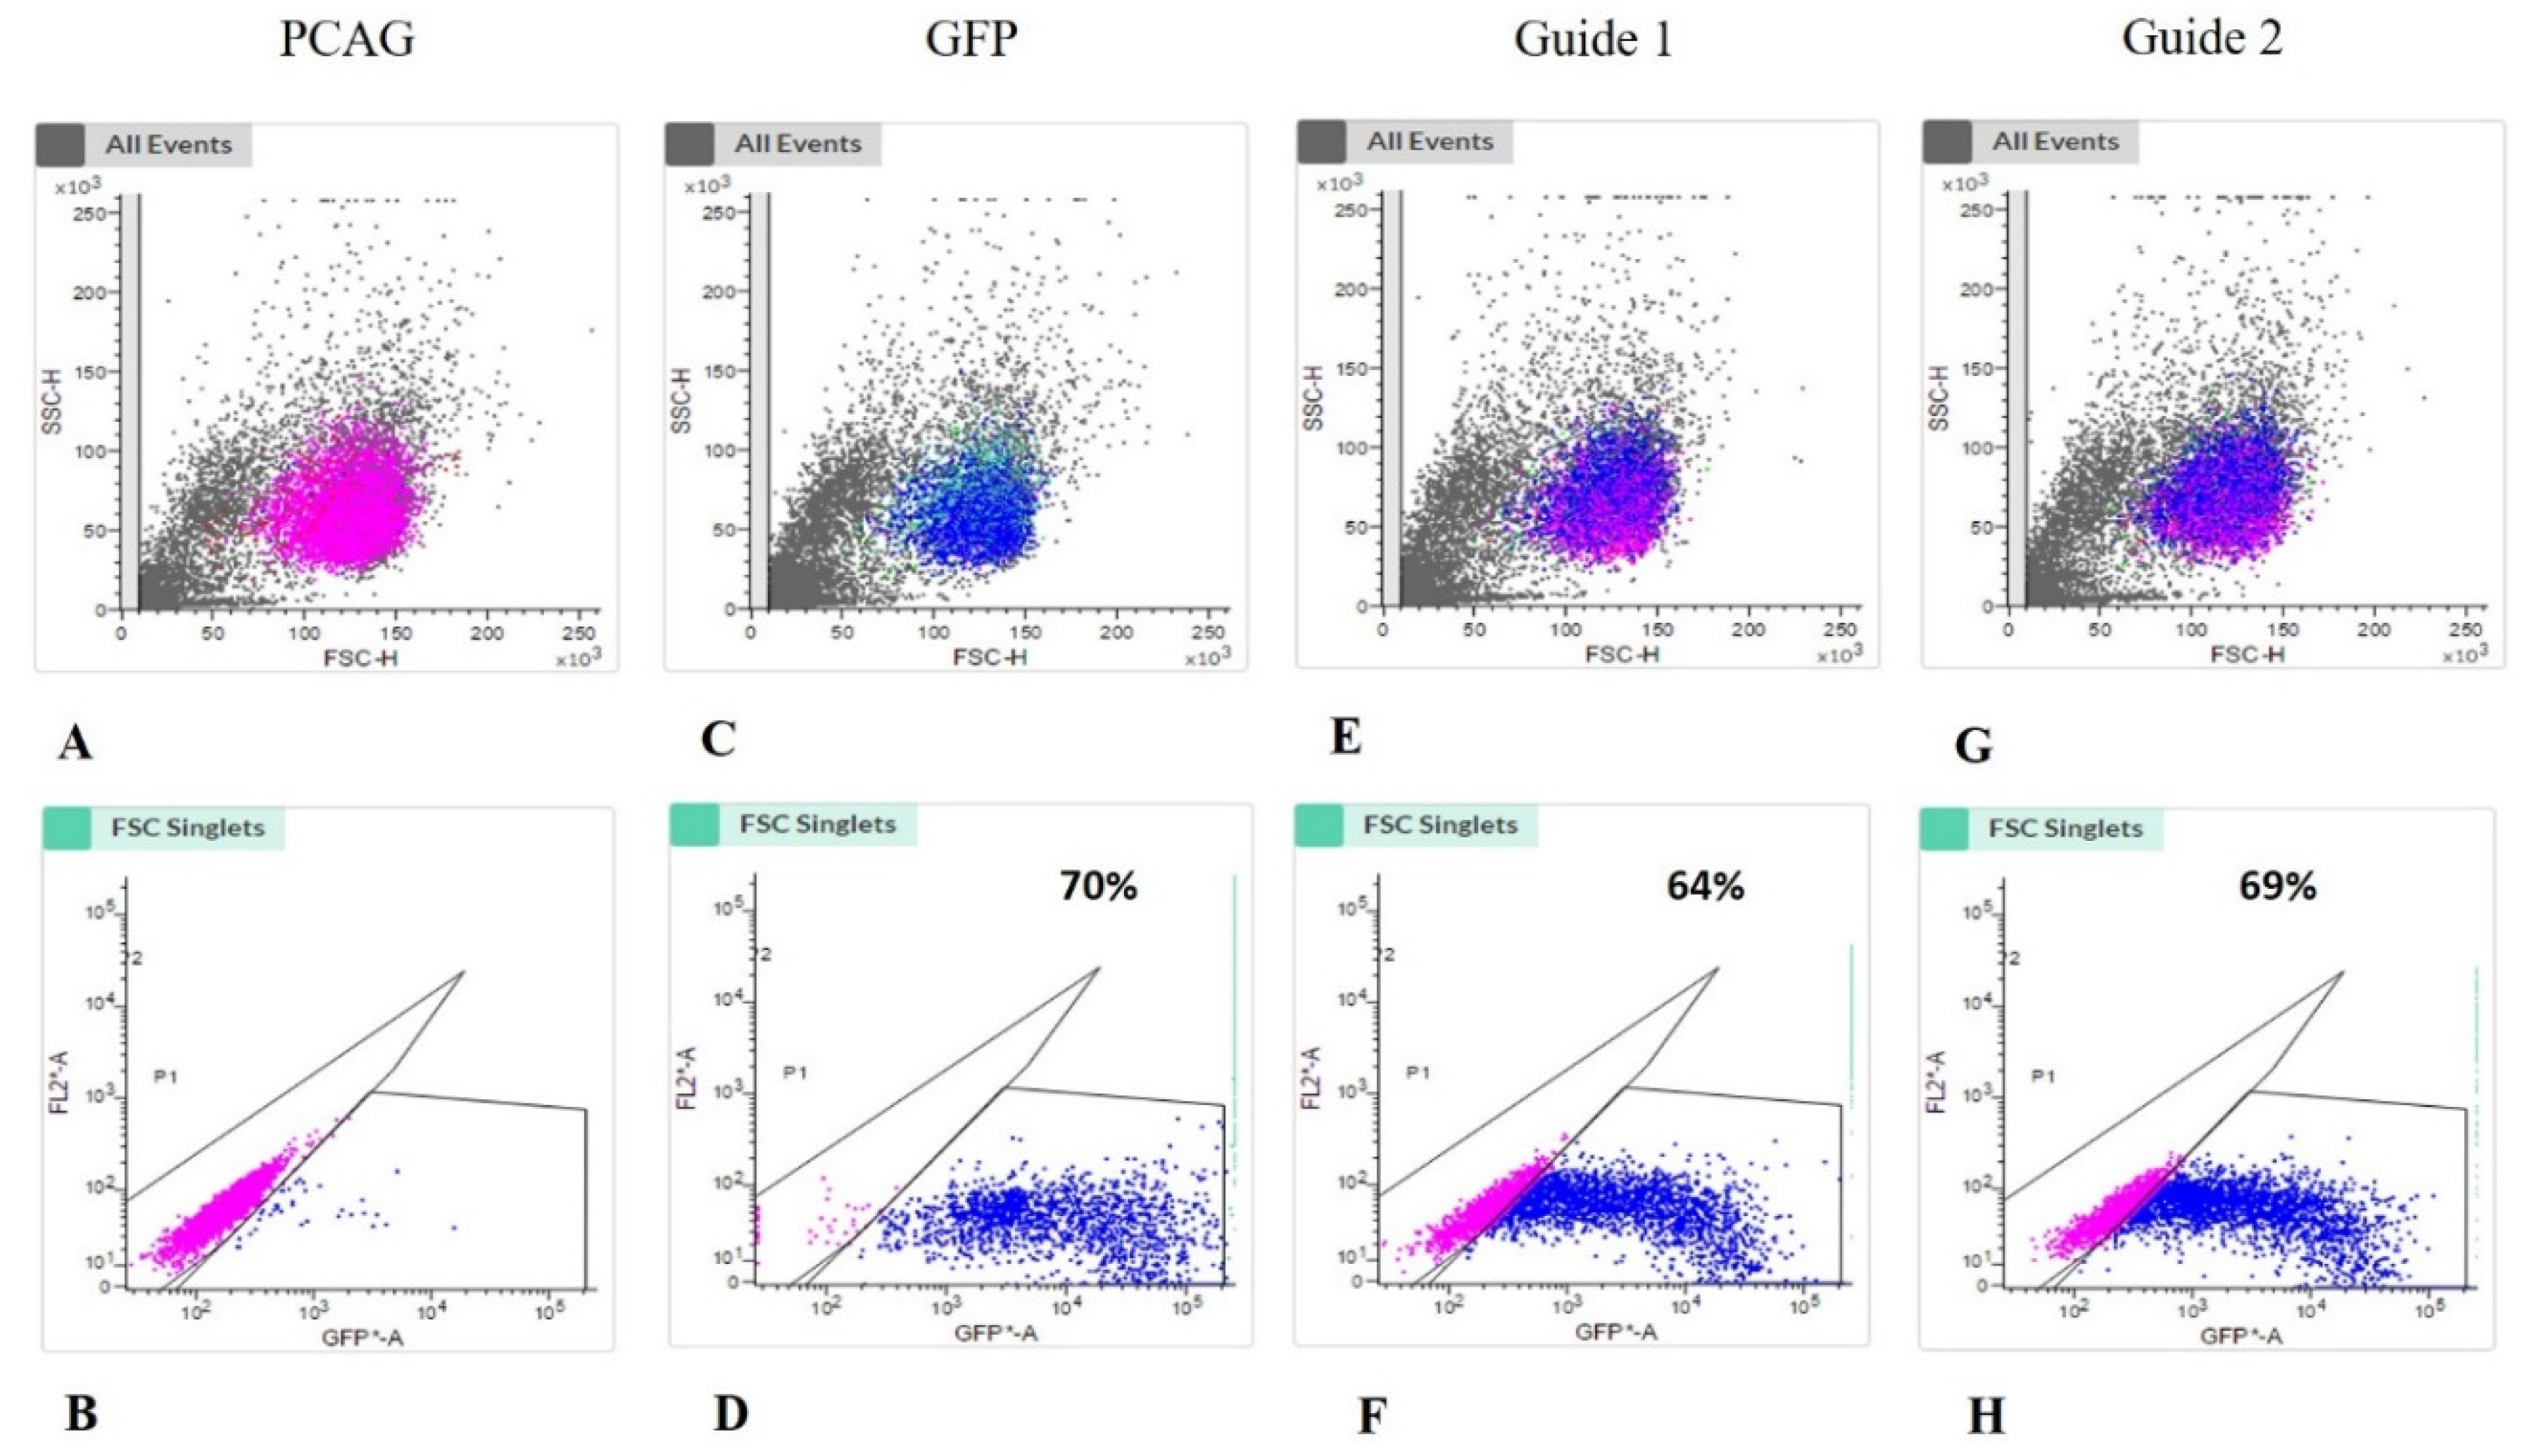
2.3. Transfection Analysis
2.4. Genomic DNA Extraction and Analysis of Genome Editing (Insertion–Deletion (Indel) Mutations)
2.5. Cell Cloning through Fluorescence-Activated Cell Sorting (FACS) of Transfected Cells
2.6. Determination of mtDNA Copy Number
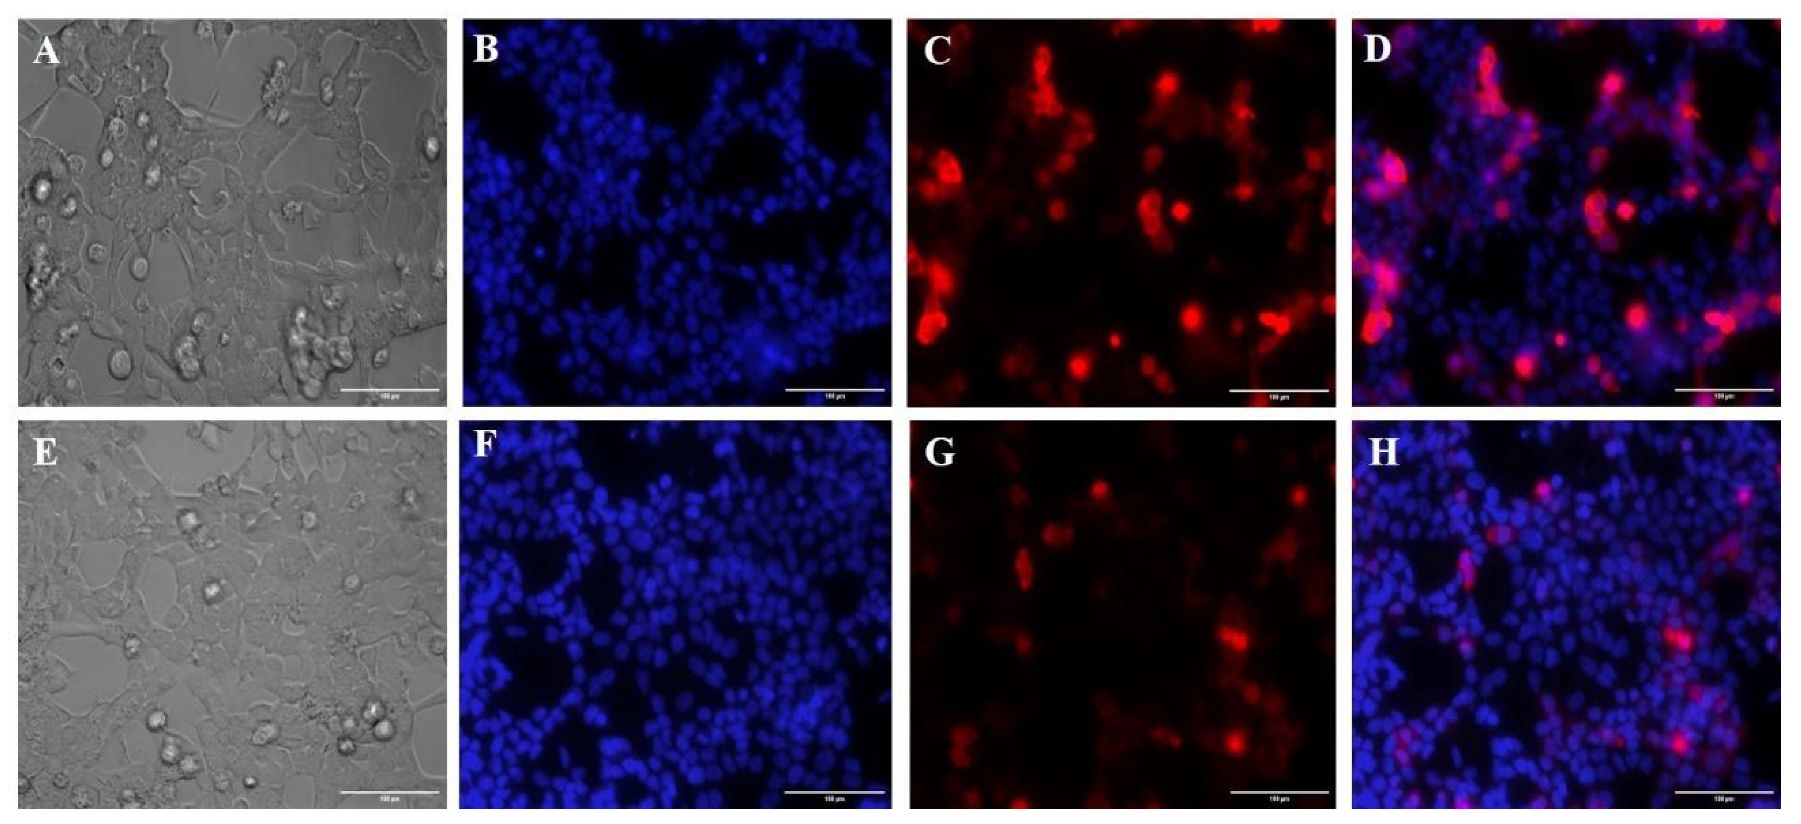
2.7. Membrane Potential Using the Mitotracker Red Marker
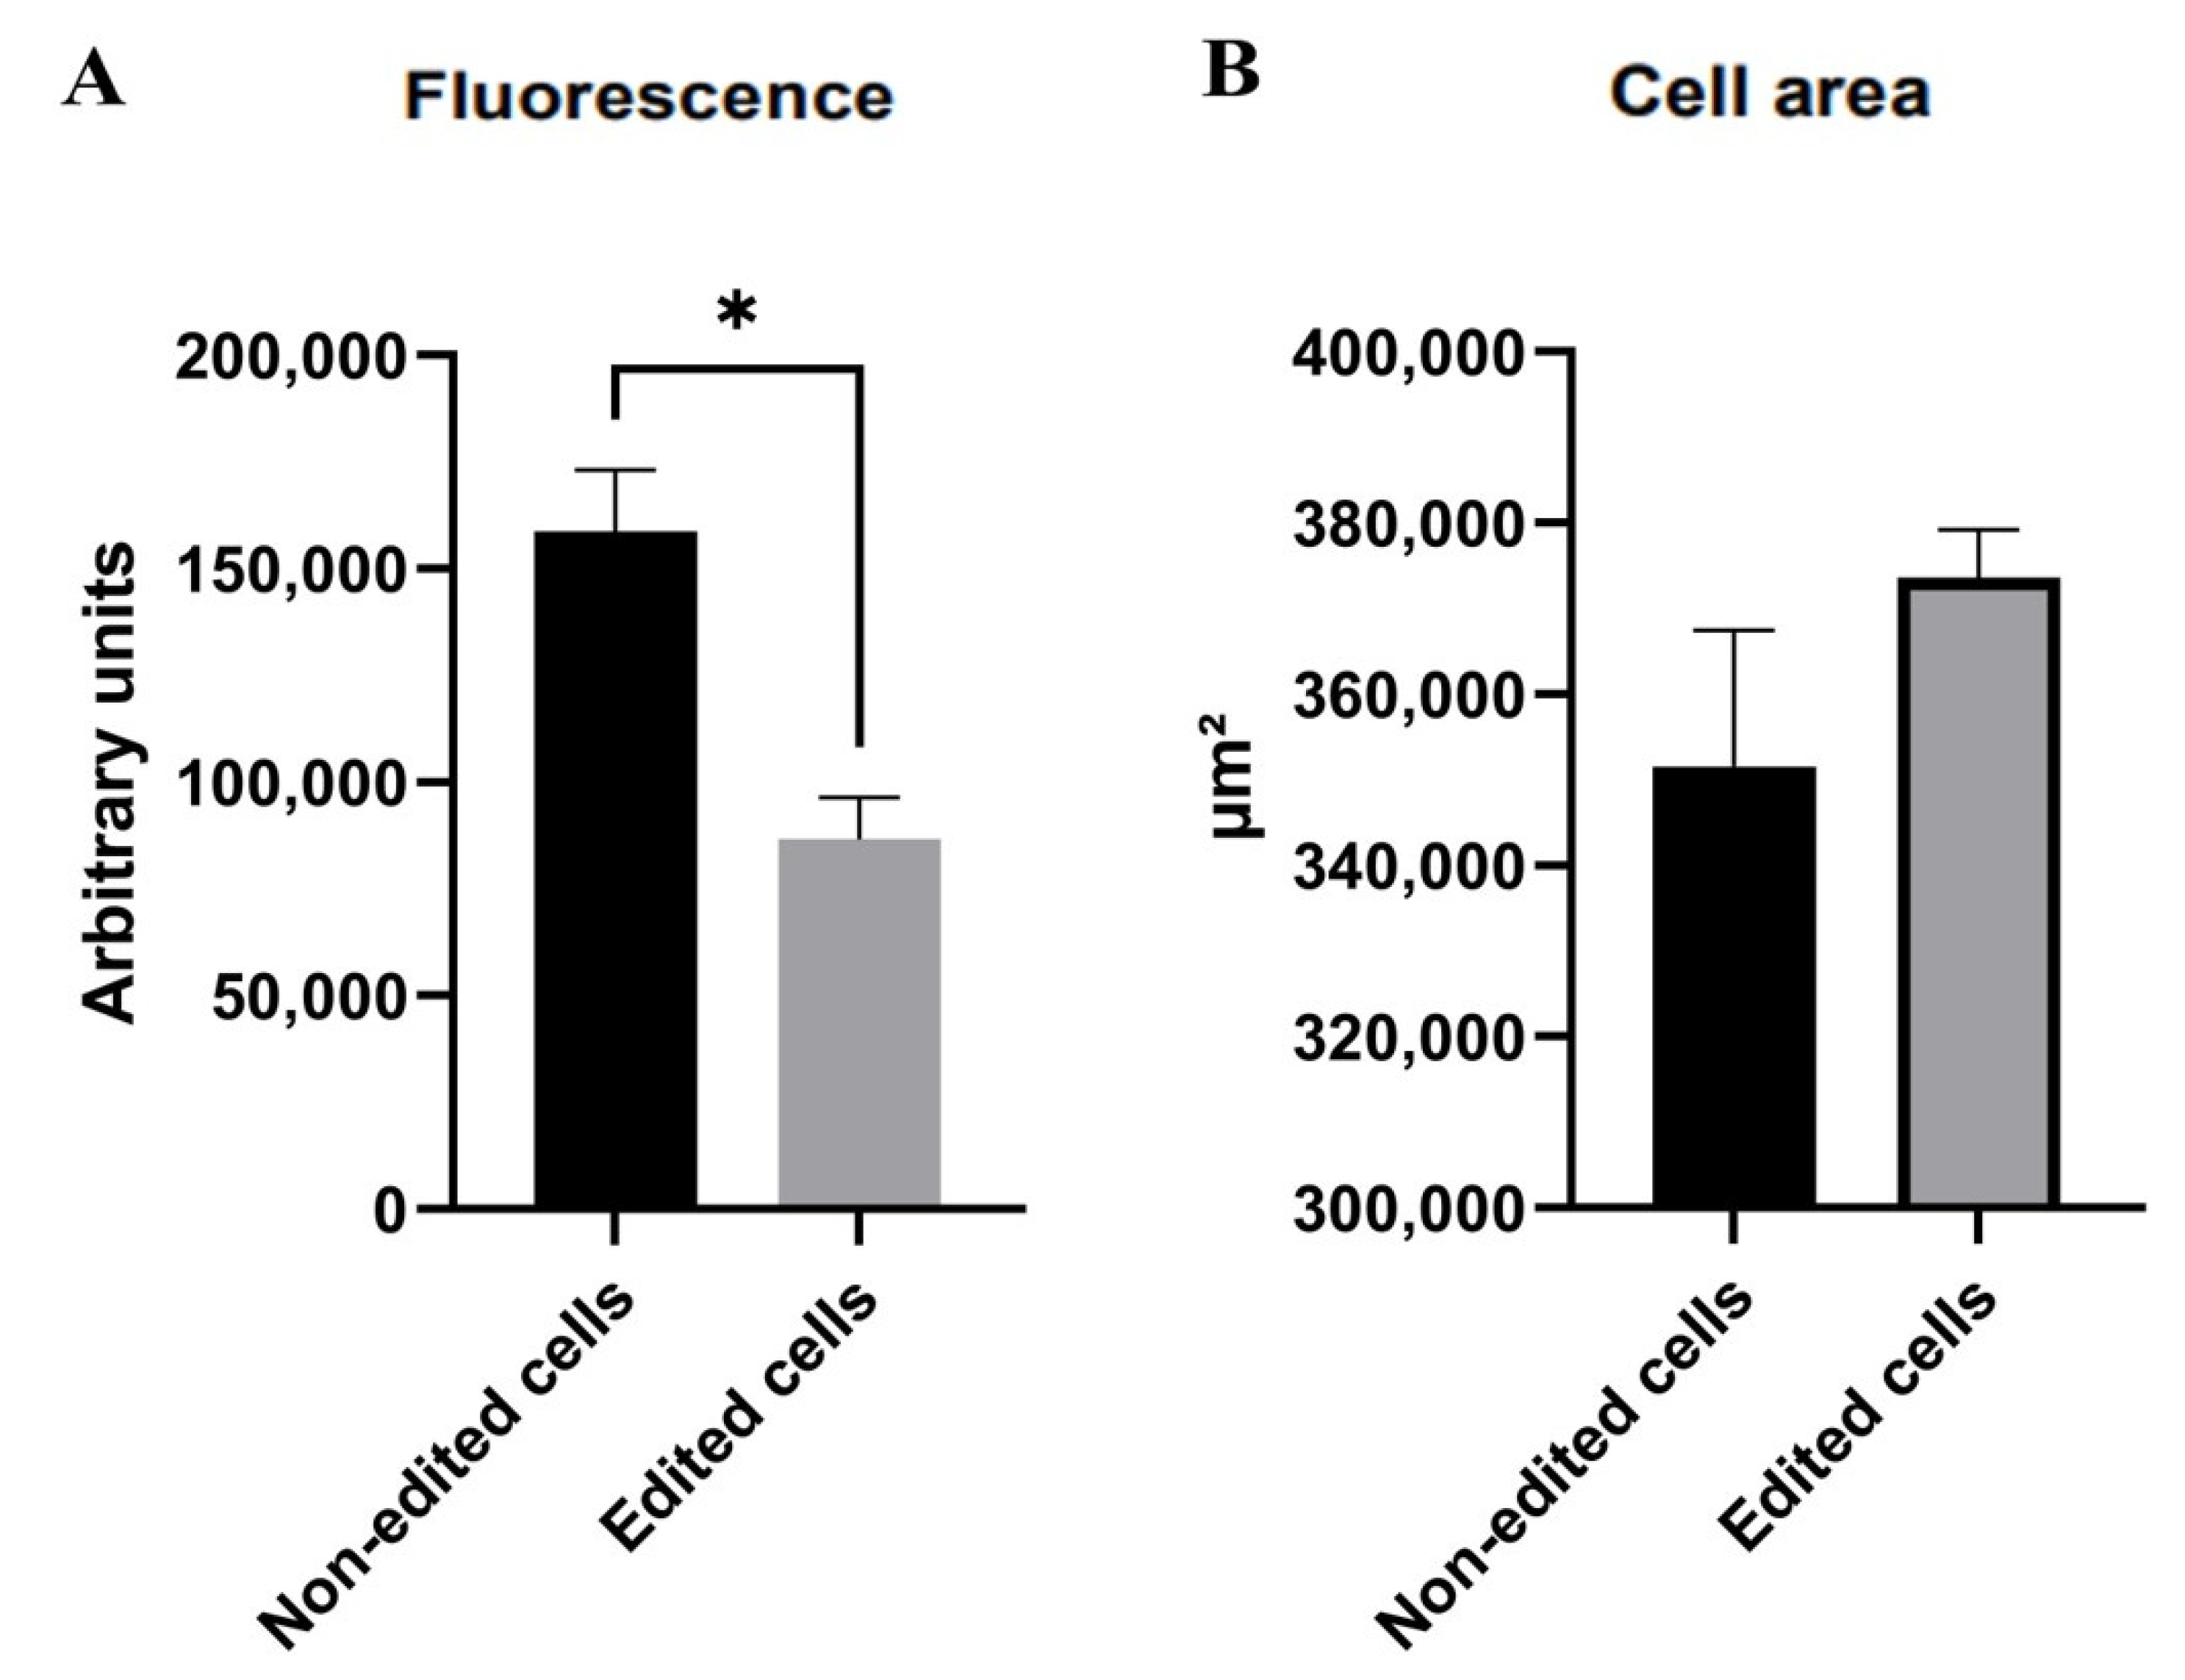
2.8. Statistical Analysis
3. Results
3.1. Transfected Cells
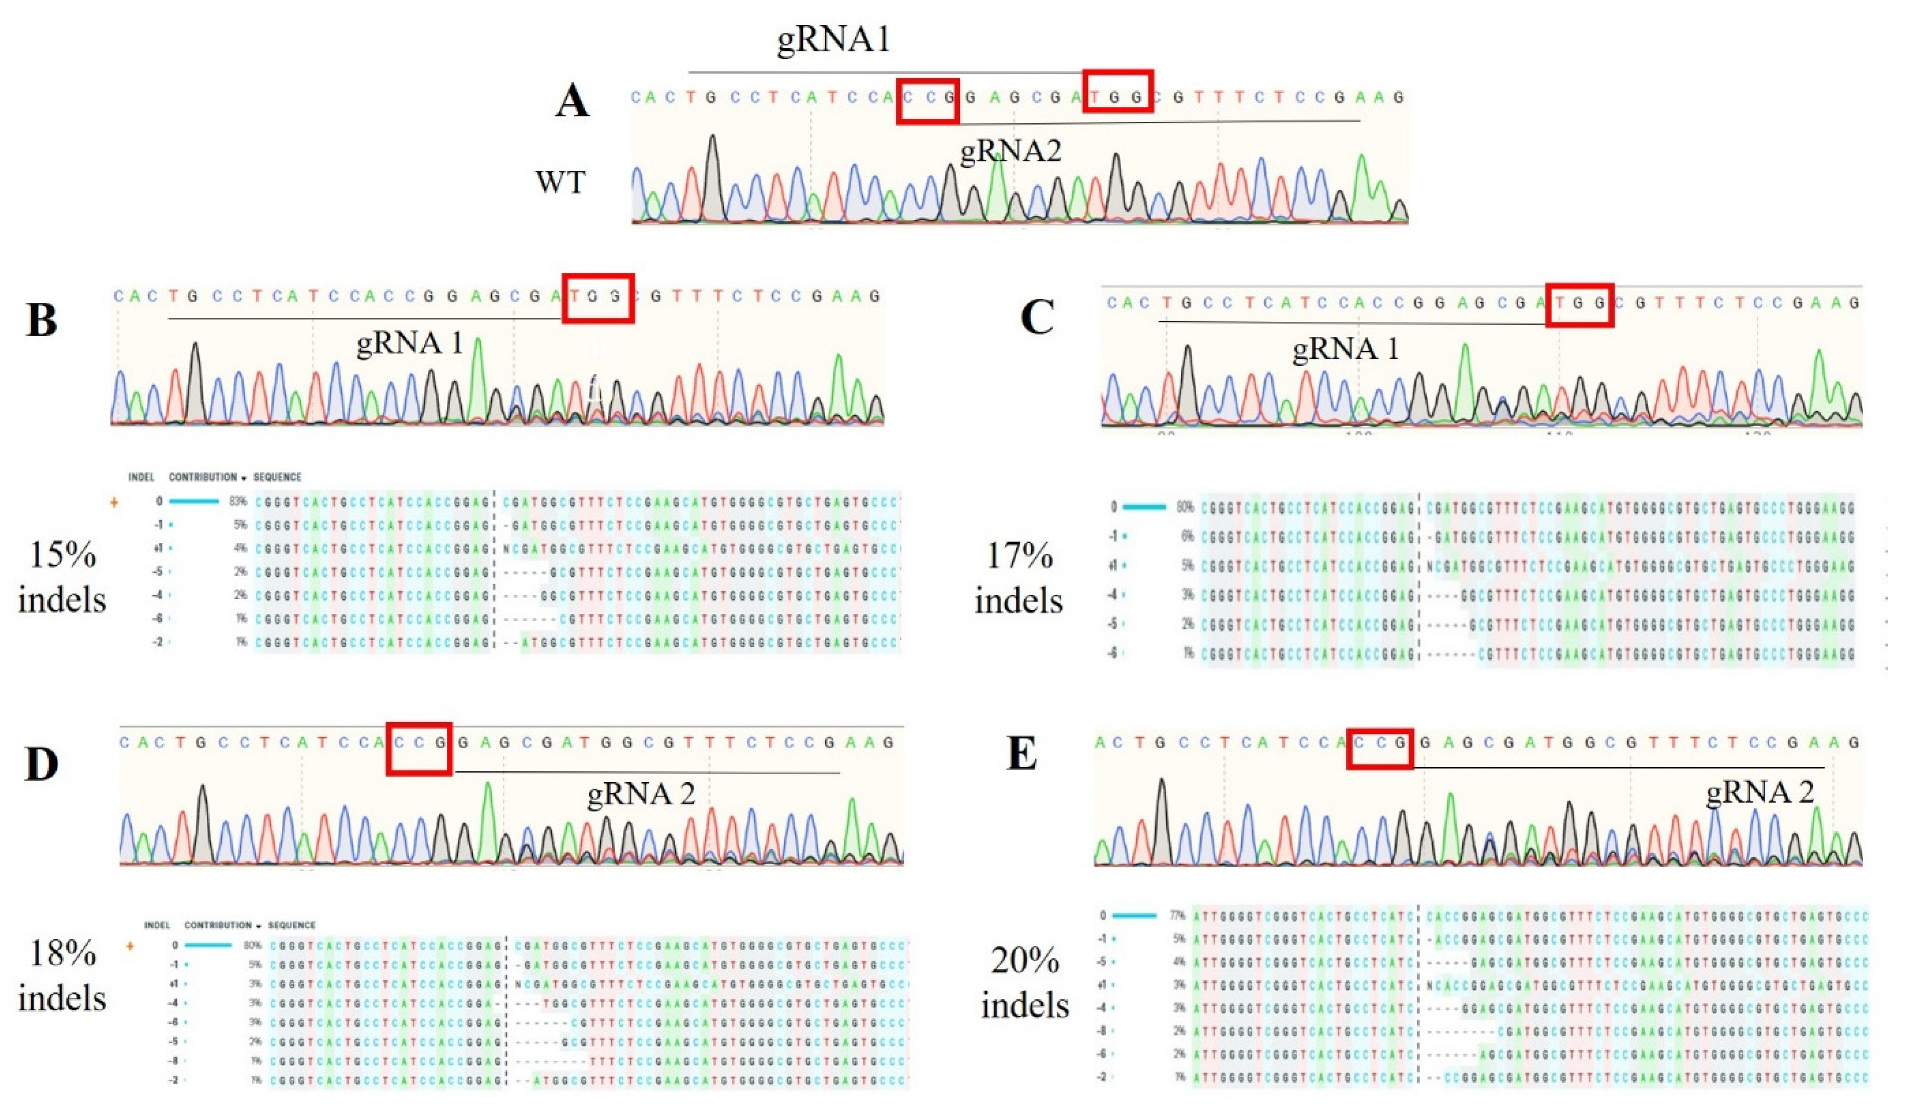
3.2. Editing Efficiency (Cell Pool)
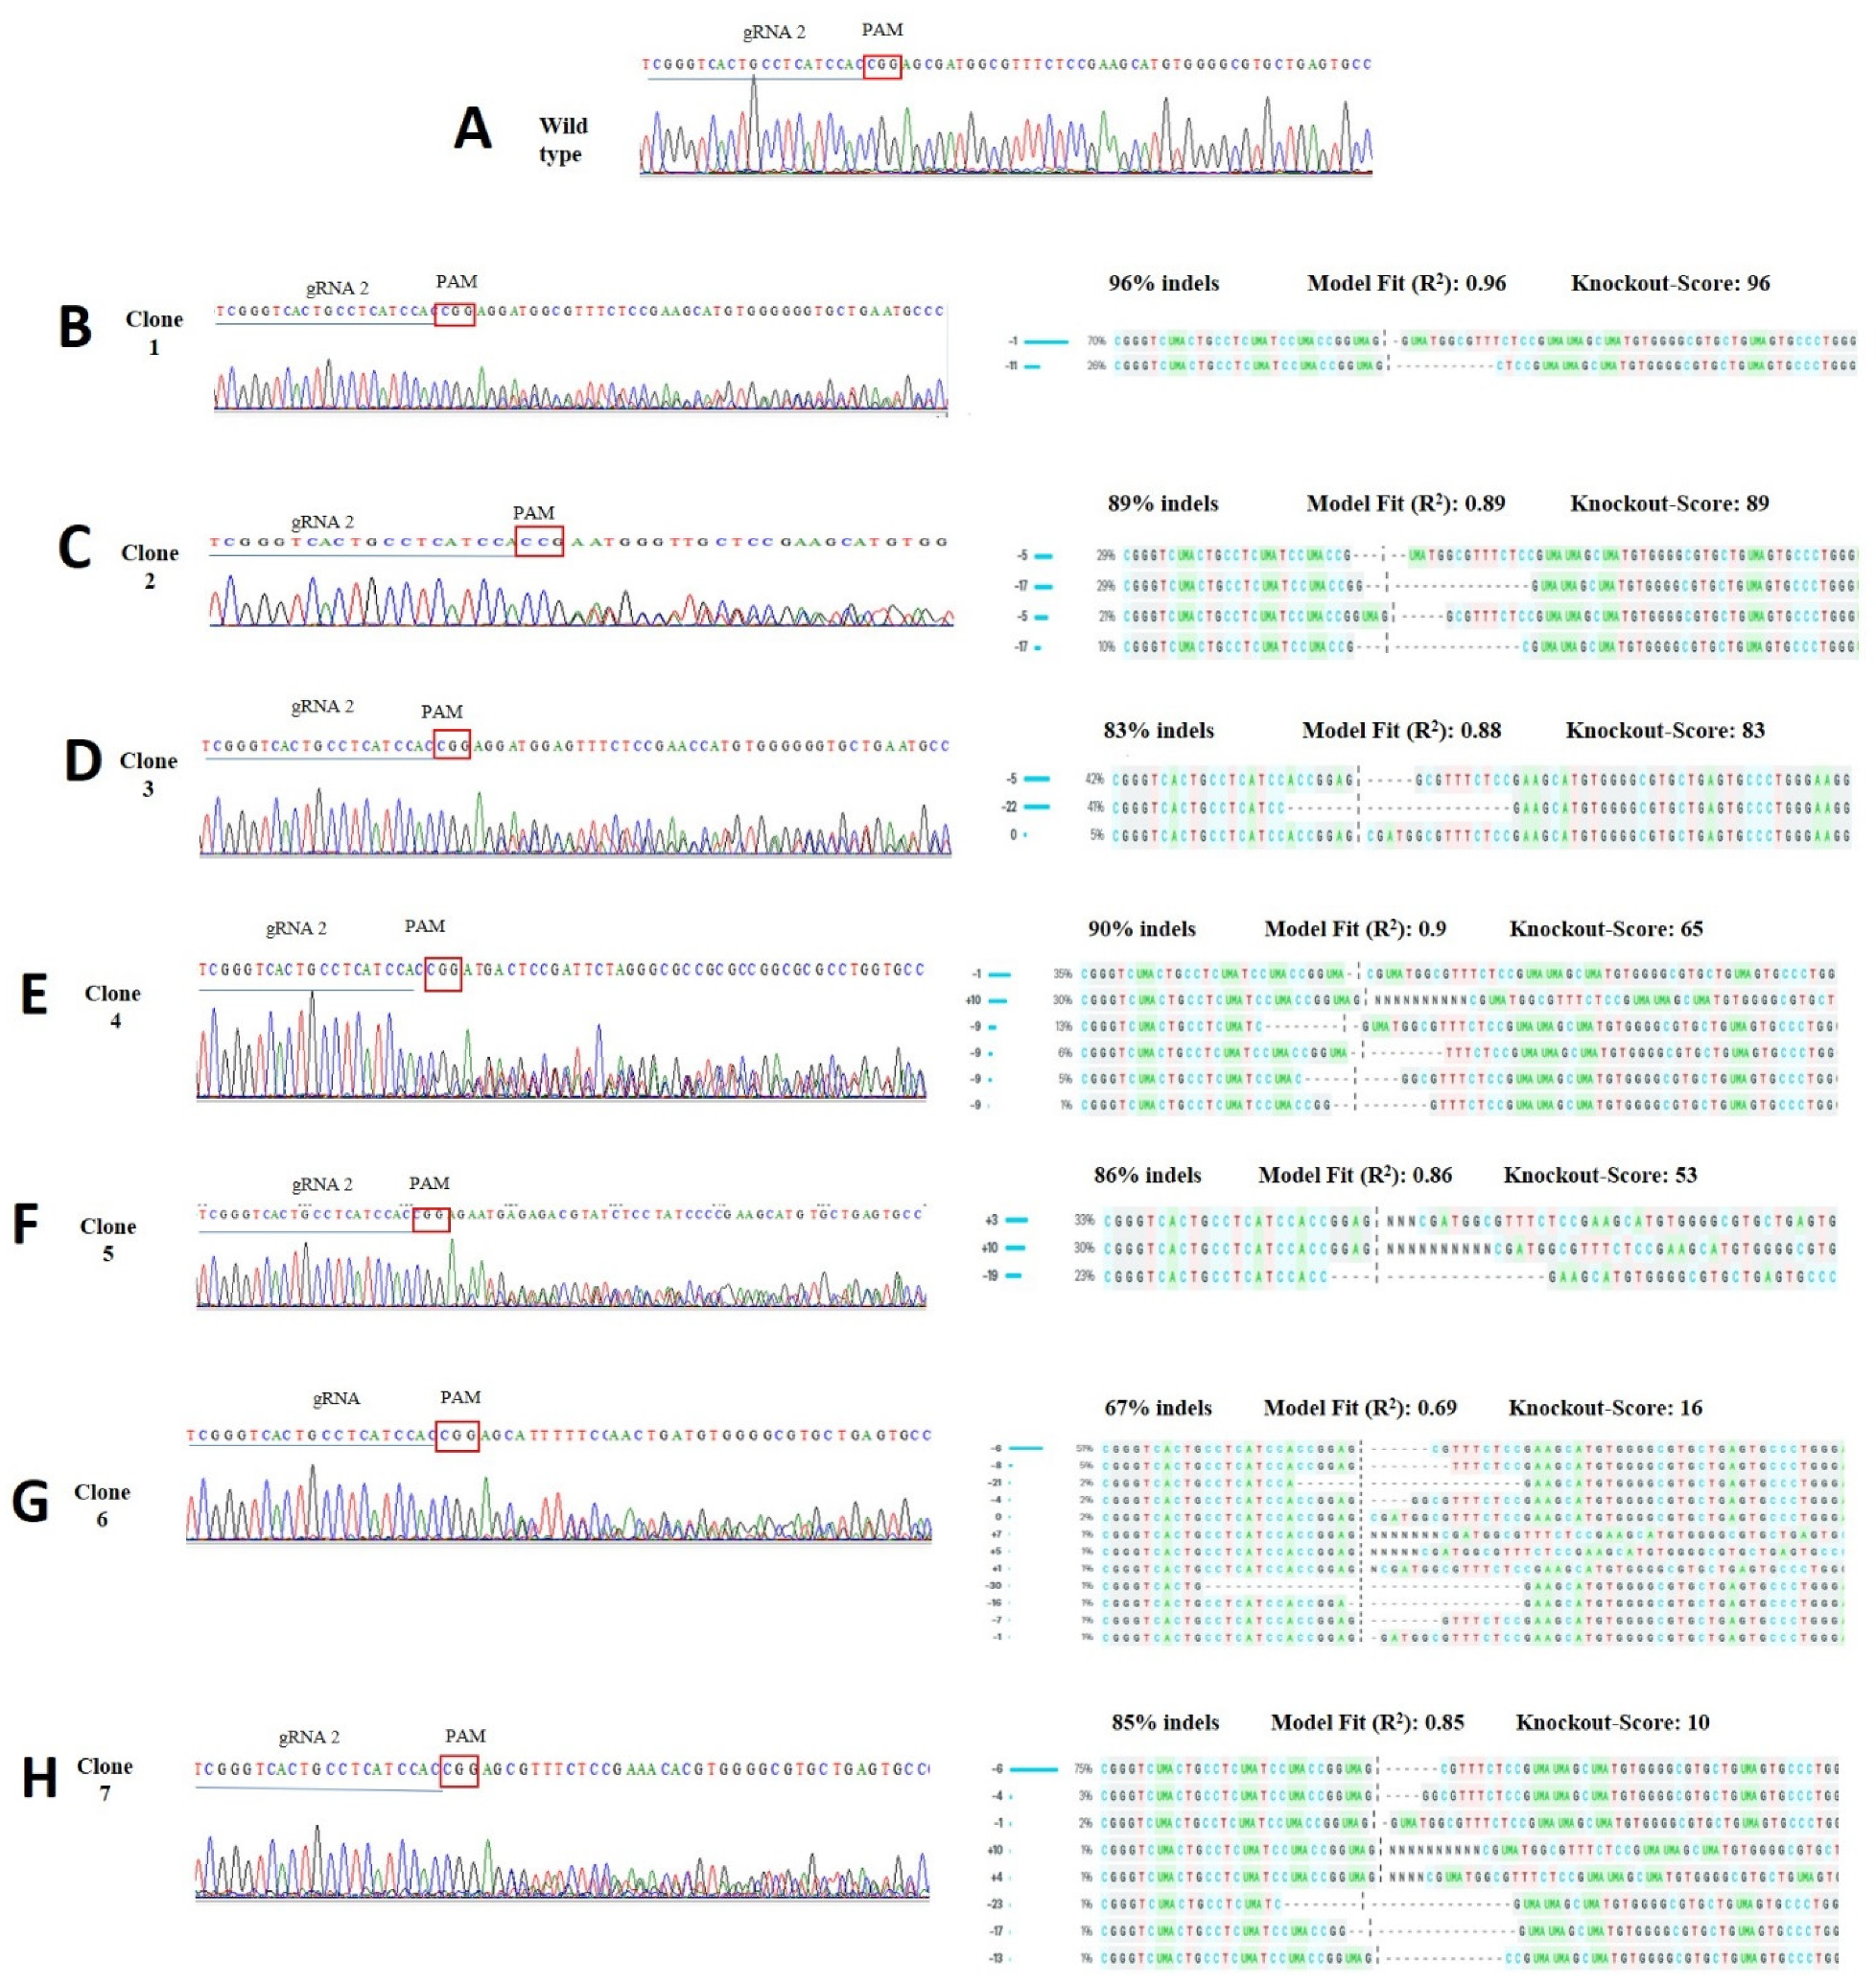
3.3. Clonal Cell Line Efficiency
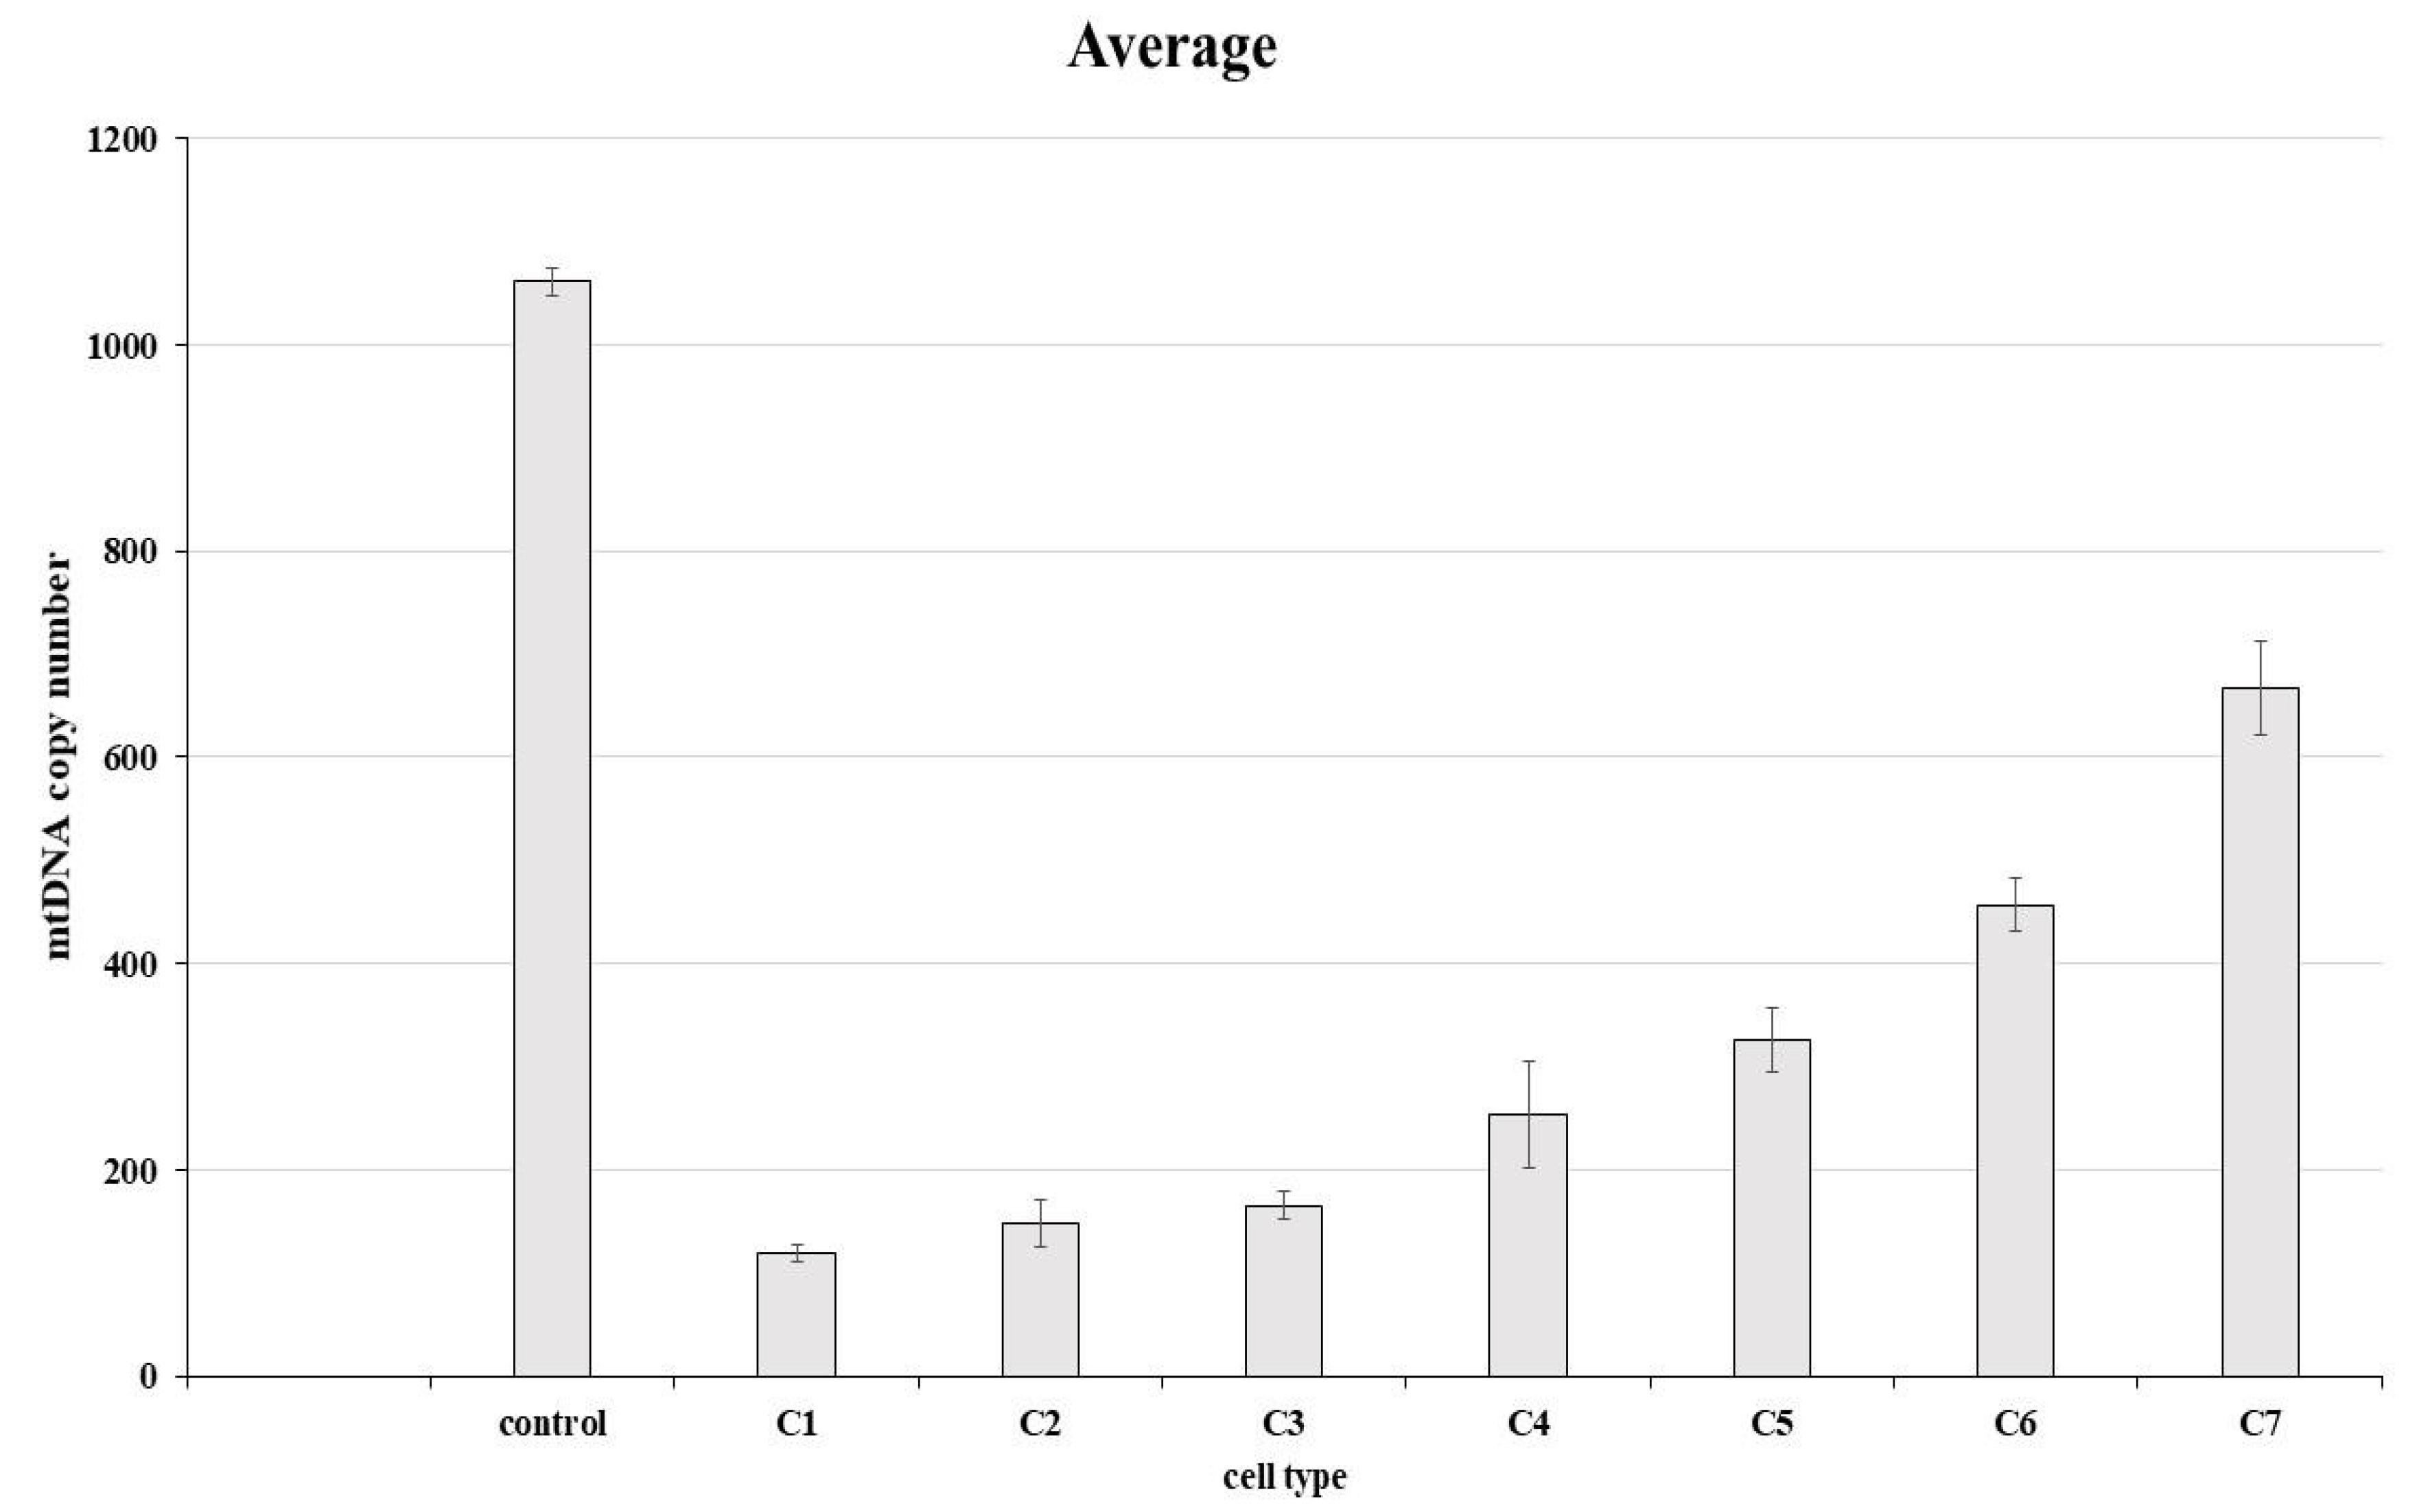
3.4. Determination of mtDNA Copy Number
3.5. Membrane Potential Using the Mitotracker Red Marker
4. Discussion
5. Conclusions
Supplementary Materials
Author Contributions
Funding
Institutional Review Board Statement
Informed Consent Statement
Data Availability Statement
Acknowledgments
Conflicts of Interest
References
- Kang, I.; Chu, C.T.; Kaufman, B.A. The mitochondrial transcription factor TFAM in neurodegeneration: Emerging evidence and mechanisms. FEBS Lett. 2018, 592, 793–811. [Google Scholar] [CrossRef] [Green Version]
- Chen, X.; Li, S.; Ke, Y.; Wu, S.; Huang, T.; Hu, W.; Fu, H.; Guo, X. KLF16 suppresses human glioma cell proliferation and tumourigenicity by targeting TFAM. Artif. Cells Nanomed. Biotechnol. 2018, 46, 608–615. [Google Scholar] [CrossRef] [Green Version]
- Kukat, C.; Larsson, N.-G. mtDNA makes a U-turn for the mitochondrial nucleoid. Trends Cell Biol. 2013, 23, 457–463. [Google Scholar] [CrossRef] [PubMed]
- Chimienti, G.; Picca, A.; Sirago, G.; Fracasso, F.; Calvani, R.; Bernabei, R.; Russo, F.; Carter, C.S.; Leeuwenburgh, C.; Pesce, V.; et al. Increased TFAM binding to mtDNA damage hot spots is associated with mtDNA loss in aged rat heart. Free Radic. Biol. Med. 2018, 124, 447–453. [Google Scholar] [CrossRef]
- Canugovi, C.; Maynard, S.; Bayne, A.-C.V.; Sykora, P.; Tian, J.; de Souza-Pinto, N.C.; Croteau, D.L.; Bohr, V.A. The mitochondrial transcription factor A functions in mitochondrial base excision repair. DNA Repair 2010, 9, 1080–1089. [Google Scholar] [CrossRef] [PubMed] [Green Version]
- May-Panloup, P.; Vignon, X.; Chrétien, M.-F.; Heyman, Y.; Tamassia, M.; Malthièry, Y.; Reynier, P. Increase of mitochondrial DNA content and transcripts in early bovine embryogenesis associated with upregulation of mtTFA and NRF1 transcription factors. Reprod. Biol. Endocrinol. 2005, 3, 65. [Google Scholar] [CrossRef] [PubMed] [Green Version]
- Kang, D.; Kim, S.H.; Hamasaki, N. Mitochondrial transcription factor A (TFAM): Roles in maintenance of mtDNA and cellular functions. Mitochondrion 2007, 7, 39–44. [Google Scholar] [CrossRef] [PubMed]
- Ullah, F.; Rauf, W.; Khan, K.; Khan, S.; Bell, K.M.; de Oliveira, V.C.; Tariq, M.; Bakhshalizadeh, S.; Touraine, P.; Katsanis, N.; et al. A recessive variant in TFAM causes mtDNA depletion associated with primary ovarian insufficiency, seizures, intellectual disability and hearing loss. Qual. Life Res. 2021, 140, 1733–1751. [Google Scholar] [CrossRef]
- Taylor, R.W.; Turnbull, D.M. Mitochondrial DNA mutations in human disease. Nat. Rev. Genet. 2005, 6, 389–402. [Google Scholar] [CrossRef] [Green Version]
- Luoma, P.; Melberg, A.; Rinne, J.O.; Kaukonen, J.A.; Nupponen, N.N.; Chalmers, R.M.; Oldfors, A.; Rautakorpi, I.; Peltonen, L.; Majamaa, K.; et al. Parkinsonism, premature menopause, and mitochondrial DNA polymerase γ mutations: Clinical and molecular genetic study. Lancet 2004, 364, 875–882. [Google Scholar] [CrossRef]
- Zhunina, O.A.; Yabbarov, N.G.; Grechko, A.V.; Starodubova, A.V.; Ivanova, E.; Nikiforov, N.G.; Orekhov, A.N. The Role of Mitochondrial Dysfunction in Vascular Disease, Tumorigenesis, and Diabetes. Front. Mol. Biosci. 2021, 8, 671908. [Google Scholar] [CrossRef]
- Otten, A.B.C.; Kamps, R.; Lindsey, P.; Gerards, M.; Pendeville-Samain, H.; Muller, M.; van Tienen, F.H.J.; Smeets, H.J.M. Tfam Knockdown Results in Reduction of mtDNA Copy Number, OXPHOS Deficiency and Abnormalities in Zebrafish Embryos. Front. Cell Dev. Biol. 2020, 8, 381. [Google Scholar] [CrossRef] [PubMed]
- Stiles, A.R.; Simon, M.; Stover, A.; Eftekharian, S.; Khanlou, N.; Wang, H.L.; Magaki, S.; Lee, H.; Partynski, K.; Dorrani, N.; et al. Mutations in TFAM, encoding mitochondrial transcription factor A, cause neonatal liver failure associated with mtDNA depletion. Mol. Genet. Metab. 2016, 119, 91–99. [Google Scholar] [CrossRef]
- Tucker, E.J.; Rius, R.; Jaillard, S.; Bell, K.; Lamont, P.J.; Travessa, A.; Dupont, J.; Sampaio, L.; Dulon, J.; Vuillaumier-Barrot, S.; et al. Genomic sequencing highlights the diverse molecular causes of Perrault syndrome: A peroxisomal disorder (PEX6), metabolic disorders (CLPP, GGPS1), and mtDNA maintenance/translation disorders (LARS2, TFAM). Qual. Life Res. 2020, 139, 1325–1343. [Google Scholar] [CrossRef]
- Larsson, N.-G.; Wang, J.; Wilhelmsson, H.; Oldfors, A.; Rustin, P.; Lewandoski, M.; Barsh, G.S.; Clayton, D.A. Mitochondrial transcription factor A is necessary for mtDNA maintance and embryogenesis in mice. Nat. Genet. 1998, 18, 231–236. [Google Scholar] [CrossRef]
- De Oliveira, V.C.; Moreira, G.S.A.; Bressan, F.F.; Junior, C.G.M.; Roballo, K.; Charpentier, M.; Concordet, J.-P.; Meirelles, F.; Ambrósio, C.E. Edition of TFAM gene by CRISPR/Cas9 technology in bovine model. PLoS ONE 2019, 14, e0213376. [Google Scholar] [CrossRef]
- De Oliveira, V.C.; Junior, C.G.M.; Belizário, J.E.; Krieger, J.E.; Bressan, F.F.; Roballo, K.C.S.; Fantinato-Neto, P.; Meirelles, F.V.; Chiaratti, M.R.; Concordet, J.-P.; et al. Characterization of post-edited cells modified in the TFAM gene by CRISPR/Cas9 technology in the bovine model. PLoS ONE 2020, 15, e0235856. [Google Scholar] [CrossRef] [PubMed]
- Agudelo, D.; Duringer, A.; Bozoyan, L.; Huard, C.; Carter, S.; Loehr, J.; Synodinou, D.; Drouin, M.; Salsman, J.; Dellaire, G.; et al. Marker-free coselection for CRISPR-driven genome editing in human cells. Nat. Methods 2017, 14, 615–620. [Google Scholar] [CrossRef] [PubMed]
- Hsiau, T.; Maures, T.; Waite, K.; Yang, J.; Kelso, R.; Holden, K.; Stoner, R. Inference of CRISPR Edits from Sanger trace data. Biorxiv 2018, 251082. [Google Scholar] [CrossRef]
- Jin, J.; Xu, Y.; Huo, L.; Ma, L.; Scott, A.W.; Pizzi, M.P.; Li, Y.; Wang, Y.; Yao, X.; Song, S.; et al. An improved strategy for CRISPR/Cas9 gene knockout and subsequent wildtype and mutant gene rescue. PLoS ONE 2020, 15, e0228910. [Google Scholar] [CrossRef]
- Nicklas, J.A.; Brooks, E.M.; Hunter, T.C.; Single, R.; Branda, R.F. Development of a quantitative PCR (TaqMan) assay for relative mitochondrial DNA copy number and the common mitochondrial DNA deletion in the rat. Environ. Mol. Mutagenesis 2004, 44, 313–320. [Google Scholar] [CrossRef]
- Macabelli, C.H. Derivação de células tronco pluripotentes induzidas a partir de pacientes com doenças mitocondriais como modelo de estudo da herança mitocondrial. Dissertação de mestrado Programa de Pós-Graduação em Genética Evolutiva e Biologia Molecular do Centro de Ciências Biológicas e da Saúde da Universidade Federal de São Carlos. Master’s Thesis, Universidade Federal de São Carlos, São Carlos, Portugal, 2015. [Google Scholar]
- Chiaratti, M.R.; Macabelli, C.H.; Neto, J.D.A.; Grejo, M.P.; Pandey, A.K.; Perecin, F.; Del Collado, M. Maternal transmission of mitochondrial diseases. Genet. Mol. Biol. 2020, 43, e20190095. [Google Scholar] [CrossRef] [PubMed]
- Ryzhkova, A.I.; Sazonova, A.M.; Sinyov, V.V.; Galitsyna, E.V.; Chicheva, M.M.; Melnichenko, A.; Grechko, A.; Postnov, A.; Orekhov, A.N.; Shkurat, T.P. Mitochondrial diseases caused by mtDNA mutations: A mini-review. Ther. Clin. Risk Manag. 2018, 14, 1933–1942. [Google Scholar] [CrossRef] [PubMed] [Green Version]
- Ngo, H.B.; Lovely, G.A.; Phillips, R.; Chan, D.C. Distinct structural features of TFAM drive mitochondrial DNA packaging versus transcriptional activation. Nat. Commun. 2014, 5, 3077. [Google Scholar] [CrossRef] [PubMed] [Green Version]
- Filograna, R.; Mennuni, M.; Alsina, D.; Larsson, N. Mitochondrial DNA copy number in human disease: The more the better? FEBS Lett. 2020, 595, 976–1002. [Google Scholar] [CrossRef]
- Ekstrand, M.; Falkenberg, M.; Rantanen, A.; Park, C.B.; Gaspari, M.; Hultenby, K.; Rustin, P.; Gustafsson, C.M.; Larsson, N.-G. Mitochondrial transcription factor A regulates mtDNA copy number in mammals. Hum. Mol. Genet. 2004, 13, 935–944. [Google Scholar] [CrossRef]
- Vernochet, C.; Mourier, A.; Bezy, O.; Macotela, Y.; Boucher, J.; Rardin, M.J.; An, D.; Lee, K.; Ilkayeva, O.R.; Zingaretti, C.M.; et al. Adipose-Specific Deletion of TFAM Increases Mitochondrial Oxidation and Protects Mice against Obesity and Insulin Resistance. Cell Metab. 2012, 16, 765–776. [Google Scholar] [CrossRef] [PubMed] [Green Version]
- Grünewald, A.; Rygiel, K.A.; Msc, P.D.H.; Morris, C.M.; Picard, M.; Turnbull, D.M. Mitochondrial DNA Depletion in Respiratory Chain–Deficient P arkinson Disease Neurons. Ann. Neurol. 2015, 79, 366–378. [Google Scholar] [CrossRef] [PubMed] [Green Version]
- Jiang, M.; Kauppila, T.E.S.; Motori, E.; Li, X.; Atanassov, I.; Folz-Donahue, K.; Bonekamp, N.A.; Albarran-Gutierrez, S.; Stewart, J.; Larsson, N.-G. Increased Total mtDNA Copy Number Cures Male Infertility Despite Unaltered mtDNA Mutation Load. Cell Metab. 2017, 26, 429–436. [Google Scholar] [CrossRef]
- Matsushima, Y.; Goto, Y.-I.; Kaguni, L.S. Mitochondrial Lon protease regulates mitochondrial DNA copy number and transcription by selective degradation of mitochondrial transcription factor A (TFAM). Proc. Natl. Acad. Sci. USA 2010, 107, 18410–18415. [Google Scholar] [CrossRef] [Green Version]
- Lu, B.; Lee, J.; Nie, X.; Li, M.; Morozov, Y.I.; Venkatesh, S.; Bogenhagen, D.F.; Temiakov, D.; Suzuki, C.K. Phosphorylation of Human TFAM in Mitochondria Impairs DNA Binding and Promotes Degradation by the AAA+ Lon Protease. Mol. Cell 2013, 49, 121–132. [Google Scholar] [CrossRef] [Green Version]
- Chakrabarty, S.; D’Souza, R.R.; Kabekkodu, S.P.; Gopinath, P.M.; Rossignol, R.; Satyamoorthy, K. Upregulation of TFAM and mitochondria copy number in human lymphoblastoid cells. Mitochondrion 2014, 15, 52–58. [Google Scholar] [CrossRef]
- Araujo, L.F.; Siena, A.D.D.; Plaça, J.R.; Brotto, D.B.; Barros, I.I.; Muys, B.; Jr, W.A.S.; Peronni, K.C.; Sousa, J.D.F.; Molfetta, G.A.; et al. Mitochondrial transcription factor A (TFAM) shapes metabolic and invasion gene signatures in melanoma. Sci. Rep. 2018, 8, 14190. [Google Scholar] [CrossRef]
- Guha, M.; Srinivasan, S.P.; Ruthel, G.; Kashina, A.K.; Carstens, R.P.; Mendoza, A.; Khanna, C.; Van Winkle, T.; Avadhani, N.G. Mitochondrial retrograde signaling induces epithelial–mesenchymal transition and generates breast cancer stem cells. Oncogene 2013, 33, 5238–5250. [Google Scholar] [CrossRef] [PubMed] [Green Version]
- Lee, W.R.; Na, H.; Lee, S.W.; Lim, W.-J.; Kim, N.; Lee, J.E.; Kang, C. Transcriptomic analysis of mitochondrial TFAM depletion changing cell morphology and proliferation. Sci. Rep. 2017, 7, 17841. [Google Scholar] [CrossRef] [Green Version]
- Castellani, C.A.; Longchamps, R.J.; Sumpter, J.A.; Newcomb, C.E.; Lane, J.A.; Grove, M.L.; Bressler, J.; Brody, J.A.; Floyd, J.S.; Bartz, T.M.; et al. Mitochondrial DNA copy number can influence mortality and cardiovascular disease via methylation of nuclear DNA CpGs. Genome Med. 2020, 12, 84. [Google Scholar] [CrossRef] [PubMed]
- Dong, Z.; Pu, L.; Cui, H. Mitoepigenetics and Its Emerging Roles in Cancer. Front. Cell Dev. Biol. 2020, 8, 4. [Google Scholar] [CrossRef] [PubMed] [Green Version]
- Bonekamp, N.A.; Larsson, N.-G. SnapShot: Mitochondrial Nucleoid. Cell 2018, 172, 388. [Google Scholar] [CrossRef]
- Mei, H.; Sun, S.; Bai, Y.; Chen, Y.; Chai, R.; Li, H. Reduced mtDNA copy number increases the sensitivity of tumor cells to chemotherapeutic drugs. Cell Death Dis. 2015, 6, e1710. [Google Scholar] [CrossRef] [PubMed] [Green Version]
- Desdín-Micó, G.; Soto-Heredero, G.; Aranda, J.F.; Oller, J.; Carrasco, E.; Gabandé-Rodríguez, E.; Blanco, E.M.; Alfranca, A.; Cussó, L.; Desco, M.; et al. T cells with dysfunctional mitochondria induce multimorbidity and premature senescence. Science 2020, 368, 1371–1376. [Google Scholar] [CrossRef]
- Castellani, C.A.; Longchamps, R.J.; Sun, J.; Guallar, E.; Arking, D.E. Thinking outside the nucleus: Mitochondrial DNA copy number in health and disease. Mitochondrion 2020, 53, 214–223. [Google Scholar] [CrossRef] [PubMed]
- Billon, P.; Bryant, E.E.; Joseph, S.A.; Nambiar, T.S.; Hayward, S.B.; Rothstein, R.; Ciccia, A. CRISPR-Mediated Base Editing Enables Efficient Disruption of Eukaryotic Genes through Induction of STOP Codons. Mol. Cell 2017, 67, 1068–1079. [Google Scholar] [CrossRef] [PubMed] [Green Version]
- Liu, J.-T.; Corbett, J.L.; Heslop, J.; Duncan, S.A. Enhanced genome editing in human iPSCs with CRISPR-CAS9 by co-targetingATP1a1. PeerJ 2020, 8, e9060. [Google Scholar] [CrossRef] [PubMed]
- Cottet-Rousselle, C.; Ronot, X.; Leverve, X.; Mayol, J.-F. Cytometric assessment of mitochondria using fluorescent probes. Cytom. Part A 2011, 79A, 405–425. [Google Scholar] [CrossRef]
- Jo, A.; Ham, S.; Lee, G.H.; Lee, Y.-I.; Kim, S.; Shin, J.-H.; Lee, Y. Efficient Mitochondrial Genome Editing by CRISPR/Cas9. BioMed Res. Int. 2015, 2015, 305716. [Google Scholar] [CrossRef] [PubMed] [Green Version]
- Zou, J.; Yue, F.; Jiang, X.; Li, W.; Yi, J.; Liu, L. Mitochondrion-associated protein LRPPRC suppresses the initiation of basal levels of autophagy via enhancing Bcl-2 stability. Biochem. J. 2013, 454, 447–457. [Google Scholar] [CrossRef]


| Target Gene | Primer | Sequence (5′–3′) | Product Size |
|---|---|---|---|
| TFAM | TFAM-f | CCATAGTGCCTCGCTAGTGG | 304 bp |
| TFAM-r | CTACATTCCAACCCCGGGAC |
| Target Gene | Primer | Sequence (5′–3′) | Product Size |
|---|---|---|---|
| B2M | B2M-f | GGCACCCAGCACAATGAAGA | 86 bp |
| B2M-r | GCCAATCCACACGGAGTACTT | ||
| Mt-RNA | MtRNA-f | GCCCTAGAACAGGGCTTAGT | 94 bp |
| MtRNA-r | GGAGAGGATTTGAATCTCTGG |
| Cell Line | mtDNA Copy Number | % Relative to Control |
|---|---|---|
| Control (non-edited) | 1061.183333 | 100 |
| clone 1 | 118.5933333 | 11.17557444 |
| clone 2 | 147.9566667 | 13.94261124 |
| clone 3 | 165.53 | 15.59862418 |
| clone 4 | 253.5433333 | 23.89250993 |
| clone 5 | 325.7766667 | 30.69937648 |
| clone 6 | 457.16 | 43.0802092 |
| clone 7 | 668.0666667 | 62.95487742 |
Publisher’s Note: MDPI stays neutral with regard to jurisdictional claims in published maps and institutional affiliations. |
© 2021 by the authors. Licensee MDPI, Basel, Switzerland. This article is an open access article distributed under the terms and conditions of the Creative Commons Attribution (CC BY) license (https://creativecommons.org/licenses/by/4.0/).
Share and Cite
de Oliveira, V.C.; Santos Roballo, K.C.; Mariano Junior, C.G.; Santos, S.I.P.; Bressan, F.F.; Chiaratti, M.R.; Tucker, E.J.; Davis, E.E.; Concordet, J.-P.; Ambrósio, C.E. HEK293T Cells with TFAM Disruption by CRISPR-Cas9 as a Model for Mitochondrial Regulation. Life 2022, 12, 22. https://doi.org/10.3390/life12010022
de Oliveira VC, Santos Roballo KC, Mariano Junior CG, Santos SIP, Bressan FF, Chiaratti MR, Tucker EJ, Davis EE, Concordet J-P, Ambrósio CE. HEK293T Cells with TFAM Disruption by CRISPR-Cas9 as a Model for Mitochondrial Regulation. Life. 2022; 12(1):22. https://doi.org/10.3390/life12010022
Chicago/Turabian Stylede Oliveira, Vanessa Cristina, Kelly Cristine Santos Roballo, Clésio Gomes Mariano Junior, Sarah Ingrid Pinto Santos, Fabiana Fernandes Bressan, Marcos Roberto Chiaratti, Elena J. Tucker, Erica E. Davis, Jean-Paul Concordet, and Carlos Eduardo Ambrósio. 2022. "HEK293T Cells with TFAM Disruption by CRISPR-Cas9 as a Model for Mitochondrial Regulation" Life 12, no. 1: 22. https://doi.org/10.3390/life12010022
APA Stylede Oliveira, V. C., Santos Roballo, K. C., Mariano Junior, C. G., Santos, S. I. P., Bressan, F. F., Chiaratti, M. R., Tucker, E. J., Davis, E. E., Concordet, J.-P., & Ambrósio, C. E. (2022). HEK293T Cells with TFAM Disruption by CRISPR-Cas9 as a Model for Mitochondrial Regulation. Life, 12(1), 22. https://doi.org/10.3390/life12010022