
Steroidal Saponins Isolated from the Rhizome of Dioscorea tokoro Inhibit Cell Growth and Autophagy in Hepatocellular Carcinoma Cells

Abstract
1. Introduction
2. Materials and Methods
2.1. General Procedures
2.2. Extraction and Isolation
2.3. Acid Hydrolyses
2.4. Reagents for Bioassays
2.5. Cell Culture and Treatment
2.6. Determination of Cell Viability
2.7. Western Blot Analysis
2.8. Statistical Analysis
3. Results
3.1. Comparison of Antiproliferative Effects of Each Fraction
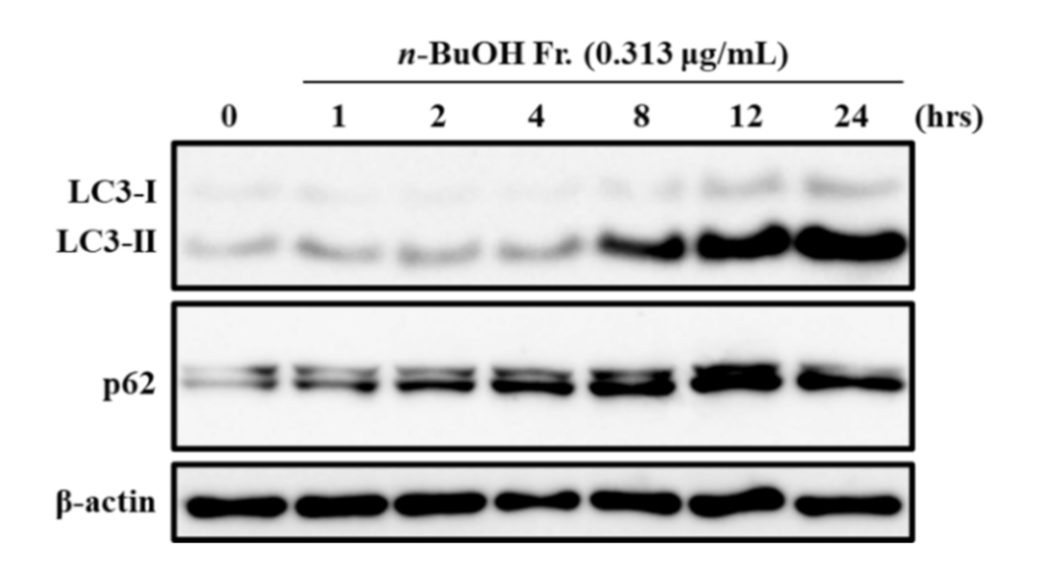
3.2. Effect of the n-BuOH Fraction on Autophagosome Formation and Autophagy Flux
3.3. Isolation, Acid Hydrolyses, and Structural Identification of 1–5
3.4. Effects of 1–5 on Cell Proliferation, and their Structure–activity Relationships
3.5. Effects of 1–5 on Autophagosome Formation and Autophagy Flux
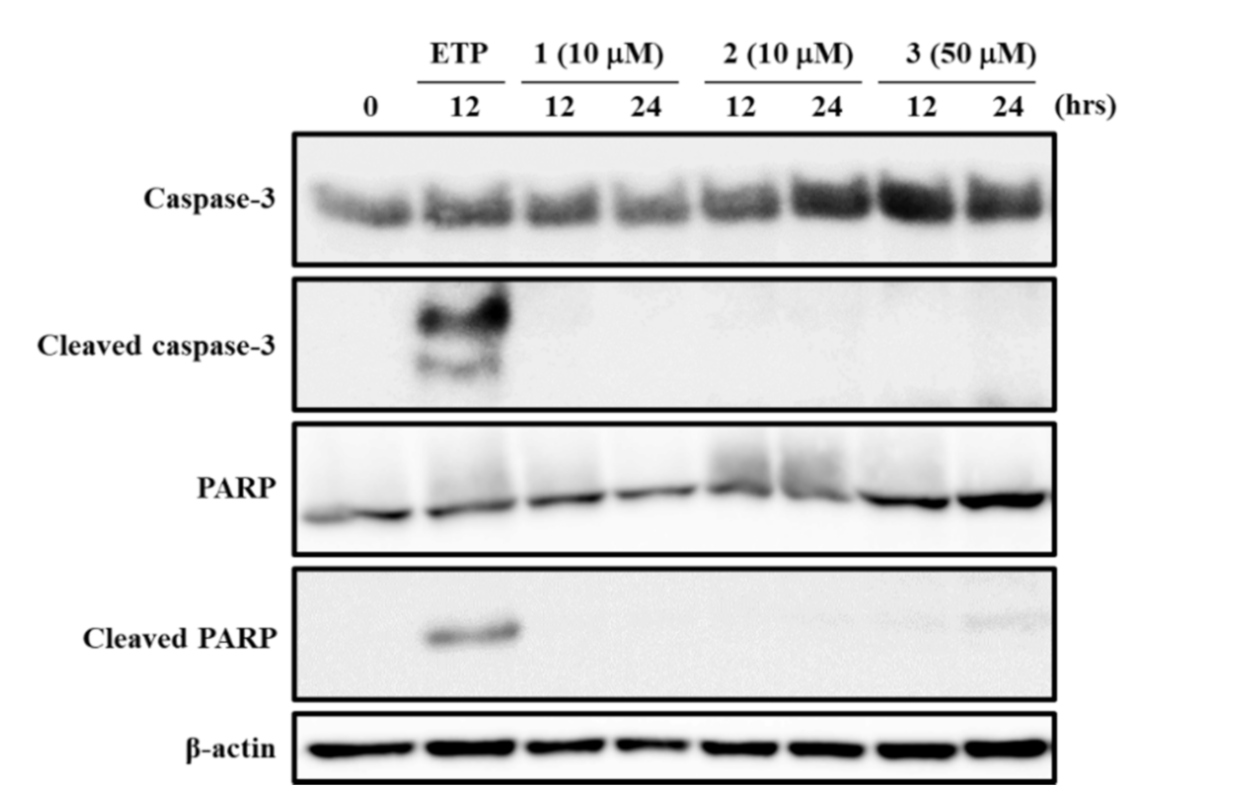
3.6. Effects of 1–3 on Apoptosis-Related proteins
4. Discussion
5. Conclusions
Supplementary Materials
Author Contributions
Funding
Institutional Review Board Statement
Informed Consent Statement
Data Availability Statement
Conflicts of Interest
References
- Rabinowitz, J.D.; White, E. Autophagy and metabolism. Science 2010, 330, 1344–1348. [Google Scholar] [CrossRef]
- Choi, A.M.K.; Ryter, S.W.; Levine, B. Autophagy in human health and disease. N. Engl. J. Med. 2013, 368, 651–662. [Google Scholar] [CrossRef]
- Lassen, K.G.; Xavier, R.J. Mechanisms and function of autophagy in intestinal disease. Autophagy 2018, 14, 216–220. [Google Scholar] [CrossRef]
- Ueno, T.; Komatsu, M. Autophagy in the liver: Functions in health and disease. Nat. Rev. Gastroenterol. Hepatol. 2017, 14, 170–184. [Google Scholar] [CrossRef]
- Yoshii, S.R.; Mizushima, N. Monitoring and Measuring Autophagy. Int. J. Mol. Sci. 2017, 18, 1865. [Google Scholar] [CrossRef]
- Lamark, T.; Svenning, S.; Johansen, T. Regulation of selective autophagy: The p62/SQSTM1 paradigm. Essays Biochem. 2017, 61, 609–624. [Google Scholar]
- Kabeya, Y.; Mizushima, N.; Ueno, T.; Yamamoto, A.; Kirisako, T.; Noda, T.; Kominami, E.; Ohsumi, Y.; Yoshimori, T. LC3, a mammalian homologue of yeast Apg8p, is localized in autophagosome membranes after processing. EMBO J. 2000, 19, 5720–5728. [Google Scholar] [CrossRef]
- Pankiv, S.; Clausen, T.H.; Lamark, T.; Brech, A.; Bruun, J.A.; Outzen, H.; Øvervatn, A.; Bjørkøy, G.; Johansen, T. p62/SQSTM1 binds directly to Atg8/LC3 to facilitate degradation of ubiquitinated protein aggregates by autophagy. J. Biol. Chem. 2007, 282, 24131–24145. [Google Scholar] [CrossRef]
- Itakura, E.; Mizushima, N. p62 targeting to the autophagosome formation site requires self-oligomerization but not LC3 binding. J. Cell. Biol. 2011, 192, 17–27. [Google Scholar] [CrossRef]
- Mayurbhai, H.S.; Itakura, E.; Mizushima, N. Expression of the autophagy substrate SQSTM1/p62 is restored during prolonged starvation depending on transcriptional upregulation and autophagy-derived amino acids. Autophagy 2014, 10, 431–441. [Google Scholar]
- Mizushima, N.; Yoshimori, T.; Levine, B. Methods in mammalian autophagy research. Cell 2010, 140, 313–326. [Google Scholar] [CrossRef]
- Degenhardt, K.; Mathew, R.; Beaudoin, B.; Bray, K.; Anderson, D.; Chen, G.; Mukherjee, C.; Shi, Y.; Gélinas, C.; Fan, Y.; et al. Autophagy promotes tumor cell survival and restricts necrosis, inflammation, and tumorigenesis. Cancer Cell 2006, 10, 51–64. [Google Scholar] [CrossRef]
- Turcotte, S.; Chan, D.A.; Sutphin, P.D.; Hay, M.P.; Denny, W.A.; Giaccia, A.J. A molecule targeting VHL-deficient renal cell carcinoma that induces autophagy. Cancer Cell 2008, 14, 90–102. [Google Scholar] [CrossRef]
- Yang, Z.J.; Chee, C.E.; Huang, S.; Sinicrope, F.A. The role of autophagy in cancer: Therapeutic implications. Mol. Cancer Ther. 2011, 10, 1533–1541. [Google Scholar] [CrossRef]
- Marinković, M.; Šprung, M.; Buljubašić, M.; Novak, I. Autophagy modulation in cancer: Current knowledge on action and therapy. Oxid. Med. Cell Longev. 2018, 2018, 8023821. [Google Scholar] [CrossRef]
- Buzun, K.; Gornowicz, A.; Lesyk, R.; Bielawski, K.; Bielawska, A. Autophagy Modulators in cancer therapy. Int. J. Mol. Sci. 2021, 22, 5804. [Google Scholar] [CrossRef]
- Chen, C.; Gao, H.; Su, X. Autophagy-related signaling pathways are involved in cancer. Exp. Ther. Med. 2021, 22. [Google Scholar] [CrossRef] [PubMed]
- Gravitz, L. Liver cancer. Nature 2014, 516. [Google Scholar] [CrossRef]
- Wu, D.H.; Jia, C.C.; Chen, J.; Lin, Z.X.; Ruan, D.Y.; Li, X.; Lin, Q.; Ma, X.K.; Wan, X.B.; Cheng, N.; et al. Autophagic LC3B overexpression correlates with malignant progression and predicts a poor prognosis in hepatocellular carcinoma. Tumour Biol. 2014, 35, 12225–12233. [Google Scholar] [CrossRef] [PubMed]
- Okubo, S.; Komori, H.; Kuwahara, A.; Ohta, T.; Shoyama, Y.; Uto, T. Screening of crude drugs used in Japanese Kampo formulas for autophagy-mediated cell survival of the human hepatocellular carcinoma cell line. Medicines 2019, 6, 63. [Google Scholar] [CrossRef] [PubMed]
- Okubo, S.; Ohta, T.; Shoyama, Y.; Uto, T. Arctigenin suppresses cell proliferation via autophagy inhibition in hepatocellular carcinoma cells. J. Nat. Med. 2020, 74, 525–532. [Google Scholar] [CrossRef]
- Okubo, S.; Ohta, T.; Fujita, H.; Shoyama, Y.; Uto, T. Costunolide and dehydrocostuslactone from Saussurea lappa root inhibit autophagy in hepatocellular carcinoma cells. J. Nat. Med. 2021, 75, 240–245. [Google Scholar] [CrossRef]
- Oyama, M.; Tokiwano, T.; Kawaii, S.; Yoshida, Y.; Mizuno, K.; Oh, K.; Yoshizawa, Y. Protodioscin, isolated from the rhizome of Dioscorea tokoro collected in northern Japan is the major antiproliferative compound to HL-60 leukemic cells. Curr. Bioact. Compd. 2017, 13, 170–174. [Google Scholar] [CrossRef]
- Xu, X.H.; Li, T.; Fong, C.M.; Chen, X.; Chen, X.J.; Wang, Y.T.; Huang, M.Q.; Lu, J.J. Saponins from Chinese medicines as anticancer agents. Molecules 2016, 21, 1326. [Google Scholar] [CrossRef]
- Kim, M.J.; Kim, H.N.; Kang, K.S.; Baek, N.I.; Kim, D.K.; Kim, Y.S.; Jeon, B.H.; Kim, S.H. Methanol extract of Dioscoreae Rhizoma inhibits pro-inflammatory cytokines and mediators in the synoviocytes of rheumatoid arthritis. Int. Immunopharmacol. 2004, 4, 1489–1497. [Google Scholar] [CrossRef]
- Yoshikawa, M.; Xu, F.; Morikawa, T.; Pongpiriyadacha, Y.; Nakamura, S.; Asao, Y.; Kumahara, A.; Matsuda, H. Medicinal flowers. XII.(1) New spirostane-type steroid saponins with antidiabetogenic activity from Borassus flabellifer. Chem. Pharm. Bull. 2007, 55, 308–316. [Google Scholar]
- Nakano, K.; Murakami, K.; Takaishi, Y.; Tomimatsu, T.; Nohara, T. Studies on the constituents of Heloniopsis orientalis (Thunnb.) C. Tanaka. Chem. Pharm. Bull. 1989, 37, 116–118. [Google Scholar] [CrossRef][Green Version]
- Asami, A.; Hirai, Y.; Shoji, J. Studies on the constituents of palmae plants. VI. Steroid saponins and flavonoids of leaves of Phoenix canariensis hort. ex CHABAUD, P. humilis ROYLE var. hanceana BECC., P. dactylifera L., and Licuala spinosa WURMB. Chem. Pharm. Bull. 1991, 39, 2053–2056. [Google Scholar]
- Pires, V.S.; Taketa, A.T.; Gosmann, G.; Schenkel, E.P. Saponins and sapogenins from Brachiaria decumbens Stapf. J. Braz. Chem. Soc. 2002, 13, 135–139. [Google Scholar] [CrossRef]
- Hu, K.; Dong, A.; Yao, X.; Kobayashi, H.; Iwasaki, S. Antineoplastic agents. II. Four furostanol glycosides from rhizomes of Dioscorea collettii var. hypoglauca. Planta Med. 1997, 63, 161–165. [Google Scholar]
- Konishi, T.; Kiyosawa, S.; Shoji, J. Studies on the coloration mechanism of furostanol derivatives with Ehrlich reagent. II. On the reaction of furostanol glycoside with Ehrlich reagent. Chem. Pharm. Bull. 1985, 33, 591–597. [Google Scholar]
- Agrawal, P.K.; Jain, D.C.; Gupta, R.K.; Thakur, R.S. Carbon-13 NMR spectroscopy of steroidal sapogenins and steroidal saponins. Phytochemistry 1985, 24, 2479–2496. [Google Scholar] [CrossRef]
- Ebizuka, Y.; Morita, H.; Abe, I. Chapter 4, terpenoid and steroid. In Chemistry of Organic Natural Products, 3rd ed.; Nankodo Co., Ltd.: Tokyo, Japan, 2016; pp. 161–165. [Google Scholar]
- Sermeus, A.; Cosse, J.P.; Crespin, M.; Mainfroid, V.; de Longueville, F.; Ninane, N.; Raes, M.; Remacle, J.; Michiels, C. Hypoxia induces protection against etoposide-induced apoptosis: Molecular profiling of changes in gene expression and transcription factor activity. Mol. Cancer 2008, 7, 27. [Google Scholar] [CrossRef]
- Xie, B.S.; Zhao, H.C.; Yao, S.K.; Zhuo, D.X.; Jin, B.; Lv, D.C.; Wu, C.L.; Ma, D.L.; Gao, C.; Shu, X.M.; et al. Autophagy inhibition enhances etoposide-induced cell death in human hepatoma G2 cells. Int. J. Mol. Med. 2011, 27, 599–606. [Google Scholar]
- Yu, R.; Zhang, Z.Q.; Wang, B.; Jiang, H.X.; Cheng, L.; Shen, L.M. Berberine-induced apoptotic and autophagic death of HepG2 cells requires AMPK activation. Cancer Cell Int. 2014, 14, 1–8. [Google Scholar] [CrossRef]
- Uto, T.; Tung, N.H.; Ohta, T.; Juengsanguanpornsuk, W.; Hung, L.Q.; Hai, N.T.; Long, D.D.; Thuong, P.T.; Okubo, S.; Hirata, S.; et al. Antiproliferative activity and apoptosis induction by trijuganone C isolated from the root of Salvia miltiorrhiza Bunge (Danshen). Phytother. Res. 2018, 32, 657–666. [Google Scholar] [CrossRef]
- Bishop, E.; Bradshaw, T.D. Autophagy modulation: A prudent approach in cancer treatment? Cancer Chemother. Pharmacol. 2018, 82, 913–922. [Google Scholar] [CrossRef]
- Cynthia, I.C.; Ravi, K.A. Targeting autophagy in cancer: Update on clinical trials and novel inhibitors. Int. J. Mol. Sci. 2017, 18, 1279. [Google Scholar] [CrossRef]
- Rubinsztein, D.C.; Codogno, P.; Levine, B. Autophagy modulation as a potential therapeutic target for diverse diseases. Nat. Rev. Drug Discov. 2012, 11, 709–730. [Google Scholar] [CrossRef]
- Wang, Z.; Cheng, Y.; Wang, N.; Wang, D.M.; Li, Y.W.; Han, F.; Shen, J.G.; Yang, D.P.; Guan, X.Y.; Chen, J.P. Dioscin induces cancer cell apoptosis through elevated oxidative stress mediated by downregulation of peroxiredoxins. Cancer Biol. Ther. 2012, 13, 138–147. [Google Scholar]
- Hu, M.; Xu, L.; Yin, L.; Qi, Y.; Li, H.; Xu, Y.; Han, X.; Peng, J.; Wan, X. Cytotoxicity of dioscin in human gastric carcinoma cells through death receptor and mitochondrial pathways. J. Appl. Toxicol. 2013, 33, 712–722. [Google Scholar] [CrossRef] [PubMed]
- Wang, Y.; He, Q.Y.; Chiu, J.F. Dioscin induced activation of p38 MAPK and JNK via mitochondrial pathway in HL-60 cell line. Eur. J. Pharmacol. 2014, 735, 52–58. [Google Scholar] [CrossRef] [PubMed]
- Chen, H.; Xu, L.; Yin, L.; Xu, Y.; Han, X.; Qi, Y.; Zhao, Y.; Liu, K.; Peng, J. iTRAQ-based proteomic analysis of dioscin on human HCT-116 colon cancer cells. Proteomics 2014, 14, 51–73. [Google Scholar] [CrossRef] [PubMed]
- Zhao, X.; Tao, X.; Xu, L.; Yin, L.; Qi, Y.; Xu, Y.; Han, X.; Peng, J. Dioscin induces apoptosis in human cervical carcinoma HeLa and SiHa cells through ROS-mediated DNA damage and the mitochondrial signaling pathway. Molecules 2016, 21, 730. [Google Scholar] [CrossRef]
- Zhu, C.; Bao, N.; Chen, S.; Zhao, J. Dioscin enhances osteoblastic cell differentiation and proliferation by inhibiting cell autophagy via the ASPP2/NF-κβ pathway. Mol. Med. Rep. 2017, 16, 4922–4926. [Google Scholar] [CrossRef]


Publisher’s Note: MDPI stays neutral with regard to jurisdictional claims in published maps and institutional affiliations. |
© 2021 by the authors. Licensee MDPI, Basel, Switzerland. This article is an open access article distributed under the terms and conditions of the Creative Commons Attribution (CC BY) license (https://creativecommons.org/licenses/by/4.0/).
Share and Cite
Okubo, S.; Ohta, T.; Shoyama, Y.; Uto, T. Steroidal Saponins Isolated from the Rhizome of Dioscorea tokoro Inhibit Cell Growth and Autophagy in Hepatocellular Carcinoma Cells. Life 2021, 11, 749. https://doi.org/10.3390/life11080749
Okubo S, Ohta T, Shoyama Y, Uto T. Steroidal Saponins Isolated from the Rhizome of Dioscorea tokoro Inhibit Cell Growth and Autophagy in Hepatocellular Carcinoma Cells. Life. 2021; 11(8):749. https://doi.org/10.3390/life11080749
Chicago/Turabian StyleOkubo, Shinya, Tomoe Ohta, Yukihiro Shoyama, and Takuhiro Uto. 2021. "Steroidal Saponins Isolated from the Rhizome of Dioscorea tokoro Inhibit Cell Growth and Autophagy in Hepatocellular Carcinoma Cells" Life 11, no. 8: 749. https://doi.org/10.3390/life11080749
APA StyleOkubo, S., Ohta, T., Shoyama, Y., & Uto, T. (2021). Steroidal Saponins Isolated from the Rhizome of Dioscorea tokoro Inhibit Cell Growth and Autophagy in Hepatocellular Carcinoma Cells. Life, 11(8), 749. https://doi.org/10.3390/life11080749