
GLUT-1 Enhances Glycolysis, Oxidative Stress, and Fibroblast Proliferation in Keloid

 , ,
, , 
Abstract
1. Introduction
2. Materials and Methods
2.1. Subjects Involved
2.2. Cell Culture and Treatment
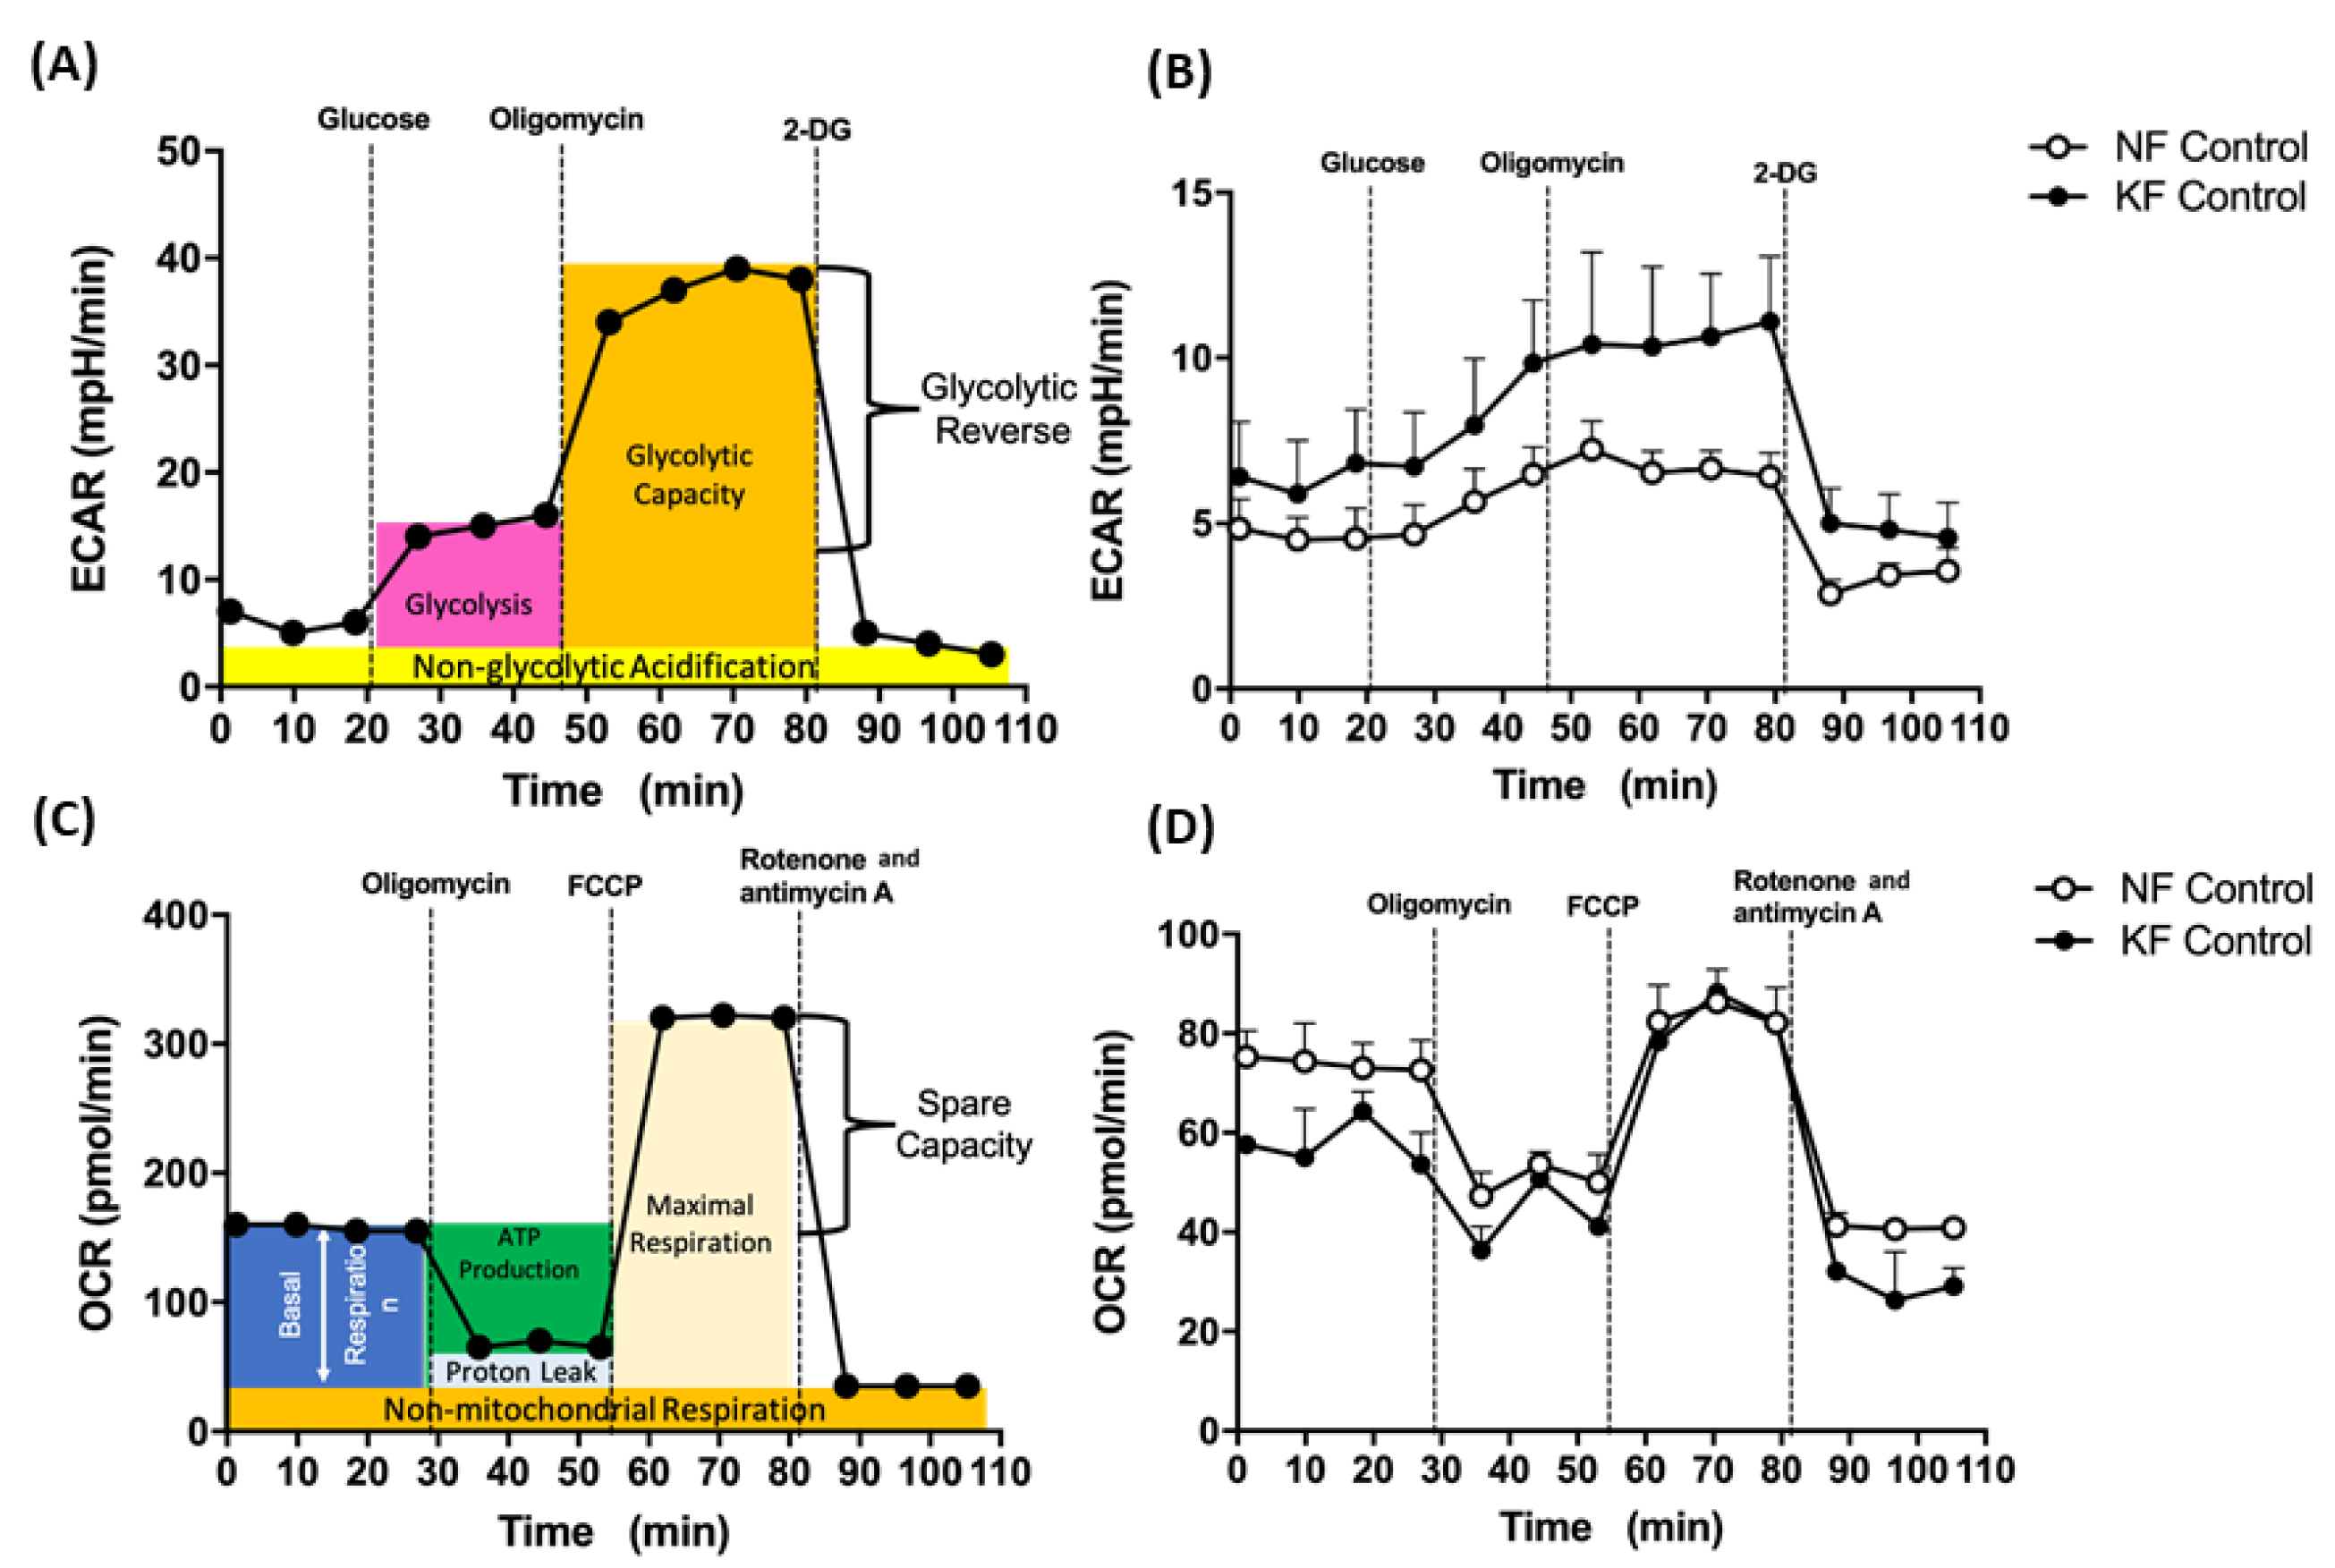
2.3. Seahorse Analysis for OCR and ECAR
2.4. Immunohistochemistry (IHC) for GLUT-1 In Tissue
2.5. Immunofluorescence Assay (IFA) for GLUT-1 and Ki-67 in KFs and NFs
2.6. RNA Extraction, Reverse Transcriptase PCR (RT-PCR), and Quantitative Real Time PCR (qPCR)
2.7. Mitochondrial Superoxide Detection
2.8. Cell Proliferation Assay
2.9. Statistical Analysis
3. Results
3.1. Enhanced Glycolysis in KF
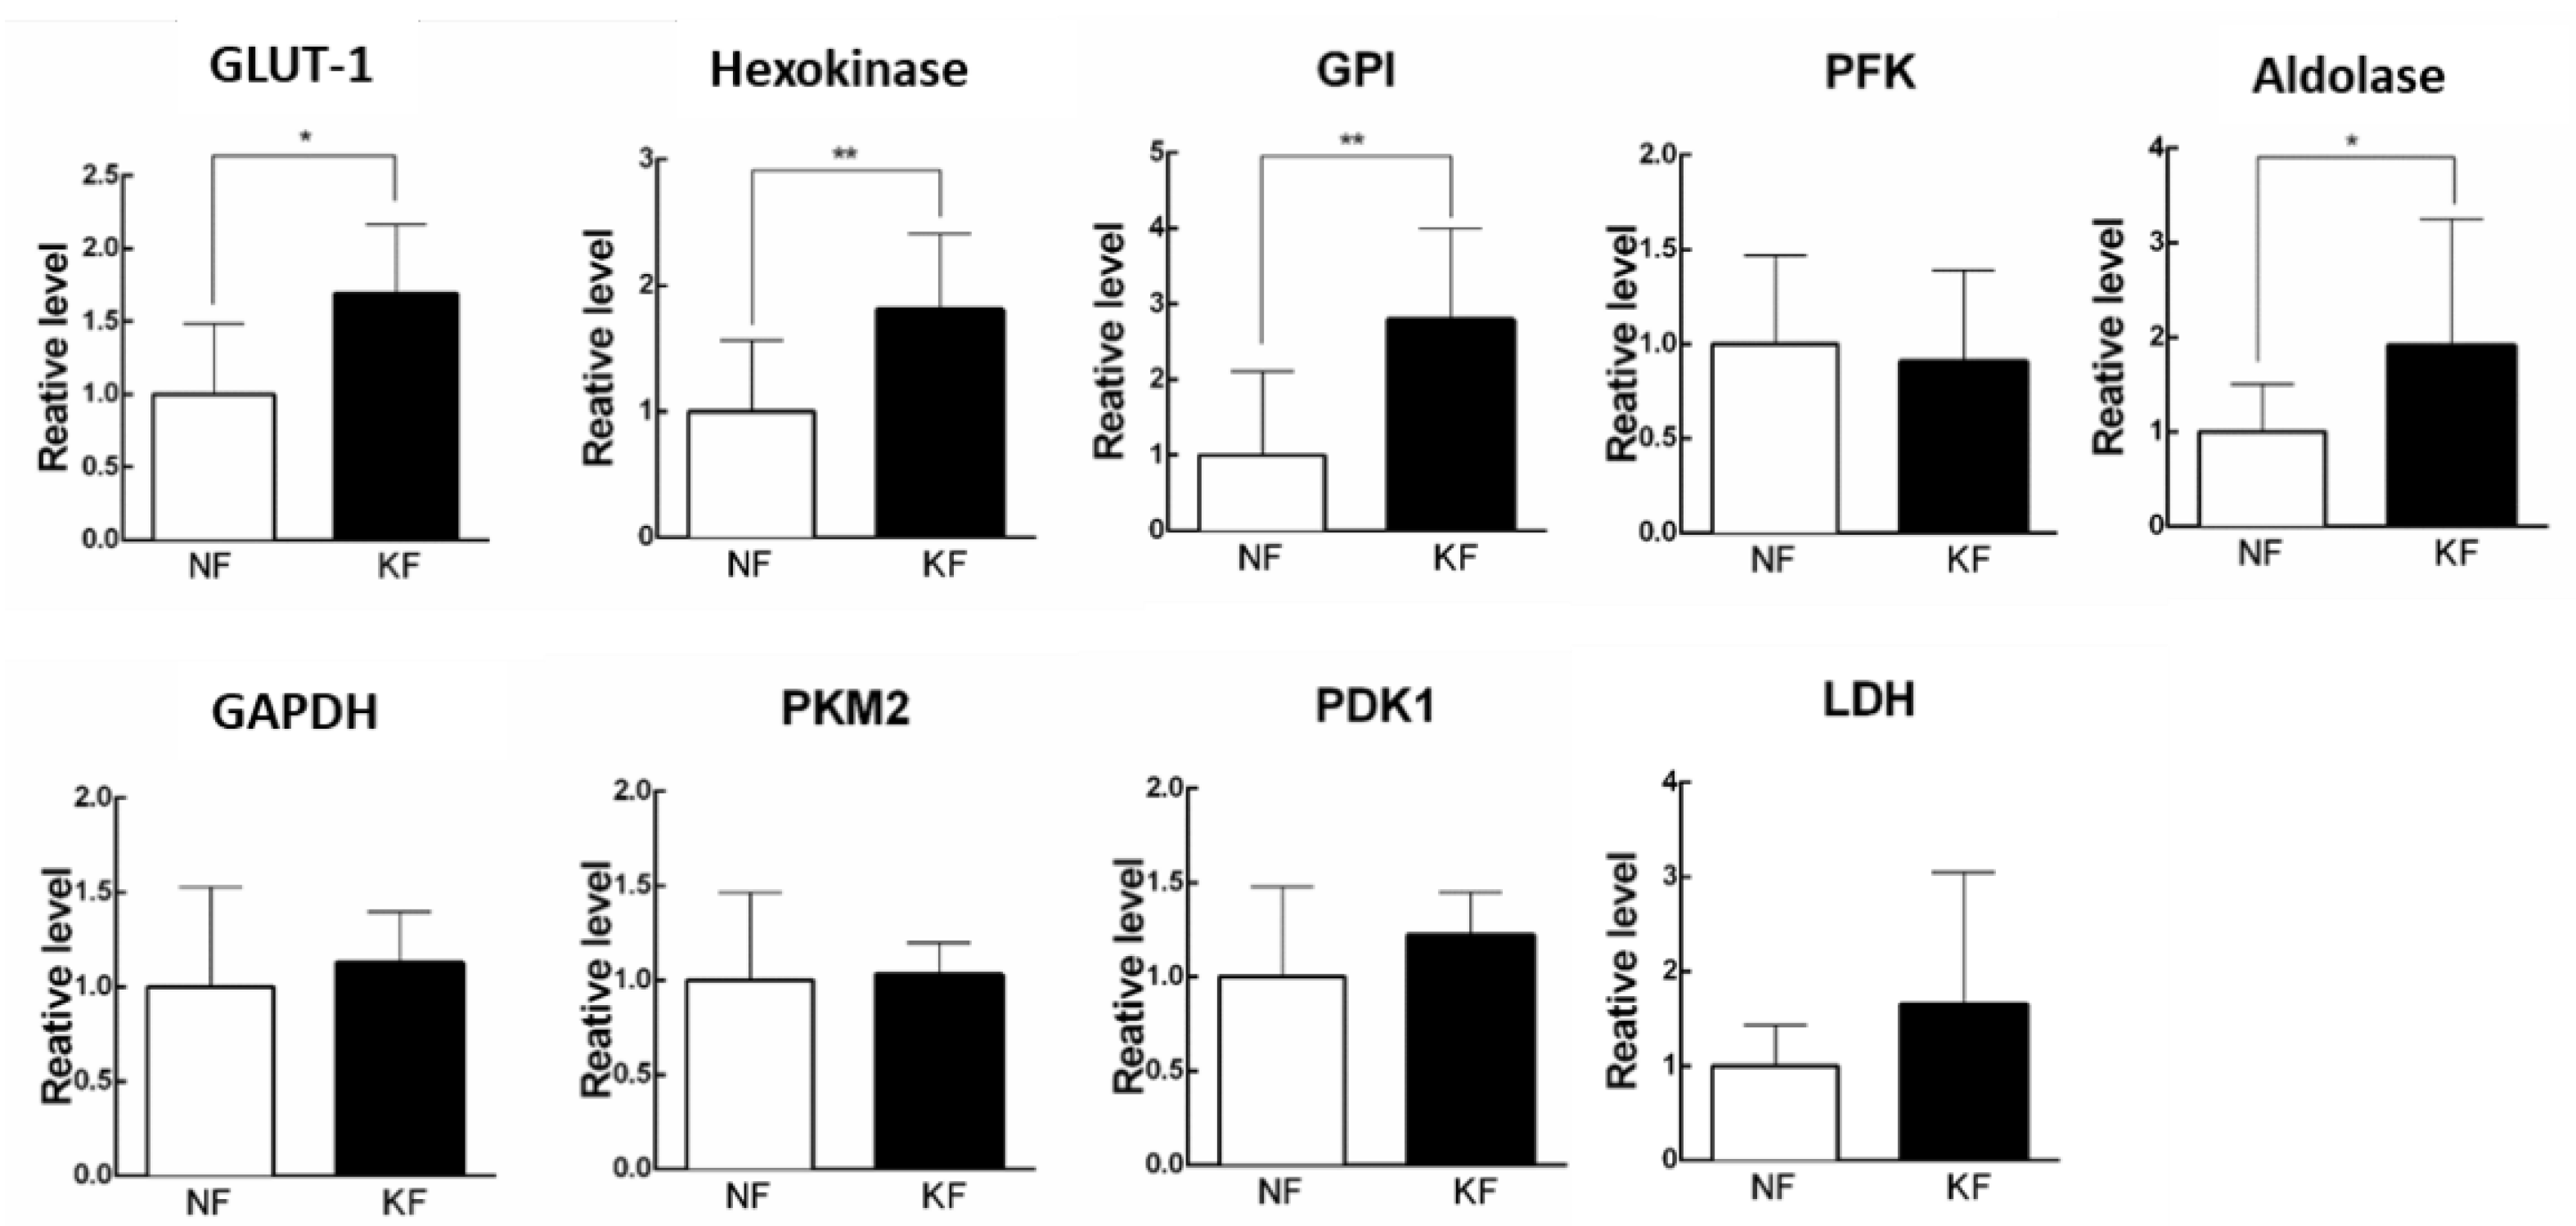
3.2. Glycolytic Enzymes Were Upregulated in KFs
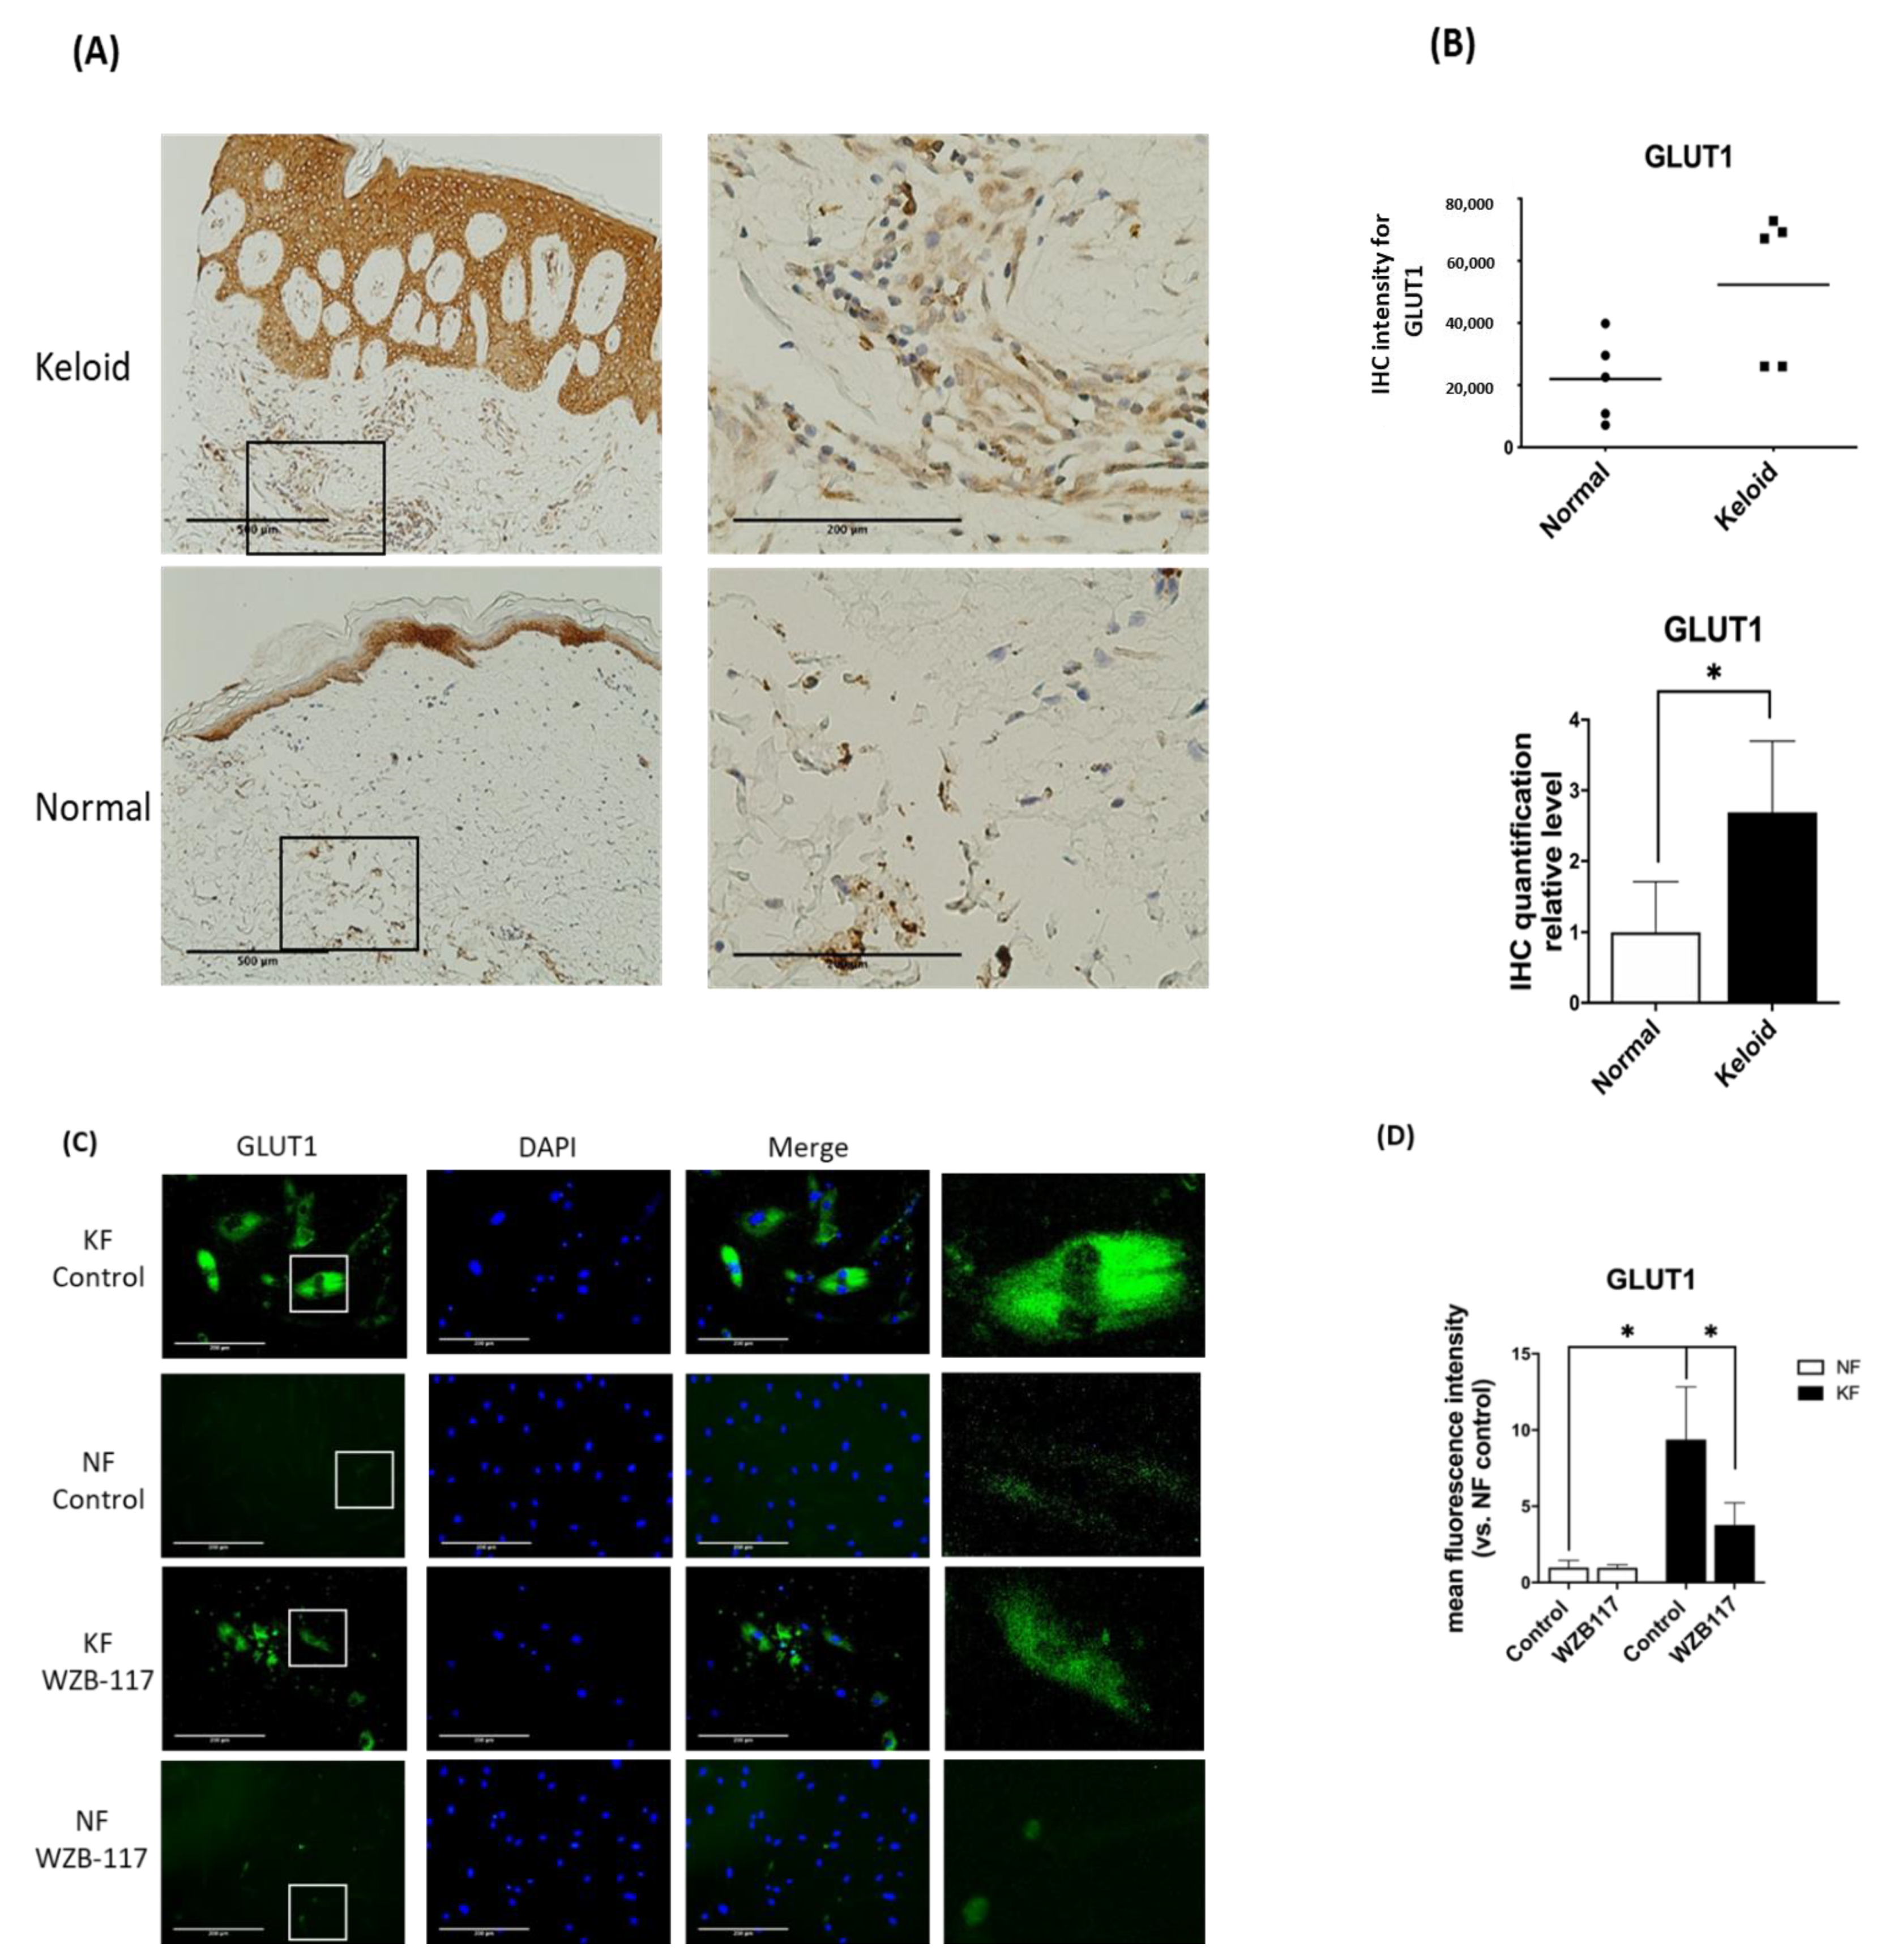
3.3. GLUT-1 Expression Was Increased in Both KFs and Hyperfibrotic Regions in Keloid Tissues
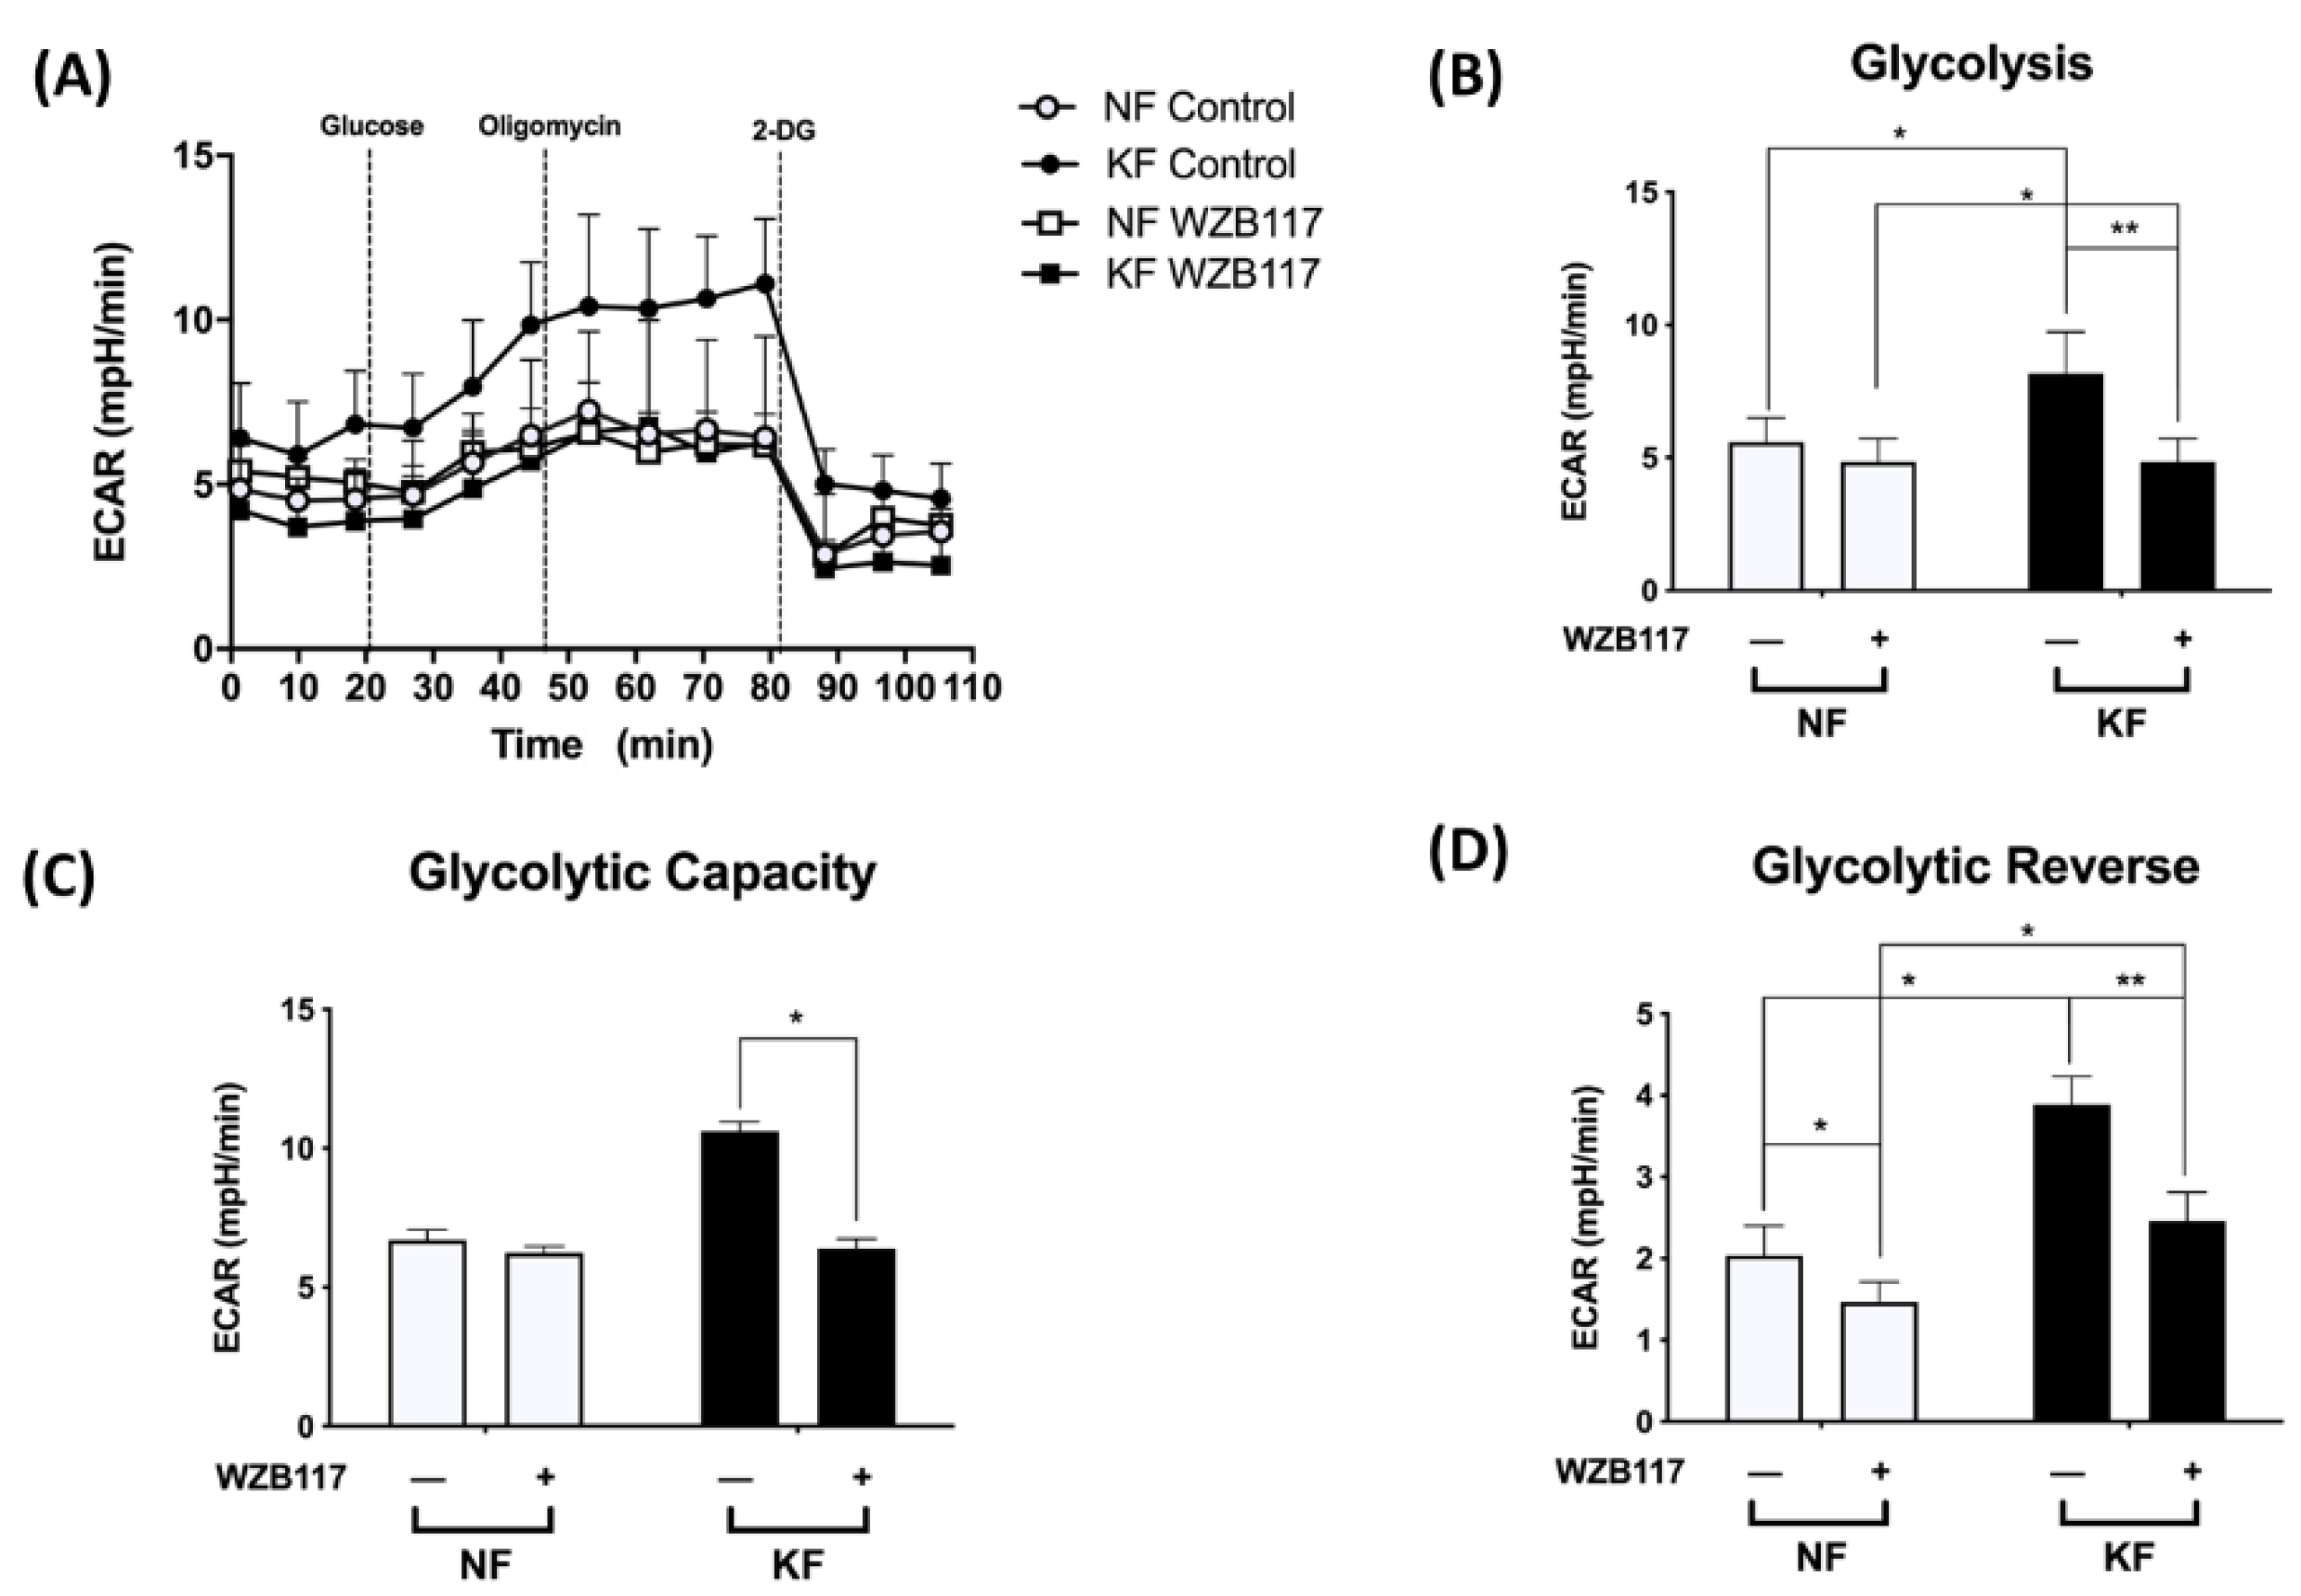
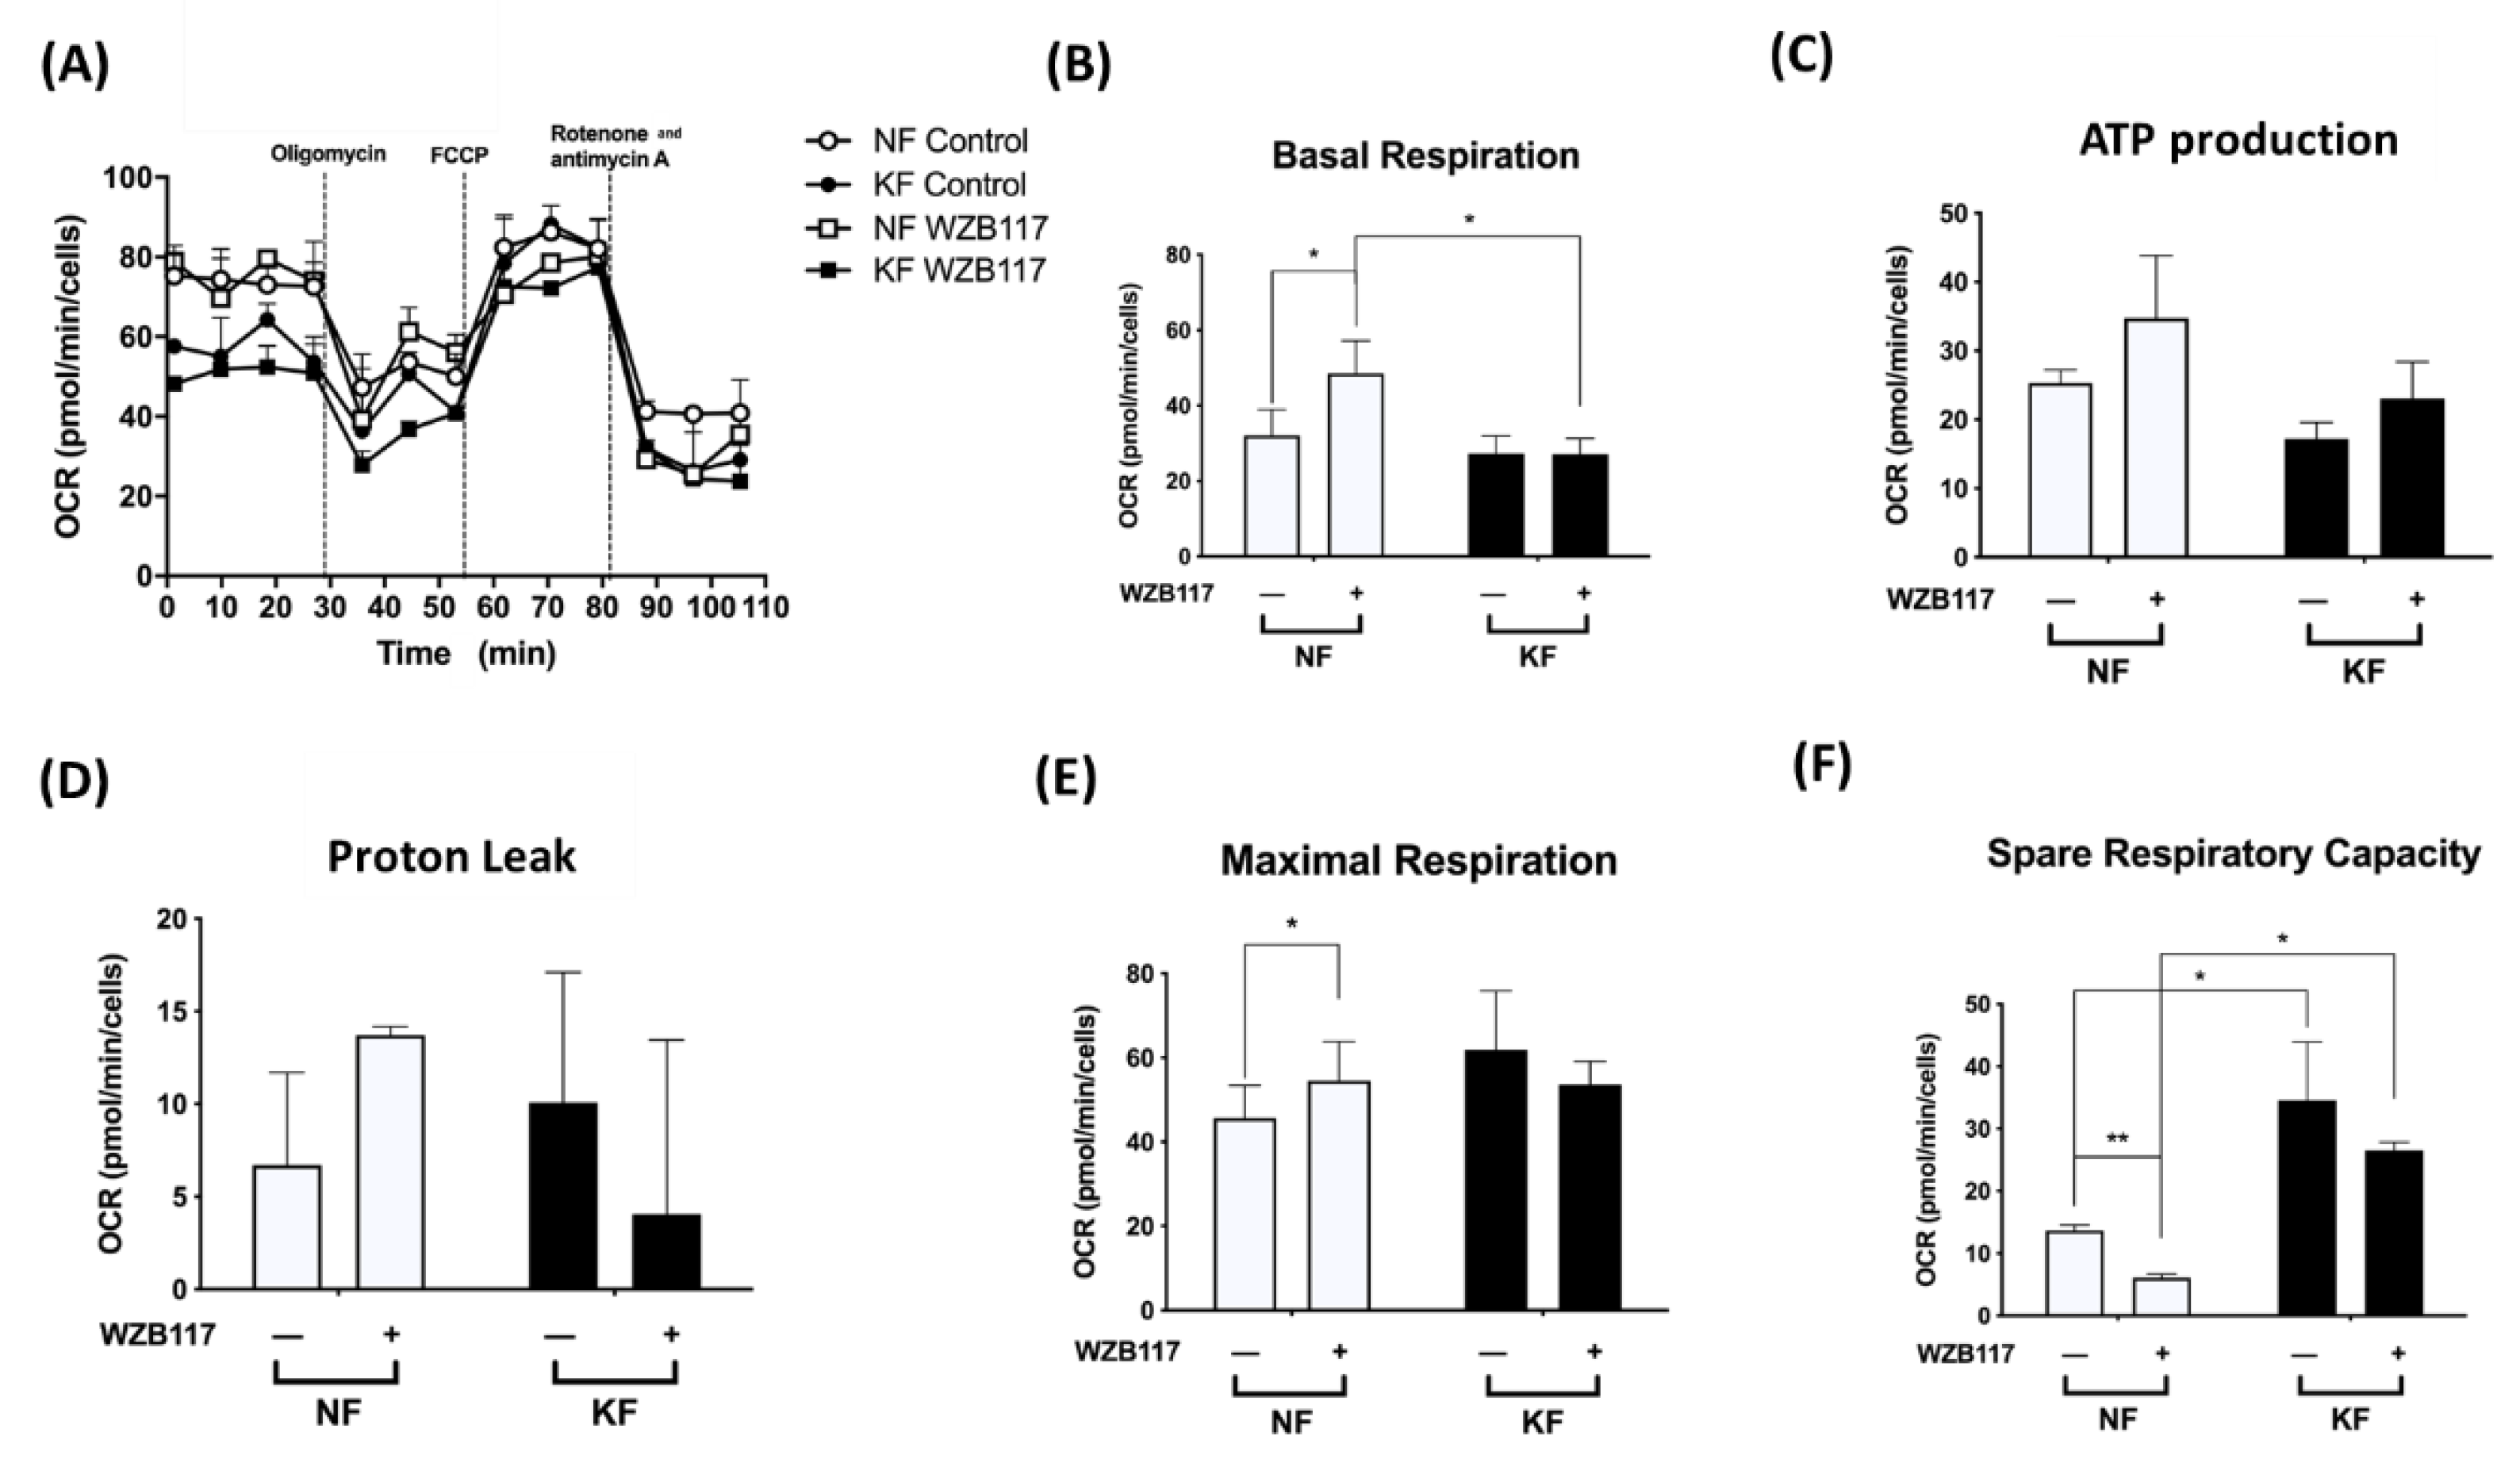
3.4. GLUT-1 Expression Is Critical for Glycolysis but Not Mitochondrial OXPHOS in KFs
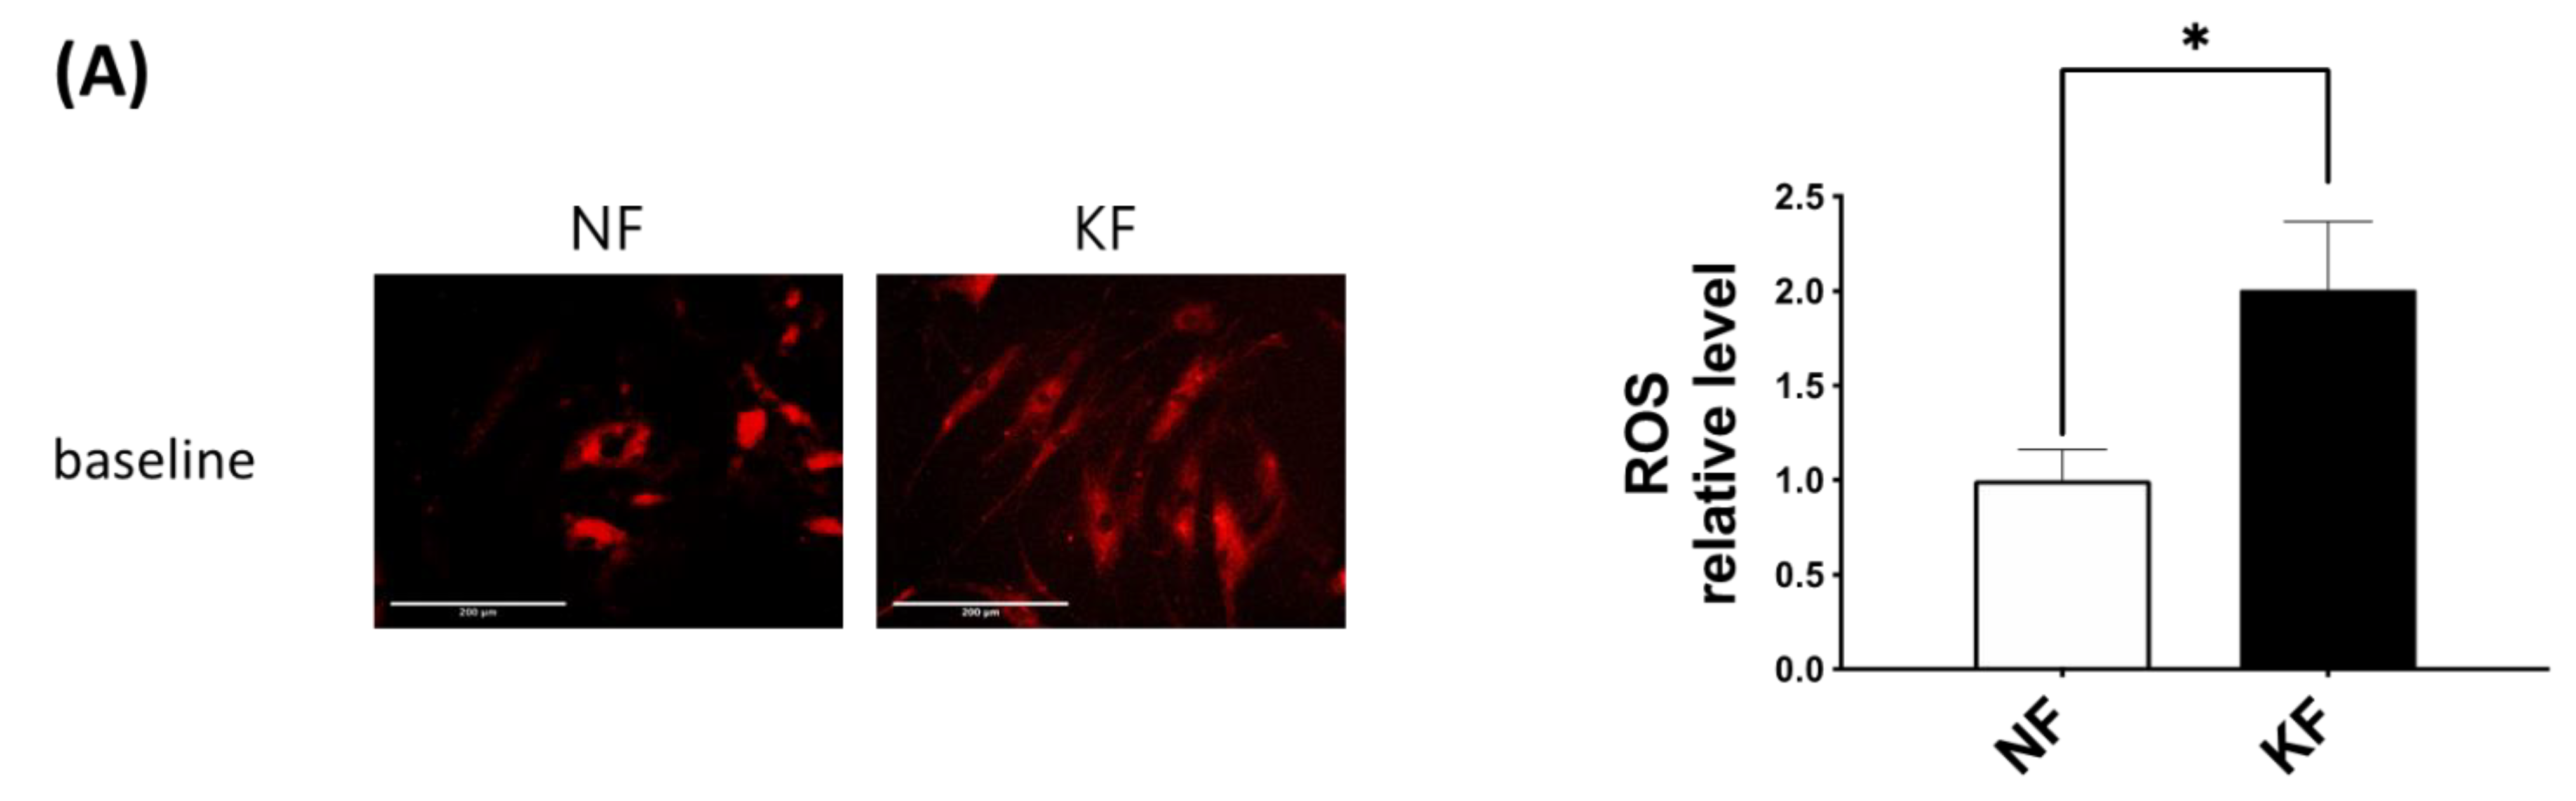
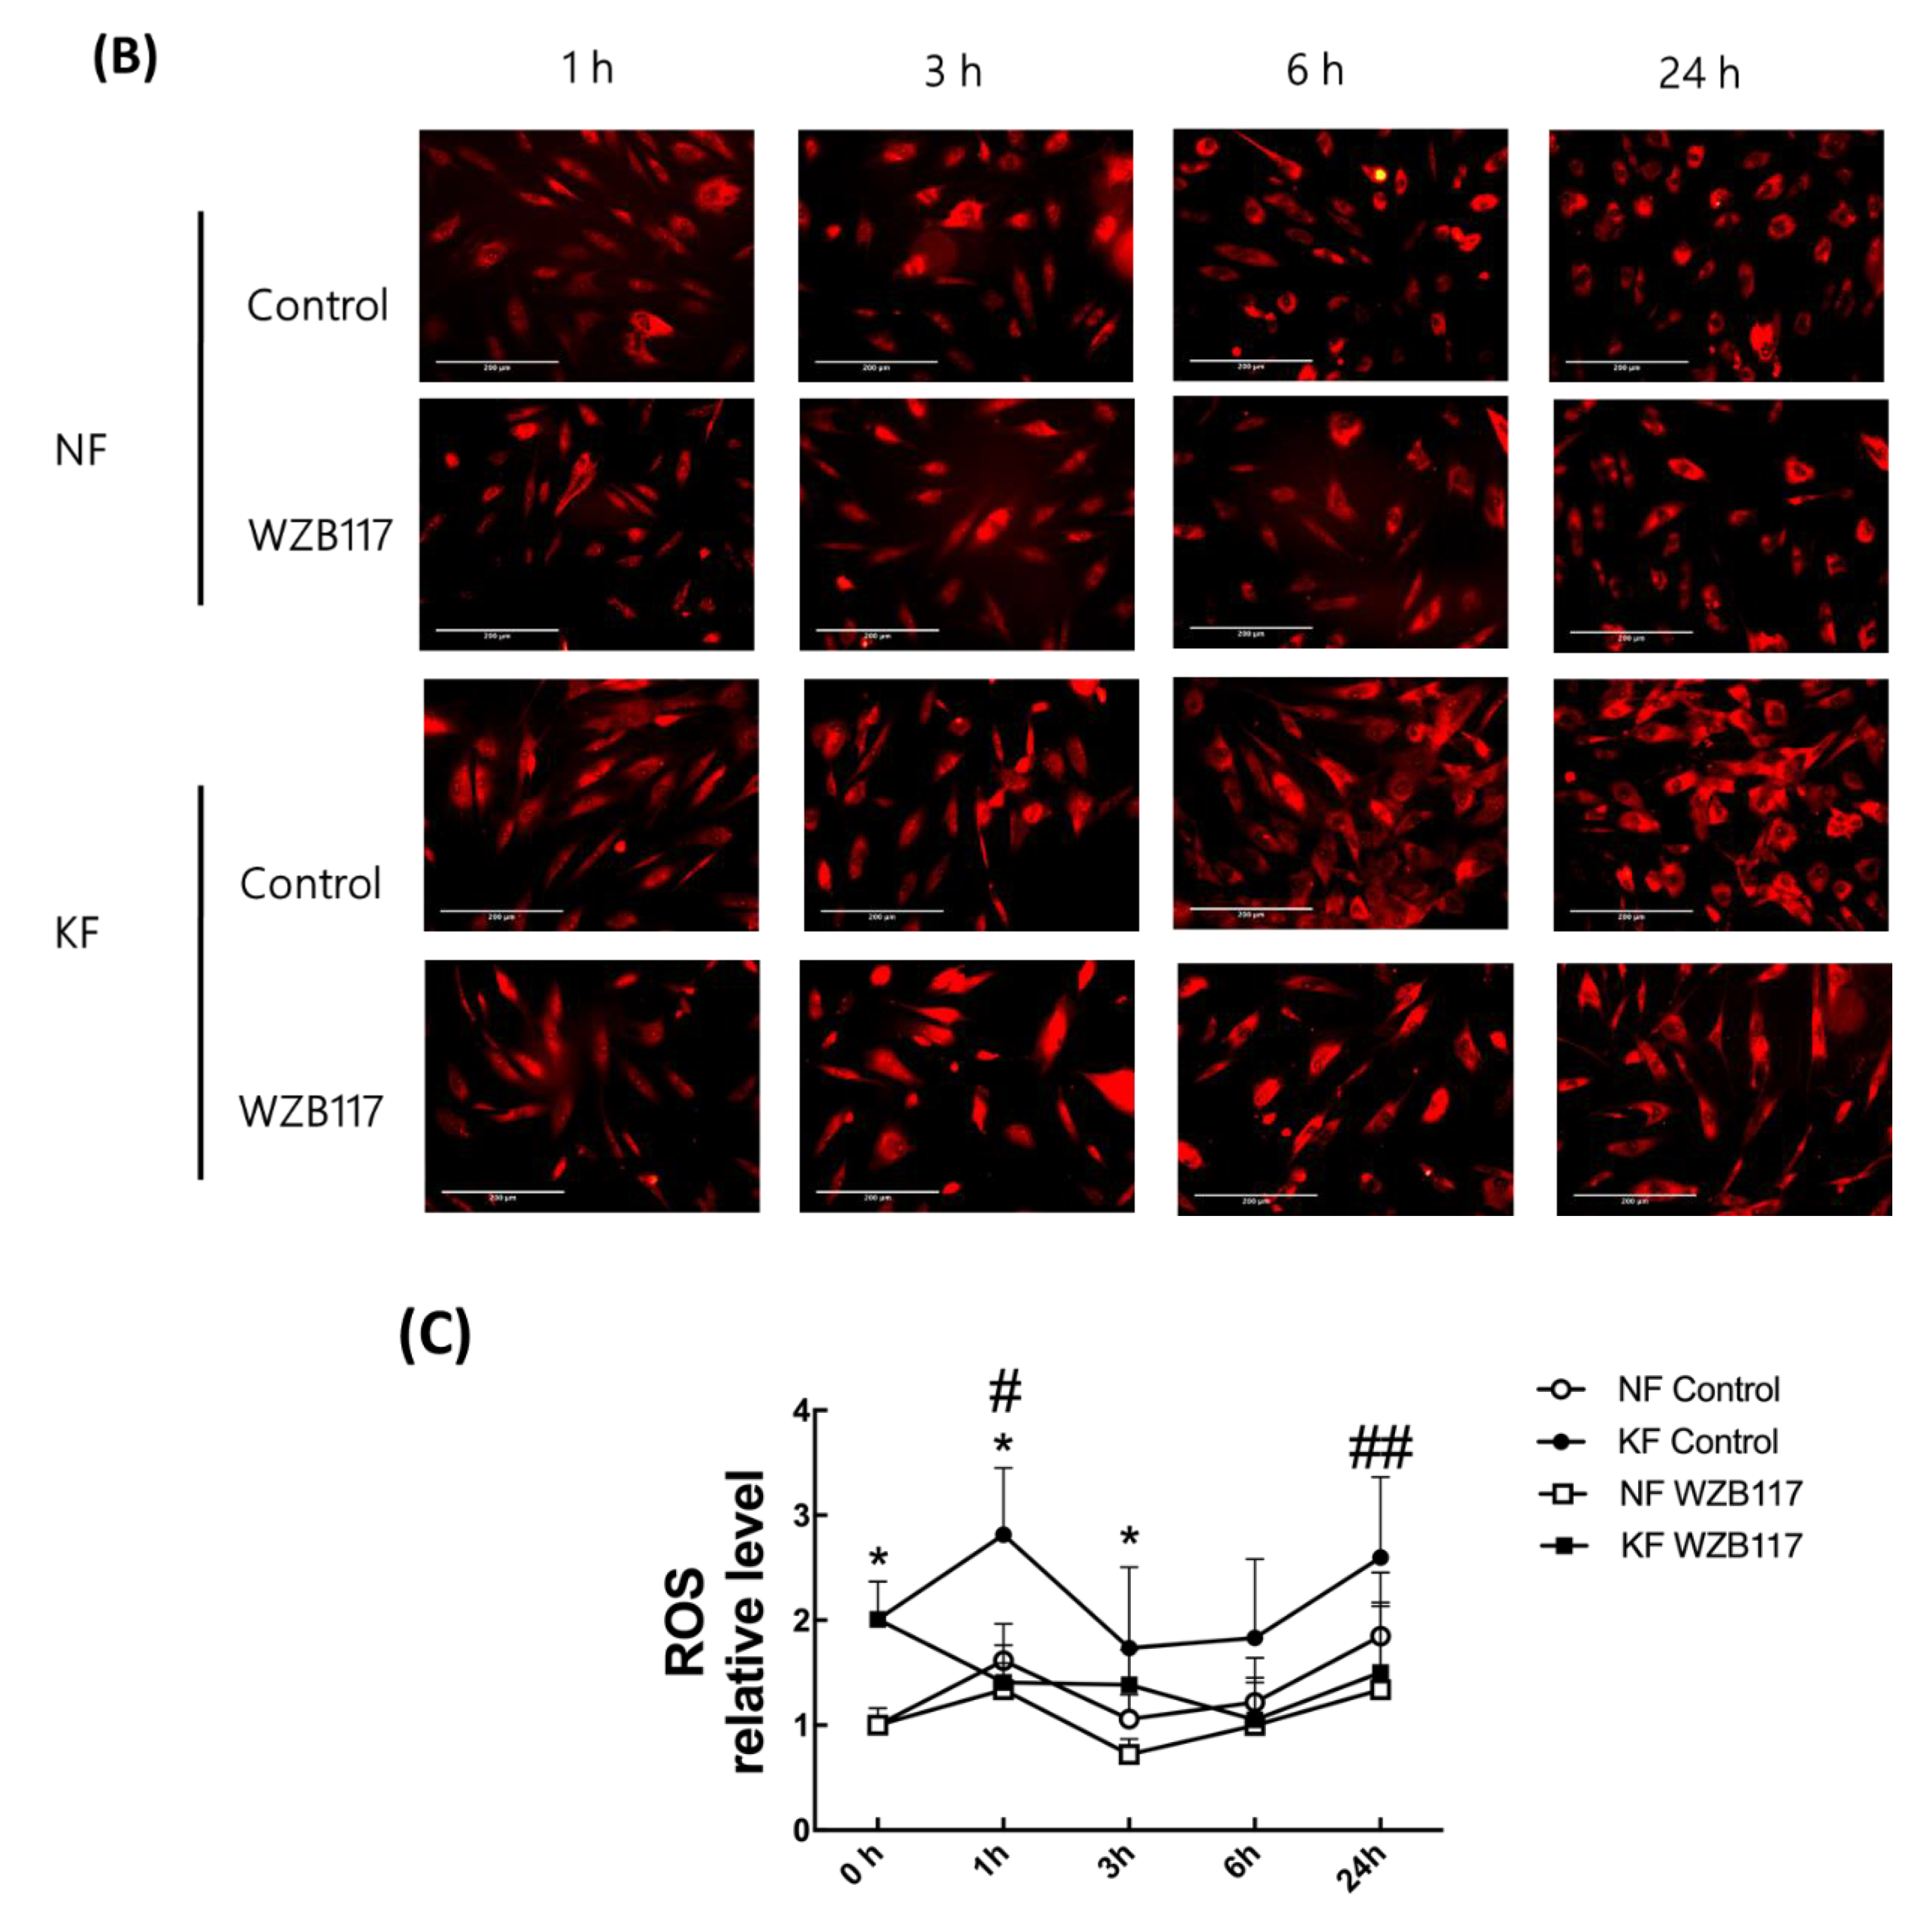
3.5. Blocking GLUT-1 Decreased the Enhanced ROS Formation in KFs
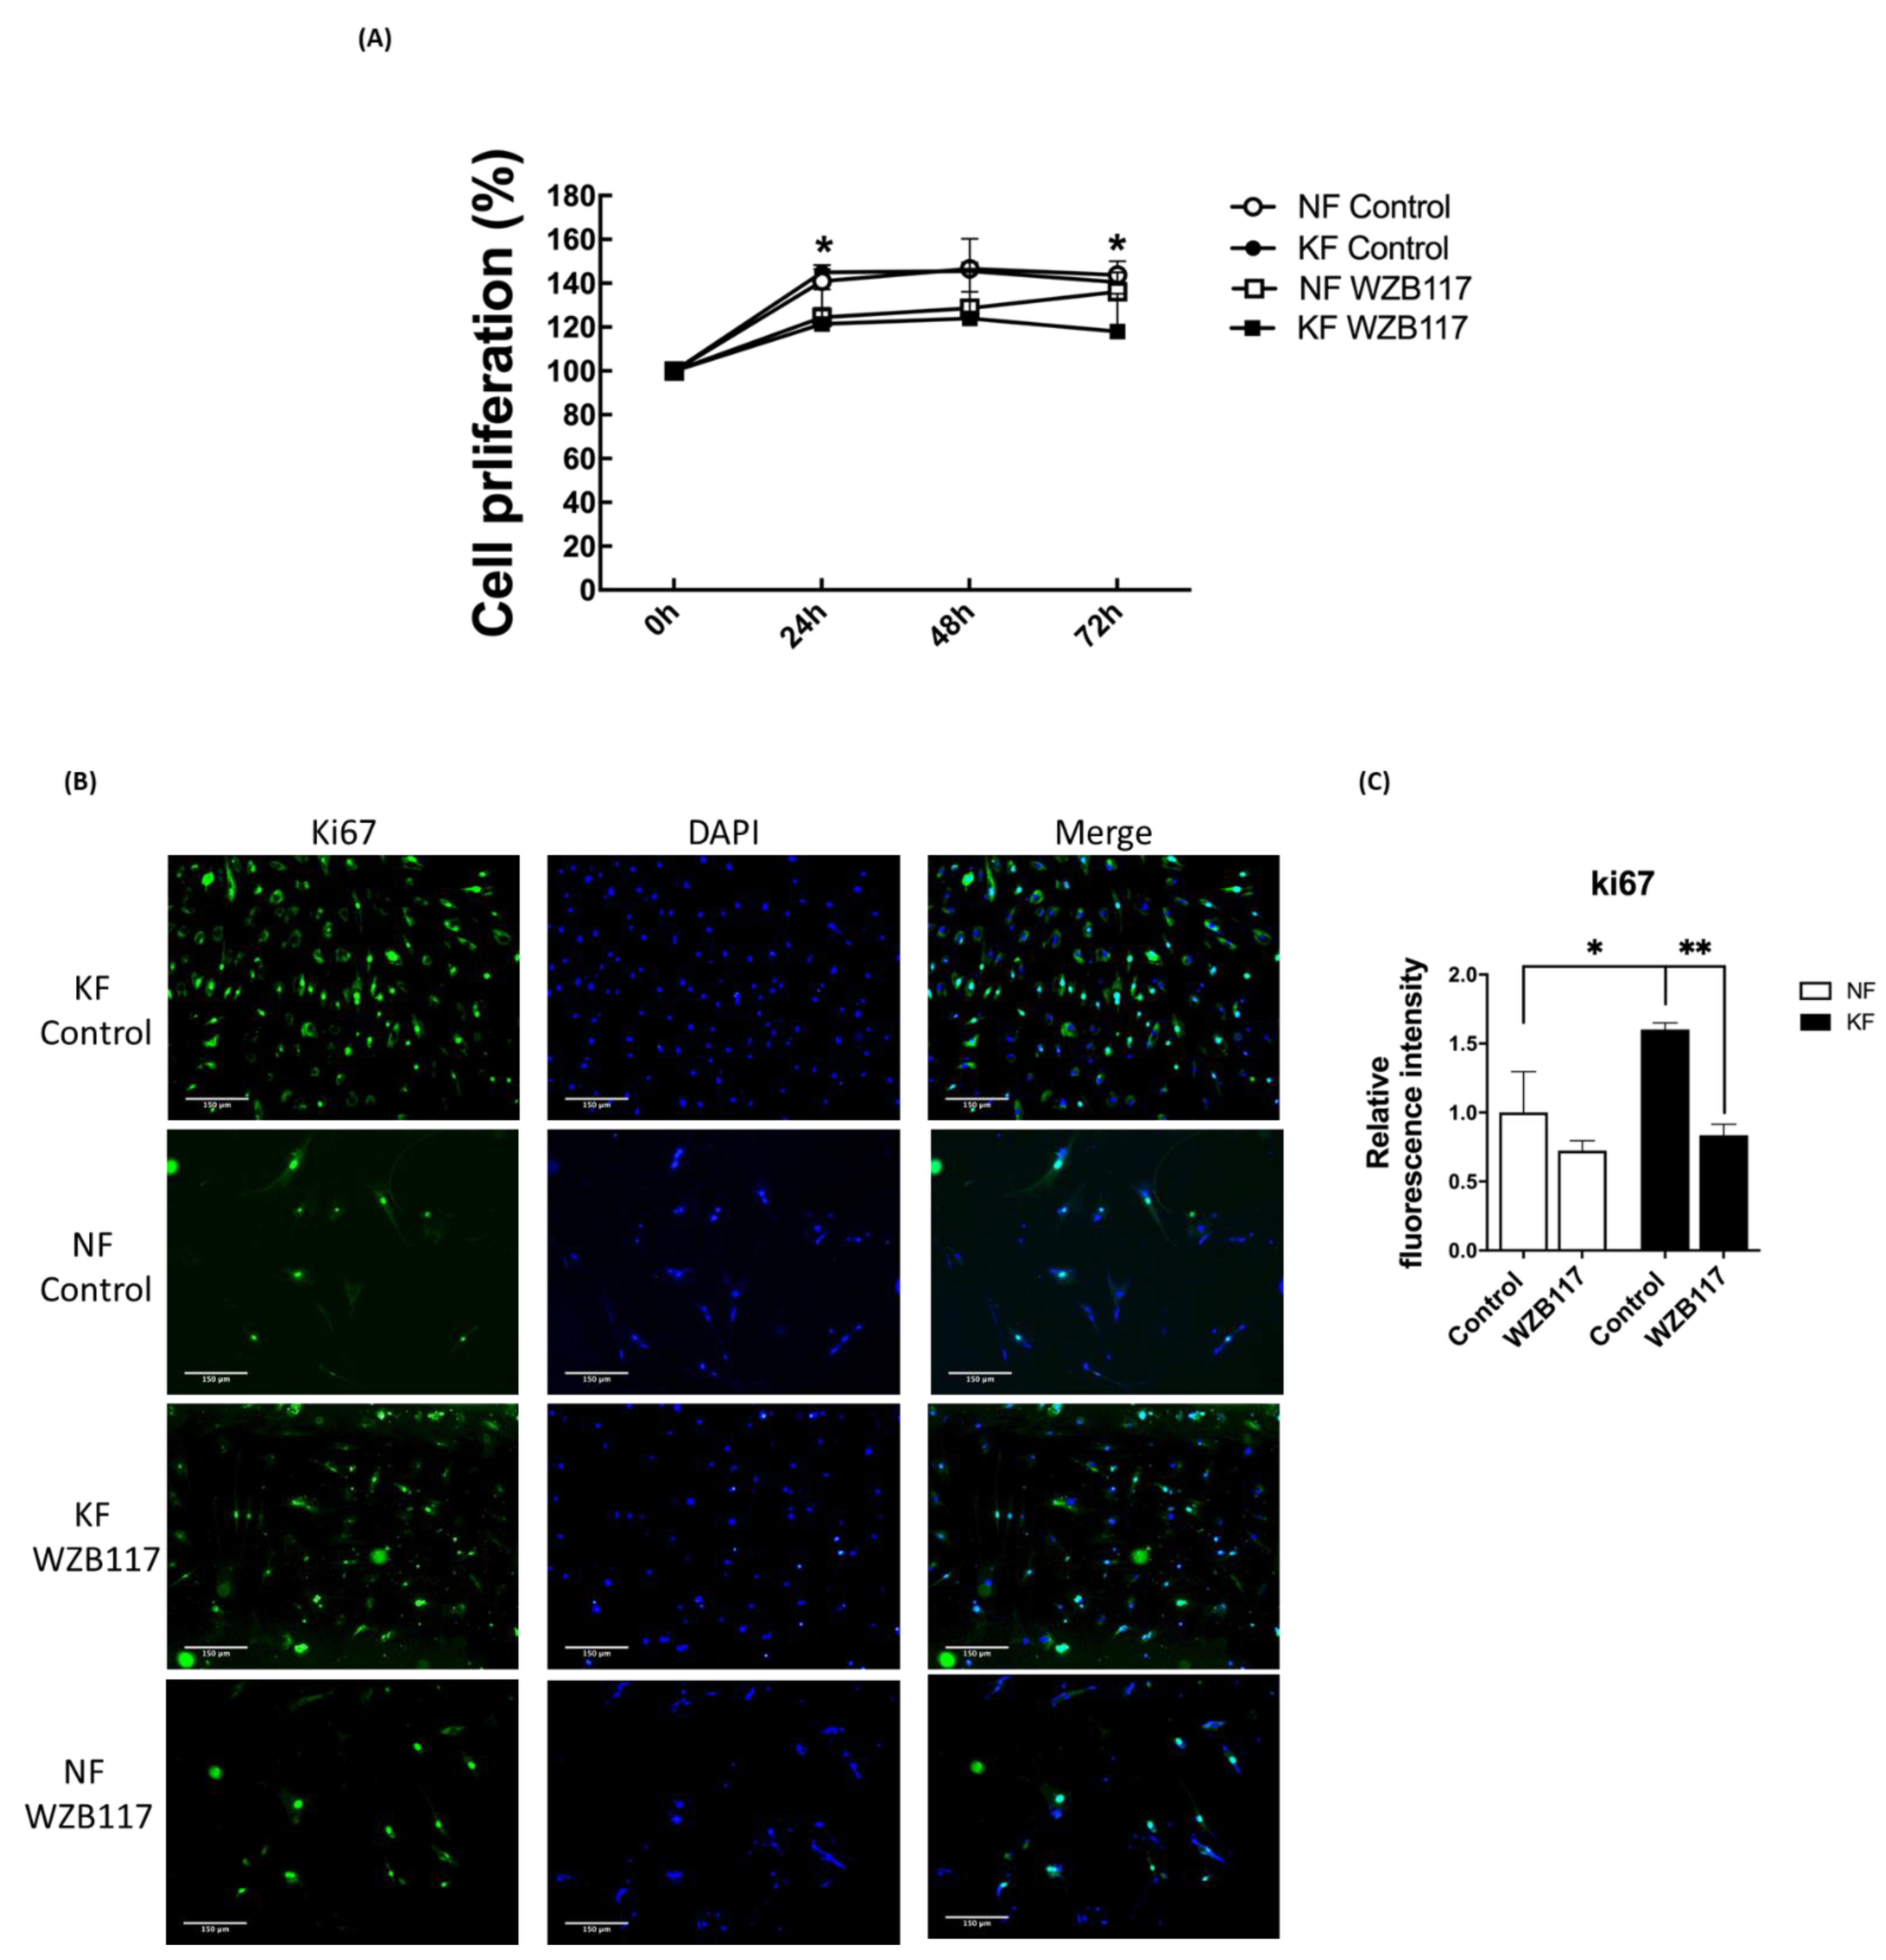
3.6. GLUT-1 Is Required for Proliferation of KFs
4. Discussion
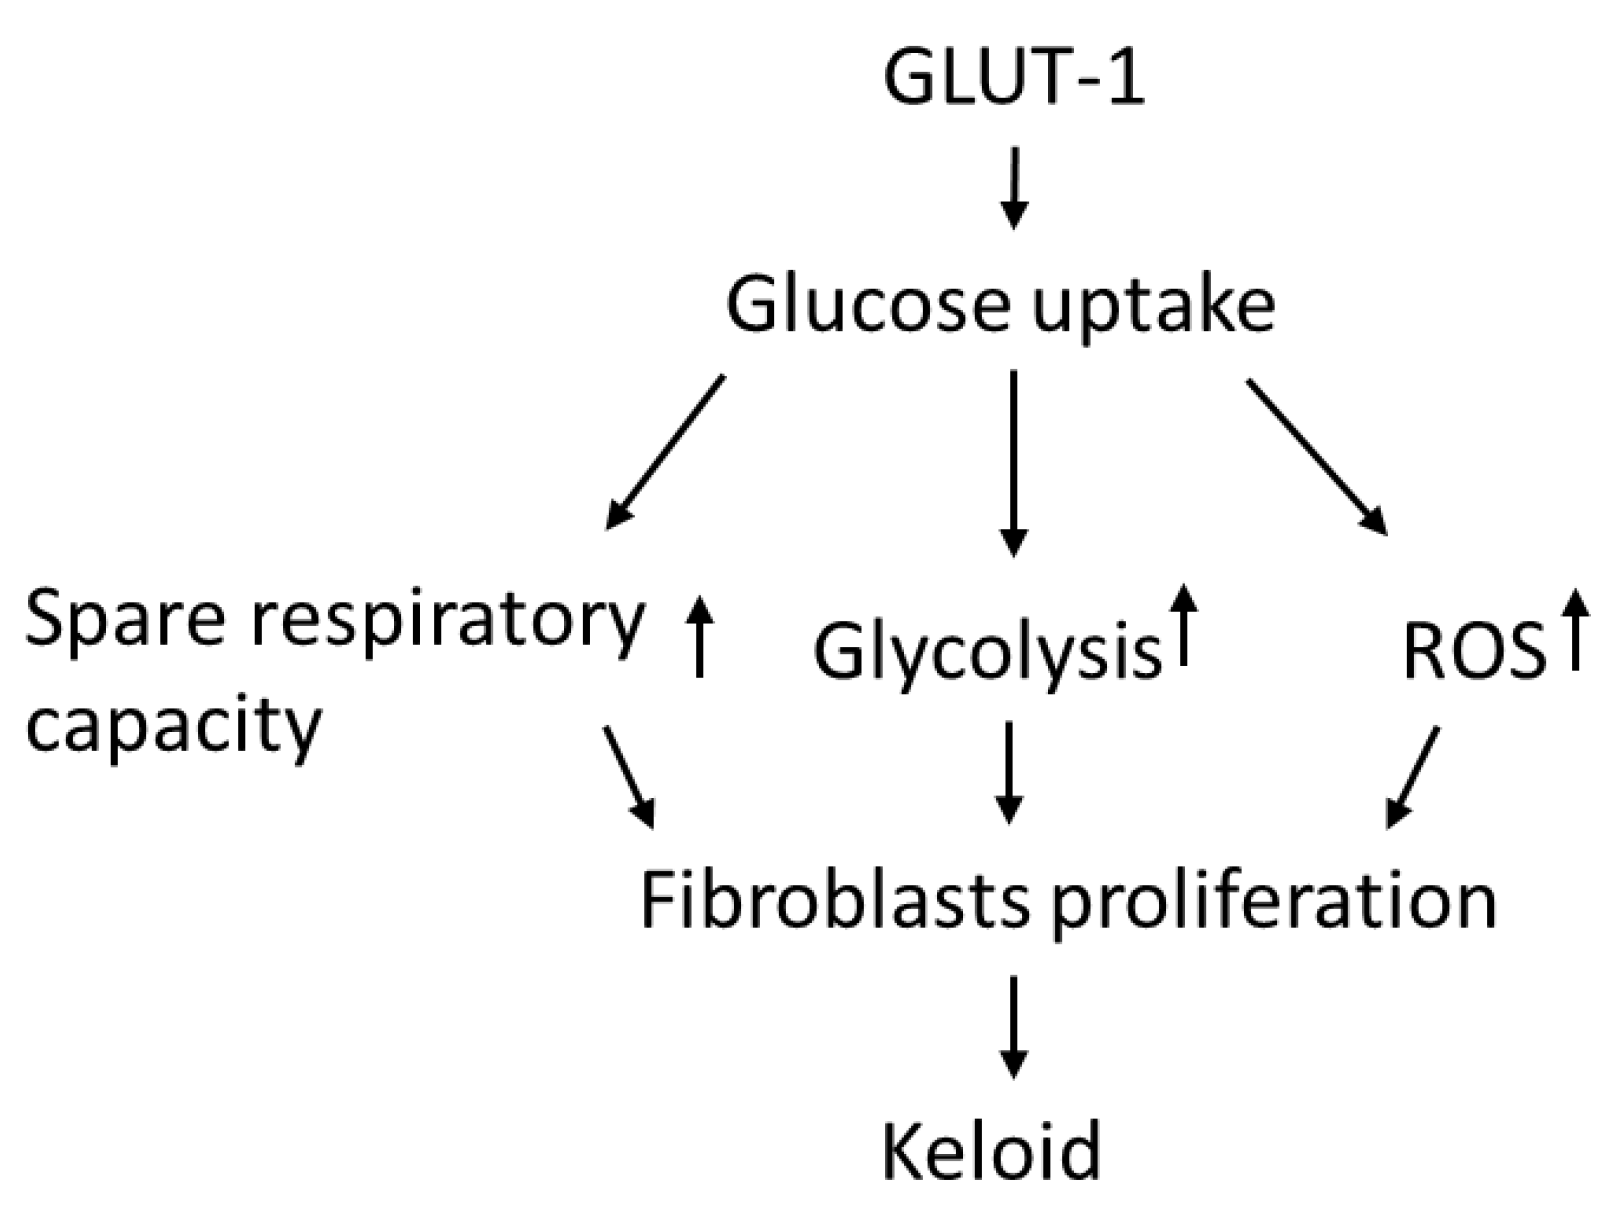
5. Conclusions
Author Contributions
Funding
Institutional Review Board Statement
Informed Consent Statement
Data Availability Statement
Acknowledgments
Conflicts of Interest
References
- Shin, J.U.; Kim, S.H.; Kim, H.; Noh, J.Y.; Jin, S.; Park, C.O.; Lee, W.J.; Lee, D.W.; Lee, J.H.; Lee, K.H. TSLP Is a Potential Initiator of Collagen Synthesis and an Activator of CXCR4/SDF-1 Axis in Keloid Pathogenesis. J. Investig. Dermatol. 2016, 136, 507–515. [Google Scholar] [CrossRef]
- Lee, C.H.; Hong, C.H.; Chen, Y.T.; Chen, Y.C.; Shen, M.R. TGF-beta1 increases cell rigidity by enhancing expression of smooth muscle actin: Keloid-derived fibroblasts as a model for cellular mechanics. J. Dermatol. Sci. 2012, 67, 173–180. [Google Scholar] [CrossRef]
- Trace, A.P.; Enos, C.W.; Mantel, A.; Harvey, V.M. Keloids and Hypertrophic Scars: A Spectrum of Clinical Challenges. Am. J. Clin. Dermatol. 2016, 17, 201–223. [Google Scholar] [CrossRef]
- Lu, Y.Y.; Fang, C.C.; Hong, C.H.; Wu, C.H.; Lin, Y.H.; Chang, K.L.; Lee, C.H. Nonmuscle Myosin II Activation Regulates Cell Proliferation, Cell Contraction, and Myofibroblast Differentiation in Keloid-Derived Fibroblasts. Adv. Wound Care 2020, 9, 491–501. [Google Scholar] [CrossRef]
- Bran, G.M.; Goessler, U.R.; Hormann, K.; Riedel, F.; Sadick, H. Keloids: Current concepts of pathogenesis (review). Int. J. Mol. Med. 2009, 24, 283–293. [Google Scholar] [CrossRef] [PubMed]
- Barolet, D.; Boucher, A. Prophylactic low-level light therapy for the treatment of hypertrophic scars and keloids: A case series. Lasers Surg. Med. 2010, 42, 597–601. [Google Scholar] [CrossRef]
- Ud-Din, S.; Bayat, A. New insights on keloids, hypertrophic scars, and striae. Dermatol. Clin. 2014, 32, 193–209. [Google Scholar] [CrossRef]
- Arno, A.I.; Gauglitz, G.G.; Barret, J.P.; Jeschke, M.G. Up-to-date approach to manage keloids and hypertrophic scars: A useful guide. Burns 2014, 40, 1255–1266. [Google Scholar] [CrossRef]
- Huang, C.; Akaishi, S.; Ogawa, R. Mechanosignaling pathways in cutaneous scarring. Arch. Dermatol. Res. 2012, 304, 589–597. [Google Scholar] [CrossRef]
- Ogawa, R. Mechanobiology of scarring. Wound Repair Regen. 2011, 19 (Suppl. 1), s2–s9. [Google Scholar] [CrossRef]
- Vallee, A.; Lecarpentier, Y.; Vallee, J.N. Thermodynamic Aspects and Reprogramming Cellular Energy Metabolism during the Fibrosis Process. Int. J. Mol. Sci. 2017, 18, 2537. [Google Scholar] [CrossRef]
- Jost, R.T.; Dias, H.B.; Krause, G.C.; de Souza, R.G.; de Souza, T.R.; Nunez, N.K.; Dos Santos, F.G.; Haute, G.V.; da Silva Melo, D.A.; Pitrez, P.M.; et al. Fructose-1,6-Bisphosphate Prevents Bleomycin-Induced Pulmonary Fibrosis in Mice and Inhibits the Proliferation of Lung Fibroblasts. Inflammation 2018, 41, 1987–2001. [Google Scholar] [CrossRef] [PubMed]
- Perl, A. mTOR activation is a biomarker and a central pathway to autoimmune disorders, cancer, obesity, and aging. Ann. N. Y. Acad. Sci. 2015, 1346, 33–44. [Google Scholar] [CrossRef] [PubMed]
- Shimizu, I.; Minamino, T. Physiological and pathological cardiac hypertrophy. J. Mol. Cell. Cardiol. 2016, 97, 245–262. [Google Scholar] [CrossRef]
- Sciacovelli, M.; Frezza, C. Metabolic reprogramming and epithelial-to-mesenchymal transition in cancer. FEBS J. 2017, 284, 3132–3144. [Google Scholar] [CrossRef]
- Hua, W.; Ten Dijke, P.; Kostidis, S.; Giera, M.; Hornsveld, M. TGFbeta-induced metabolic reprogramming during epithelial-to-mesenchymal transition in cancer. Cell. Mol. Life Sci. 2020, 77, 2103–2123. [Google Scholar] [CrossRef]
- Ozawa, T.; Okamura, T.; Harada, T.; Muraoka, M.; Ozawa, N.; Koyama, K.; Inoue, Y.; Ishii, M. Accumulation of glucose in keloids with FDG-PET. Ann. Nucl. Med. 2006, 20, 41–44. [Google Scholar] [CrossRef] [PubMed]
- Li, Z.G. FDG-Avid Keloid on PET/CT Imaging. Clin. Nucl. Med. 2017, 42, 620–621. [Google Scholar] [CrossRef]
- Ancey, P.B.; Contat, C.; Meylan, E. Glucose transporters in cancer-from tumor cells to the tumor microenvironment. FEBS J. 2018, 285, 2926–2943. [Google Scholar] [CrossRef]
- Zambrano, A.; Molt, M.; Uribe, E.; Salas, M. Glut 1 in Cancer Cells and the Inhibitory Action of Resveratrol as A Potential Therapeutic Strategy. Int. J. Mol. Sci. 2019, 20, 3374. [Google Scholar] [CrossRef]
- Deng, D.; Xu, C.; Sun, P.; Wu, J.; Yan, C.; Hu, M.; Yan, N. Crystal structure of the human glucose transporter GLUT1. Nature 2014, 510, 121–125. [Google Scholar] [CrossRef] [PubMed]
- Vander Heiden, M.G.; Cantley, L.C.; Thompson, C.B. Understanding the Warburg effect: The metabolic requirements of cell proliferation. Science 2009, 324, 1029–1033. [Google Scholar] [CrossRef] [PubMed]
- Macintyre, A.N.; Gerriets, V.A.; Nichols, A.G.; Michalek, R.D.; Rudolph, M.C.; Deoliveira, D.; Anderson, S.M.; Abel, E.D.; Chen, B.J.; Hale, L.P.; et al. The glucose transporter Glut1 is selectively essential for CD4 T cell activation and effector function. Cell Metab. 2014, 20, 61–72. [Google Scholar] [CrossRef] [PubMed]
- Thorens, B.; Mueckler, M. Glucose transporters in the 21st Century. Am. J. Physiol. Endocrinol. Metab. 2010, 298, E141–E145. [Google Scholar] [CrossRef] [PubMed]
- Ward, P.S.; Thompson, C.B. Metabolic reprogramming: A cancer hallmark even warburg did not anticipate. Cancer Cell 2012, 21, 297–308. [Google Scholar] [CrossRef]
- Brown, R.S.; Wahl, R.L. Overexpression of Glut-1 glucose transporter in human breast cancer. An immunohistochemical study. Cancer 1993, 72, 2979–2985. [Google Scholar] [CrossRef]
- Carvalho, K.C.; Cunha, I.W.; Rocha, R.M.; Ayala, F.R.; Cajaiba, M.M.; Begnami, M.D.; Vilela, R.S.; Paiva, G.R.; Andrade, R.G.; Soares, F.A. GLUT1 expression in malignant tumors and its use as an immunodiagnostic marker. Clinics 2011, 66, 965–972. [Google Scholar] [CrossRef]
- Wu, Q.; Ba-Alawi, W.; Deblois, G.; Cruickshank, J.; Duan, S.; Lima-Fernandes, E.; Haight, J.; Tonekaboni, S.A.M.; Fortier, A.M.; Kuasne, H.; et al. GLUT1 inhibition blocks growth of RB1-positive triple negative breast cancer. Nat. Commun. 2020, 11, 4205. [Google Scholar] [CrossRef]
- Xiao, H.; Wang, J.; Yan, W.; Cui, Y.; Chen, Z.; Gao, X.; Wen, X.; Chen, J. GLUT1 regulates cell glycolysis and proliferation in prostate cancer. Prostate 2018, 78, 86–94. [Google Scholar] [CrossRef]
- Georgescu, I.; Gooding, R.J.; Doiron, R.C.; Day, A.; Selvarajah, S.; Davidson, C.; Berman, D.M.; Park, P.C. Molecular characterization of Gleason patterns 3 and 4 prostate cancer using reverse Warburg effect-associated genes. Cancer Metab. 2016, 4, 8. [Google Scholar] [CrossRef]
- Abu Aboud, O.; Donohoe, D.; Bultman, S.; Fitch, M.; Riiff, T.; Hellerstein, M.; Weiss, R.H. PPARalpha inhibition modulates multiple reprogrammed metabolic pathways in kidney cancer and attenuates tumor growth. Am. J. Physiol. Cell Physiol. 2015, 308, C890–C898. [Google Scholar] [CrossRef] [PubMed]
- Pfeiffer, T.; Schuster, S.; Bonhoeffer, S. Cooperation and competition in the evolution of ATP-producing pathways. Science 2001, 292, 504–507. [Google Scholar] [CrossRef] [PubMed]
- Zheng, J. Energy metabolism of cancer: Glycolysis versus oxidative phosphorylation (Review). Oncol. Lett. 2012, 4, 1151–1157. [Google Scholar] [CrossRef] [PubMed]
- Vaishnavi, S.N.; Vlassenko, A.G.; Rundle, M.M.; Snyder, A.Z.; Mintun, M.A.; Raichle, M.E. Regional aerobic glycolysis in the human brain. Proc. Natl. Acad. Sci. USA 2010, 107, 17757–17762. [Google Scholar] [CrossRef]
- Liemburg-Apers, D.C.; Schirris, T.J.; Russel, F.G.; Willems, P.H.; Koopman, W.J. Mitoenergetic Dysfunction Triggers a Rapid Compensatory Increase in Steady-State Glucose Flux. Biophys. J. 2015, 109, 1372–1386. [Google Scholar] [CrossRef] [PubMed]
- Vincent, A.S.; Phan, T.T.; Mukhopadhyay, A.; Lim, H.Y.; Halliwell, B.; Wong, K.P. Human skin keloid fibroblasts display bioenergetics of cancer cells. J. Investig. Dermatol. 2008, 128, 702–709. [Google Scholar] [CrossRef]
- Ueda, K.; Yasuda, Y.; Furuya, E.; Oba, S. Inadequate blood supply persists in keloids. Scand. J. Plast. Reconstr. Surg. Hand Surg. 2004, 38, 267–271. [Google Scholar] [CrossRef]
- Hoopes, J.E.; Su, C.T.; Im, M.J. Enzyme activities in hypertrophic scars and keloids. Plast. Reconst. Surg. 1971, 47, 132–137. [Google Scholar] [CrossRef]
- Kemble, J.V.; Brown, R.F. Enzyme activity in human scars, hypertrophic scars and keloids. Br. J. Dermatol. 1976, 94, 301–305. [Google Scholar] [CrossRef]
- Friedman, S.L. Clarity and Challenges in Tissue Fibrosis. In Innovative Medicine: Basic Research and Development [Internet]; Nakao, K., Minato, N., Uemoto, S., Eds.; Springer: Tokyo, Japan, 2015. [Google Scholar]
- De Felice, B.; Wilson, R.R.; Nacca, M. Telomere shortening may be associated with human keloids. BMC Med. Genet. 2009, 10, 110. [Google Scholar] [CrossRef]
- Lee, Y.J.; Kwon, S.B.; Kim, C.H.; Cho, H.D.; Nam, H.S.; Lee, S.H.; Lee, M.W.; Nam, D.H.; Choi, C.Y.; Cho, M.K. Oxidative Damage and Nuclear Factor Erythroid 2-Related Factor 2 Protein Expression in Normal Skin and Keloid Tissue. Ann. Dermatol. 2015, 27, 507–516. [Google Scholar] [CrossRef]
- Li, Q.; Qin, Z.; Nie, F.; Bi, H.; Zhao, R.; Pan, B.; Ma, J.; Xie, X. Metabolic reprogramming in keloid fibroblasts: Aerobic glycolysis and a novel therapeutic strategy. Biochem. Biophys. Res. Commun. 2018, 496, 641–647. [Google Scholar] [CrossRef] [PubMed]
- Gordon, H.M.; Kucera, G.; Salvo, R.; Boss, J.M. Tumor necrosis factor induces genes involved in inflammation, cellular and tissue repair, and metabolism in murine fibroblasts. J. Immunol. 1992, 148, 4021–4027. [Google Scholar] [PubMed]
- Kroemer, G.; Galluzzi, L.; Brenner, C. Mitochondrial membrane permeabilization in cell death. Physiol. Rev. 2007, 87, 99–163. [Google Scholar] [CrossRef] [PubMed]
- Bos, S.; Laukens, D. Metabolic modulation during intestinal fibrosis. J. Dig. Dis. 2020, 21, 319–325. [Google Scholar] [CrossRef]
- Xie, N.; Tan, Z.; Banerjee, S.; Cui, H.; Ge, J.; Liu, R.M.; Bernard, K.; Thannickal, V.J.; Liu, G. Glycolytic Reprogramming in Myofibroblast Differentiation and Lung Fibrosis. Am. J. Respir. Crit. Care Med. 2015, 192, 1462–1474. [Google Scholar] [CrossRef]
- Chen, C.; Pore, N.; Behrooz, A.; Ismail-Beigi, F.; Maity, A. Regulation of glut1 mRNA by hypoxia-inducible factor-1. Interaction between H-ras and hypoxia. J. Biol. Chem. 2001, 276, 9519–9525. [Google Scholar] [CrossRef]
- Salter, D.W.; Baldwin, S.A.; Lienhard, G.E.; Weber, M.J. Proteins antigenically related to the human erythrocyte glucose transporter in normal and Rous sarcoma virus-transformed chicken embryo fibroblasts. Proc. Natl. Acad. Sci. USA 1982, 79, 1540–1544. [Google Scholar] [CrossRef]
- Kozlovsky, N.; Rudich, A.; Potashnik, R.; Bashan, N. Reactive oxygen species activate glucose transport in L6 myotubes. Free Radic. Biol. Med. 1997, 23, 859–869. [Google Scholar] [CrossRef]
- Gunnink, S.M.; Kerk, S.A.; Kuiper, B.D.; Alabi, O.D.; Kuipers, D.P.; Praamsma, R.C.; Wrobel, K.E.; Louters, L.L. Alkaline pH activates the transport activity of GLUT1 in L929 fibroblast cells. Biochimie 2014, 99, 189–194. [Google Scholar] [CrossRef] [PubMed]
- Rastogi, S.; Banerjee, S.; Chellappan, S.; Simon, G.R. Glut-1 antibodies induce growth arrest and apoptosis in human cancer cell lines. Cancer Lett. 2007, 257, 244–251. [Google Scholar] [CrossRef]
- Cho, S.J.; Moon, J.S.; Nikahira, K.; Yun, H.S.; Harris, R.; Hong, K.S.; Huang, H.; Choi, A.M.K.; Stout-Delgado, H. GLUT1-dependent glycolysis regulates exacerbation of fibrosis via AIM2 inflammasome activation. Thorax 2020, 75, 227–236. [Google Scholar] [CrossRef]
- Cho, S.J.; Moon, J.S.; Lee, C.M.; Choi, A.M.; Stout-Delgado, H.W. Glucose Transporter 1-Dependent Glycolysis Is Increased during Aging-Related Lung Fibrosis, and Phloretin Inhibits Lung Fibrosis. Am. J. Respir. Cell Mol. Biol. 2017, 56, 521–531. [Google Scholar] [CrossRef] [PubMed]
- Higuchi, M.; Honda, T.; Proske, R.J.; Yeh, E.T. Regulation of reactive oxygen species-induced apoptosis and necrosis by caspase 3-like proteases. Oncogene 1998, 17, 2753–2760. [Google Scholar] [CrossRef] [PubMed]
- Poyton, R.O.; Ball, K.A.; Castello, P.R. Mitochondrial generation of free radicals and hypoxic signaling. Trends Endocrinol. Metab. 2009, 20, 332–340. [Google Scholar] [CrossRef] [PubMed]
- Galloway, C.A.; Yoon, Y. Perspectives on: SGP symposium on mitochondrial physiology and medicine: What comes first, misshape or dysfunction? The view from metabolic excess. J. Gen. Physiol. 2012, 139, 455–463. [Google Scholar] [CrossRef] [PubMed]
- Cano Sanchez, M.; Lancel, S.; Boulanger, E.; Neviere, R. Targeting Oxidative Stress and Mitochondrial Dysfunction in the Treatment of Impaired Wound Healing: A Systematic Review. Antioxidants (Basel). 2018, 7, 98. [Google Scholar] [CrossRef] [PubMed]
- Hoffmann, M.H.; Griffiths, H.R. The dual role of Reactive Oxygen Species in autoimmune and inflammatory diseases: Evidence from preclinical models. Free Radic. Biol. Med. 2018, 125, 62–71. [Google Scholar] [CrossRef]
- Gouzos, M.; Ramezanpour, M.; Bassiouni, A.; Psaltis, A.J.; Wormald, P.J.; Vreugde, S. Antibiotics Affect ROS Production and Fibroblast Migration in an In-vitro Model of Sinonasal Wound Healing. Front. Cell. Infect. Microbiol. 2020, 10, 110. [Google Scholar] [CrossRef]
- Cheng, P.; Zhang, J.; Huang, J.; Miao, Q.; Xu, C.; Pu, K. Near-infrared fluorescence probes to detect reactive oxygen species for keloid diagnosis. Chem. Sci. 2018, 9, 6340–6347. [Google Scholar] [CrossRef]
- Kruger, N.J.; von Schaewen, A. The oxidative pentose phosphate pathway: Structure and organisation. Curr. Opin. Plant Biol. 2003, 6, 236–246. [Google Scholar] [CrossRef]
- Andrisse, S.; Koehler, R.M.; Chen, J.E.; Patel, G.D.; Vallurupalli, V.R.; Ratliff, B.A.; Warren, D.E.; Fisher, J.S. Role of GLUT1 in regulation of reactive oxygen species. Redox Biol. 2014, 2, 764–771. [Google Scholar] [CrossRef] [PubMed]
- Vinaik, R.; Barayan, D.; Auger, C.; Abdullahi, A.; Jeschke, M.G. Regulation of glycolysis and the Warburg effect in wound healing. JCI Insight 2020, 5, e138949. [Google Scholar] [CrossRef]
- Zhao, X.; Psarianos, P.; Ghoraie, L.S.; Yip, K.; Goldstein, D.; Gilbert, R.; Witterick, I.; Pang, H.; Hussain, A.; Lee, J.H.; et al. Metabolic regulation of dermal fibroblasts contributes to skin extracellular matrix homeostasis and fibrosis. Nat. Metab. 2019, 1, 147–157. [Google Scholar] [CrossRef]
- Wang, Q.; Wang, P.; Qin, Z.; Yang, X.; Pan, B.; Nie, F.; Bi, H. Altered glucose metabolism and cell function in keloid fibroblasts under hypoxia. Redox Biol. 2021, 38, 101815. [Google Scholar] [CrossRef] [PubMed]
- Su, Z.; Jiao, H.; Fan, J.; Liu, L.; Tian, J.; Gan, C.; Yang, Z.; Zhang, T.; Chen, Y. Warburg effect in keloids: A unique feature different from other types of scars. Burns 2021, S0305–4179, 00073–00075. [Google Scholar]
- Liao, W.T.; Yu, H.S.; Arbiser, J.L.; Hong, C.H.; Govindarajan, B.; Chai, C.Y.; Shan, W.J.; Lin, Y.F.; Chen, G.S.; Lee, C.H. Enhanced MCP-1 release by keloid CD14+ cells augments fibroblast proliferation: Role of MCP-1 and Akt pathway in keloids. Exp. Dermatol. 2010, 19, e142–e150. [Google Scholar]
- Lv, W.; Wu, M.; Ren, Y.; Luo, X.; Hu, W.; Zhang, Q.; Wu, Y. Treatment of keloids through Runx2 siRNA-induced inhibition of the PI3K/AKT signaling pathway. Mol. Med. Rep. 2021, 23, 55. [Google Scholar] [CrossRef]
- Hamanaka, R.B.; Chandel, N.S. Targeting glucose metabolism for cancer therapy. J. Exp. Med. 2012, 209, 211–215. [Google Scholar] [CrossRef]


| Subject | Age (Years) | Sex | Body Site | Duration | Ethnicity |
|---|---|---|---|---|---|
| Keloid 1 | 50 | Male | Chest | 2 years | Han |
| Keloid 2 | 58 | Male | Chest | 3 years | Han |
| Keloid 3 | 44 | Female | Chest | 2 years | Han |
| Keloid 4 | 65 | Male | Chest | 4 years | Han |
| Keloid 5 | 22 | Female | Ear | 3 years | Han |
| Keloid 6 | 26 | Female | Shoulder | 10 years | Han |
| Control 1 | 37 | Male | Elbow | NA 1 | Han |
| Control 2 | 51 | Female | Inguinal area | NA | Han |
| Control 3 | 24 | Female | Buttock | NA | Han |
| Control 4 | 41 | Female | Forearm | NA | Han |
| Control 5 | 45 | Male | Cheek | NA | Han |
| Control 6 | 45 | Male | Chest | NA | Han |
| Gene | Sequences (5′-3′) |
|---|---|
| GLUT-1 | F: TGG CTC CGG TAT CGT CAA C R: GCT CGC TCC ACC ACA AAC A |
| Hexokinase | F: TGA AAA TCC GTA GTG GGA AAA AG R: TCA ATA GGA ATG GCG TAG ATC TTG |
| Phosphoglucose isomerase (GPI) | F: CCC AGG AGA CCA TCA CGA AT R: GCC GCC TGG AGA AAC CA |
| Phophofructokinase (PFK) | F: GCT GTA TTC AGA AGA GGG CAA AG R: GCA TGT GAC CCA GCA CGT T |
| Aldolase | F: CTC TAC CAG AAG GCG GAT GAT G R: AAC ACC GCC CTT GGA TTT G |
| Glyceraldehyde 3-phosphate dehydrogenase (GAPDH) | F: TGC ACC ACC AAC TGC TTA GC R: GGC ATG GAC TGT GGT CAT |
| Pyruvate kinase M2 (PKM2) | F: CCA TAA TCG TCC TCA CCA AGT CT R: GCA CGT GGG CGG TAT CTG |
| Pyruvate dehydrogenase kinase 1 (PDK1) | F: GCC TCT GGC TGG TTT TGG T R: CCT TGG AAG TAT TGT GCG TAA AGA |
| Lactate dehydrogenase (LDH) | F: GAG AGC ATG GCG ACT CAA GTG R: GGG ACG CCA GCA ATG TTC |
| β-actin | F: GAT GAG ATT GGC ATG GCT TT R: GTC ACC TTC ACC GTT CCA GT |
Publisher’s Note: MDPI stays neutral with regard to jurisdictional claims in published maps and institutional affiliations. |
© 2021 by the authors. Licensee MDPI, Basel, Switzerland. This article is an open access article distributed under the terms and conditions of the Creative Commons Attribution (CC BY) license (https://creativecommons.org/licenses/by/4.0/).
Share and Cite
Lu, Y.-Y.; Wu, C.-H.; Hong, C.-H.; Chang, K.-L.; Lee, C.-H. GLUT-1 Enhances Glycolysis, Oxidative Stress, and Fibroblast Proliferation in Keloid. Life 2021, 11, 505. https://doi.org/10.3390/life11060505
Lu Y-Y, Wu C-H, Hong C-H, Chang K-L, Lee C-H. GLUT-1 Enhances Glycolysis, Oxidative Stress, and Fibroblast Proliferation in Keloid. Life. 2021; 11(6):505. https://doi.org/10.3390/life11060505
Chicago/Turabian StyleLu, Ying-Yi, Chieh-Hsin Wu, Chien-Hui Hong, Kee-Lung Chang, and Chih-Hung Lee. 2021. "GLUT-1 Enhances Glycolysis, Oxidative Stress, and Fibroblast Proliferation in Keloid" Life 11, no. 6: 505. https://doi.org/10.3390/life11060505
APA StyleLu, Y.-Y., Wu, C.-H., Hong, C.-H., Chang, K.-L., & Lee, C.-H. (2021). GLUT-1 Enhances Glycolysis, Oxidative Stress, and Fibroblast Proliferation in Keloid. Life, 11(6), 505. https://doi.org/10.3390/life11060505