
Development of a New Risk Score for Stratification of Women with Gestational Diabetes Mellitus at High Risk of Persisting Postpartum Glucose Intolerance Using Routinely Assessed Parameters

 , , , and
Abstract
1. Introduction
2. Materials and Methods
2.1. Subjects
2.2. Methods
2.3. Statistical Analysis
3. Results
3.1. Predictive Factors for Persistence of Glucose Intolerance Postpartum
3.2. Evaluation of Adverse Peripartal Outcomes
3.3. Risk Stratification
4. Discussion
5. Conclusions
Author Contributions
Funding
Institutional Review Board Statement
Informed Consent Statement
Data Availability Statement
Acknowledgments
Conflicts of Interest
References
- American Diabetes Association. Classification and Diagnosis of Diabetes: Standards of Medical Care in Diabetes—2019. Diabetes Care 2019, 42, S13–S28. [Google Scholar] [CrossRef]
- Zhu, Y.; Zhang, C. Prevalence of Gestational Diabetes and Risk of Progression to Type 2 Diabetes: A Global Perspective. Curr. Diabetes Rep. 2016, 16, 7. [Google Scholar] [CrossRef] [PubMed]
- Huang, Y. IDF Diabetes Atlas, 8th ed.; Suvi, K., da Rocha, F.J., Yadi, H., Belma, M., Eds.; International Diabetes Federation: London, UK, 2017. [Google Scholar]
- Bellamy, L.; Casas, J.-P.; Hingorani, A.; Williams, D. Type 2 diabetes mellitus after gestational diabetes: A systematic review and meta-analysis. Lancet 2009, 373, 1773–1779. [Google Scholar] [CrossRef]
- Kim, C.; Newton, K.M.; Knopp, R.H. Gestational Diabetes and the Incidence of Type 2 Diabetes: A systematic review. Diabetes Care 2002, 25, 1862–1868. [Google Scholar] [CrossRef] [PubMed]
- Metzger, B.E.; Gabbe, S.G.; Persson, B.; Buchanan, T.A.; Catalano, P.A.; Damm, P.; Dyer, A.R.; Leiva, A.; Hod, M.; Kitzmiler, J.L.; et al. International association of diabetes and pregnancy study groups recommendations on the diagnosis and classification of hyperglycemia in pregnancy. Diabetes Care 2010, 33, 676–682. [Google Scholar] [CrossRef]
- Newbern, D.; Freemark, M. Placental hormones and the control of maternal metabolism and fetal growth. Curr. Opin. Endocrinol. Diabetes Obes. 2011, 18, 409–416. [Google Scholar] [CrossRef]
- Nadal, A.; Alonso-Magdalena, P.; Soriano, S.; Ropero, A.B.; Quesada, I. The role of oestrogens in the adaptation of islets to insulin resistance. J. Physiol. 2009, 587, 5031–5037. [Google Scholar] [CrossRef] [PubMed]
- Plows, J.F.; Stanley, J.L.; Baker, P.N.; Reynolds, C.M.; Vickers, M.H. The Pathophysiology of Gestational Diabetes Mellitus. Int. J. Mol. Sci. 2018, 19, 3342. [Google Scholar] [CrossRef] [PubMed]
- White, S.L.; Begum, S.; Vieira, M.C.; Seed, P.; Lawlor, D.L.; Sattar, N.; Nelson, S.M.; Welsh, P.; Pasupathy, D.; Poston, L.; et al. Metabolic phenotyping by treatment modality in obese women with gestational diabetes suggests diverse pathophysiology: An exploratory study. PLoS ONE 2020, 15, e0230658. [Google Scholar] [CrossRef]
- World Health Organization. Definition, Diagnosis and Classification of Diabetes Mellitus and Its Complications; WHO: Geneva, Switzerland, 2013. [Google Scholar]
- Matthews, J.N.; Altman, D.G.; Campbell, M.J.; Royston, P. Analysis of serial measurements in medical research. BMJ 1990, 300, 230–235. [Google Scholar] [CrossRef]
- Delong, E.R.; Delong, D.M.; Clarke-Pearson, D.L. Comparing the Areas under Two or More Correlated Receiver Operating Characteristic Curves: A Nonparametric Approach. Biometrics 1988, 44, 837–845. [Google Scholar] [CrossRef] [PubMed]
- Youden, W.J. Index for rating diagnostic tests. Cancer 1950, 3, 32–35. [Google Scholar] [CrossRef]
- Ekelund, M.; Shaat, N.; Almgren, P.; Groop, L.; Berntorp, K. Prediction of postpartum diabetes in women with gestational diabetes mellitus. Diabetologia 2010, 53, 452–457. [Google Scholar] [CrossRef]
- Vambergue, A.; Dognin, C.; Boulogne, A.; Réjou, M.C.; Biausque, S.; Fontaine, P. Increasing incidence of abnormal glucose tolerance in women with prior abnormal glucose tolerance during pregnancy: DIAGEST 2 study. Diabet. Med. 2008, 25, 58–64. [Google Scholar] [CrossRef] [PubMed]
- Retnakaran, R.; Qi, Y.; Sermer, M.; Connelly, P.W.; Hanley, A.J.; Zinman, B. Glucose Intolerance in Pregnancy and Future Risk of Pre-Diabetes or Diabetes. Diabetes Care 2008, 31, 2026–2031. [Google Scholar] [CrossRef]
- Ingram, E.R.; Robertson, I.K.; Ogden, K.J.; Dennis, A.E.; Campbell, J.E.; Corbould, A.M. Utility of antenatal clinical factors for prediction of postpartum outcomes in women with gestational diabetes mellitus (GDM). Aust. N. Z. J. Obstet. Gynaecol. 2017, 57, 272–279. [Google Scholar] [CrossRef]
- Su, X.; Zhang, Z.; Qu, X.; Tian, Y.; Zhang, G. Hemoglobin A1c for Diagnosis of Postpartum Abnormal Glucose Tolerance among Women with Gestational Diabetes Mellitus: Diagnostic Meta-Analysis. PLoS ONE 2014, 9, e102144. [Google Scholar] [CrossRef]
- Claesson, R.; Ignell, C.; Shaat, N.; Berntorp, K. HbA1c as a predictor of diabetes after gestational diabetes mellitus. Prim. Care Diabetes 2017, 11, 46–51. [Google Scholar] [CrossRef]
- Wang, P.; Lu, M.-C.; Yan, Y.-H. Abnormal glucose tolerance is associated with preterm labor and increased neonatal complications in Taiwanese women. Taiwan J. Obstet. Gynecol. 2013, 52, 479–484. [Google Scholar] [CrossRef][Green Version]
- Brankica, K.; Valentina, V.N.; Slagjana, S.K.; Sasha, J.M. Maternal 75-g OGTT glucose levels as predictive factors for large-for-gestational age newborns in women with gestational diabetes mellitus. Arch. Endocrinol. Metab. 2016, 60, 36–41. [Google Scholar] [CrossRef]
- Ferrara, A.; Peng, T.; Kim, C. Trends in Postpartum Diabetes Screening and Subsequent Diabetes and Impaired Fasting Glucose Among Women with Histories of Gestational Diabetes Mellitus: A report from the Translating Research into Action for Diabetes (TRIAD) Study. Diabetes Care 2009, 32, 269–274. [Google Scholar] [CrossRef]
- Keely, E. An opportunity not to be missed—How do we improve postpartum screening rates for women with gestational diabetes? Diabetes Metab. Res. Rev. 2012, 28, 312–316. [Google Scholar] [CrossRef] [PubMed]
- Köhler, M.; Ziegler, A.G.; Beyerlein, A. Development of a simple tool to predict the risk of postpartum diabetes in women with gestational diabetes mellitus. Acta Diabetol. 2016, 53, 433–437. [Google Scholar] [CrossRef] [PubMed]
- Bartáková, V.; Malúšková, D.; Muzik, J.; Bělobrádková, J.; Kaňková, K. Possibility to predict early postpartum glucose abnormality following gestational diabetes mellitus based on the results of routine mid-gestational screening. Biochem. Med. 2015, 25, 460–468. [Google Scholar] [CrossRef] [PubMed][Green Version]


| Parameter | Normalised oGTT after Delivery (n = 222) | Prediabetes/Diabetes after Delivery (n = 22) | p |
|---|---|---|---|
| Age (years) | 32 (30–35) | 32 (28–34) | NS |
| Primiparity | 45% | 36.4% | NS |
| Child birth weight (g) | 3185 (2920–3500) | 3360 (3030–3630) | NS |
| Insulin (intensive mode) | 36.5% (79%) | 45.5% (90%) | NS |
| Pre-gestational BMI (kg/m2) | 24.7 (21.7–28.3) | 24 (20.4–32.7) | NS |
| Weight increment up to mid trimester (kg) | 6.8 (4–9) | 6.5 (4–8) | NS |
| Total weight increment during pregnancy (kg) | 8 (5.8–10) | 9 (6–11) | NS |
| Systolic blood pressure in mid trimester (mmHg) | 114 (105–125) | 124 (112–128) | NS |
| Diastolic blood pressure in mid trimester (mmHg) | 74 (68–81) | 79 (69–87) | NS |
| HbA1c (mmol/mol) | 33 (31–36) | 35 (32–36) | NS |
| HbA1c > 42 mmol/mol | 1.8% | 9.1% | 0.035 |
| oGTT fasting plasma glucose in mid trimester (mmol/L) | 4.7 (4.4–5.0) | 5.3 (4.8–6.1) | <0.001 |
| oGTT 1-h post-75 g load in mid trimester (mmol/L) | 9.4 (9.0–10.0) | 8.3 (8.2–8.8) | NS |
| oGTT 2-h post-75 g load in md trimester (mmol/L) | 8.2 (7.7–8.9) | 8.1 (7.8–9.2) | NS |
| AUC calculated from a 3-point oGTT in mid-trimester | 13.0 (12.3–13.6) | 13.6 (12.8–14.6) | 0.025 |
| oGTT fasting plasma glucose postpartum (mmol/L) | 4.6 (4.4–4.9) | 5.7 (5.1–5.8) | <0.001 |
| oGTT 1-h post-75 g load postpartum (mmol/L) | 6.7 (5.4–7.9) | 7.9 (6.7–10.1) | 0.048 |
| oGTT 2-h post-75 g load postpartum (mmol/L) | 5.0 (4.3–5.8) | 7.7 (6.1–8.3) | <0.001 |
| Parameter | Normalised oGTT after Delivery (n = 222) | Prediabetes/Diabetes after Delivery (n = 22) | p |
|---|---|---|---|
| Diabetes mellitus in family anamnesis | 68.9% | 95.5% | 0.0087 |
| Smoker or stop-smoker | 17.6% | 36.4% | 0.033 |
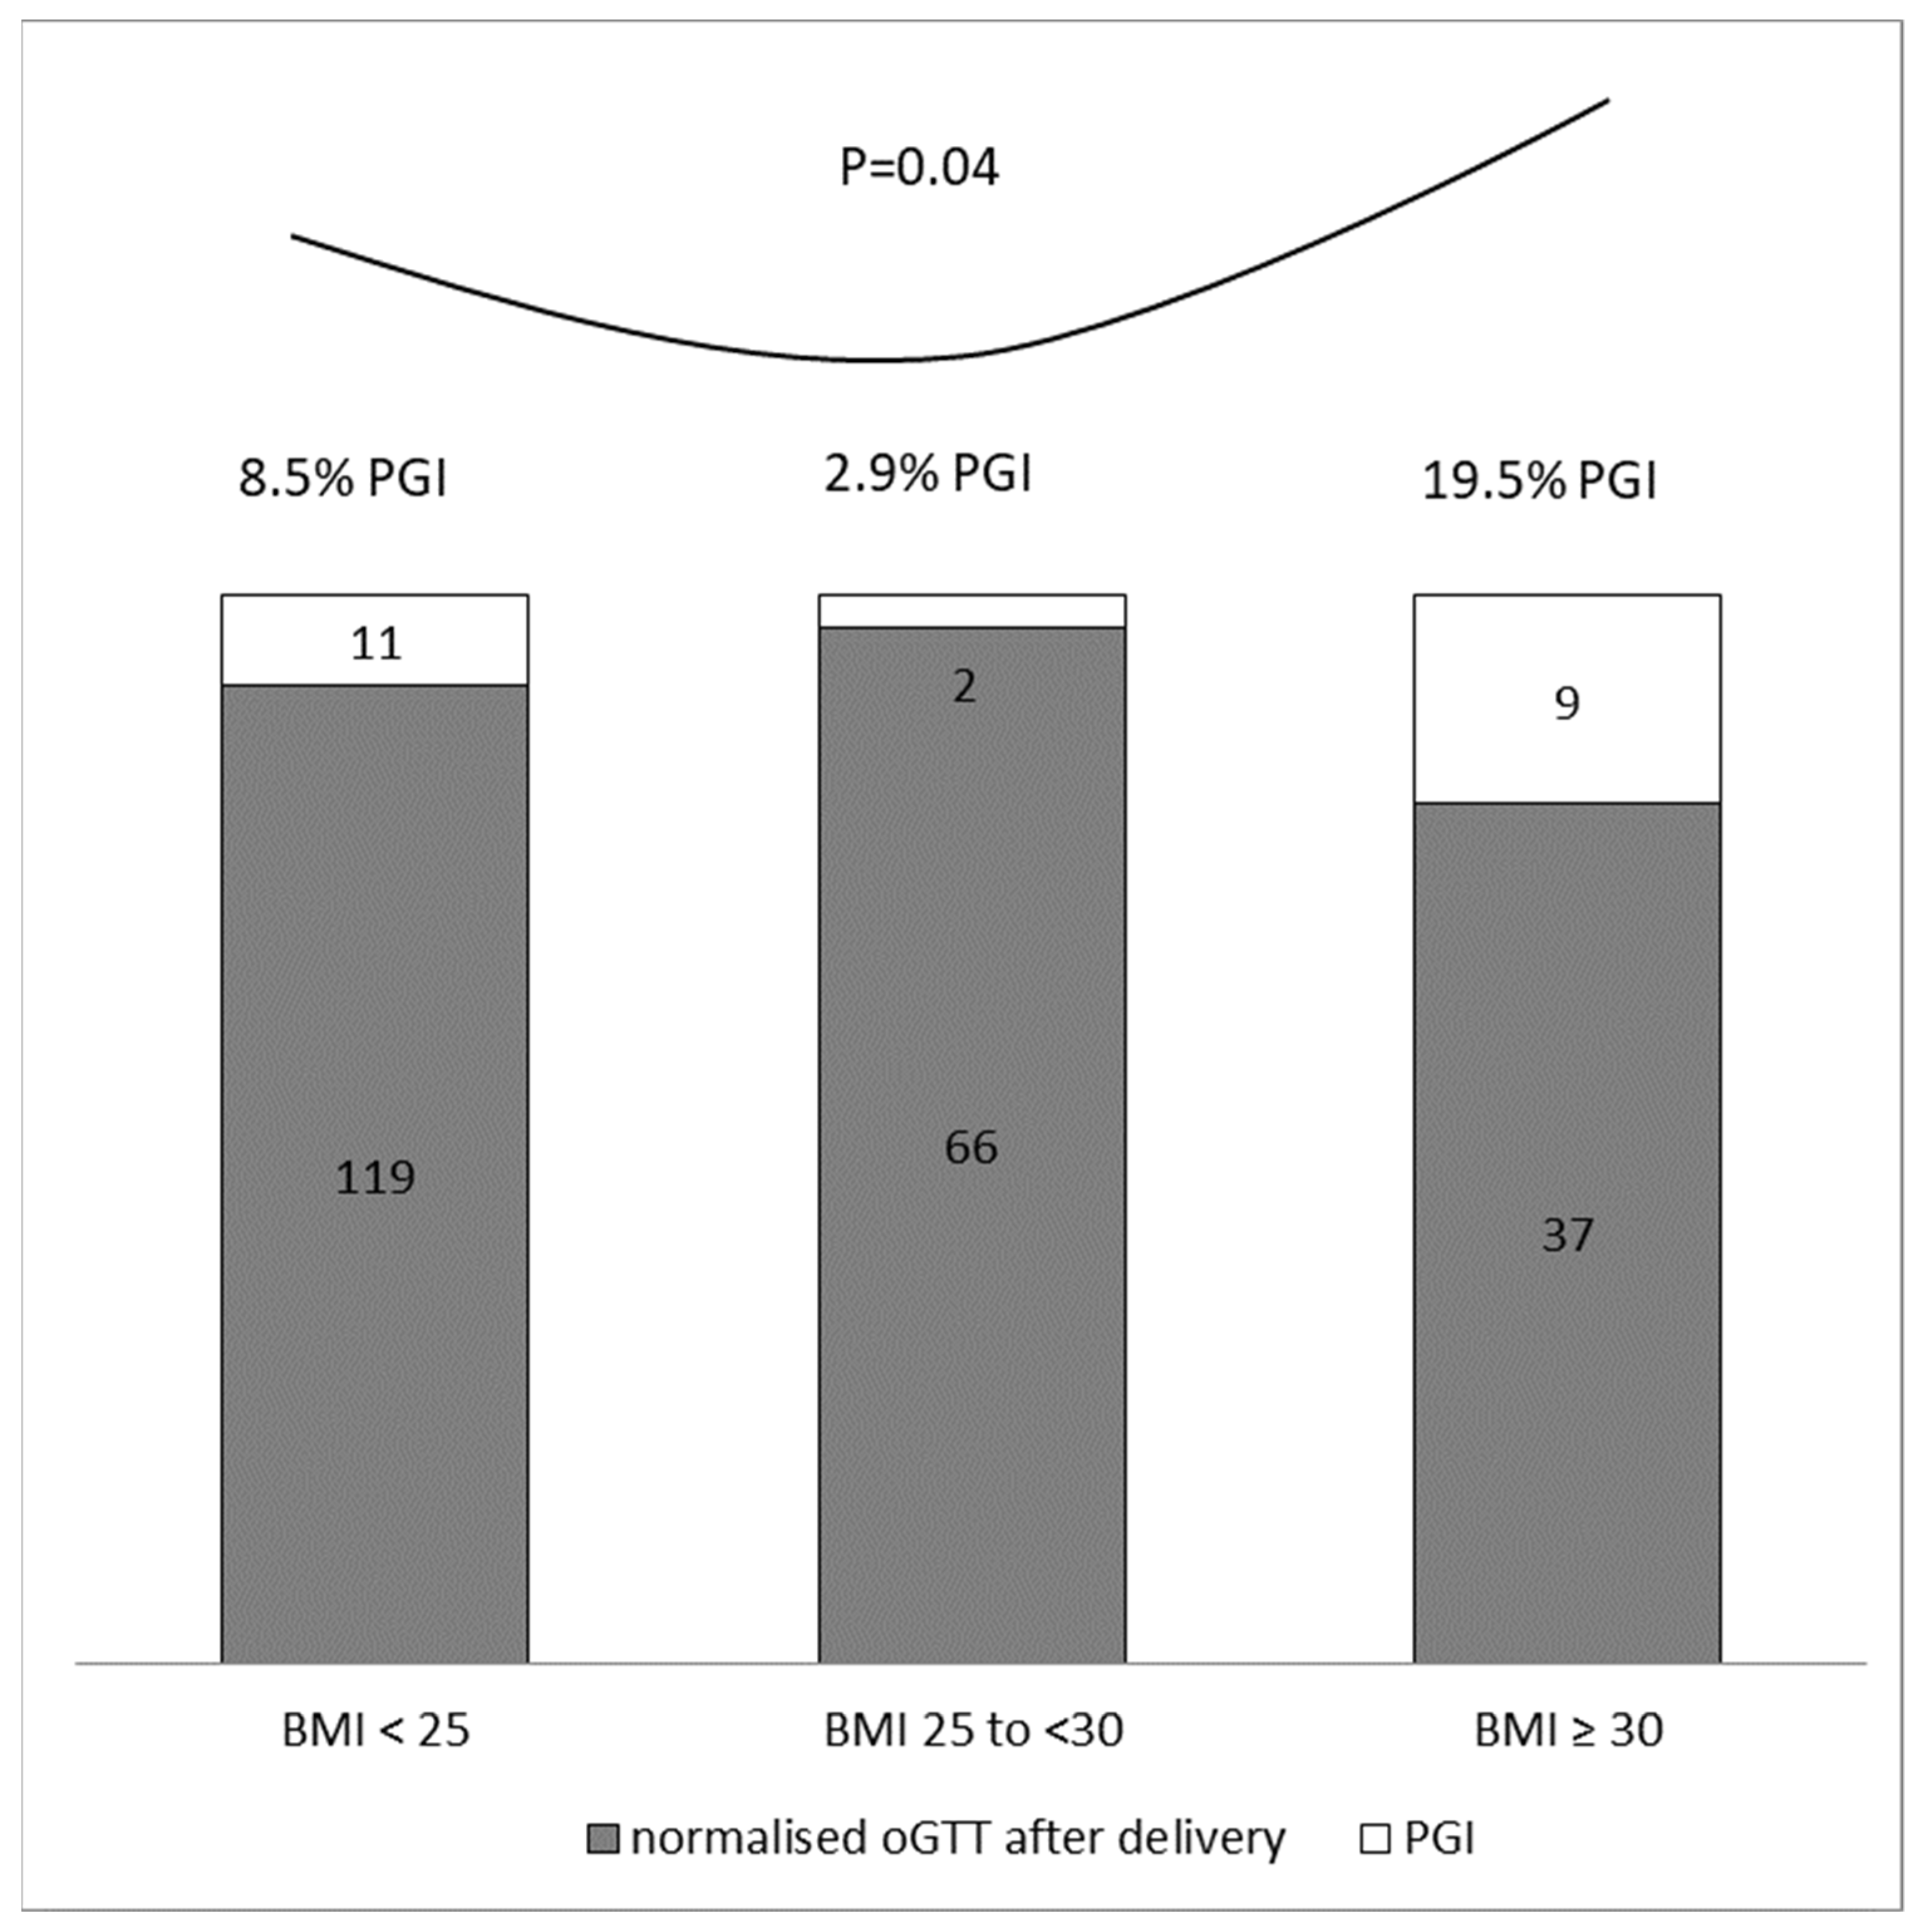
| Obesity (BMI ≥ 30 kg/m2) | 17.1% | 40.9% | 0.007 |
| Hypothyroidism * | 13.1% | 31.8% | 0.018 |
| Preeclampsia/hypertension | 9% | 18.2% | NS |
| Polycystic ovary syndrome * | 1.4% | 0% | NS |
| Thrombophilia * | 5.4% | 9.1% | NS |
| Anaemia * | 14.9% | 13.6% | NS |
| Allergy * | 35.1% | 31.8% | NS |
| Polymorbidity (≥3 illnesses incl. GDM) | 32.9% | 63.6% | 0.004 |
| Parameter | Cut off According to Youden Index a | AUCROC | 95% CI b | p |
|---|---|---|---|---|
| oGTT fasting plasma glucose in mid trimester (mmol/L) | >5.1 | 0.757 | 0.698–0.810 | < 0.001 |
| oGTT 1-h post-75 g load in mid trimester (mmol/L) | >8.8 | 0.719 | 0.606–0.814 | 0.231 |
| oGTT 2-h post-75 g load in mid trimester (mmol/L) | >7.6 | 0.570 | 0.504–0.634 | 0.361 |
| HbA1c (mmol/mol) | >33.0 | 0.602 | 0.538–0.664 | 0.087 |
| Pre-gestational BMI (kg/m2) | >28.9 | 0.502 | 0.437–0.566 | 0.985 |
| AUC calculated from a 3-point oGTT in mid-trimester | >13.5 | 0.668 | 0.604–0.728 | 0.011 |
| Parameter | Normalised oGTT after Delivery (n = 169) | Prediabetes/Diabetes after Delivery (n = 18) | p |
|---|---|---|---|
| Macrosomia (child birth weight above 4000 g) | 15.4% | 22.2% | NS |
| Pre-term delivery (before 38th week of gestation) | 8.9% | 11.1% | NS |
| Delivery induction (using oxytocin or prostaglandin E) | 41.4% | 16.7% | 0.037 |
| Non-physiologic delivery (caesarean section, VEX using, forceps using) | 25.4% | 55.6% | 0.007 |
| Prolonged delivery (=above 480 min) | 18.3% | 38.9% | 0.04 |
| Complications after delivery (manual extraction of placenta, hypotonia uteri) | 5.9% | 5.6% | NS |
| Abnormal Apgar score (in 5th min <5) | 1.8% | 5.6% | NS |
| Abnormal cord blood pH (<7.1) | 0.6% | 5.6% | NS |
| Abnormal BE (<−12) | 1.2% | 5.6% | NS |
Publisher’s Note: MDPI stays neutral with regard to jurisdictional claims in published maps and institutional affiliations. |
© 2021 by the authors. Licensee MDPI, Basel, Switzerland. This article is an open access article distributed under the terms and conditions of the Creative Commons Attribution (CC BY) license (https://creativecommons.org/licenses/by/4.0/).
Share and Cite
Bartáková, V.; Barátová, B.; Pácal, L.; Ťápalová, V.; Šebestová, S.; Janků, P.; Kaňková, K. Development of a New Risk Score for Stratification of Women with Gestational Diabetes Mellitus at High Risk of Persisting Postpartum Glucose Intolerance Using Routinely Assessed Parameters. Life 2021, 11, 464. https://doi.org/10.3390/life11060464
Bartáková V, Barátová B, Pácal L, Ťápalová V, Šebestová S, Janků P, Kaňková K. Development of a New Risk Score for Stratification of Women with Gestational Diabetes Mellitus at High Risk of Persisting Postpartum Glucose Intolerance Using Routinely Assessed Parameters. Life. 2021; 11(6):464. https://doi.org/10.3390/life11060464
Chicago/Turabian StyleBartáková, Vendula, Beáta Barátová, Lukáš Pácal, Veronika Ťápalová, Silvie Šebestová, Petr Janků, and Kateřina Kaňková. 2021. "Development of a New Risk Score for Stratification of Women with Gestational Diabetes Mellitus at High Risk of Persisting Postpartum Glucose Intolerance Using Routinely Assessed Parameters" Life 11, no. 6: 464. https://doi.org/10.3390/life11060464
APA StyleBartáková, V., Barátová, B., Pácal, L., Ťápalová, V., Šebestová, S., Janků, P., & Kaňková, K. (2021). Development of a New Risk Score for Stratification of Women with Gestational Diabetes Mellitus at High Risk of Persisting Postpartum Glucose Intolerance Using Routinely Assessed Parameters. Life, 11(6), 464. https://doi.org/10.3390/life11060464