
Rice Transcriptome Analysis Reveals Nitrogen Starvation Modulates Differential Alternative Splicing and Transcript Usage in Various Metabolism-Related Genes


Abstract
1. Introduction
2. Materials and Methods
2.1. Prefetch and Preliminary Analysis of Transcriptome Data
2.2. Bioinformatics Analysis for Differential Expression of Genes and Transcripts
2.3. Gene Ontology Functional Enrichment Analysis
2.4. Isoform Switch Analysis in 3D-RNA-Seq Pipeline
2.5. Alternative Splicing (AS) Transcriptional Landscape Visualization
3. Results
3.1. Normalization and Principal Component Analysis (PCA) of Transcriptome Data
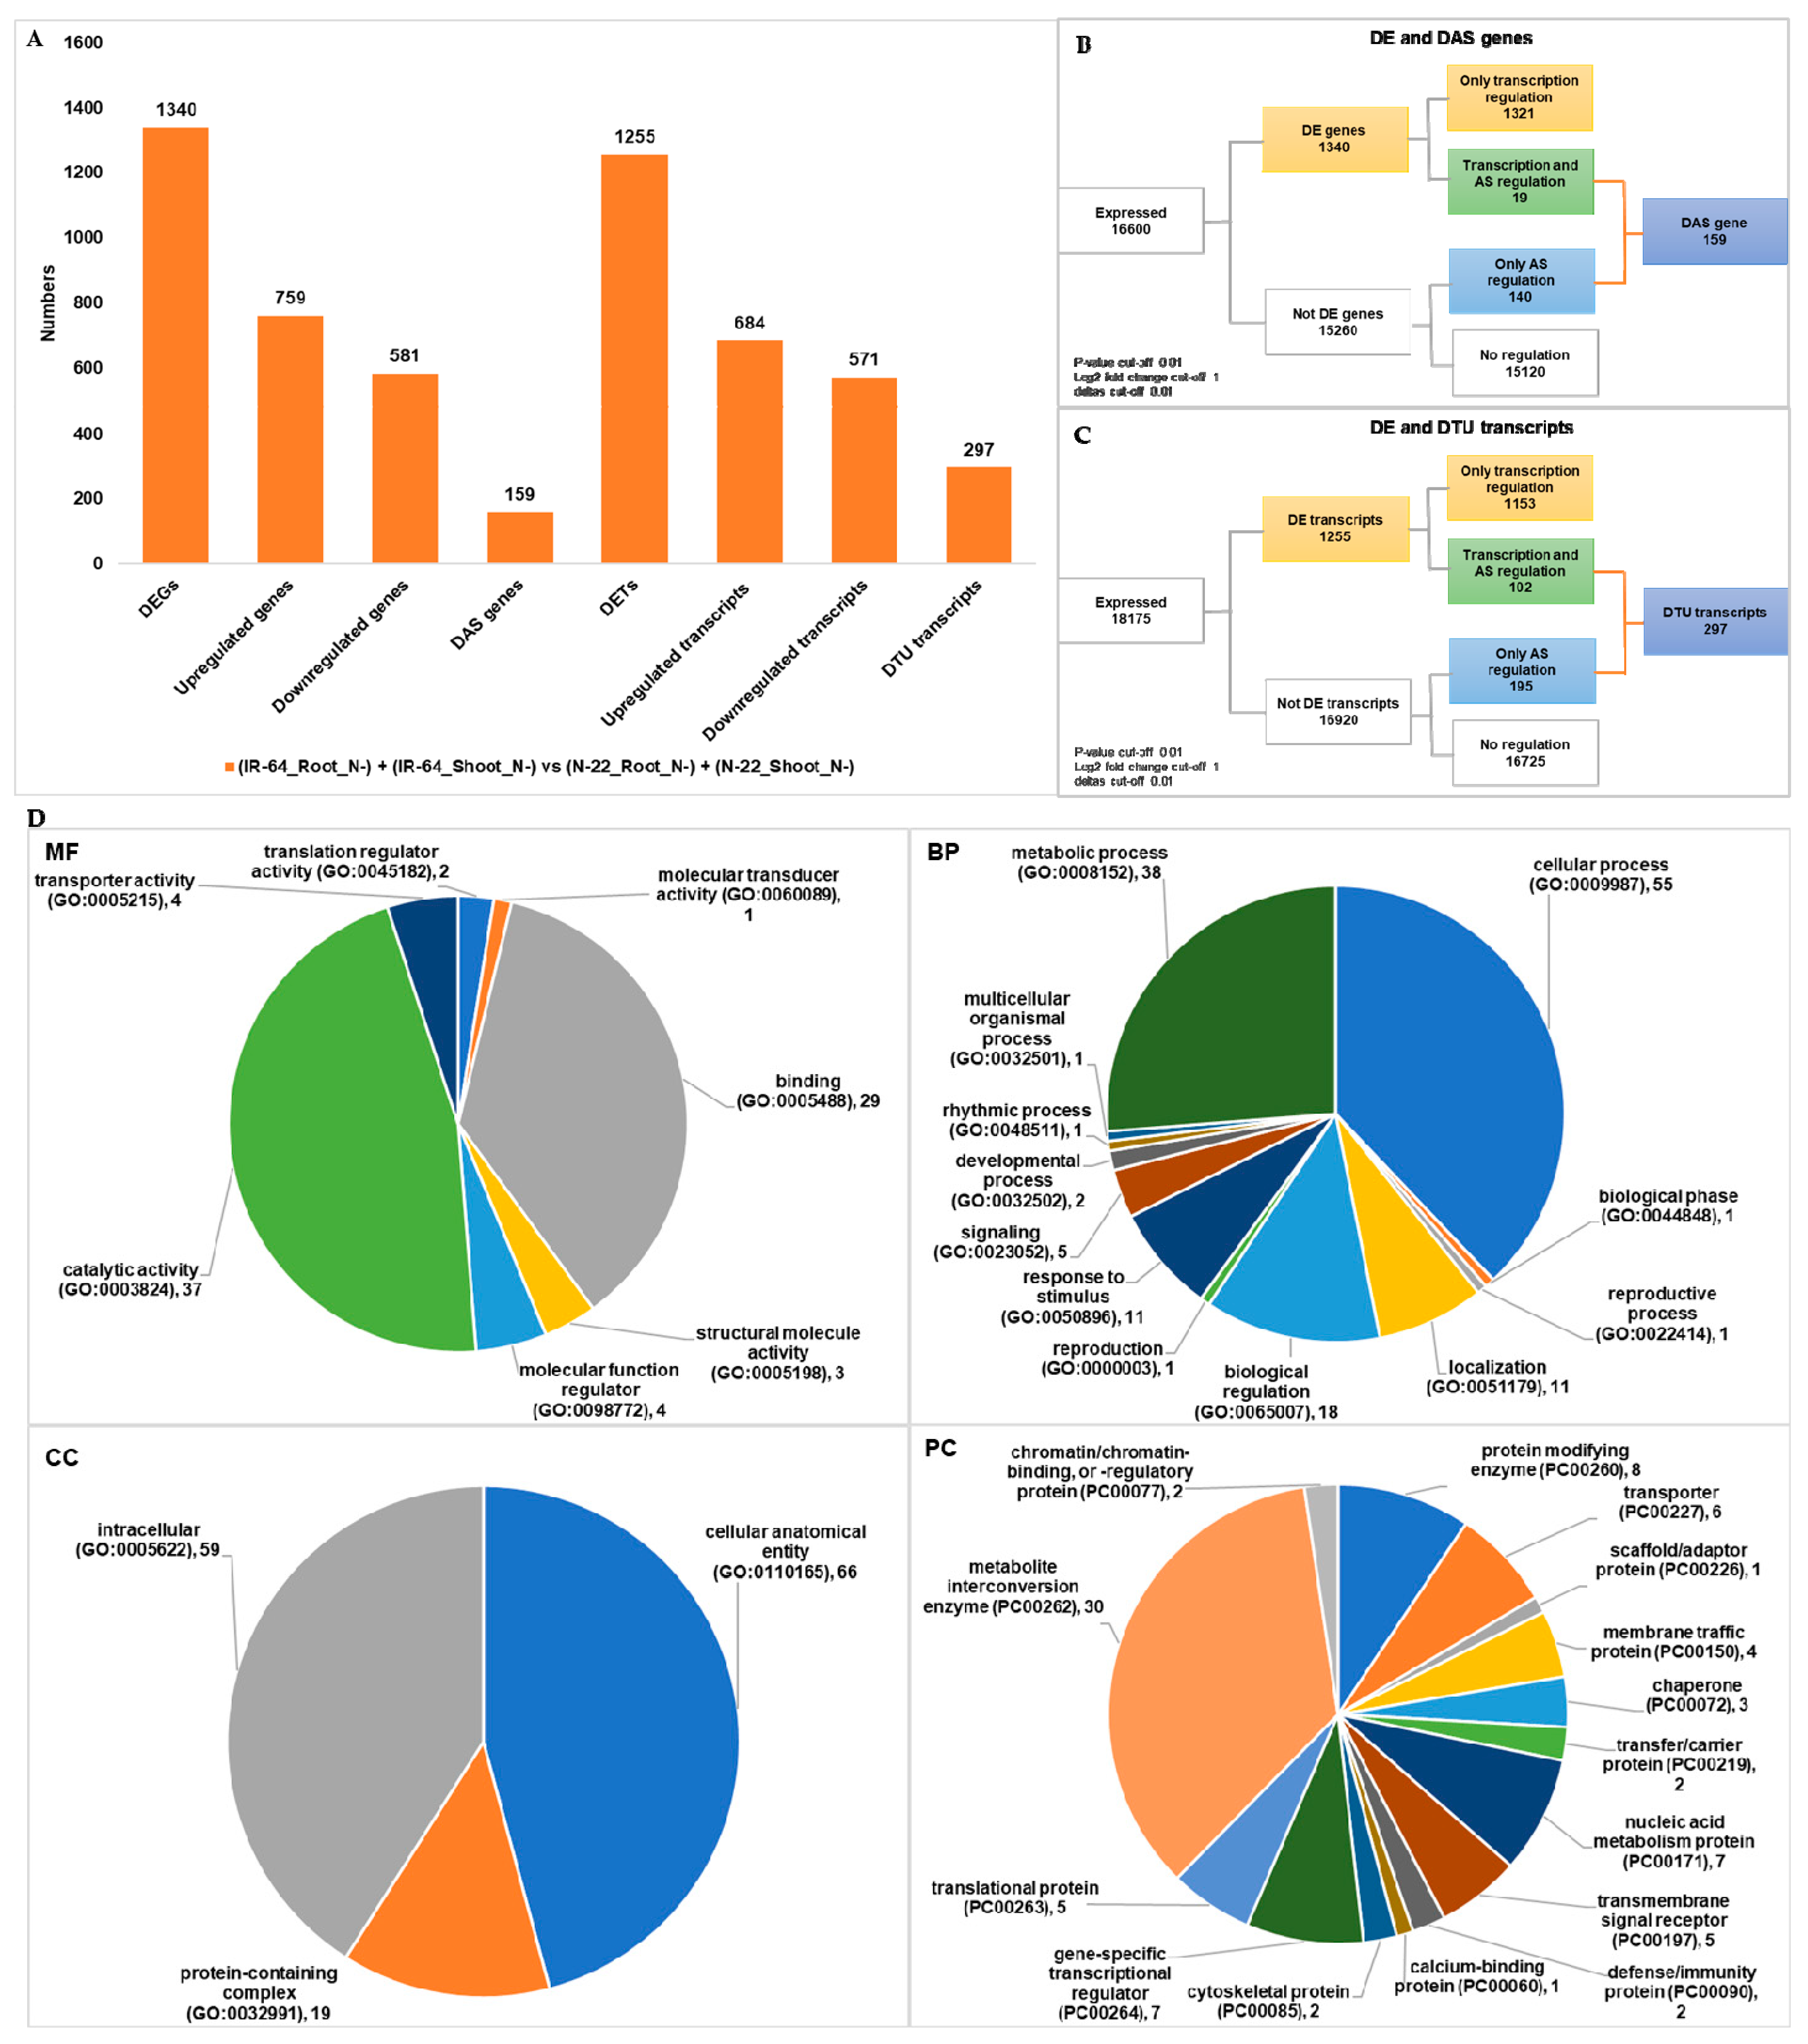
3.2. Genotype Dependent Differentially Expressed Genes/Transcripts, Alternative Spliced (DAS) Genes and Transcripts Usage (DTU) Transcripts
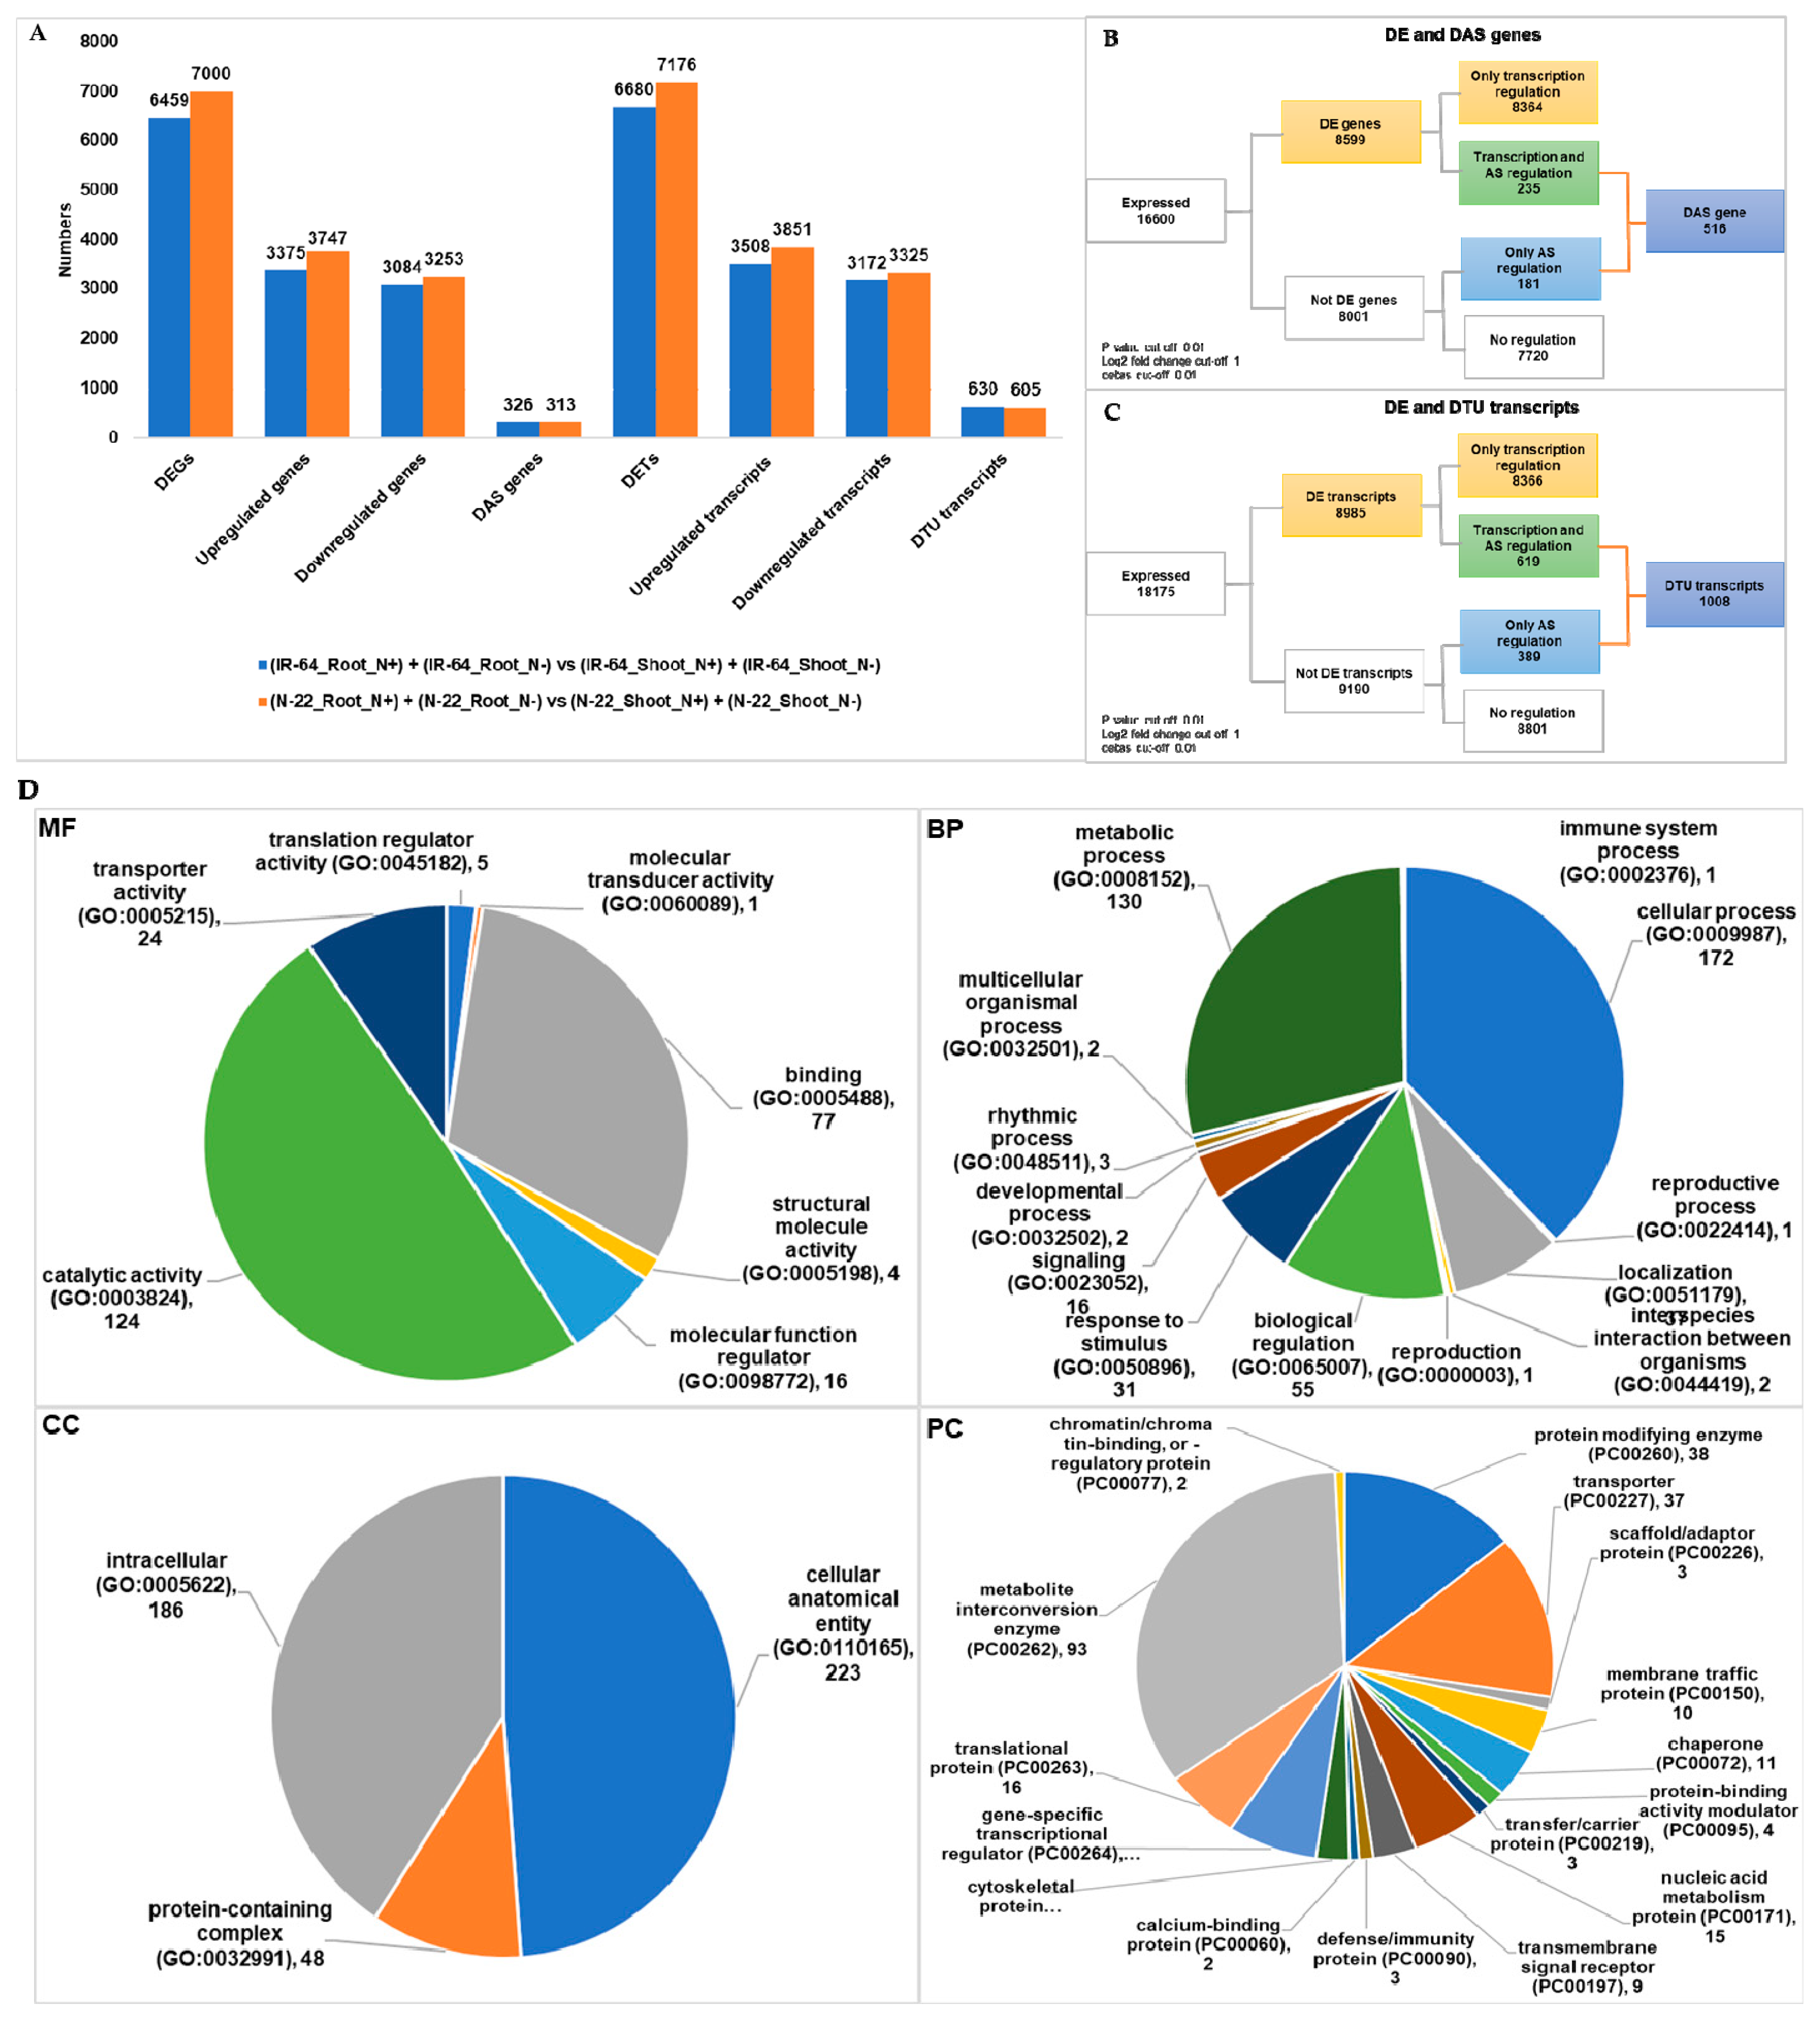
3.3. Tissue Dependent Differentially Expressed Genes/Transcripts, Alternative Spliced (DAS) Genes and Transcripts Usage (DTU) Transcripts
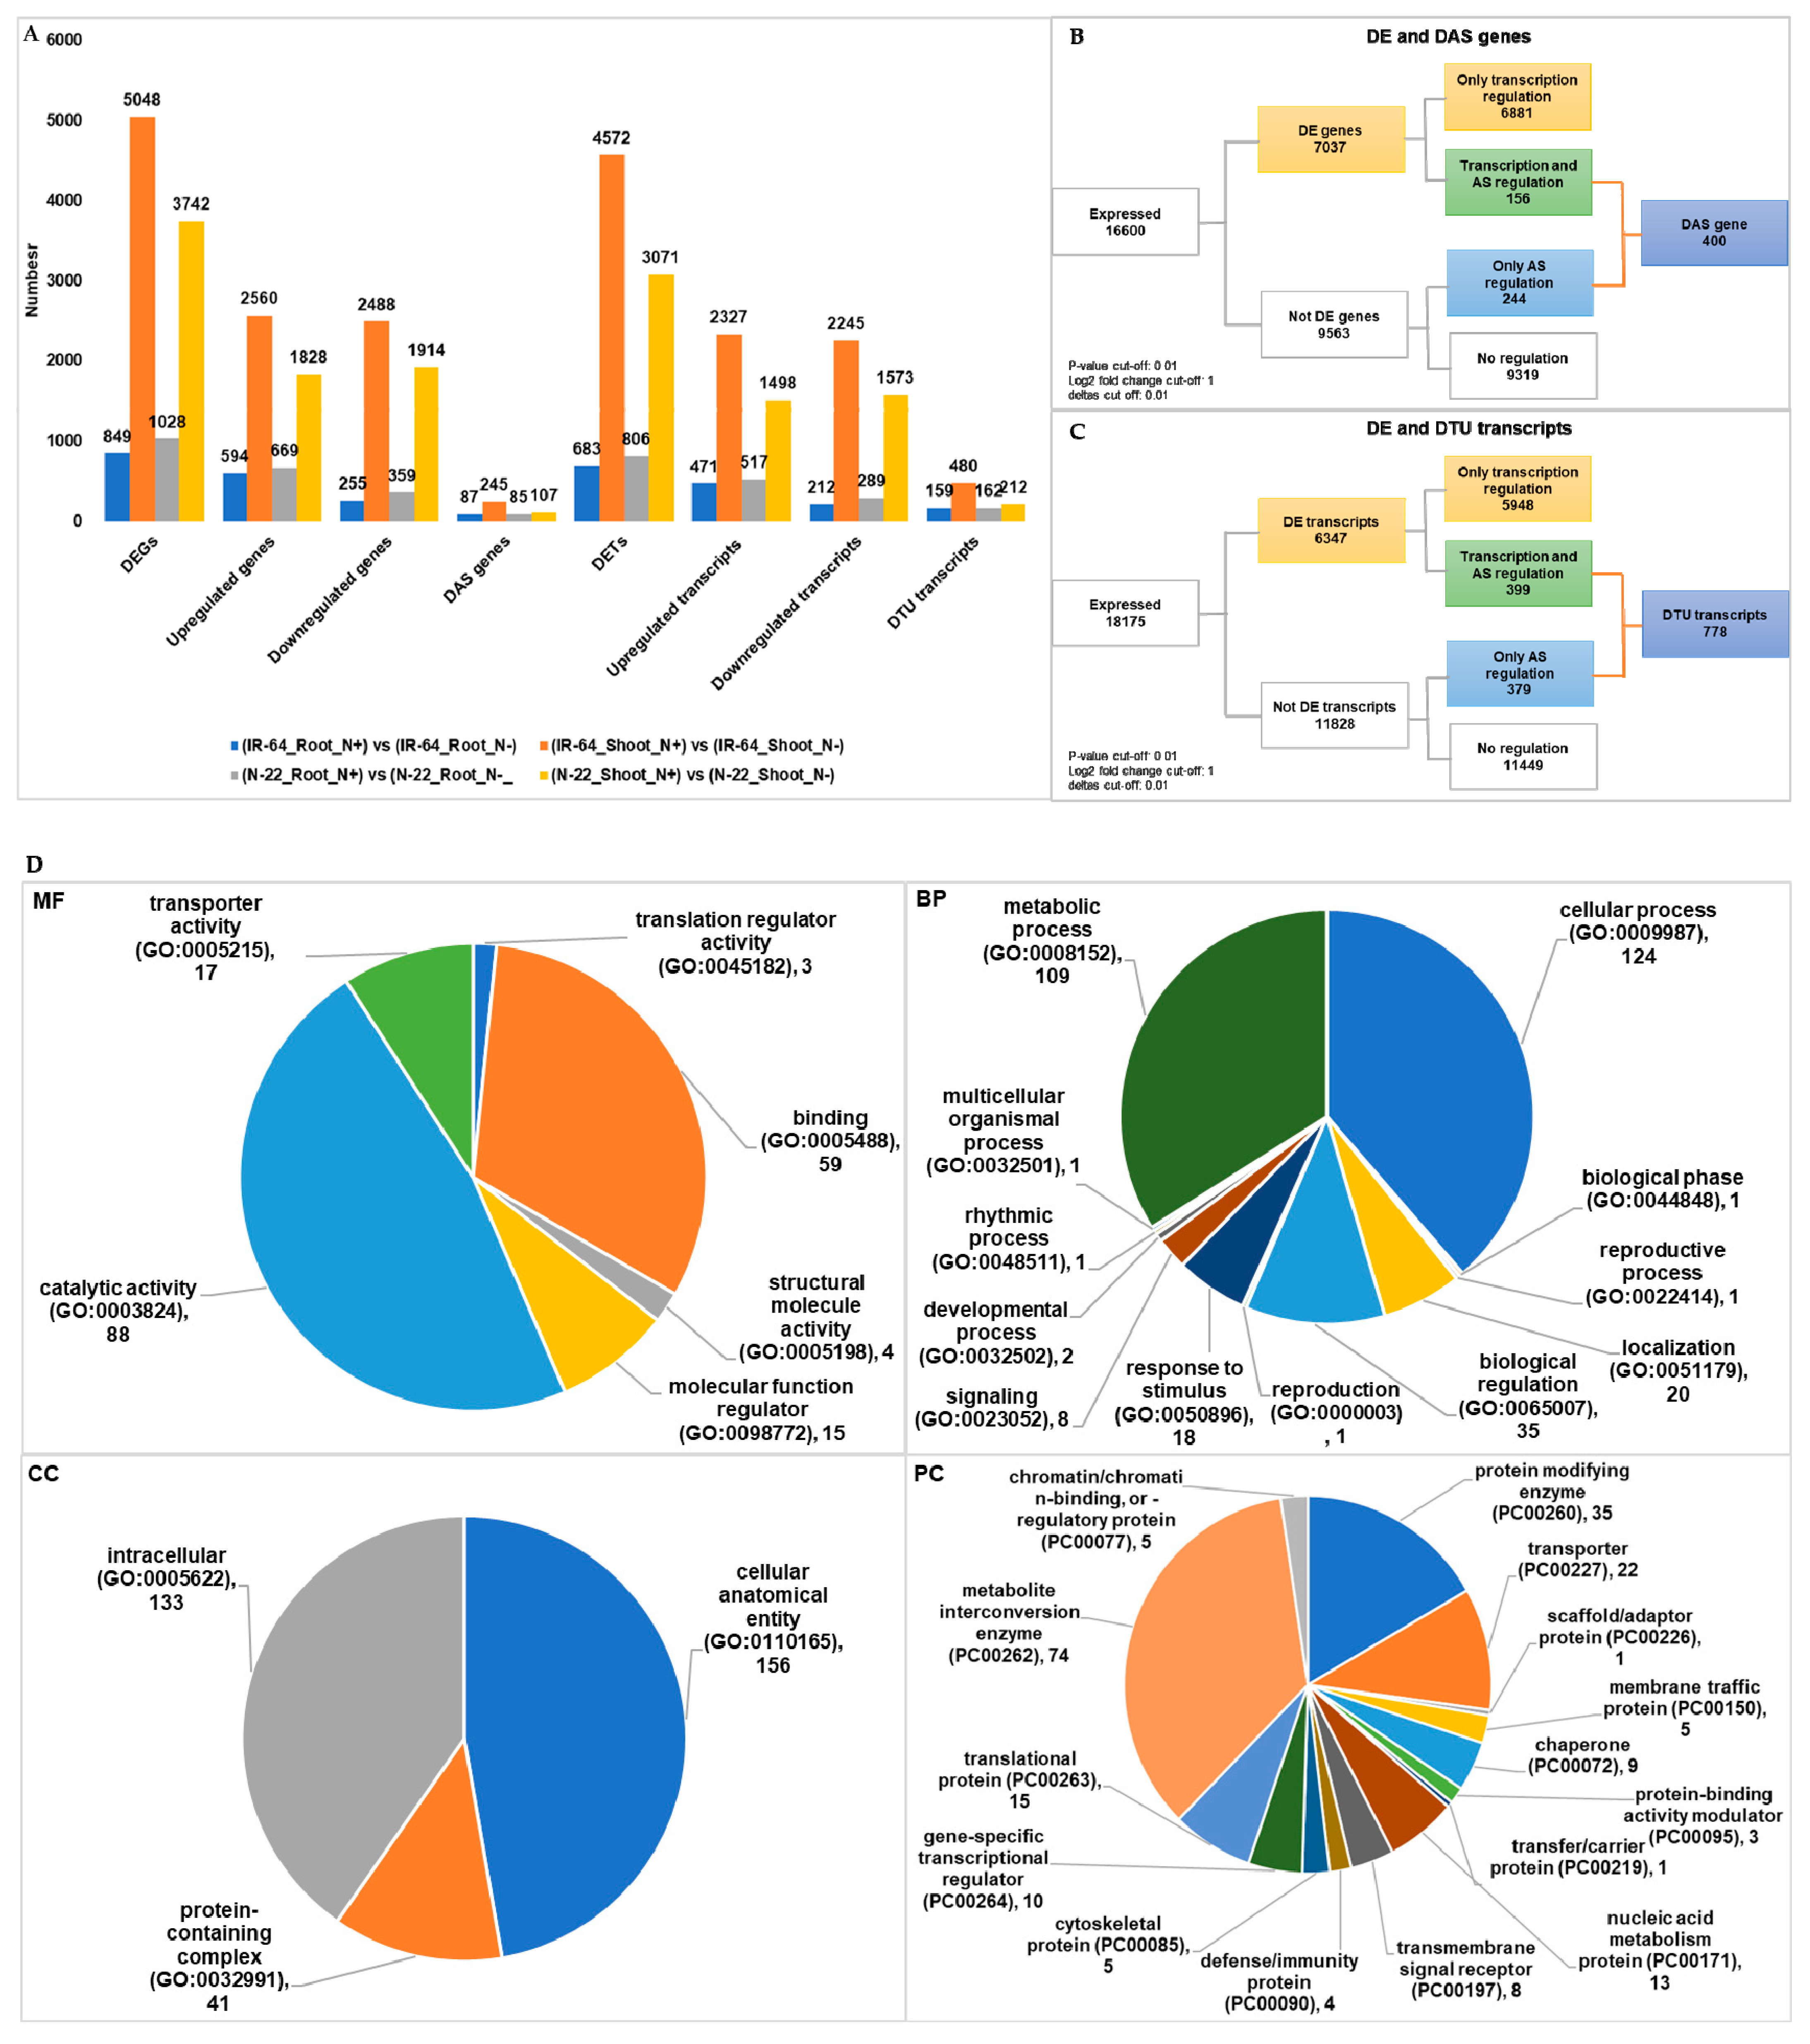
3.4. Condition Dependent Differentially Expressed Genes/Transcripts, Alternative Spliced (DAS) Genes and Transcripts Usage (DTU) Transcripts
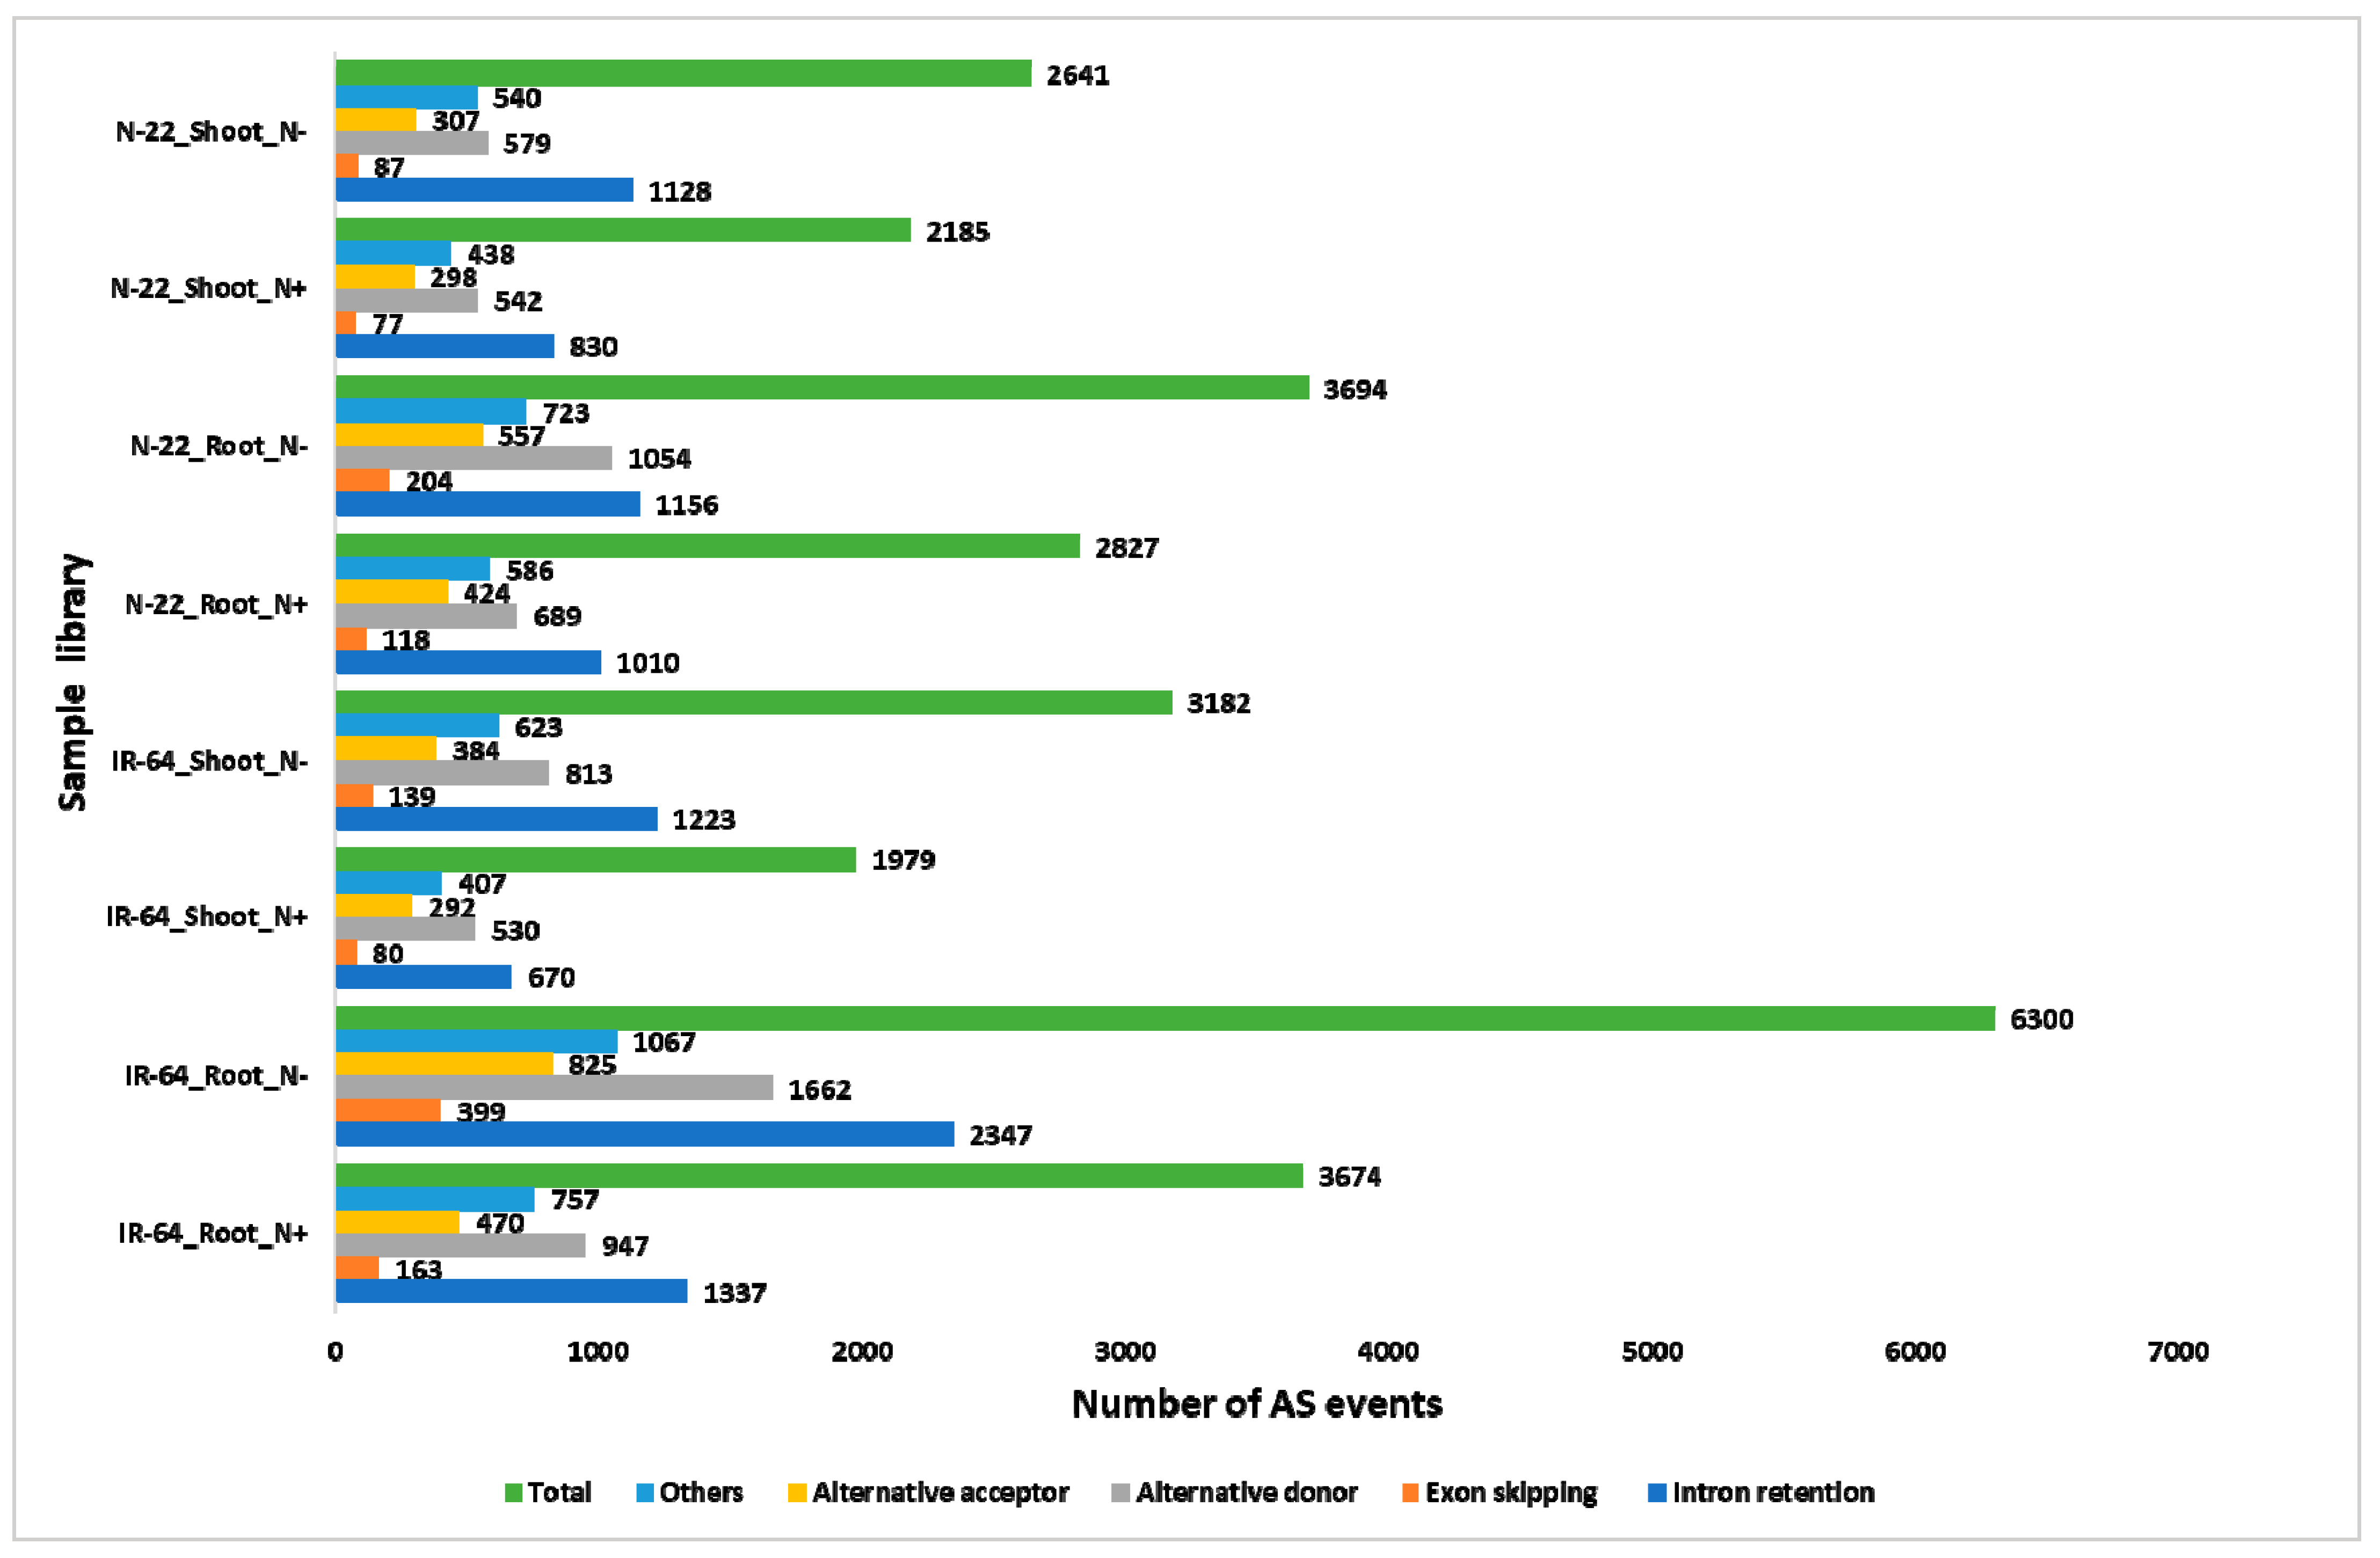
3.5. N-starvation (N−) Modulates Different Alternative Splicing (AS) Events.
4. Discussion
5. Conclusions
Supplementary Materials
Author Contributions
Funding
Institutional Review Board Statement
Informed Consent Statement
Data Availability Statement
Acknowledgments
Conflicts of Interest
References
- Frink, C.R.; Waggoner, P.E.; Ausubel, J.H. Nitrogen fertilizer: Retrospect and prospect. Proc. Natl. Acad. Sci. USA 1999, 96, 1175–1180. [Google Scholar] [CrossRef]
- Jackson, L.E.; Schimel, J.P.; Firestone, M.K. Short-term partitioning of ammonium and nitrate between plants and microbes in an annual grassland. Soil Biol. Biochem. 1989, 21, 409–415. [Google Scholar] [CrossRef]
- Ishii, S.; Ikeda, S.; Minamisawa, K.; Senoo, K. Nitrogen Cycling in Rice Paddy Environments: Past Achievements and Future Challenges. Microbes Environ. 2011, 26, 282–292. [Google Scholar] [CrossRef]
- Witte, C.-P. Urea metabolism in plants. Plant Sci. 2011, 180, 431–438. [Google Scholar] [CrossRef] [PubMed]
- Raun, W.R.; Schepers, J.S. Nitrogen Management for Improved Use Efficiency; Wiley: Hoboken, NJ, USA, 2015. [Google Scholar]
- Raun, W.R.; Johnson, G.V. Review and interpreation: Improving nitrogen use efficiency for cereal production. Agron. J. 1999, 91, 357–363. [Google Scholar] [CrossRef]
- Hakeem, K.R.; Ahmad, A.; Iqbal, M.; Gucel, S.; Ozturk, M. Nitrogen-efficient rice cultivars can reduce nitrate pollution. Environ. Sci. Pollut. Res. 2011, 18, 1184–1193. [Google Scholar] [CrossRef]
- Sutton, M.A.; Bleeker, A. Environmental science: The shape of nitrogen to come. Nature 2013, 494, 435–437. [Google Scholar] [CrossRef] [PubMed]
- Sharma, L.K.; Bali, S.K. A Review of Methods to Improve Nitrogen Use Efficiency in Agriculture. Sustainability 2017, 10, 51. [Google Scholar] [CrossRef]
- Fageria, N.K.; Baligar, V.C. Enhancing Nitrogen Use Efficiency in Crop Plants. Adv. Agron. 2005, 88, 97–185. [Google Scholar]
- van Bueren, E.T.L.; Struik, P.C. Diverse concepts of breeding for nitrogen use efficiency. A review. Agron. Sustain. Dev. 2017, 37, 50. [Google Scholar] [CrossRef]
- Beatty, P.H.; Good, A.G. Improving nitrogen use efficient in crop plants using biotechnology approaches. In Engineering Nitrogen Utilization in Crop Plants; Springer: Berlin/Heidelberg, Germany, 2018; ISBN 9783319929583. [Google Scholar]
- Reddy, A.S.; Marquez, Y.; Kalyna, M.; Barta, A. Complexity of the Alternative Splicing Landscape in Plants. Plant Cell 2013, 25, 3657–3683. [Google Scholar] [CrossRef]
- Syed, N.H.; Kalyna, M.; Marquez, Y.; Barta, A.; Brown, J.W. Alternative splicing in plants—Coming of age. Trends Plant Sci. 2012, 17, 616–623. [Google Scholar] [CrossRef] [PubMed]
- Laloum, T.; Martín, G.; Duque, P. Alternative Splicing Control of Abiotic Stress Responses. Trends Plant Sci. 2018, 23, 140–150. [Google Scholar] [CrossRef]
- Filichkin, S.A.; Priest, H.D.; Givan, S.A.; Shen, R.; Bryant, D.W.; Fox, S.E.; Wong, W.K.; Mockler, T.C. Genome-wide mapping of alternative splicing in Arabidopsis thaliana. Genome Res. 2010, 20, 45–58. [Google Scholar] [CrossRef]
- Marquez, Y.; Brown, J.W.S.; Simpson, C.; Barta, A.; Kalyna, M. Transcriptome survey reveals increased complexity of the alternative splicing landscape in Arabidopsis. Genome Res. 2012, 22, 1184–1195. [Google Scholar] [CrossRef] [PubMed]
- Yang, W.; Yoon, J.; Choi, H.; Fan, Y.; Chen, R.; An, G. Transcriptome analysis of nitrogen-starvation-responsive genes in rice. BMC Plant Biol. 2015, 15, 31. [Google Scholar] [CrossRef] [PubMed]
- Wang, Y.; Xu, J.; Ge, M.; Ning, L.; Hu, M.; Zhao, H. High-resolution profile of transcriptomes reveals a role of alternative splicing for modulating response to nitrogen in maize. BMC Genom. 2020, 21, 353. [Google Scholar] [CrossRef]
- Sharma, N.; Sinha, V.B.; Gupta, N.; Rajpal, S.; Kuchi, S.; Sitaramam, V.; Parsad, R.; Raghuram, N. Phenotyping for nitrogen use efficiency: Rice genotypes differ in N-Responsive germination, oxygen consumption, seed urease activities, root growth, crop duration, and yield at low N. Front. Plant Sci. 2018, 9, 1452. [Google Scholar] [CrossRef]
- Pathak, R.R.; Ahmad, A.; Lochab, S.; Raghuram, N. Molecular physiology of plant nitrogen use efficiency and biotechnological options for its enhancement. Curr. Sci. 2008, 94, 1394–1403. [Google Scholar]
- Kant, S.; Bi, Y.M.; Rothstein, S.J. Understanding plant response to nitrogen limitation for the improvement of crop nitrogen use efficiency. J. Exp. Bot. 2011, 62, 1499–1509. [Google Scholar] [CrossRef]
- Sinha, S.K.; Amitha Mithra, S.V.; Chaudhary, S.; Tyagi, P.; Venkadesan, S.; Rani, M.; Mandal, P.K. Transcriptome analysis of two rice varieties contrasting for nitrogen use efficiency under chronic N starvation reveals differences in chloroplast and starch metabolism-related genes. Genes 2018, 9, 206. [Google Scholar] [CrossRef]
- Leinonen, R.; Sugawara, H.; Shumway, M. The sequence read archive. Nucleic Acids Res. 2010, 39, D19–D21. [Google Scholar] [CrossRef]
- Bolger, A.M.; Lohse, M.; Usadel, B. Trimmomatic: A flexible trimmer for Illumina sequence data. Bioinformatics 2014, 30, 2114–2120. [Google Scholar] [CrossRef]
- Patro, R.; Duggal, G.; Love, M.I.; Irizarry, R.A.; Kingsford, C. Salmon provides fast and bias-aware quantification of transcript expression. Nat. Methods 2017, 14, 417–419. [Google Scholar] [CrossRef] [PubMed]
- Sakai, H.; Lee, S.S.; Tanaka, T.; Numa, H.; Kim, J.; Kawahara, Y.; Wakimoto, H.; Yang, C.C.; Iwamoto, M.; Abe, T.; et al. Rice annotation project database (RAP-DB): An integrative and interactive database for rice genomics. Plant Cell Physiol. 2013, 54, e6. [Google Scholar] [CrossRef] [PubMed]
- Guo, W.; Tzioutziou, N.A.; Stephen, G.; Milne, I.; Calixto, C.P.G.; Waugh, R.; Brown, J.W.S.; Zhang, R. 3D RNA-seq: A powerful and flexible tool for rapid and accurate differential expression and alternative splicing analysis of RNA-seq data for biologists. RNA Biol. 2020, 19, 1–14. [Google Scholar] [CrossRef] [PubMed]
- Soneson, C.; Love, M.I.; Robinson, M.D. Differential analyses for RNA-seq: Transcript-level estimates improve gene-level inferences. F1000Research 2015, 4, 1521. [Google Scholar] [CrossRef]
- Robinson, M.D.; McCarthy, D.J.; Smyth, G.K. EdgeR: A Bioconductor package for differential expression analysis of digital gene expression data. Bioinformatics 2009, 26, 139–140. [Google Scholar] [CrossRef]
- Ritchie, M.E.; Phipson, B.; Wu, D.; Hu, Y.; Law, C.W.; Shi, W.; Smyth, G.K. Limma powers differential expression analyses for RNA-sequencing and microarray studies. Nucleic Acids Res. 2015, 43, e47. [Google Scholar] [CrossRef] [PubMed]
- Ashburner, M.; Ball, C.A.; Blake, J.A.; Botstein, D.; Butler, H.; Cherry, J.M.; Davis, A.P.; Dolinski, K.; Dwight, S.S.; Eppig, J.T.; et al. Gene ontology: Tool for the unification of biology. Nat. Genet. 2000, 25, 25–29. [Google Scholar] [CrossRef] [PubMed]
- Gene, T.; Consortium, O. Gene Ontology: Tool for the unification of biology. Gene Expr. 2000, 25, 25–29. [Google Scholar] [CrossRef]
- Guo, W.; Calixto, C.P.G.; Brown, J.W.S.; Zhang, R. TSIS: An R package to infer alternative splicing isoform switches for time-series data. Bioinformatics 2017, 33, 3308–3310. [Google Scholar] [CrossRef]
- Kim, D.; Langmead, B.; Salzberg, S.L. HISAT: A fast spliced aligner with low memory requirements. Nat. Methods 2015, 12, 357–360. [Google Scholar] [CrossRef] [PubMed]
- Pertea, M.; Pertea, G.M.; Antonescu, C.M.; Chang, T.C.; Mendell, J.T.; Salzberg, S.L. StringTie enables improved reconstruction of a transcriptome from RNA-seq reads. Nat. Biotechnol. 2015, 33, 290–295. [Google Scholar] [CrossRef]
- Foissac, S.; Sammeth, M. ASTALAVISTA: Dynamic and flexible analysis of alternative splicing events in custom gene datasets. Nucleic Acids Res. 2007, 35, W297–W299. [Google Scholar] [CrossRef] [PubMed]
- Sevanthi, A.M.; Sinha, S.K.; Sureshkumar, V.; Manju, R.; Saini, M.R.; Kumari, S.; Kaushik, M.; Prakash, C.; Karnam, V.; Singh, G.P.; et al. Integration of Dual Stress Transcriptomes and Major QTLs From a Pair of Genotypes Contrasting for Drought and Chronic Nitrogen Starvation Identi es Key Stress Responsive Genes in Rice. Res. Sq. 2020. [Google Scholar] [CrossRef]
- Chaudhary, S.; Khokhar, W.; Jabre, I.; Reddy, A.S.N.; Byrne, L.J.; Wilson, C.M.; Syed, N.H. Alternative Splicing and Protein Diversity: Plants Versus Animals. Front. Plant Sci. 2019, 10, 708. [Google Scholar] [CrossRef]
- Houlton, B.Z.; Almaraz, M.; Aneja, V.; Austin, A.T.; Bai, E.; Cassman, K.G.; Compton, J.E.; Davidson, E.A.; Erisman, J.W.; Galloway, J.N.; et al. A World of Cobenefits: Solving the Global Nitrogen Challenge. Earth’s Futur. 2019, 7, 865–872. [Google Scholar] [CrossRef]
- Ahmed, M.; Rauf, M.; Mukhtar, Z.; Saeed, N.A. Excessive use of nitrogenous fertilizers: An unawareness causing serious threats to environment and human health. Environ. Sci. Pollut. Res. 2017, 24, 26983–26987. [Google Scholar] [CrossRef]
- Cai, H.; Lu, Y.; Xie, W.; Zhu, T.; Lian, X. Transcriptome response to nitrogen starvation in rice. J. Biosci. 2012, 37, 731–747. [Google Scholar] [CrossRef]
- Lian, X.; Wang, S.; Zhang, J.; Feng, Q.; Zhang, L.; Fan, D.; Li, X.; Yuan, D.; Han, B.; Zhang, Q. Expression profiles of 10,422 genes at early stage of low nitrogen stress in rice assayed using a cDNA microarray. Plant Mol. Biol. 2006, 60, 617–631. [Google Scholar] [CrossRef]
- Dong, C.; He, F.; Berkowitz, O.; Liu, J.; Cao, P.; Tang, M.; Shi, H.; Wang, W.; Li, Q.; Shen, Z.; et al. Alternative splicing plays a critical role in maintaining mineral nutrient homeostasis in rice (Oryza sativa). Plant Cell 2018, 30, 2267–2285. [Google Scholar] [CrossRef] [PubMed]
- Han, M.; Okamoto, M.; Beatty, P.H.; Rothstein, S.J.; Good, A.G. The Genetics of Nitrogen Use Efficiency in Crop Plants. Annu. Rev. Genet. 2015, 49, 269–289. [Google Scholar] [CrossRef] [PubMed]
- Hawkesford, M.J.; Griffiths, S. Exploiting genetic variation in nitrogen use efficiency for cereal crop improvement. Curr. Opin. Plant Biol. 2019, 49, 35–42. [Google Scholar] [CrossRef] [PubMed]
- Zhong, C.; Cao, X.; Bai, Z.; Zhang, J.; Zhu, L.; Huang, J.; Jin, Q. Nitrogen metabolism correlates with the acclimation of photosynthesis to short-term water stress in rice (Oryza sativa L.). Plant Physiol. Biochem. 2018, 125, 52–62. [Google Scholar] [CrossRef] [PubMed]
- Cabrera-Bosquet, L.; Molero, G.; Bort, J.; Nogués, S.; Araus, J.L. The combined effect of constant water deficit and nitrogen supply on WUE, NUE and Δ13C in durum wheat potted plants. Ann. Appl. Biol. 2007, 151, 277–289. [Google Scholar] [CrossRef]
- Li, L.; Sun, J.; Zhang, F.; Li, X.; Yang, S.; Rengel, Z. Wheat/maize or wheat/soybean strip intercropping I. Yield advantage and interspecific interactions on nutrients. Field Crop. Res. 2001, 71, 123–137. [Google Scholar] [CrossRef]
- Banerjee, B.P.; Joshi, S.; Thoday-Kennedy, E.; Pasam, R.K.; Tibbits, J.; Hayden, M.; Spangenberg, G.; Kant, S. High-throughput phenotyping using digital and hyperspectral imaging-derived biomarkers for genotypic nitrogen response. J. Exp. Bot. 2020, 71, 4604–4615. [Google Scholar] [CrossRef]


| Description | Number |
|---|---|
| Raw transcripts | 33,195 |
| Raw genes | 28,120 |
| Samples | 16 |
| Samples after merging seq-reps | 8 |
| Condition of interest | 8 |
| CPM cut-off | 1 |
| Min samples to CPM cut-off | 8 |
| Expressed transcripts | 18,175 |
| Expressed genes | 16,600 |
| Contrast Group | DEGs | DAS Genes | DETs | DTU Transcripts |
|---|---|---|---|---|
| (IR-64_Root_N−) + (IR-64_Shoot_N−) vs. (N-22_Root_N−) + (N-22_Shoot_N−) | 1340 | 159 | 1255 | 297 |
| (IR-64_Root_N+) + (IR-64_Root_N−) vs. (IR-64_Shoot_N+) + (IR-64_Shoot_N−) | 6459 | 326 | 6680 | 630 |
| (N-22_Root_N+) + (N-22_Root_N−) vs. (N-22_Shoot_N+) + (N-22_Shoot_N−) | 7000 | 313 | 7176 | 605 |
| (IR-64_Root_N+) vs. (IR-64_Root_N−) | 849 | 87 | 683 | 159 |
| (IR-64_Shoot_N+) vs. (IR-64_Shoot_N−) | 5048 | 245 | 4572 | 480 |
| (N-22_Root_N+) vs. (N-22_Root_N−) | 1028 | 85 | 806 | 162 |
| (N-22_Shoot_N+) vs. (N-22_Shoot_N−) | 3742 | 107 | 3071 | 212 |
Publisher’s Note: MDPI stays neutral with regard to jurisdictional claims in published maps and institutional affiliations. |
© 2021 by the authors. Licensee MDPI, Basel, Switzerland. This article is an open access article distributed under the terms and conditions of the Creative Commons Attribution (CC BY) license (http://creativecommons.org/licenses/by/4.0/).
Share and Cite
Chaudhary, S.; Kalkal, M. Rice Transcriptome Analysis Reveals Nitrogen Starvation Modulates Differential Alternative Splicing and Transcript Usage in Various Metabolism-Related Genes. Life 2021, 11, 285. https://doi.org/10.3390/life11040285
Chaudhary S, Kalkal M. Rice Transcriptome Analysis Reveals Nitrogen Starvation Modulates Differential Alternative Splicing and Transcript Usage in Various Metabolism-Related Genes. Life. 2021; 11(4):285. https://doi.org/10.3390/life11040285
Chicago/Turabian StyleChaudhary, Saurabh, and Meenu Kalkal. 2021. "Rice Transcriptome Analysis Reveals Nitrogen Starvation Modulates Differential Alternative Splicing and Transcript Usage in Various Metabolism-Related Genes" Life 11, no. 4: 285. https://doi.org/10.3390/life11040285
APA StyleChaudhary, S., & Kalkal, M. (2021). Rice Transcriptome Analysis Reveals Nitrogen Starvation Modulates Differential Alternative Splicing and Transcript Usage in Various Metabolism-Related Genes. Life, 11(4), 285. https://doi.org/10.3390/life11040285