Article

PBPK Modeling and Simulation of Antibiotics Amikacin, Gentamicin, Tobramycin, and Vancomycin Used in Hospital Practice

1
OncoPharma Research Group, Center for Health Technology and Services Research (CINTESIS), Rua Doutor Plácido da Costa, 4200-450 Porto, Portugal
2
LAQV/REQUIMTE, Laboratory of Applied Chemistry, Department of Chemical Sciences, Faculty of Pharmacy, University of Porto, Rua de Jorge Viterbo Ferreira, 228, 4050-313 Porto, Portugal
3
Departament of Pathology, Clinical Chemistry Service, Centro Hospitalar Universitário do Porto (CHUP), 4099-001 Porto, Portugal
4
Department of Community Medicine, Health Information and Decision (MEDCIDS), Faculty of Medicine, University of Porto, 4200-319 Porto, Portugal
*
Author to whom correspondence should be addressed.
Life 2021, 11(11), 1130; https://doi.org/10.3390/life11111130
Submission received: 3 September 2021 / Revised: 20 October 2021 / Accepted: 22 October 2021 / Published: 23 October 2021
(This article belongs to the Special Issue Artificial Intelligence with Applications in Life Sciences)

Abstract

:
The importance of closely observing patients receiving antibiotic therapy, performing therapeutic drug monitoring (TDM), and regularly adjusting dosing regimens has been extensively demonstrated. Additionally, antibiotic resistance is a contemporary concerningly dangerous issue. Optimizing the use of antibiotics is crucial to ensure treatment efficacy and prevent toxicity caused by overdosing, as well as to combat the prevalence and wide spread of resistant strains. Some antibiotics have been selected and reserved for the treatment of severe infections, including amikacin, gentamicin, tobramycin, and vancomycin. Critically ill patients often require long treatments, hospitalization, and require particular attention regarding TDM and dosing adjustments. As these antibiotics are eliminated by the kidneys, critical deterioration of renal function and toxic effects must be prevented. In this work, clinical data from a Portuguese cohort of 82 inpatients was analyzed and physiologically based pharmacokinetic (PBPK) modeling and simulation was used to study the influence of different therapeutic regimens and parameters as biological sex, body weight, and renal function on the biodistribution and pharmacokinetic (PK) profile of these four antibiotics. Renal function demonstrated the greatest impact on plasma concentration of these antibiotics, and vancomycin had the most considerable accumulation in plasma over time, particularly in patients with impaired renal function. Thus, through a PBPK study, it is possible to understand which pharmacokinetic parameters will have the greatest variation in a given population receiving antibiotic administrations in hospital context.

1. Introduction

Therapeutic drug monitoring (TDM) was implemented in the 1960s to improve patient care and clinical outcome, and specializes in the measurement of circulating drug concentrations to adjust dosing regimens, so as to reach a defined target exposure associated with optimal efficacy and minimal toxicity [1,2]. Since then, some pharmacological properties have been identified (particularly narrow therapeutic window and significant interpatient variability) and the cases that required such dosage individualization have been comprehensively reviewed. TDM is now indicated and recommended for critically ill patients undergoing sufficiently long treatment to justify dosage adjustment [3], whether with anticancer drugs [4], anti-infectives [5], antiretrovirals [6], biologic therapeutic agents [7] or psychotropic agents [8], etc.
Importantly for this work, therapeutic drug monitoring and dosage adjustments are crucial for antibiotics, and have confirmed beneficial results [9,10,11,12,13,14,15]. The four antibiotics studied here, amikacin, gentamicin, tobramycin, and vancomycin, are the most frequently monitored in inpatients, which can be explained by their narrow therapeutic indexes and potential to cause adverse effects, namely nephrotoxicity, particularly in prolonged treatments [15,16,17]. The value of TDM of these antibiotics has been extensively demonstrated [13,14,18,19,20,21,22,23,24,25,26,27].
Furthermore, the increasing resistance rates to antimicrobial agents are a pressing problem that has been indefectibly associated with the inappropriate administration and overuse of these drugs, which has accelerated this process over the past 80 years. About half of the antimicrobial agents prescribed to hospital inpatients are considered inappropriate [28]. Different approaches have been promoted, and antimicrobial stewardship is currently considered the most promising and has been promoted for all hospitals and health care facilities [29,30,31,32]. In 2014, the U.S. Centers for Disease Control and Prevention (CDC) identified seven core elements of antibiotic stewardship and recommend that all hospitals have an antibiotic stewardship program (ASP). Tracking (monitoring process measures), reporting information on antibiotic use and resistance, and education of clinicians and health care providers are three of these core elements [33].
These four antimicrobial agents are an example of antibiotics that have been reserved for the treatment of severe infections, in an attempt to save these valuable drugs from the threat of selection of resistant bacteria. Healing these infections often requires long periods of time of antibiotic therapy and hospitalization. This poses serious concerns, namely regarding plasma accumulation of these drugs, toxicity, and impairment of renal function. Kidneys’ deterioration can be an effect of the disease or a consequence of long-term treatment. Since these antibiotics are mainly renally eliminated and their clearance is an important factor to consider when determining treatment regimens, therapeutic drug monitoring and dose adjustment are imperative to ensure a good clinical outcome of these patients.
In this work, clinical data from a cohort of Portuguese inpatients with severe infections were collected and analyzed, and the influence of therapeutic regimens, biological sex, total body weight, and renal function on the pharmacokinetic (PK) profile was studied for four antibiotics: aminoglycosides amikacin, gentamicin, and tobramycin, and glycopeptide vancomycin. PK studies including physiologically based pharmacokinetic (PBPK) modeling and simulations were performed using GastroPlus™, based on our experience and previous works that have highlighted the value of in silico tools [34,35,36].

2. Materials and Methods

2.1. Study Population

Demographic data (biological sex, age, weight, and height) and clinical information were collected from 82 inpatients hospitalized in Centro Hospitalar Universitário do Porto (CHUP, Portugal) with severe systemic infections of different etiologies. These patients received intravenous (IV) treatment with one of four antibiotics: aminoglycoside amikacin, gentamicin, or tobramycin, or glycopeptide vancomycin. Drugs were administered via 30-min infusions in the case of aminoglycosides and 1-h infusions for vancomycin. Throughout the hospitalization and treatment period, trough and peak antibiotic concentrations as well as serum creatinine levels were determined to adjust posology and evaluate renal function (estimating creatinine clearance using the Cockcroft–Gault formula [37]). Recommended and followed treatment regimens were also recorded. The gathered information is presented in Supplementary Table S1 and summarized in Table 1.

2.2. Pharmacokinetic Analysis Software

PBPK modeling and simulation software GastroPlus™ version 9.5 (Simulations Plus Inc., Lancaster, CA, USA) was used for the prediction of PK parameters and generation of simulated human plasma concentration profiles. Some physicochemical properties of the four antibiotics and input parameters used in the simulations are presented in Table 2.
GastroPlus™, a powerful mechanistically based simulation and modeling software, has been specifically developed for pharmaceutical research. Physiological parameters of several species, including human, are preinstalled, allowing for the amount of drug that is released, dissolved, and absorbed to be modeled for nine compartments, corresponding to different segments of the digestive tract, based on a set of differential equations. The Advanced Compartmental Absorption and Transit (ACAT) and Physiologically Based Pharmacokinetic (PBPK) models support model-based drug development throughout multiple stages of drug discovery, translational research, and clinical development, making it a powerful tool. As such, this software has been used in numerous research studies, but also by distinguished pharmaceutical companies and by the U.S. Food and Drug Administration, the U.S. Centers for Disease Control and Prevention, the U.S. National Institutes of Health, the U.S. National Cancer Institute, and the China Food and Drug Administration [45,46]. A PBPK analysis uses models and simulations that combine physiology, population, and drug characteristics to mechanistically describe the PK behavior of a drug. Throughout a drug’s life cycle, PBPK model predictions can be used to support decisions on whether, when, and how to conduct certain clinical pharmacology studies and to support dosing recommendations in product labeling. The predictive performance of PBPK models in specific clinical settings with heterogeneous and chronically ill patients characterized by numerous unknown individual and clinical factors can be developed [47,48,49,50,51].

2.3. PBPK Modeling and Simulation

Every simulation was performed to study the PK for 72 h after IV administrations of each antibiotic, over 30-min infusions for aminoglycosides amikacin, gentamicin and tobramycin, and 1-h infusions for vancomycin.
For each antibiotic, a customized PBPK model was built to represent the average of that subpopulation (receiving treatment with a particular antibiotic). The input parameters were age, total body weight, and renal clearance (Table 1). Different therapeutic regimens (doses and dosing intervals) were studied for each antibiotic, based on the most common schemes administered to the patients in CHUP. Then, the most recurrent therapeutic regimen was chosen for each antibiotic and the influence of biological sex, body weight and renal function was assessed. Customized PBPK models were set up for male and female individuals with the average characteristics of the subpopulation. The effect of body weight and renal function was studied, defining these parameters as the lower and upper limit of the observed range (Table 1), creating 4 additional tailored PBPK models to represent these different conditions: lowest and highest body weight, and lowest and highest renal function, estimated by creatinine clearance.
The available data only included measured concentrations from 2 time points: right before a dose and 1 h (aminoglycosides) or 3 h (vancomycin) after the beginning of an infusion. Since in GastroPlus™ the observed data can only be used as input referring to a single administration, this prevented a further refined parameterization and validation of the developed models. Nevertheless, the predicted pharmacokinetic parameters were reasonably consistent with the observed values after administration of all analyzed doses for these 4 antibiotics.

3. Results

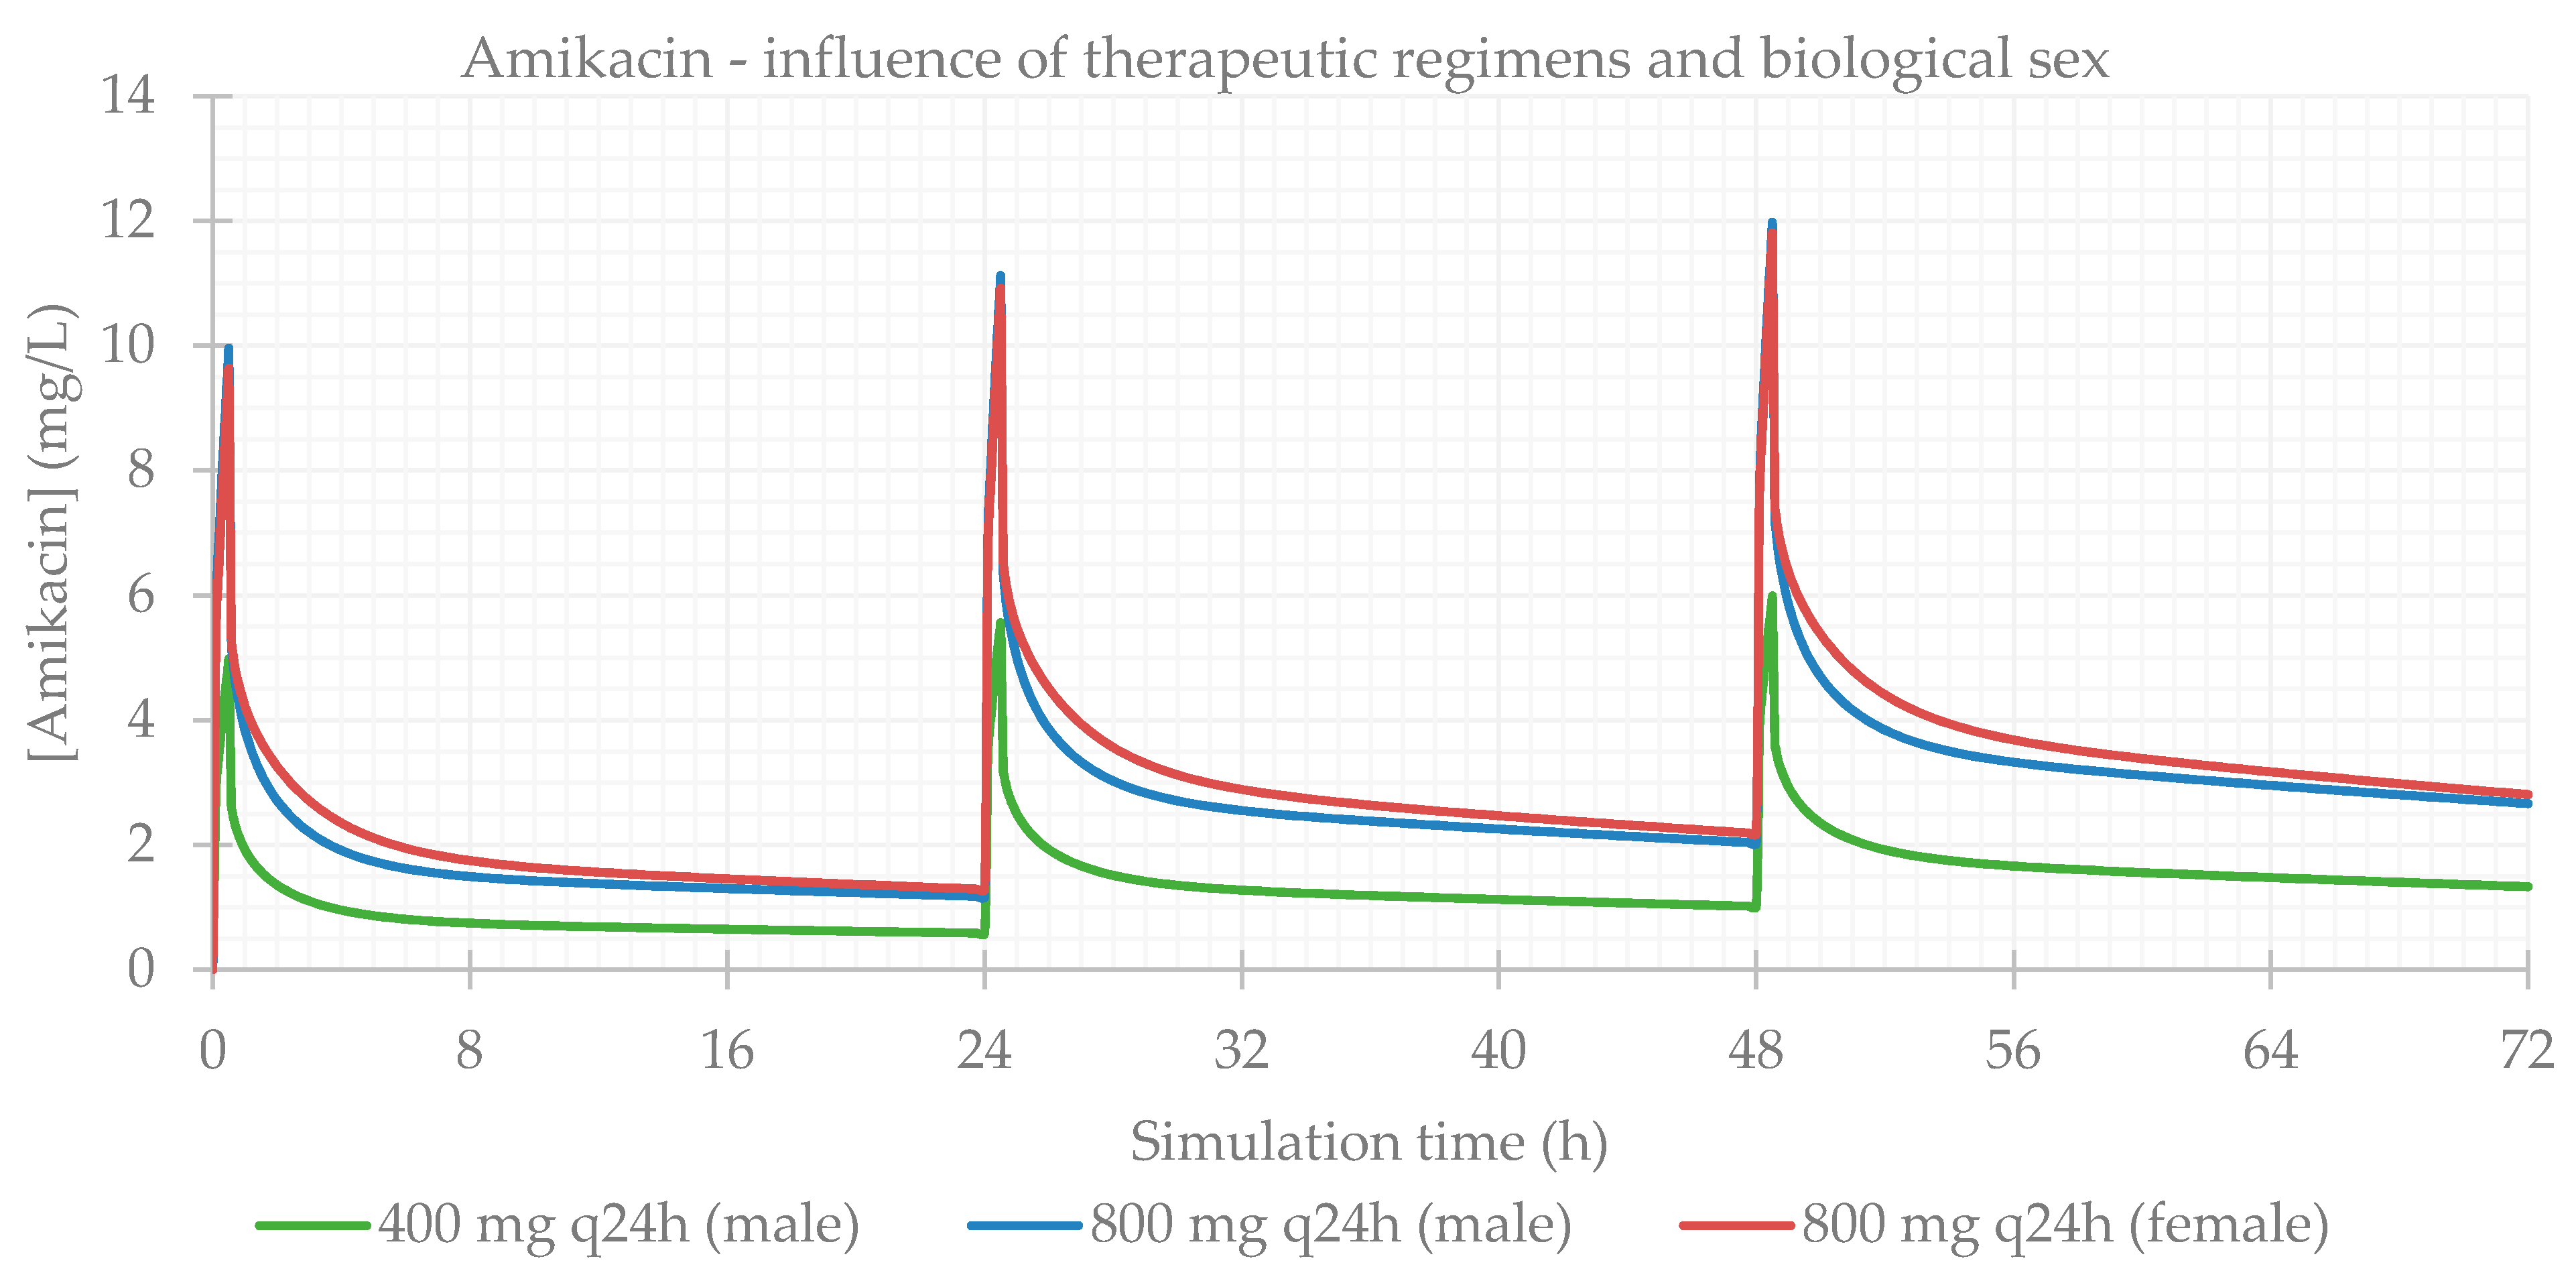
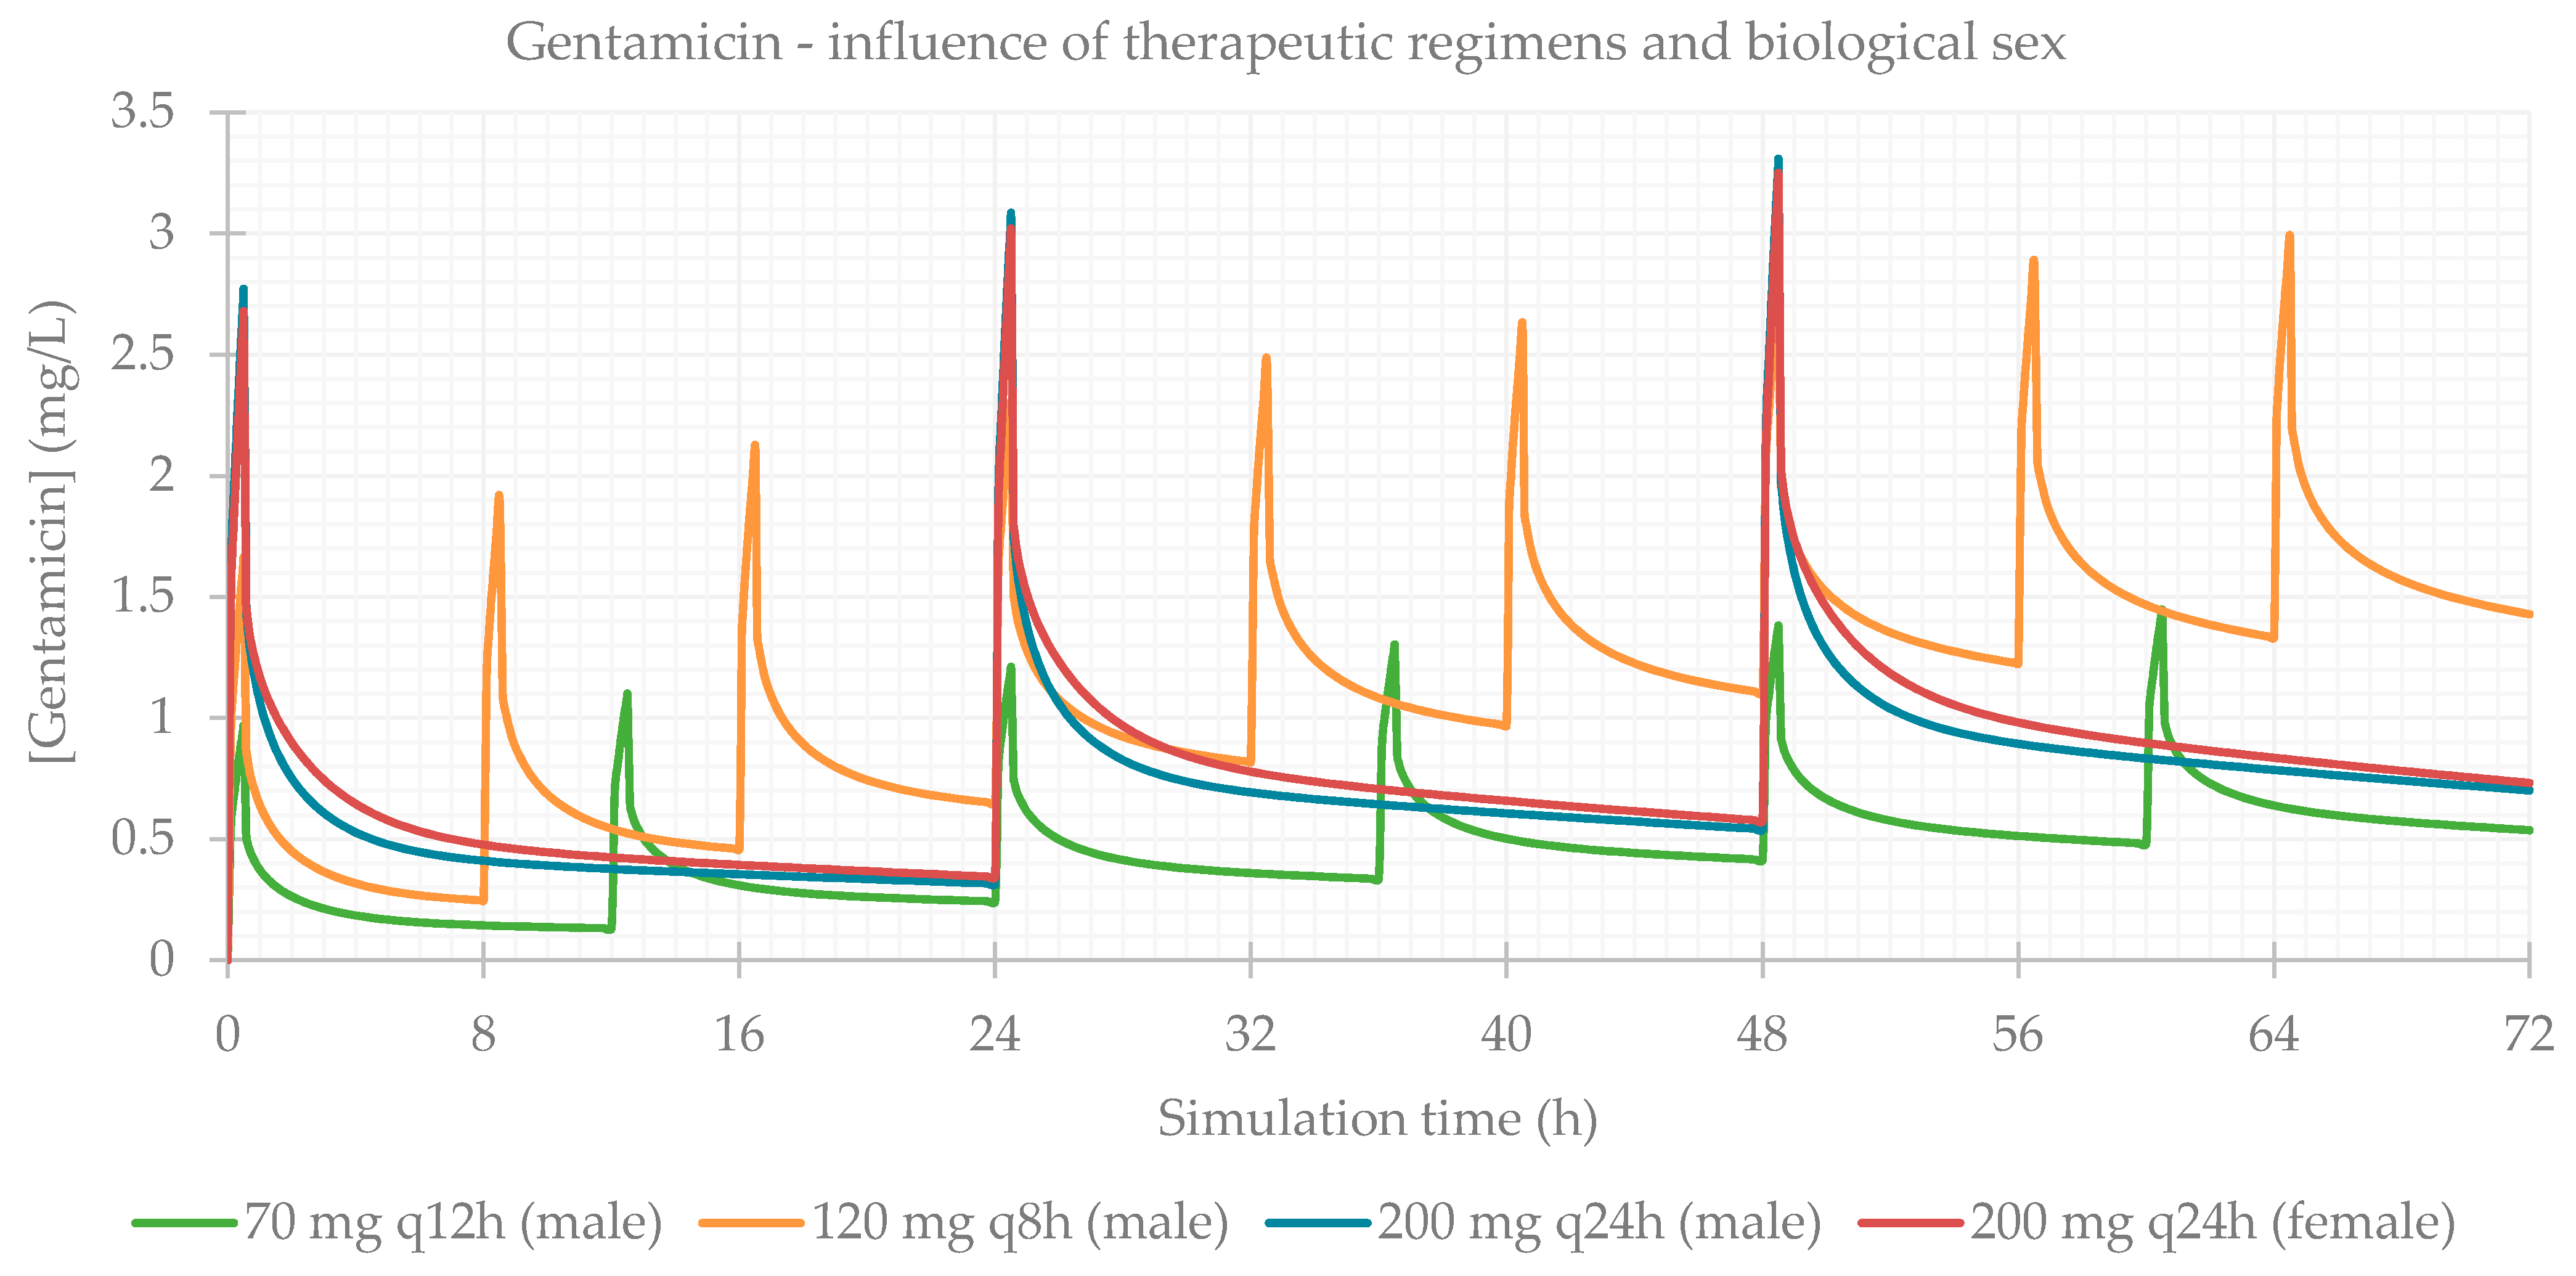
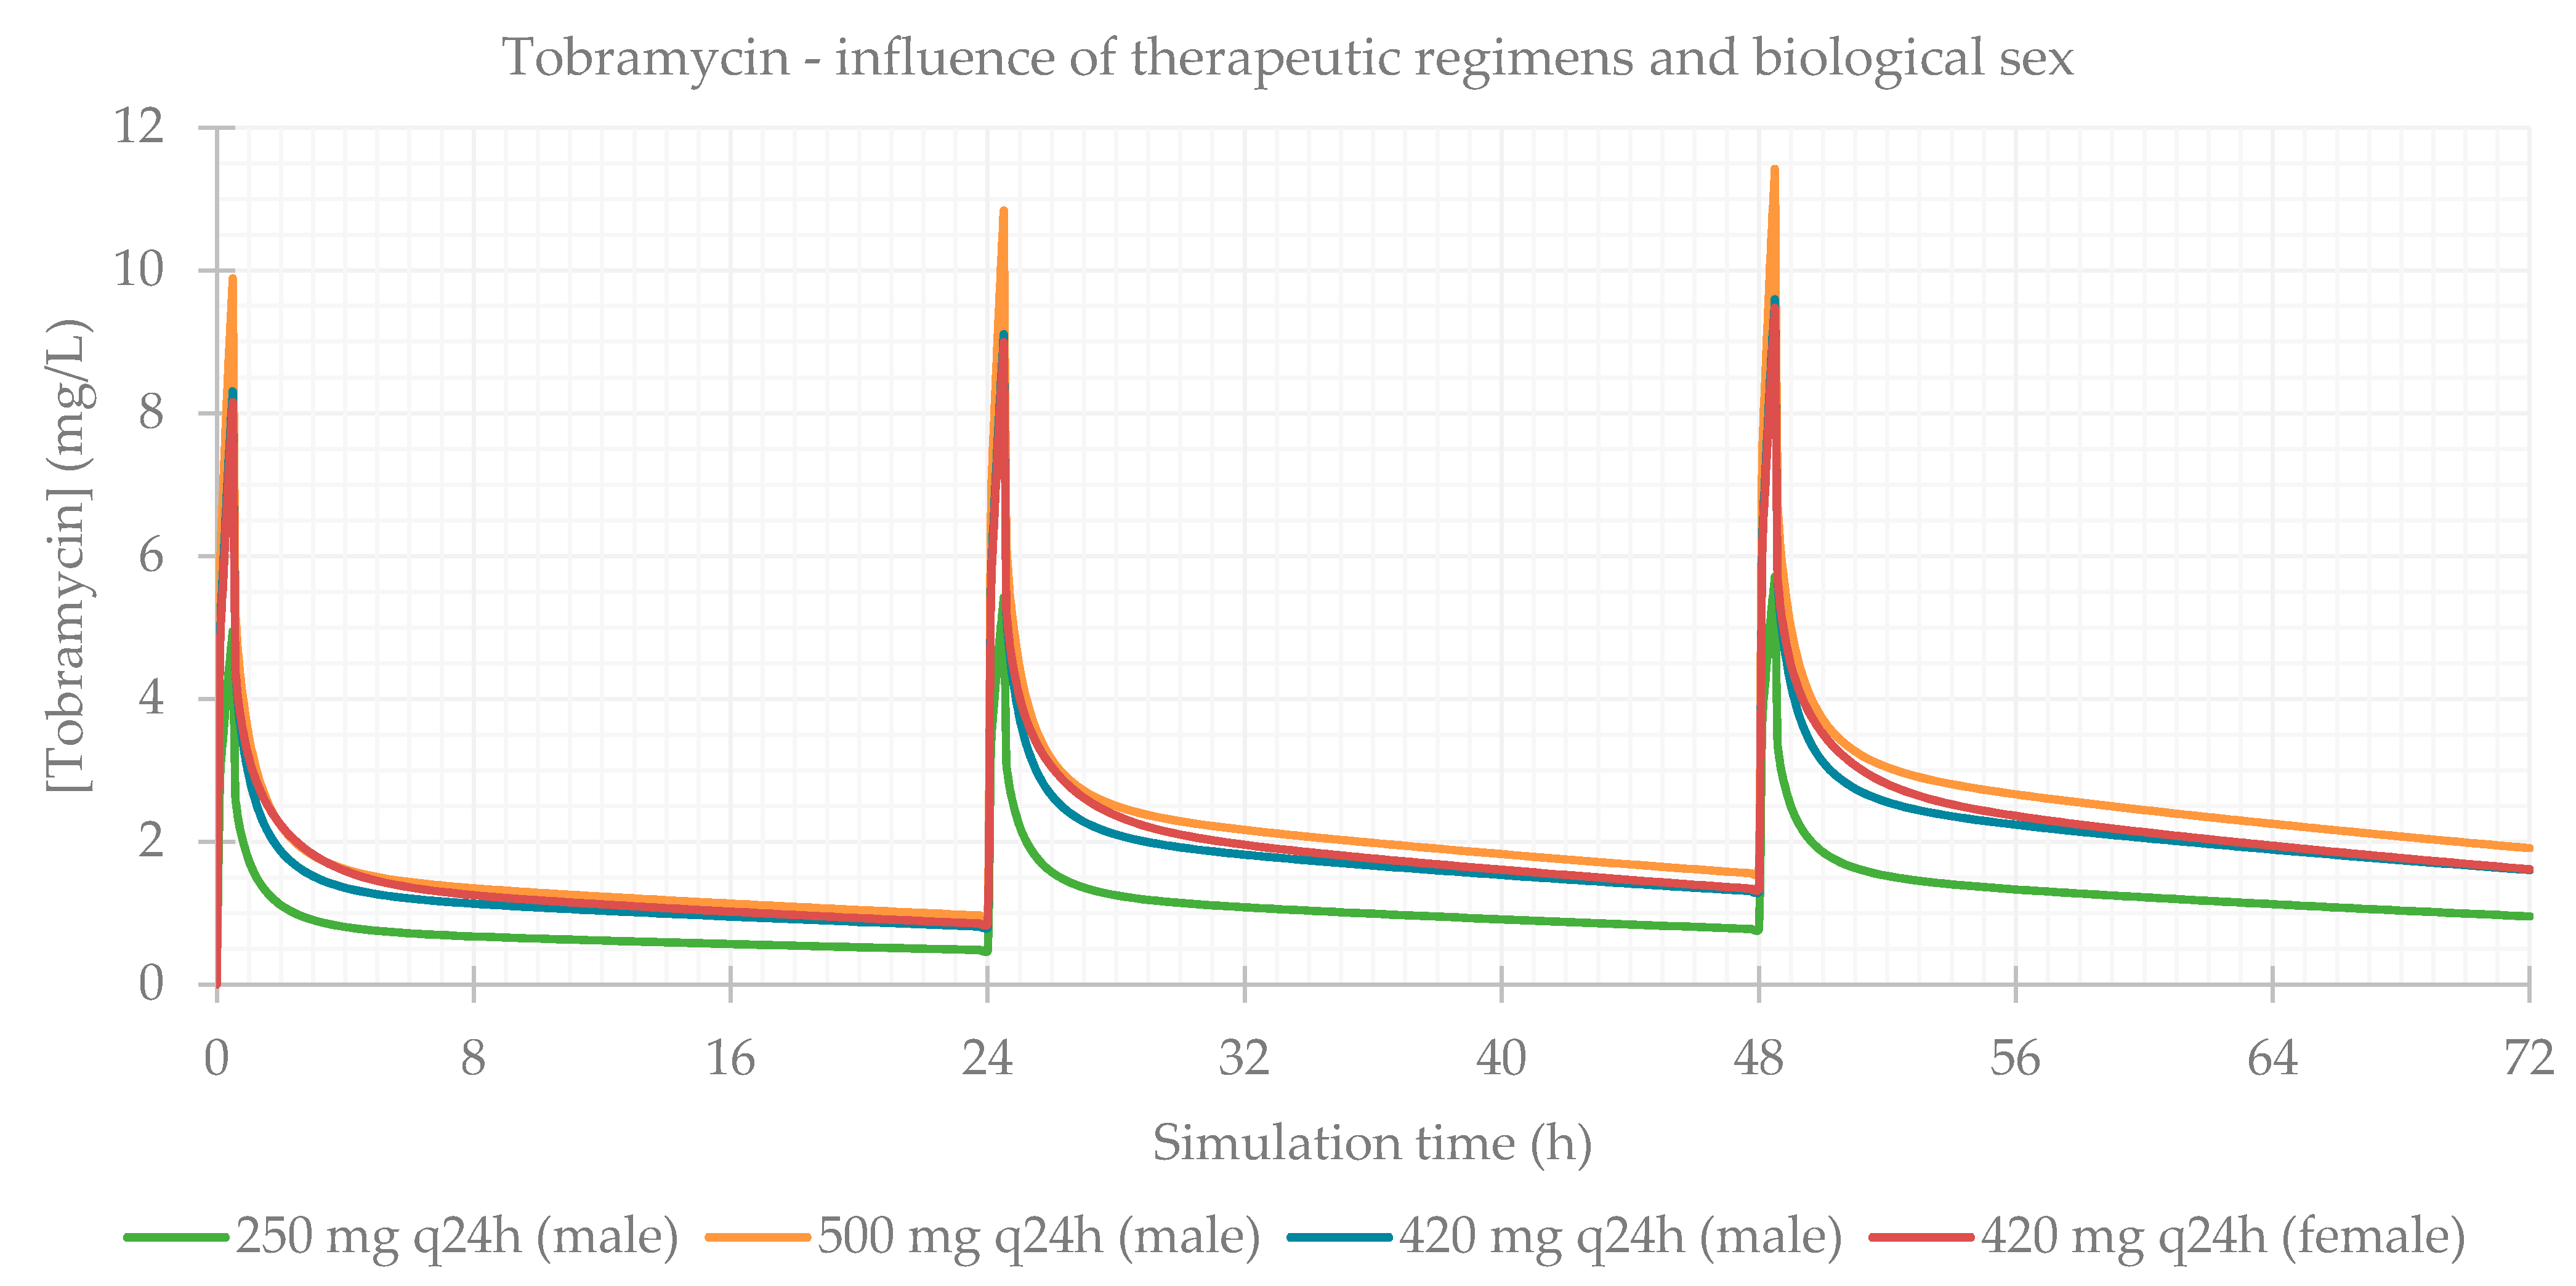
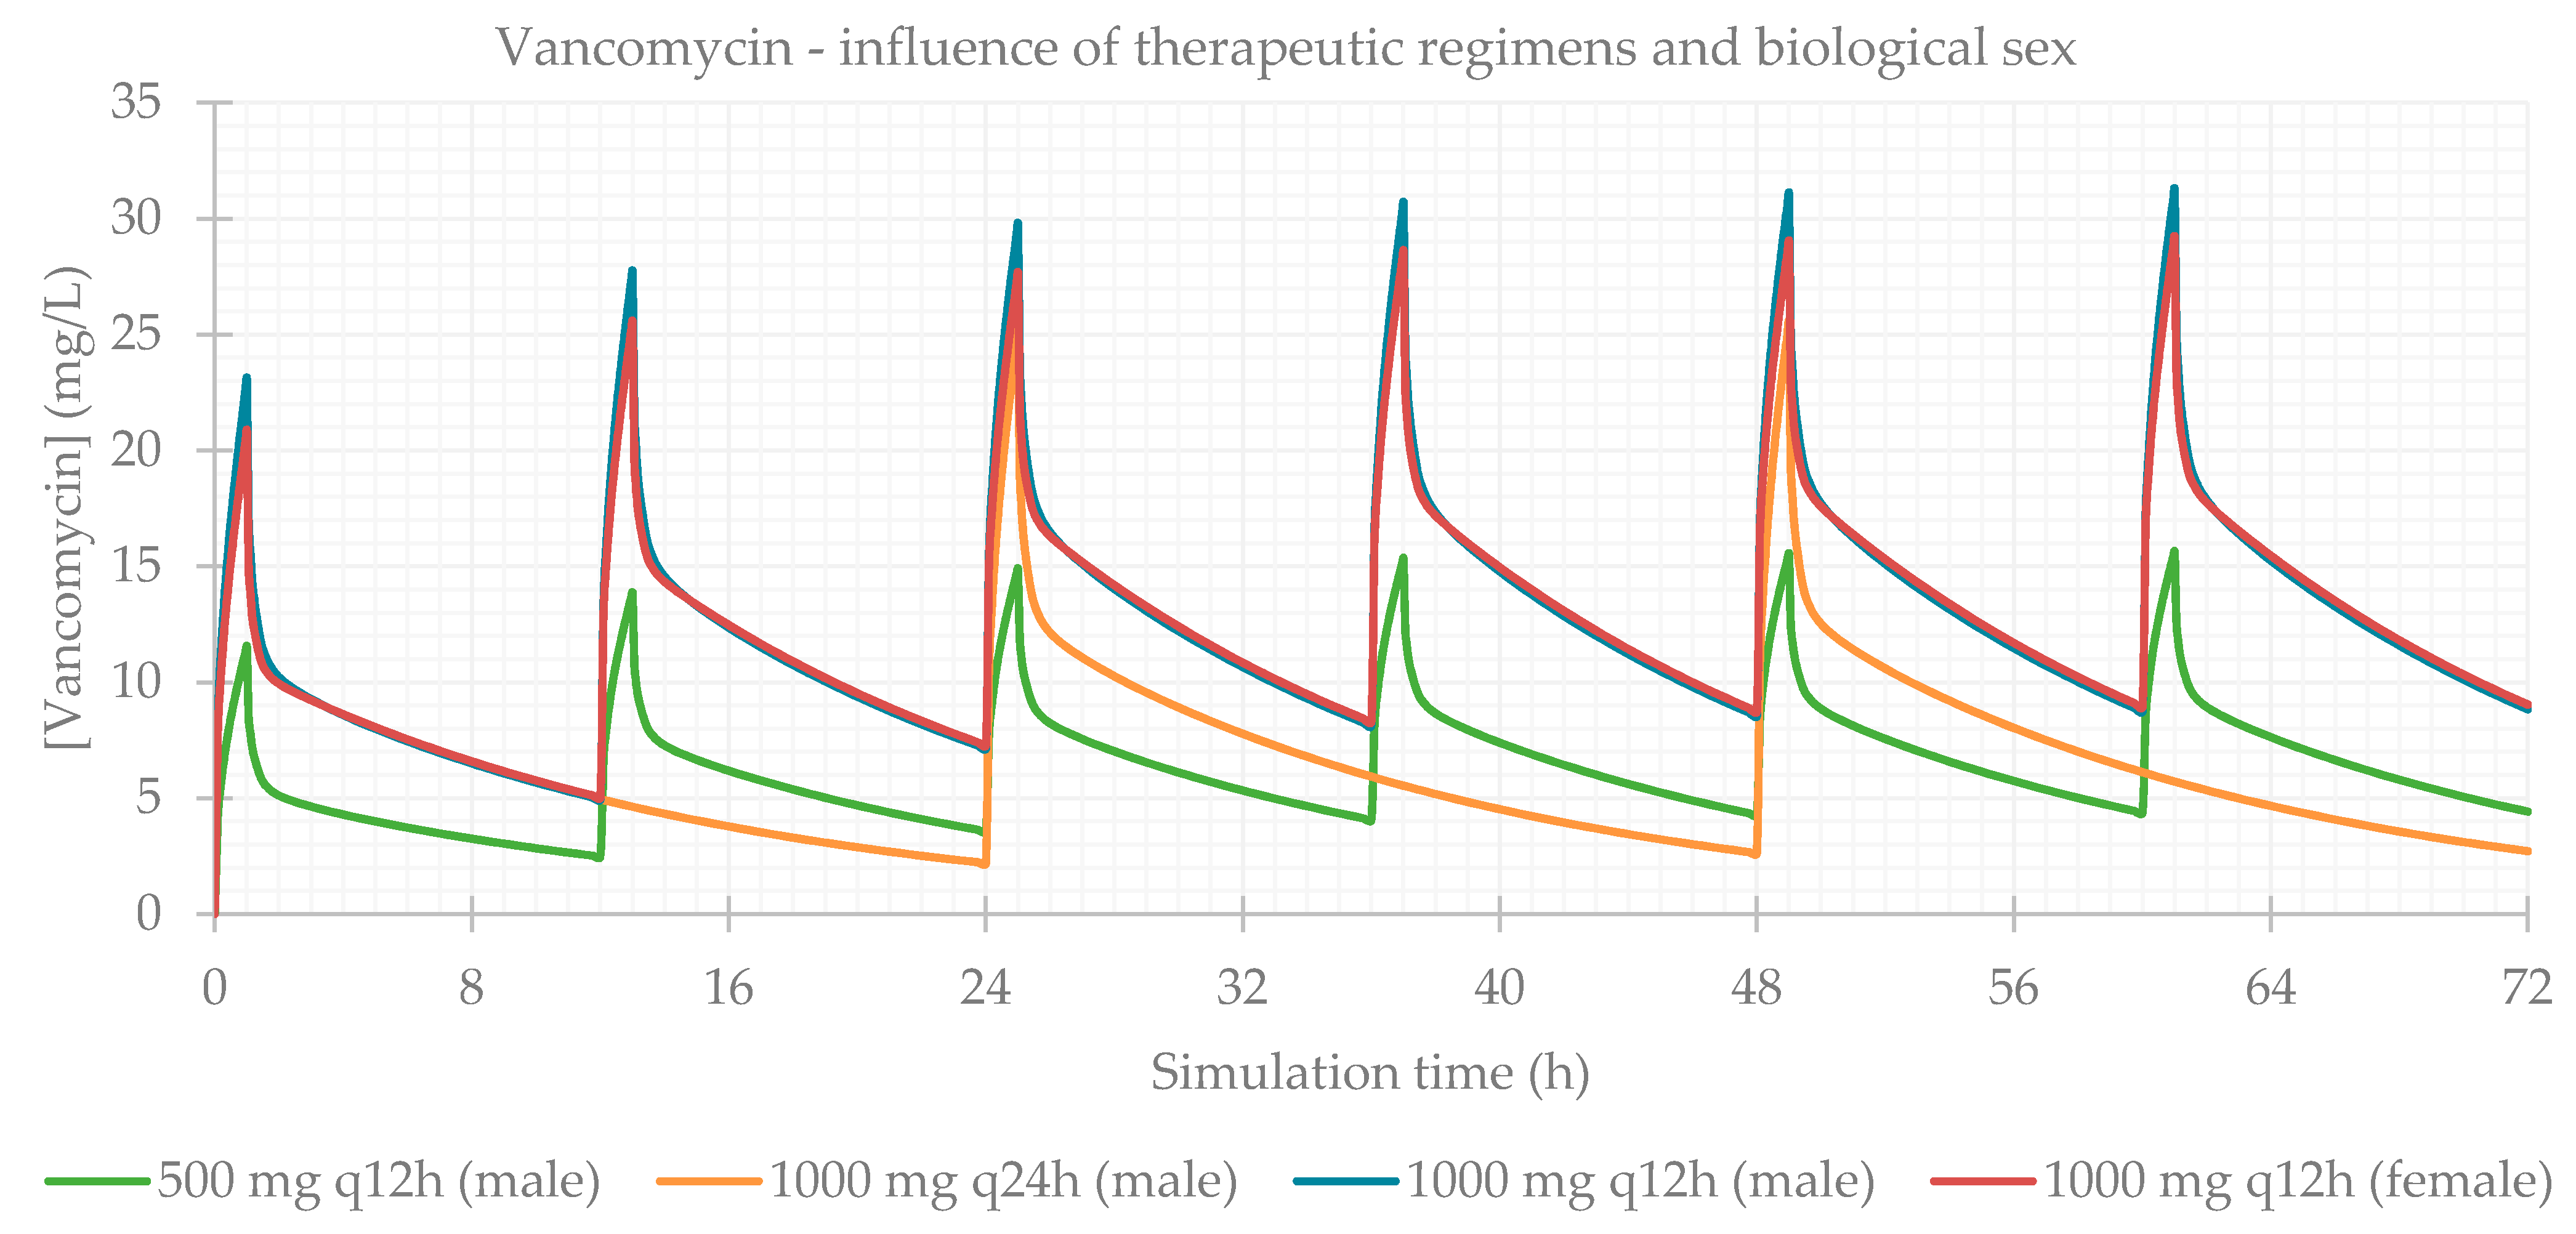
3.1. Influence of Dose Regimens and Biological Sex

Different therapeutic regimens (doses and dosing intervals) were studied for each antibiotic, based on the most common schemes administered to the patients in the study population. The influence of biological sex was also assessed. The simulation-calculated PK parameters are presented in Table 3 and the plasma concentration–time profiles showing the influence of these two factors are presented for each antibiotic in Figure 1, Figure 2, Figure 3 and Figure 4. As expected for IV infusions, the predicted fraction absorbed (Fa) and bioavailability (F) of all antibiotics were >99%, and a peak in antibiotic concentration was always predicted to be reached at the end of infusions. GastroPlus™ also calculated a direct proportionality of dose with Cmax and AUC: doubling the dose increased these PK parameters by 2-fold. Additionally, with shorter time intervals between doses, antibiotic accumulation in plasma was more evident. Regarding biological sex, slight differences were observed between the profiles simulated for male and female subjects; a higher Cmax, but lower concentrations until following administration is predicted for male individuals, except for vancomycin, where only differences in Cmax were noted.

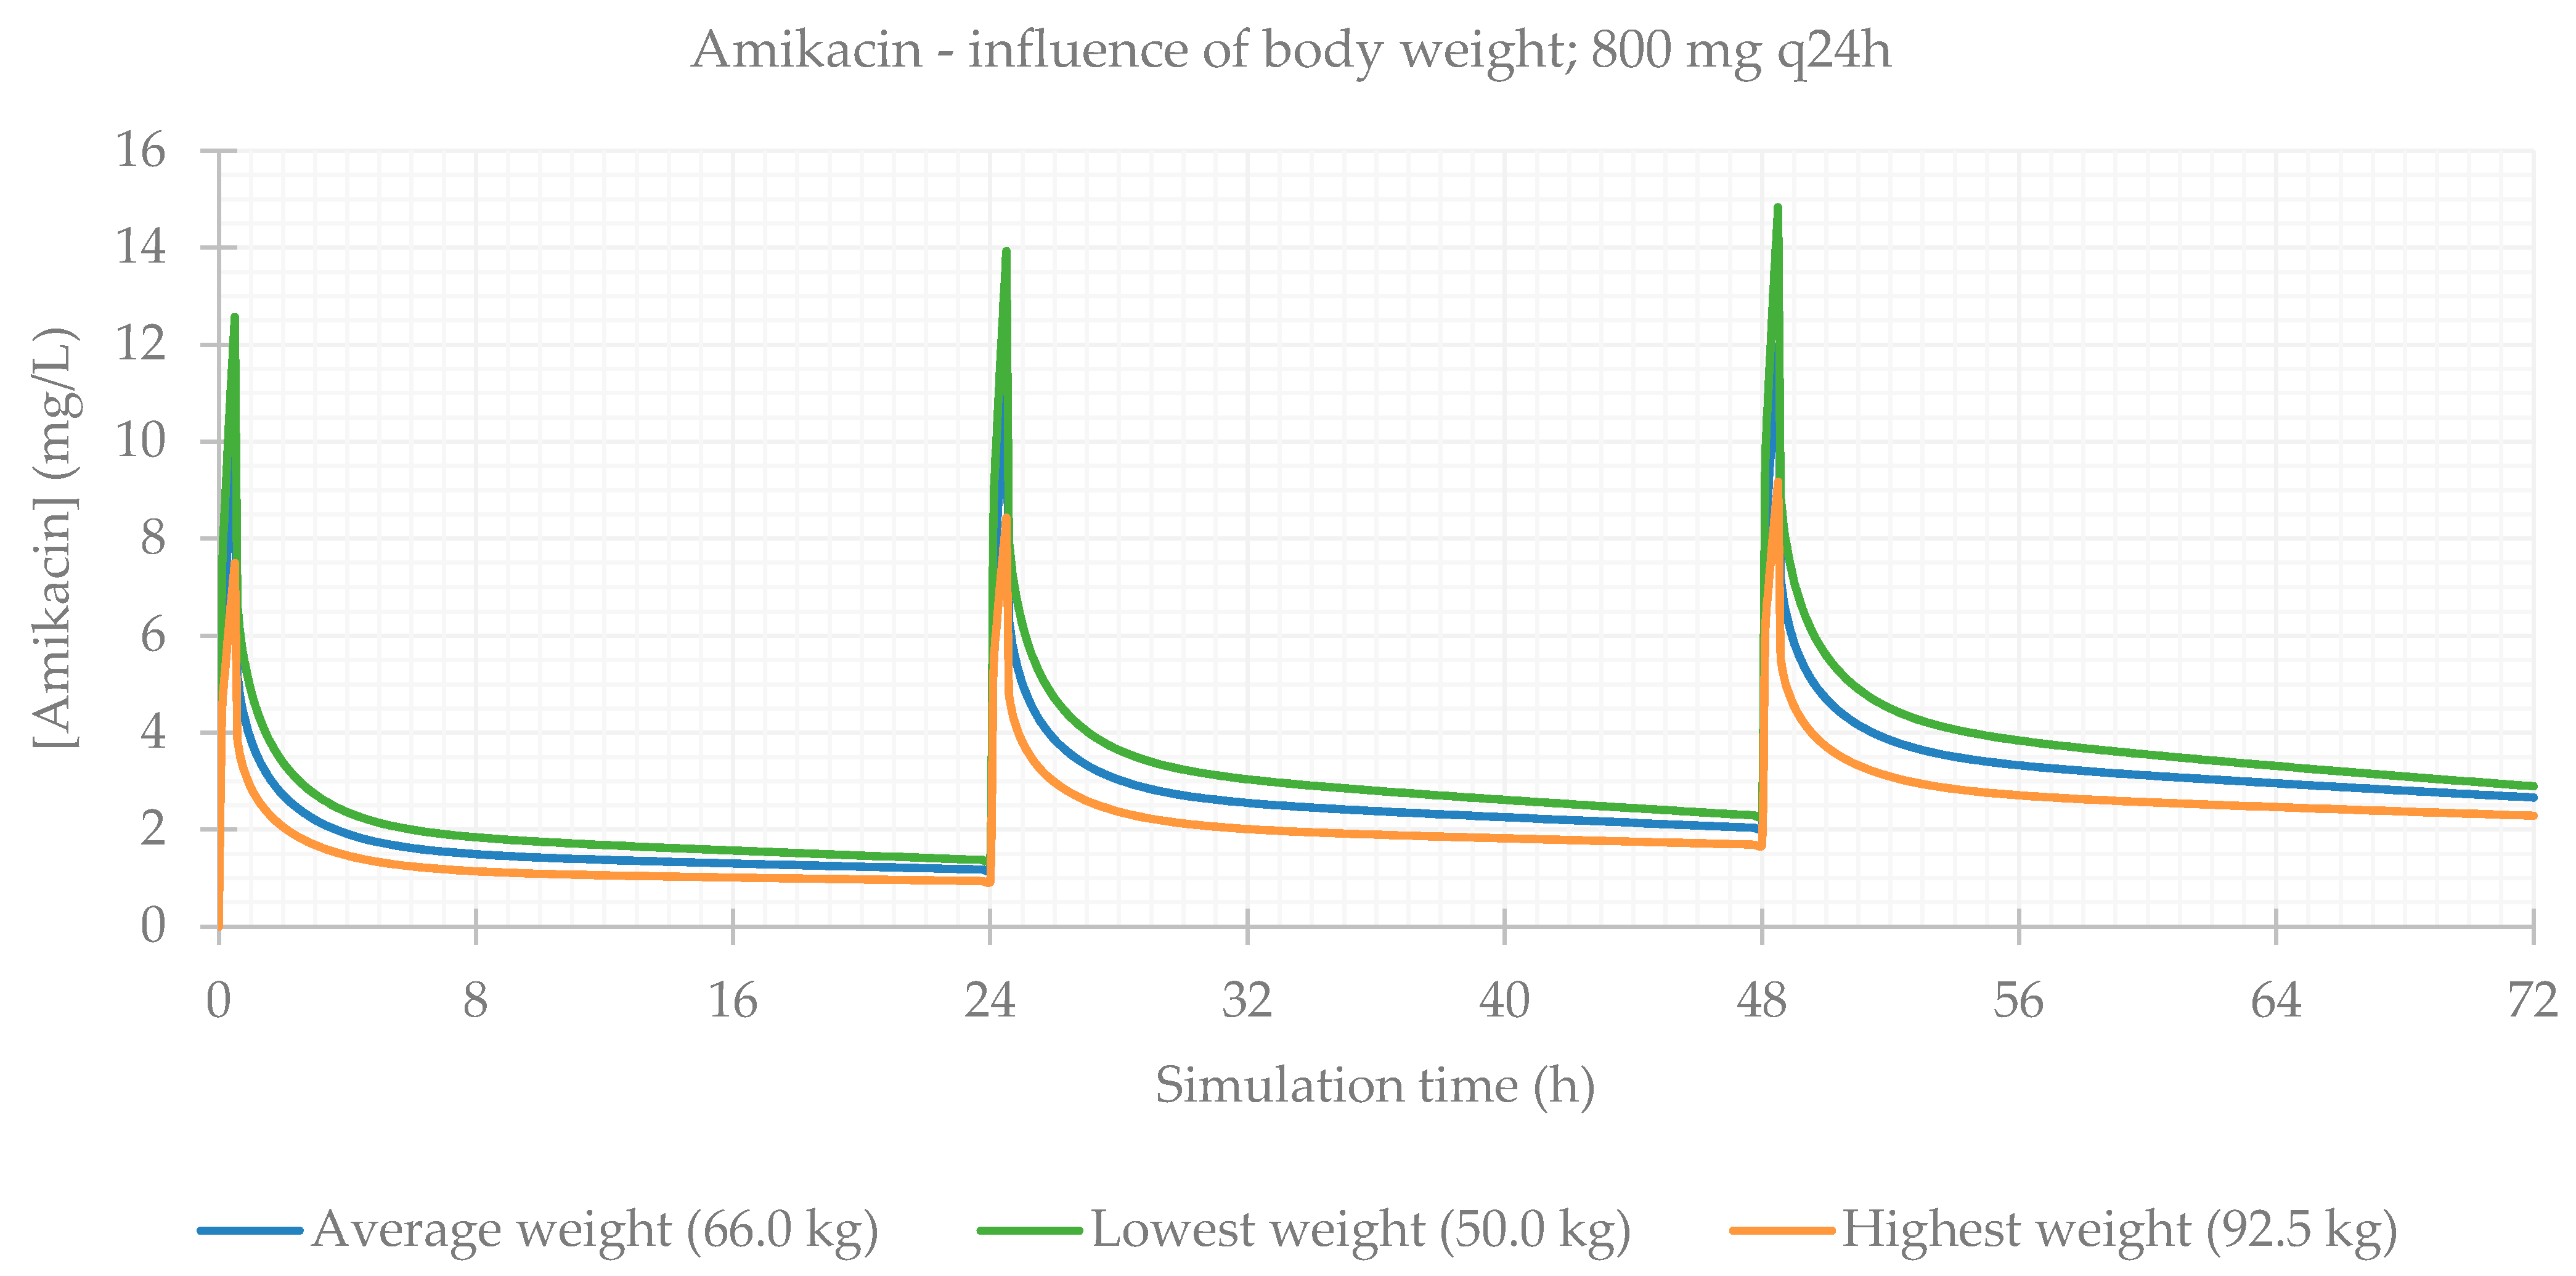
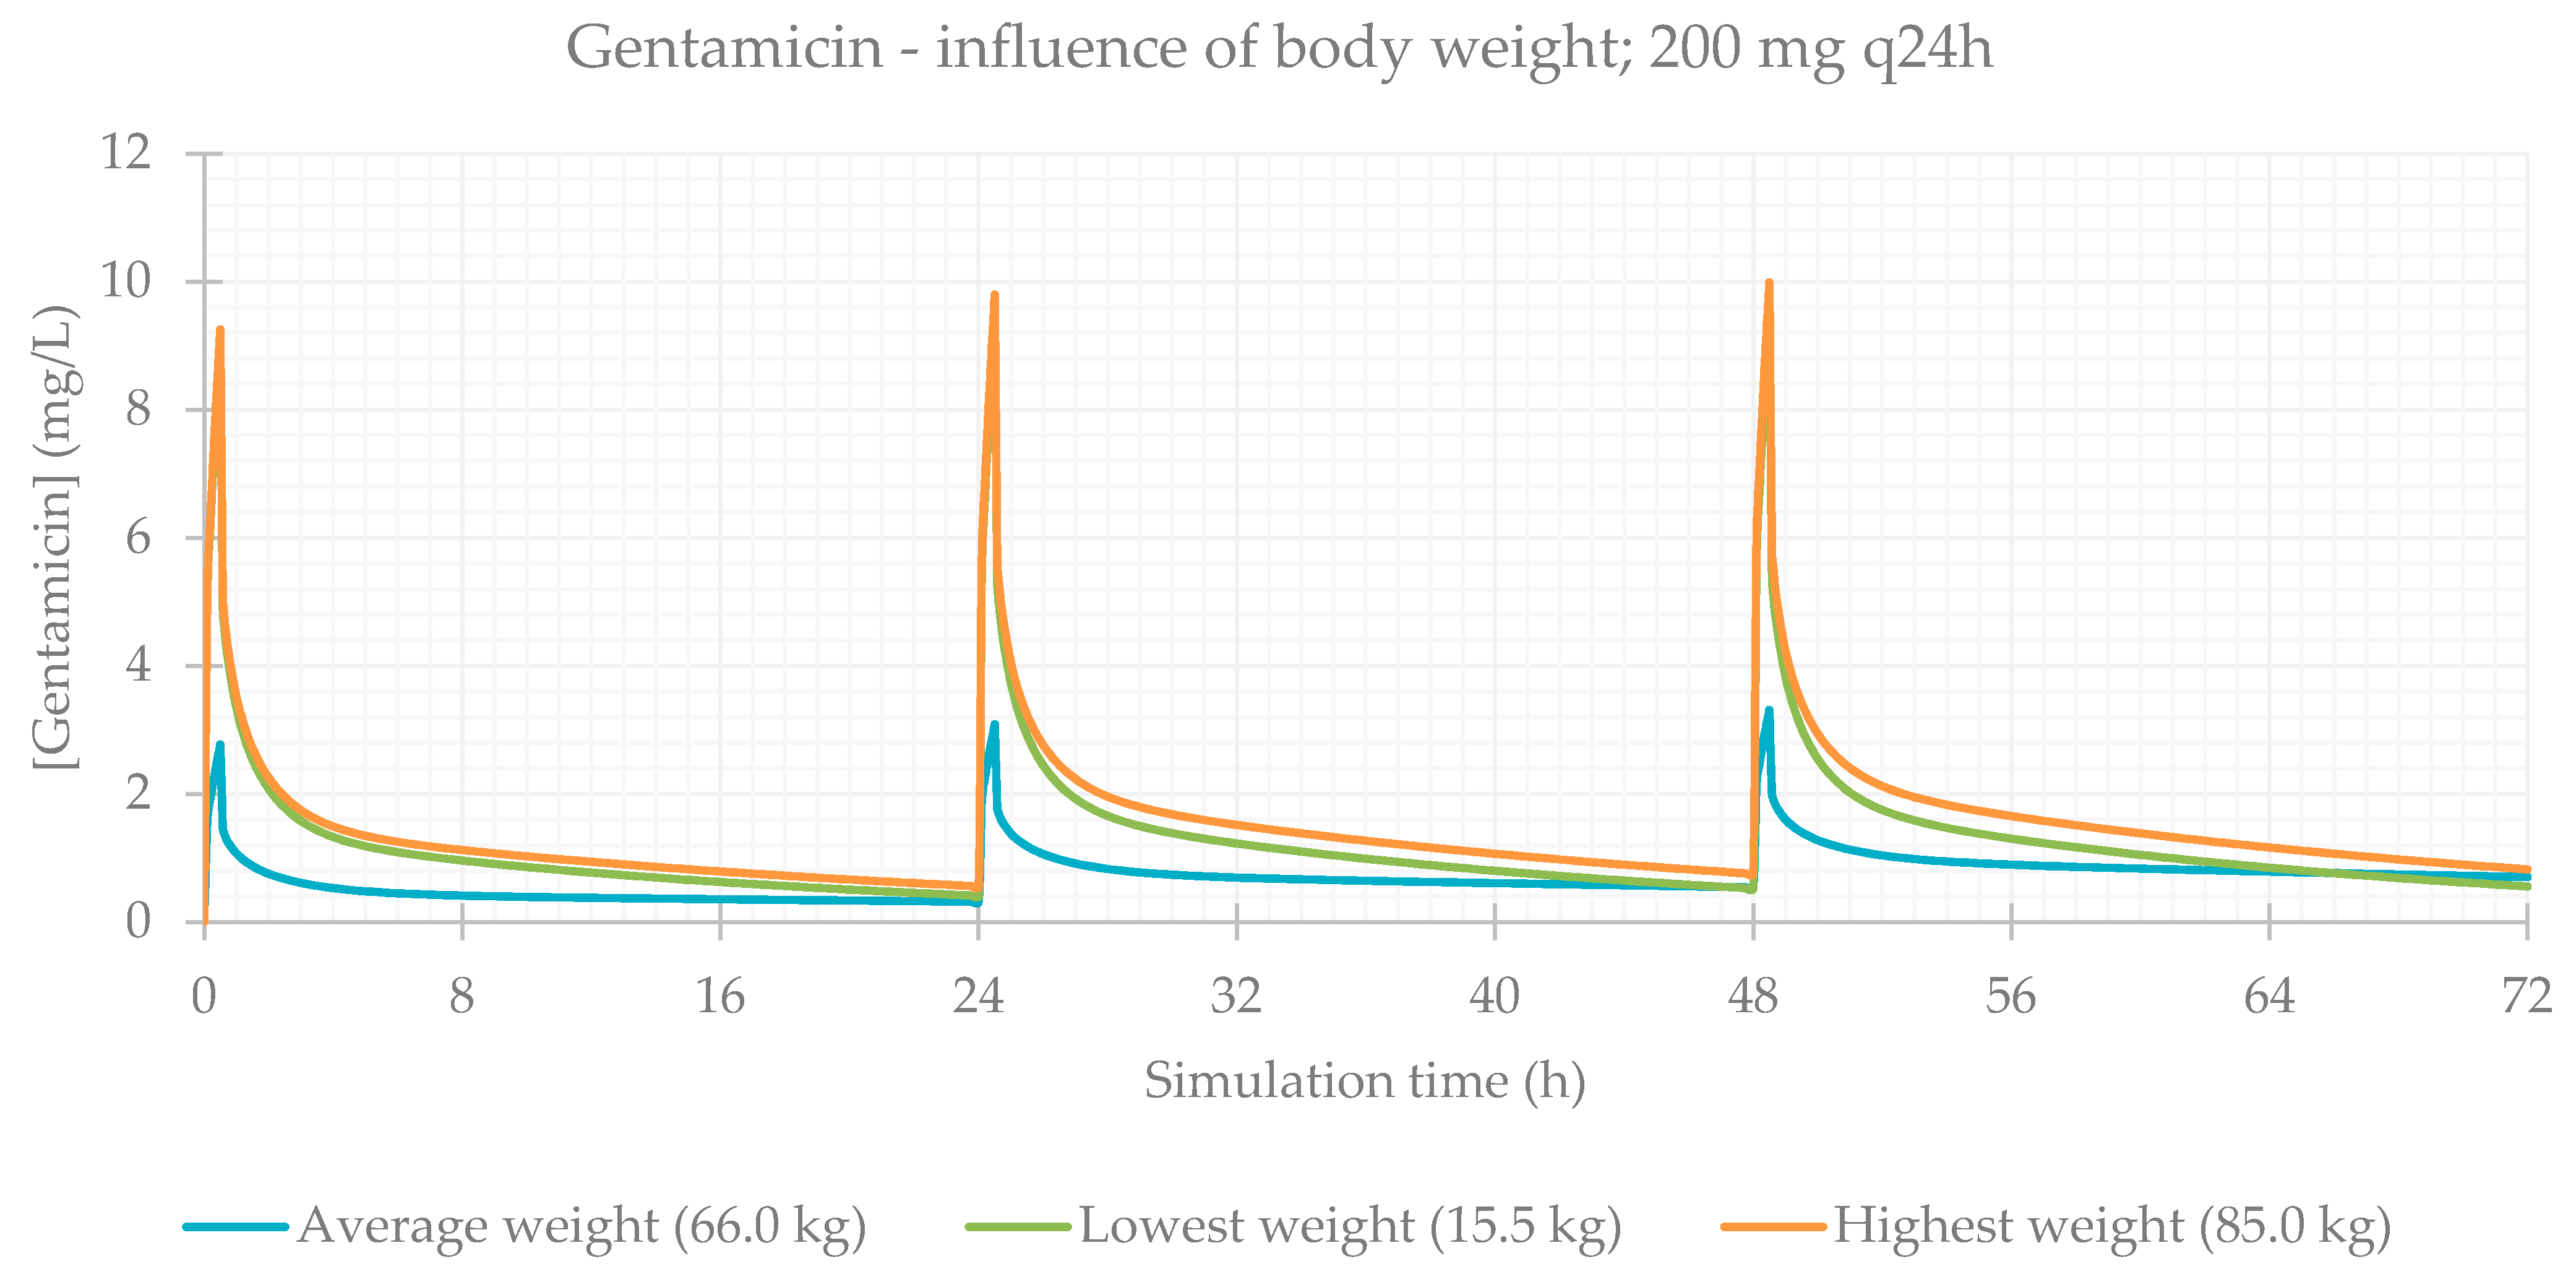
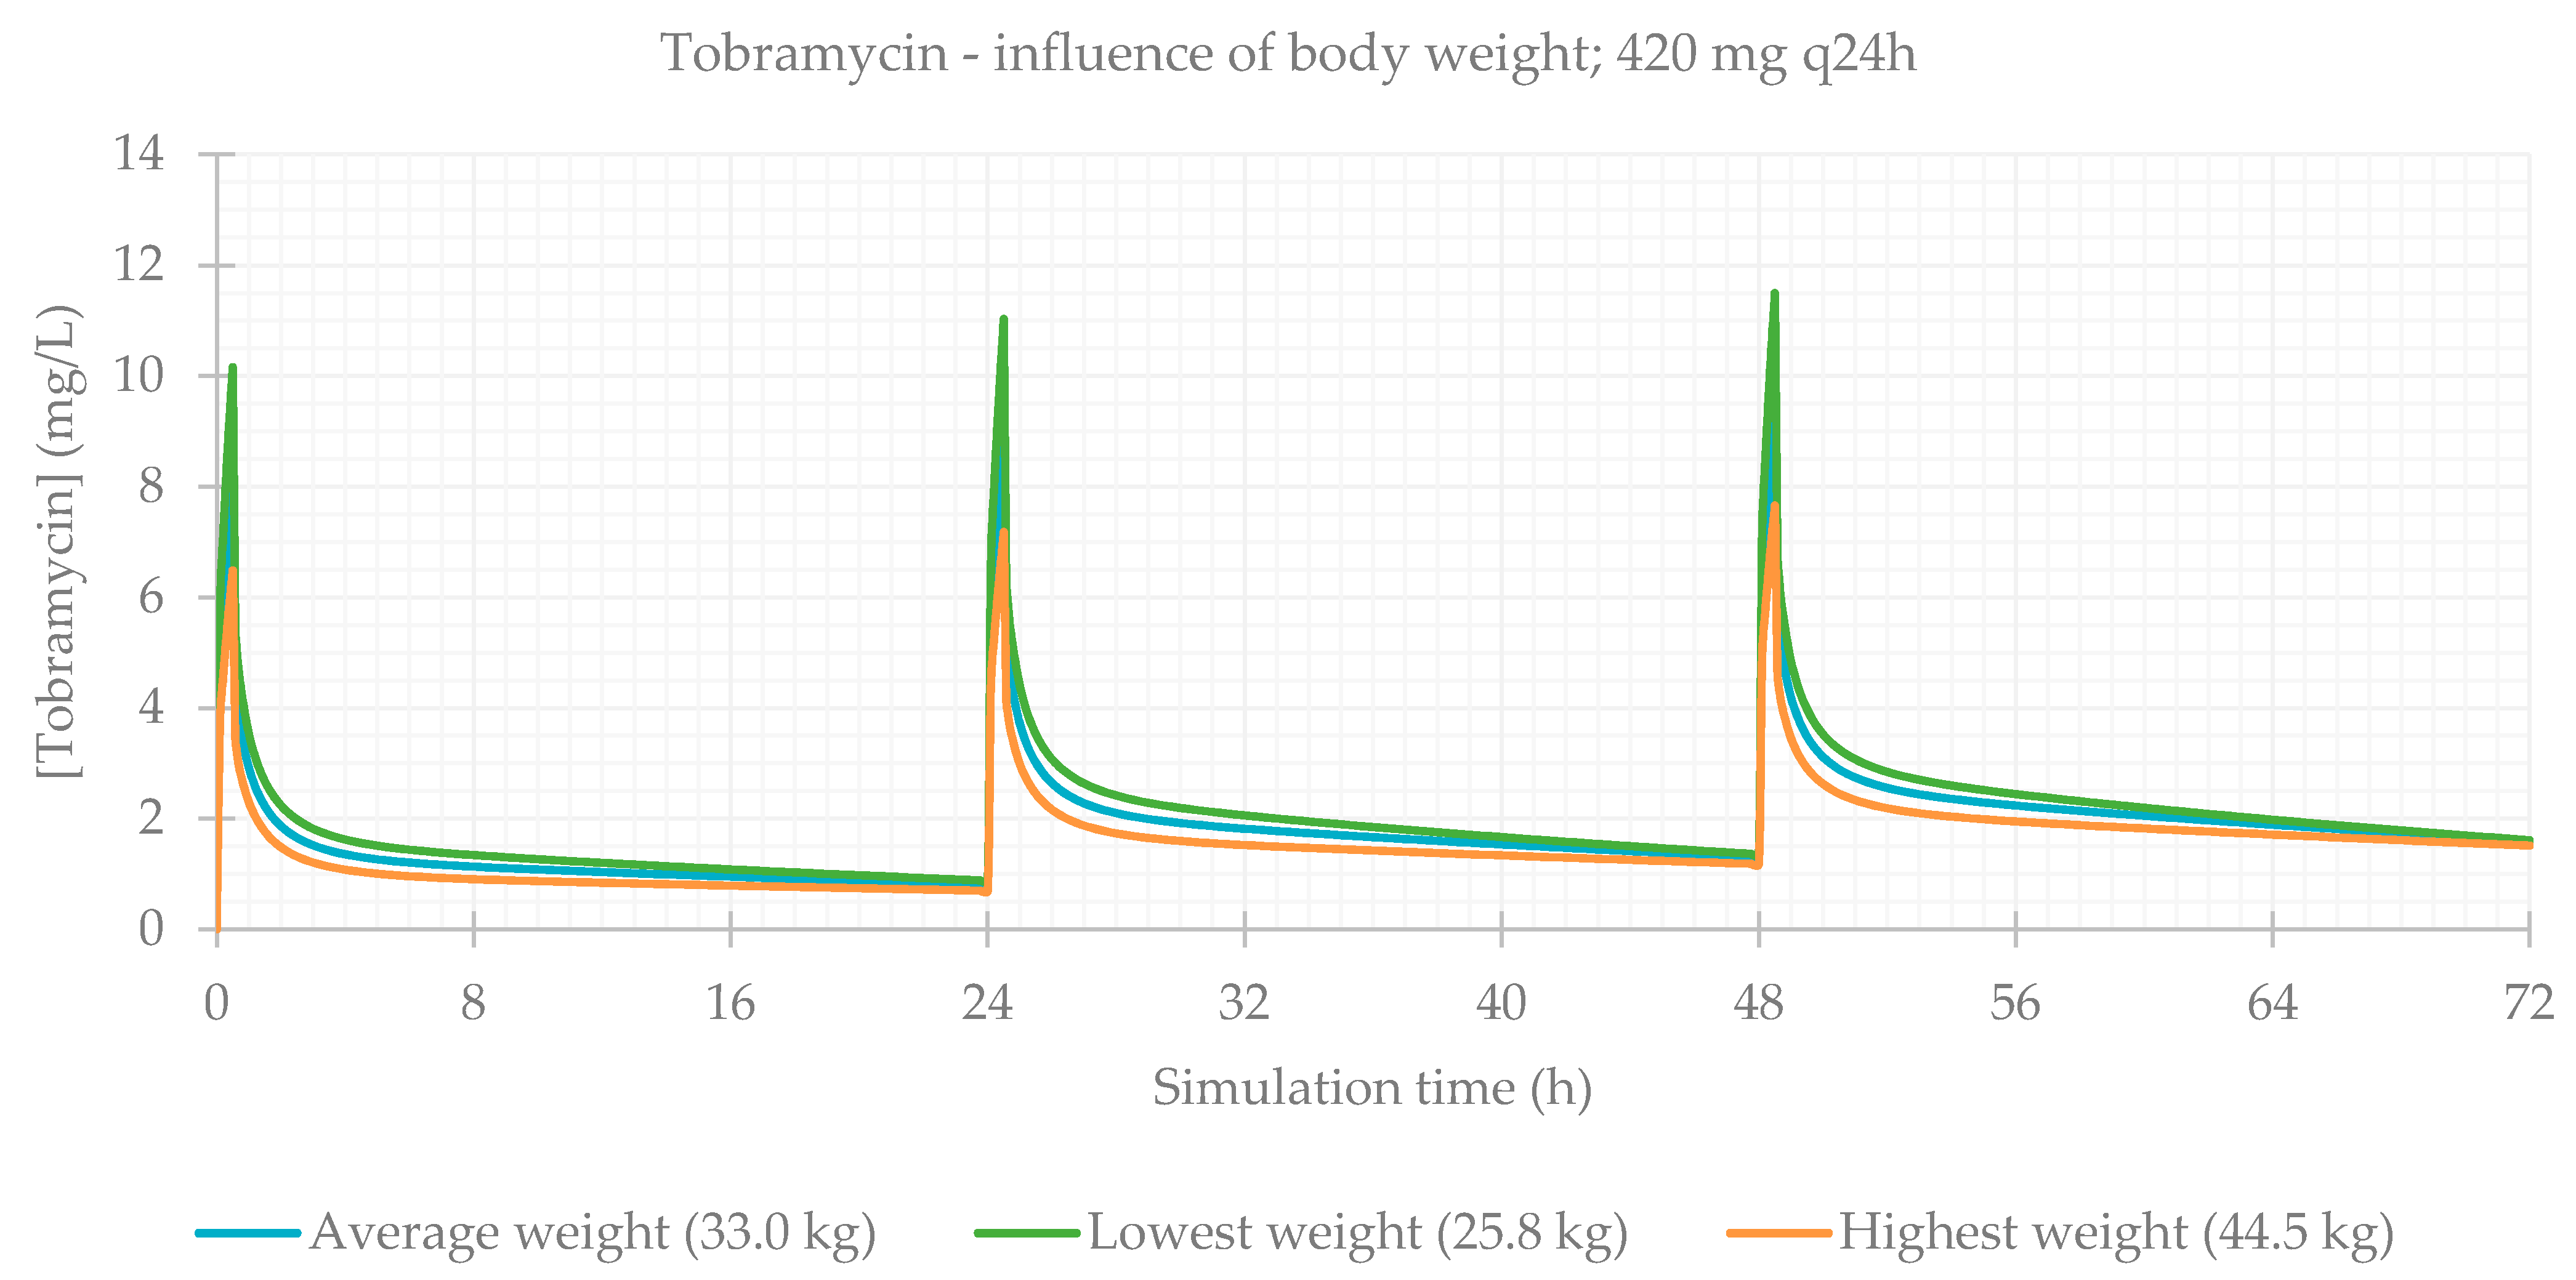
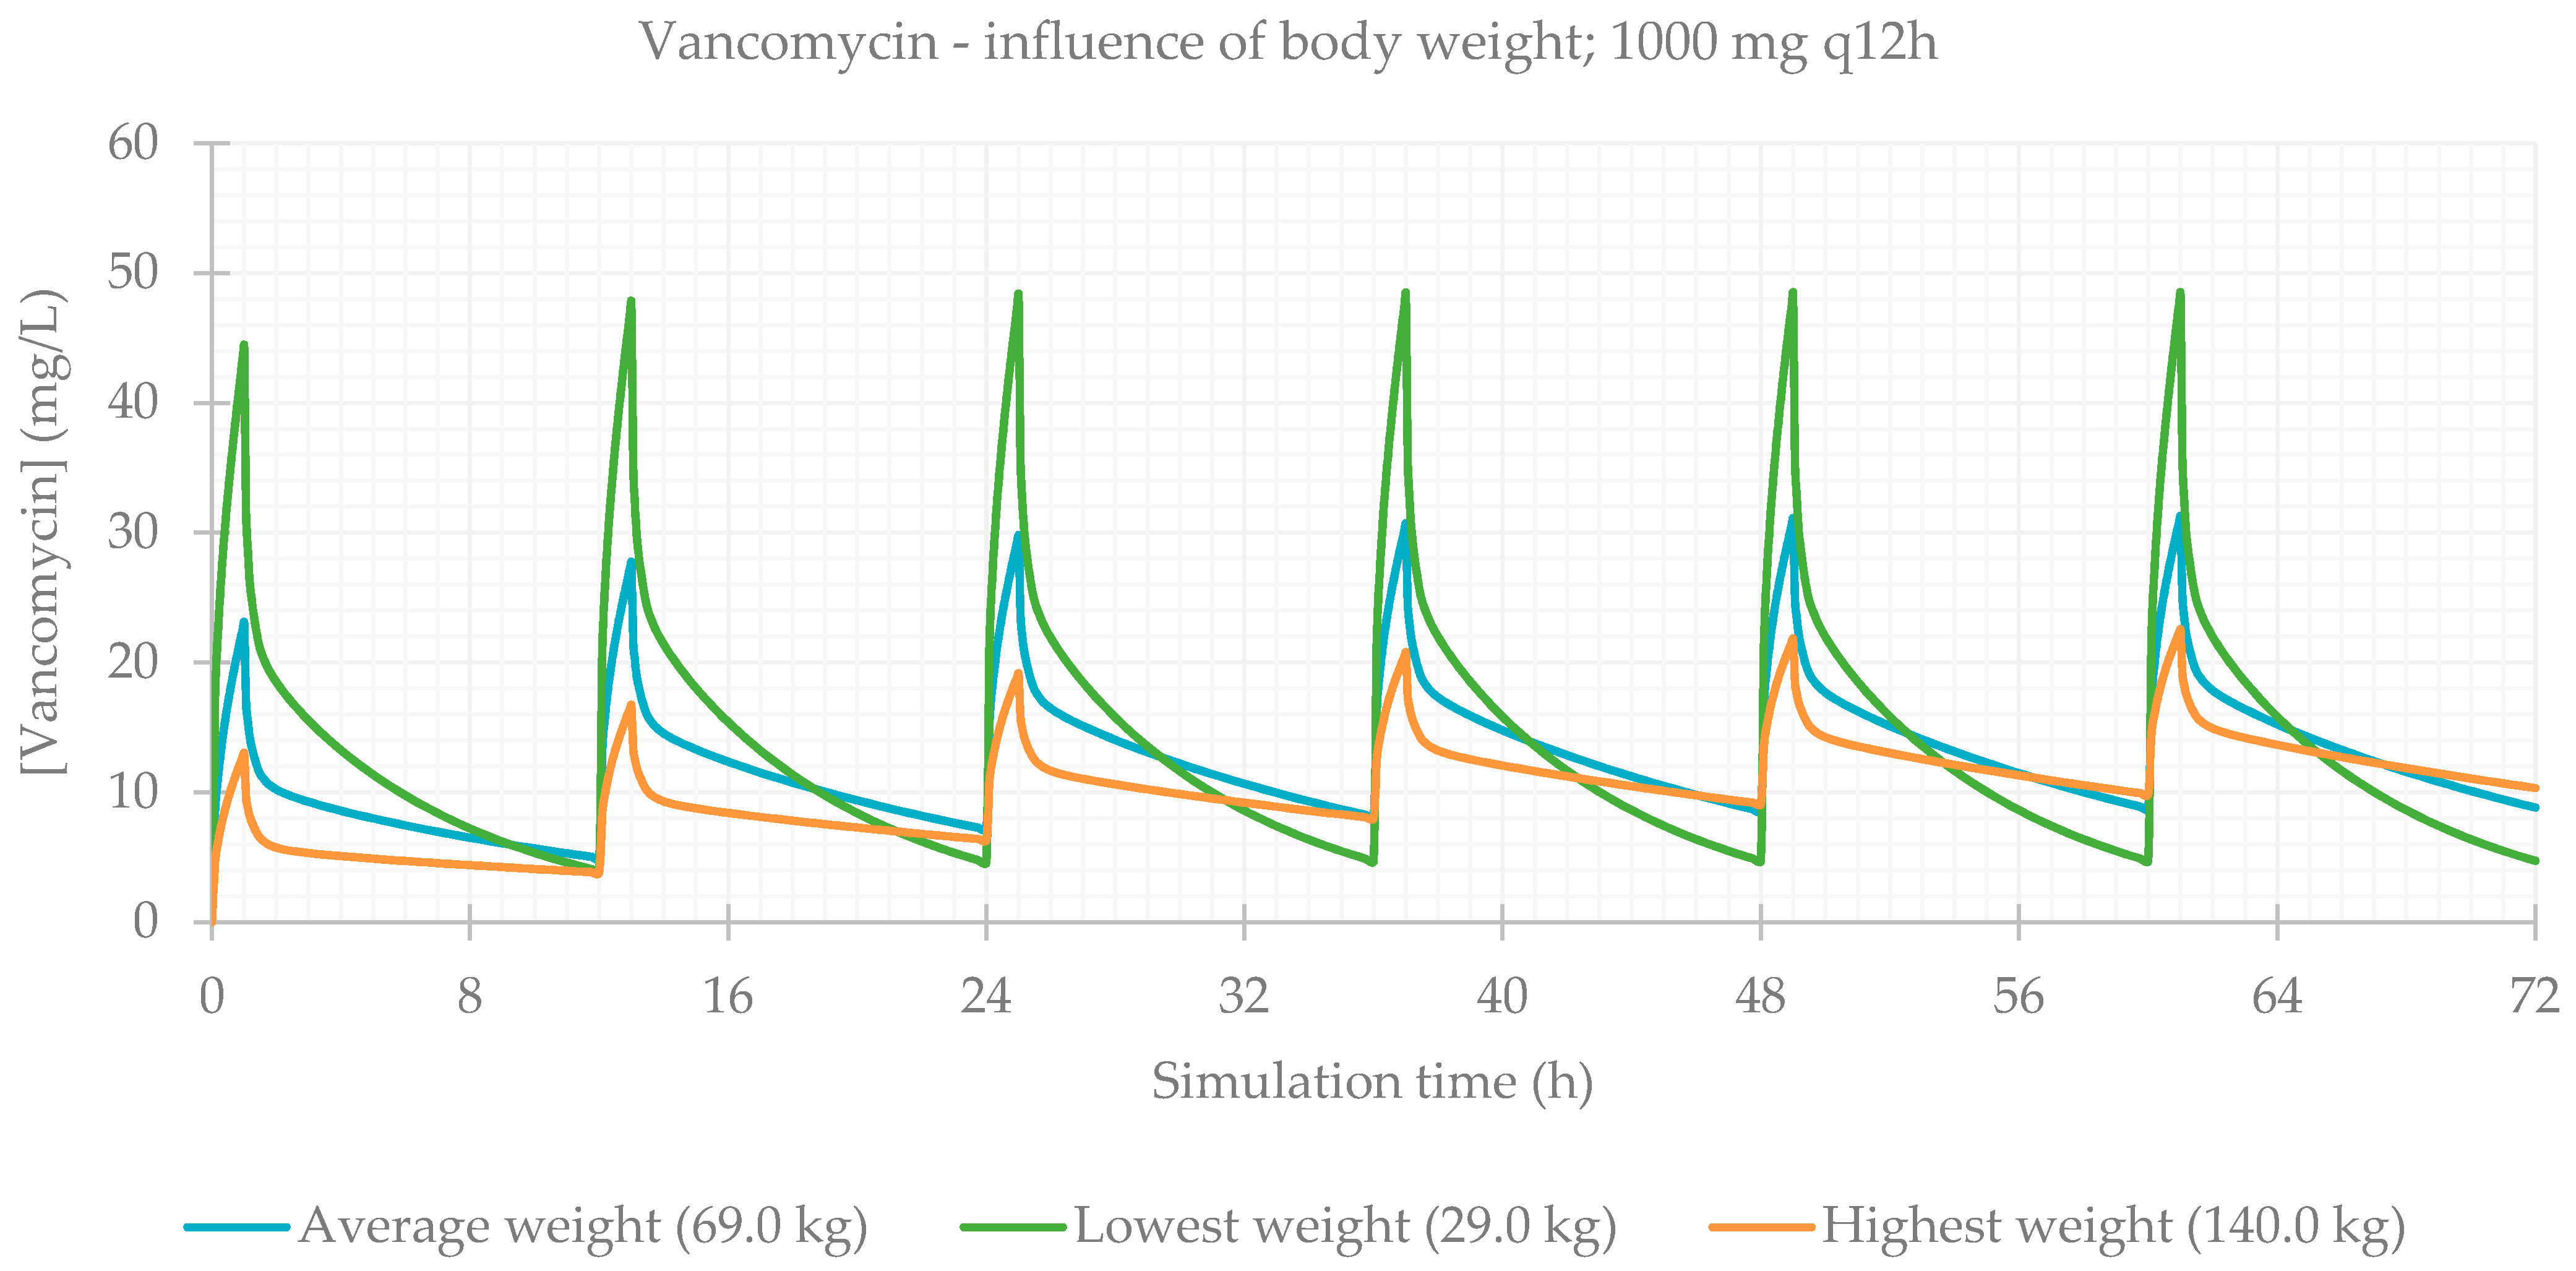
3.2. Influence of Total Body Weight

Concerning body composition, the influence of total body weight was assessed, and the resulting PK parameters are presented in Table 4. As expected, simulations for patients with a lower weight result in a higher Cmax and higher drug concentrations maintained throughout time. The plasma concentration–time profiles showing the influence of this parameter are shown for each antibiotic in Figure 5, Figure 6, Figure 7 and Figure 8.

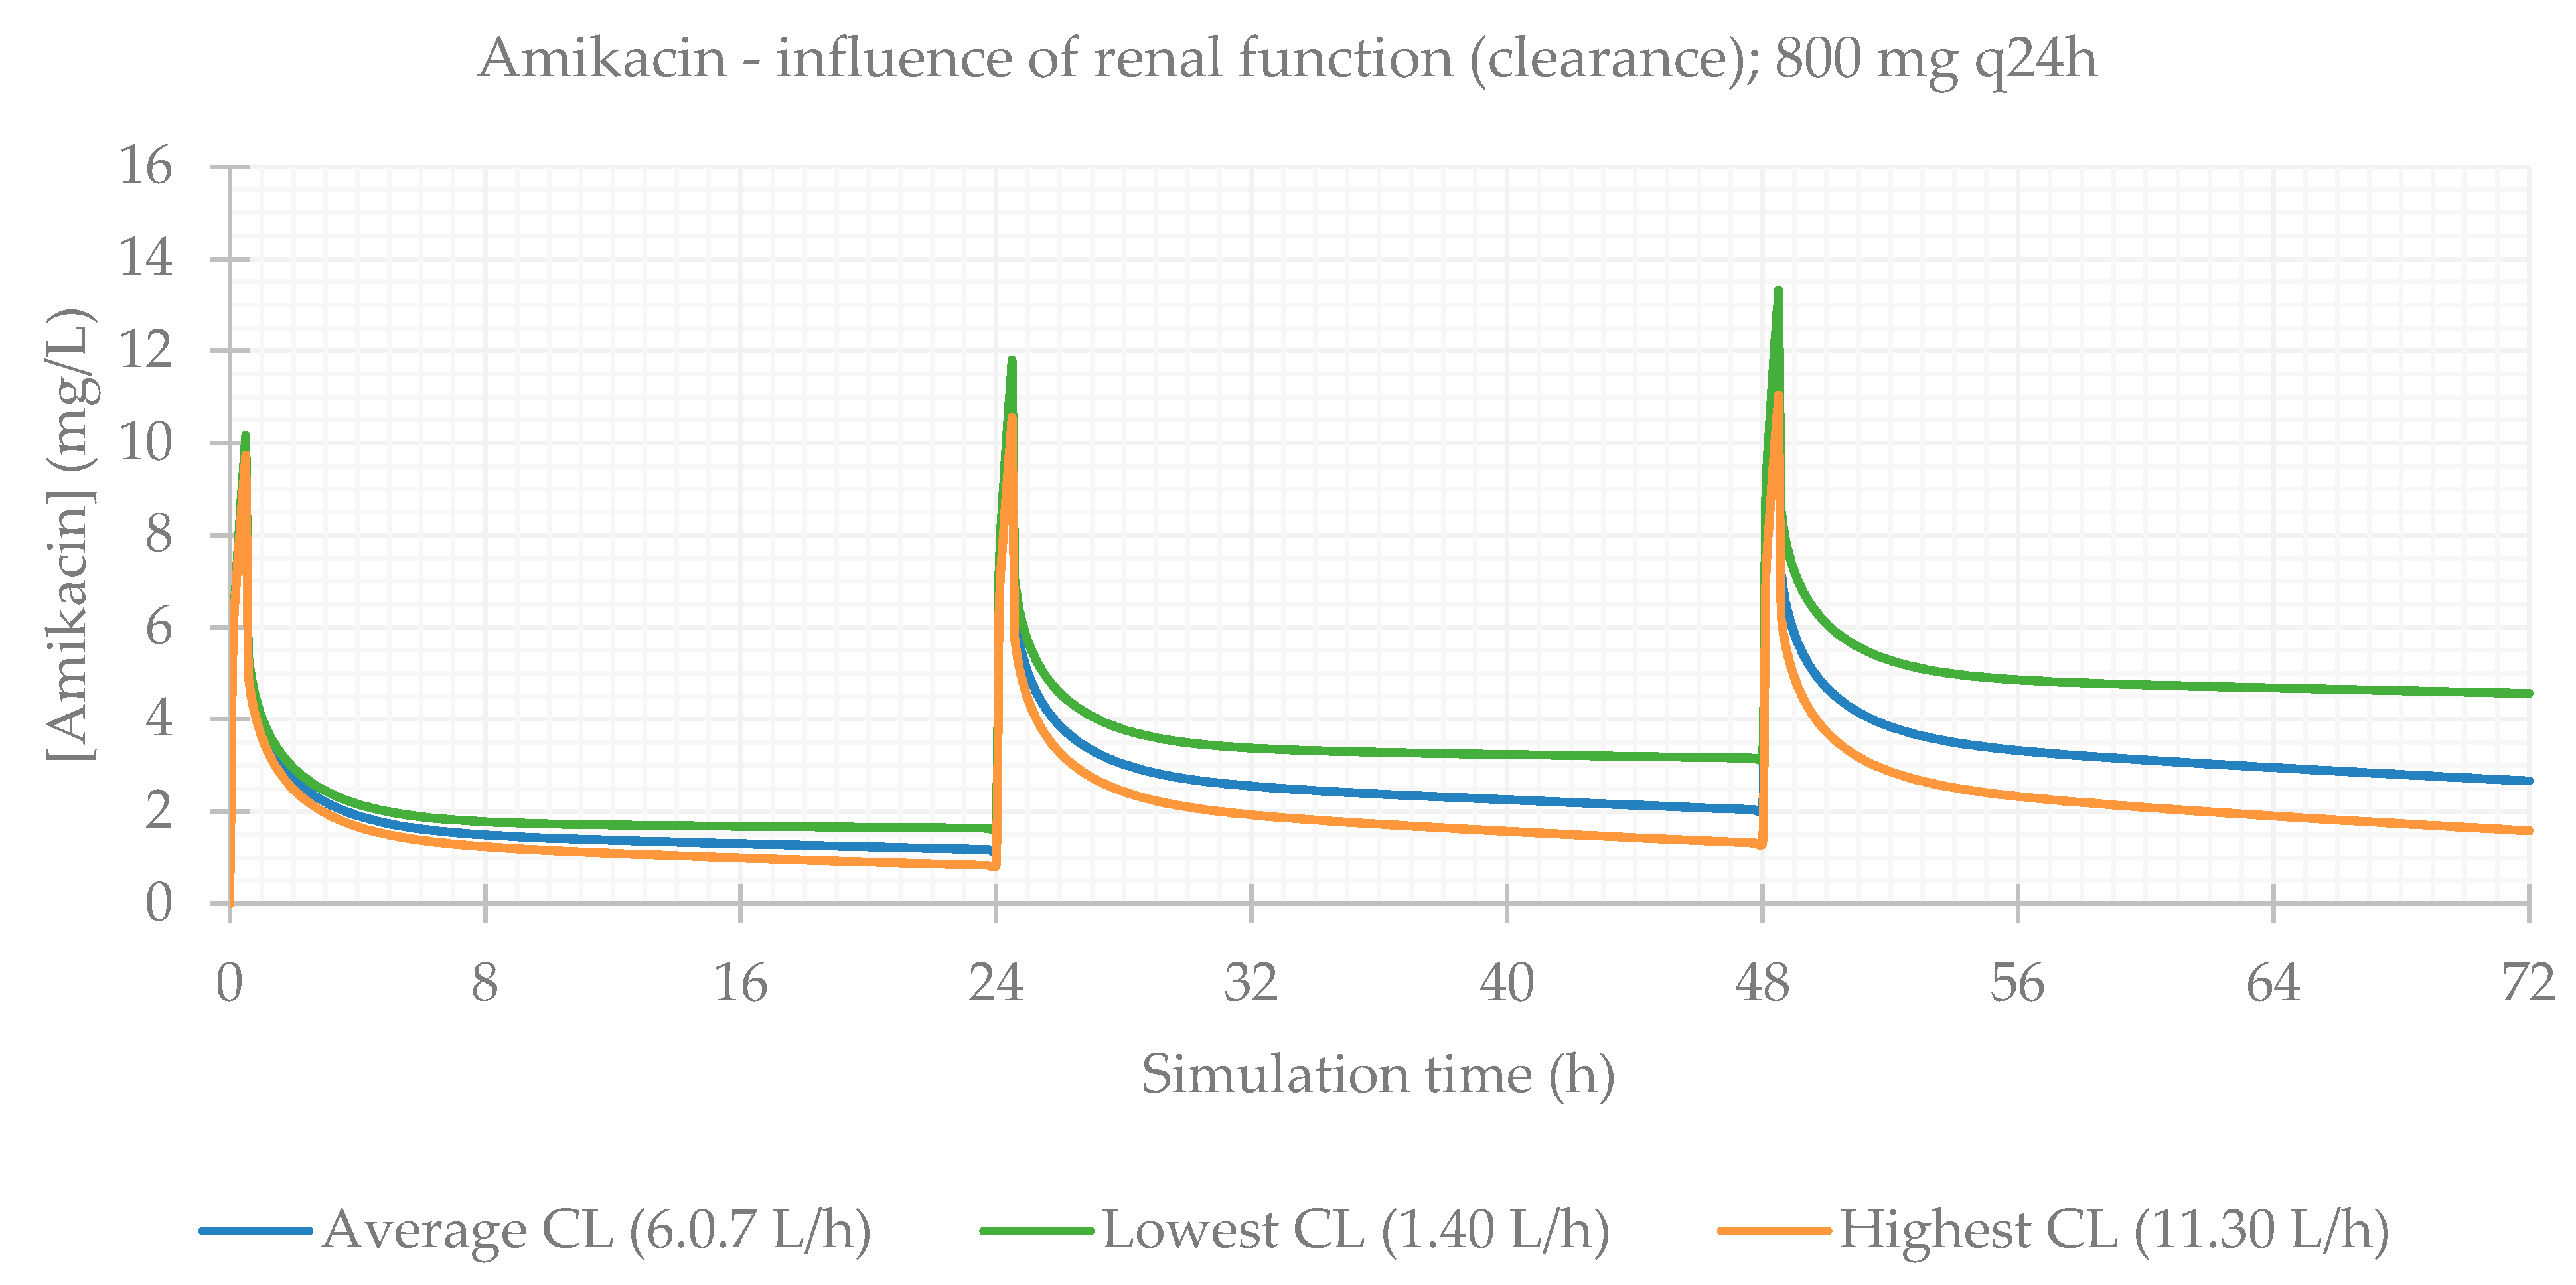
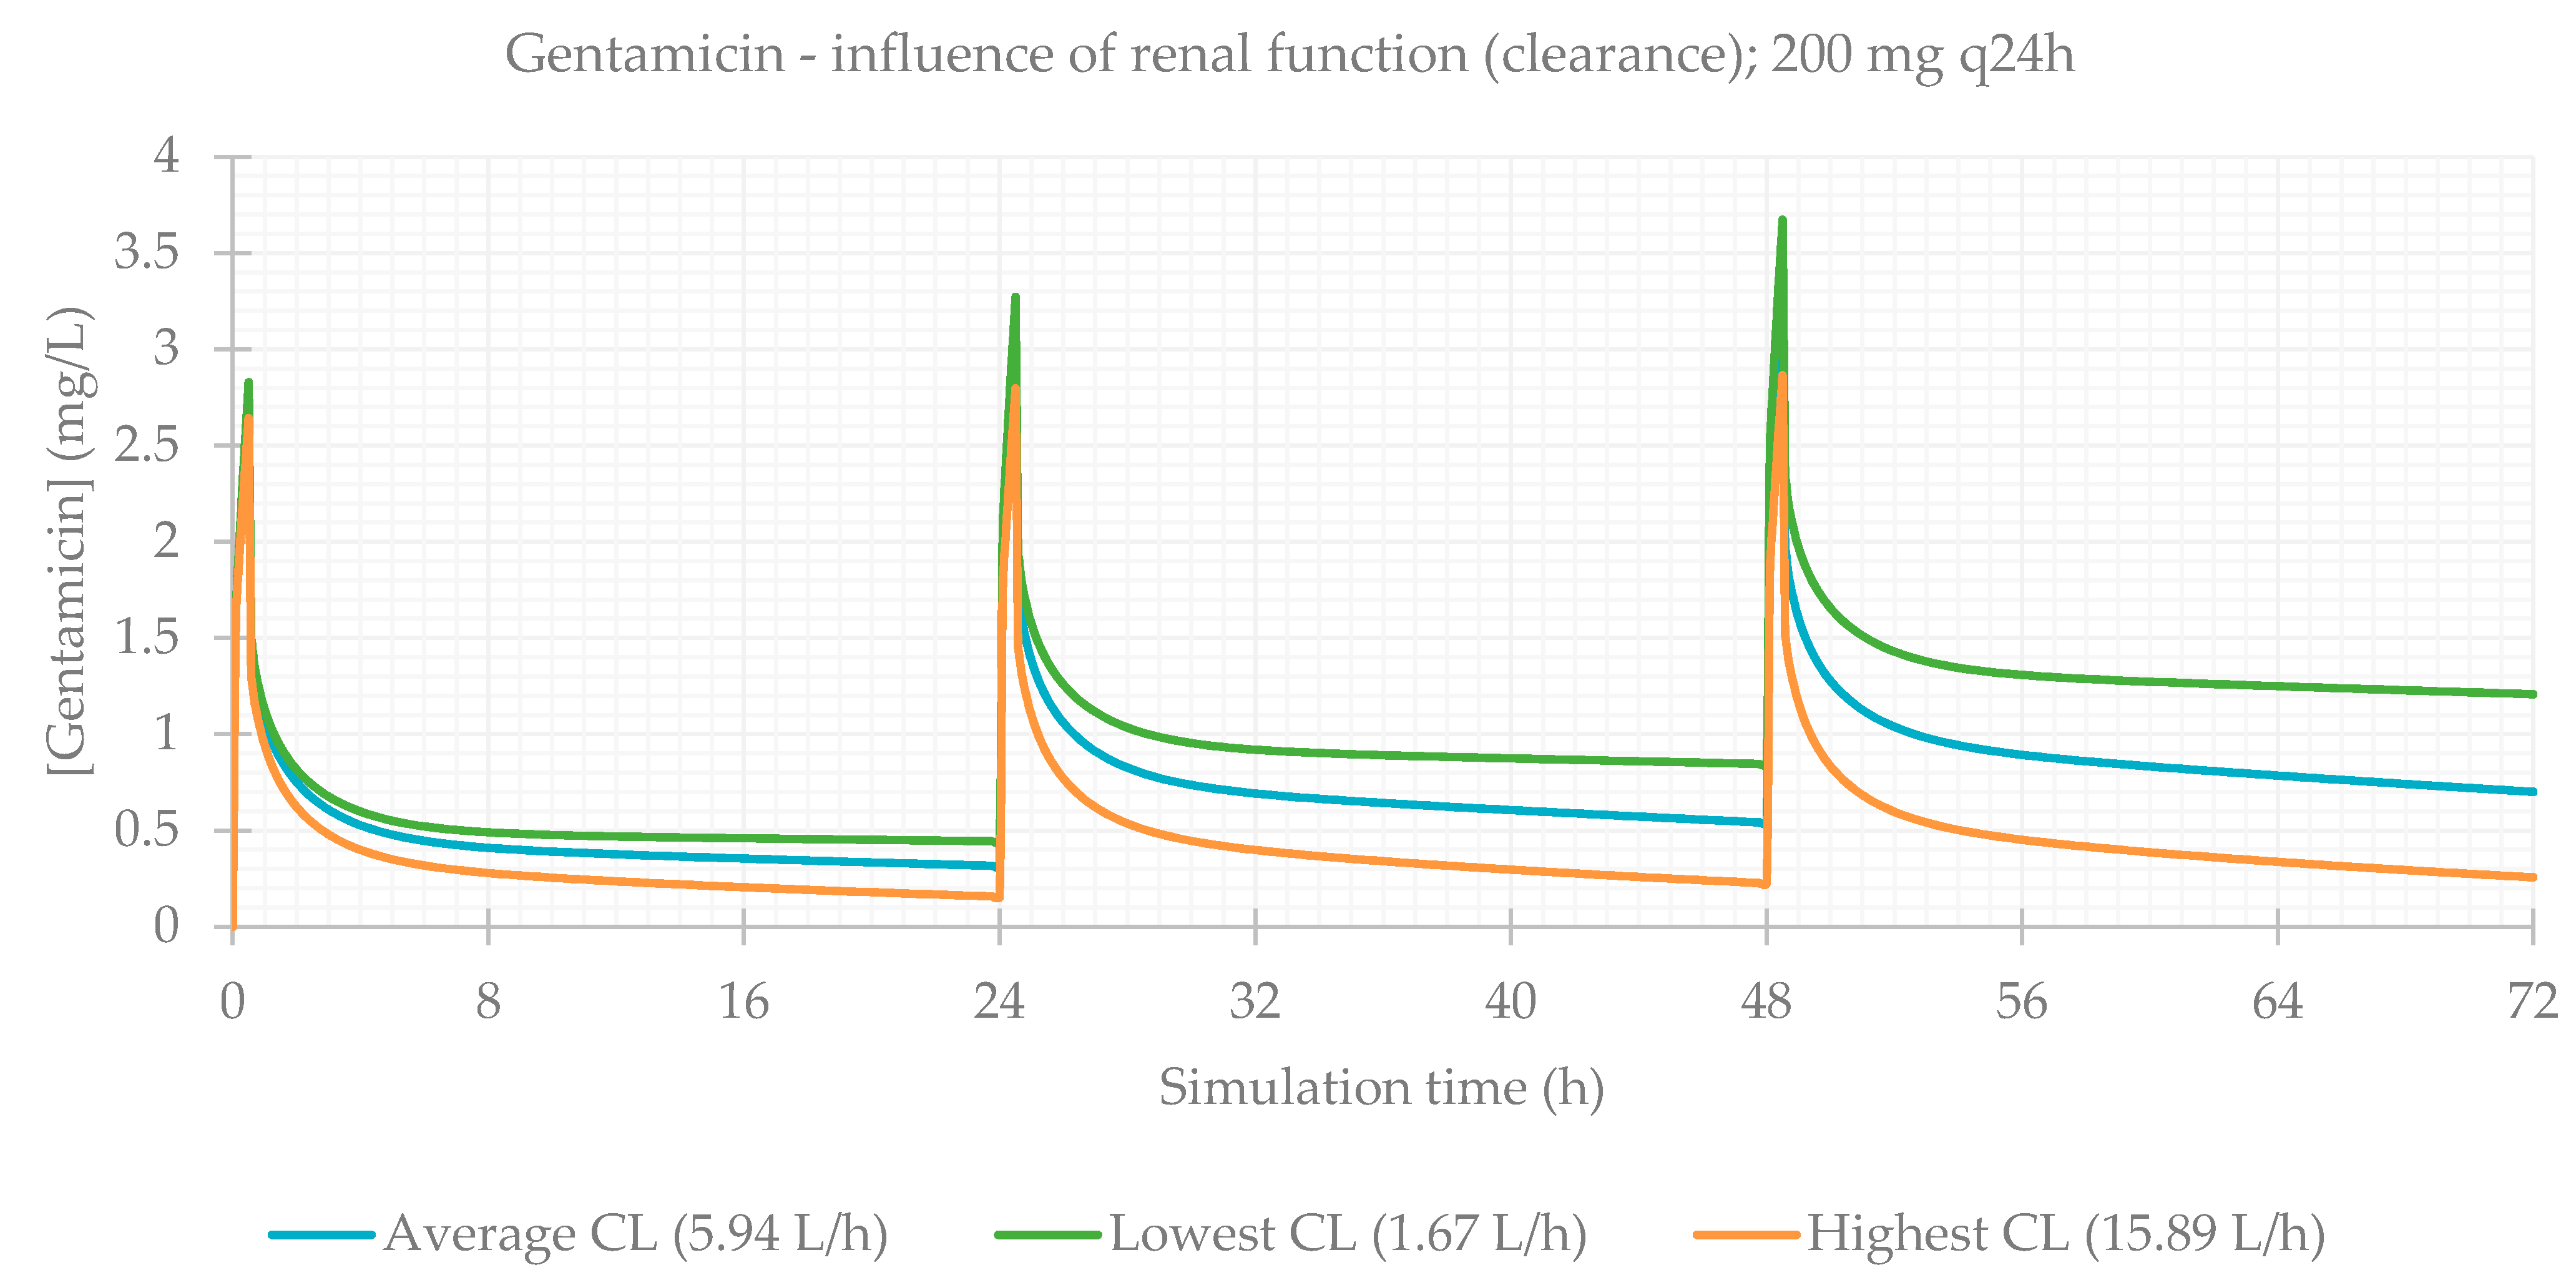
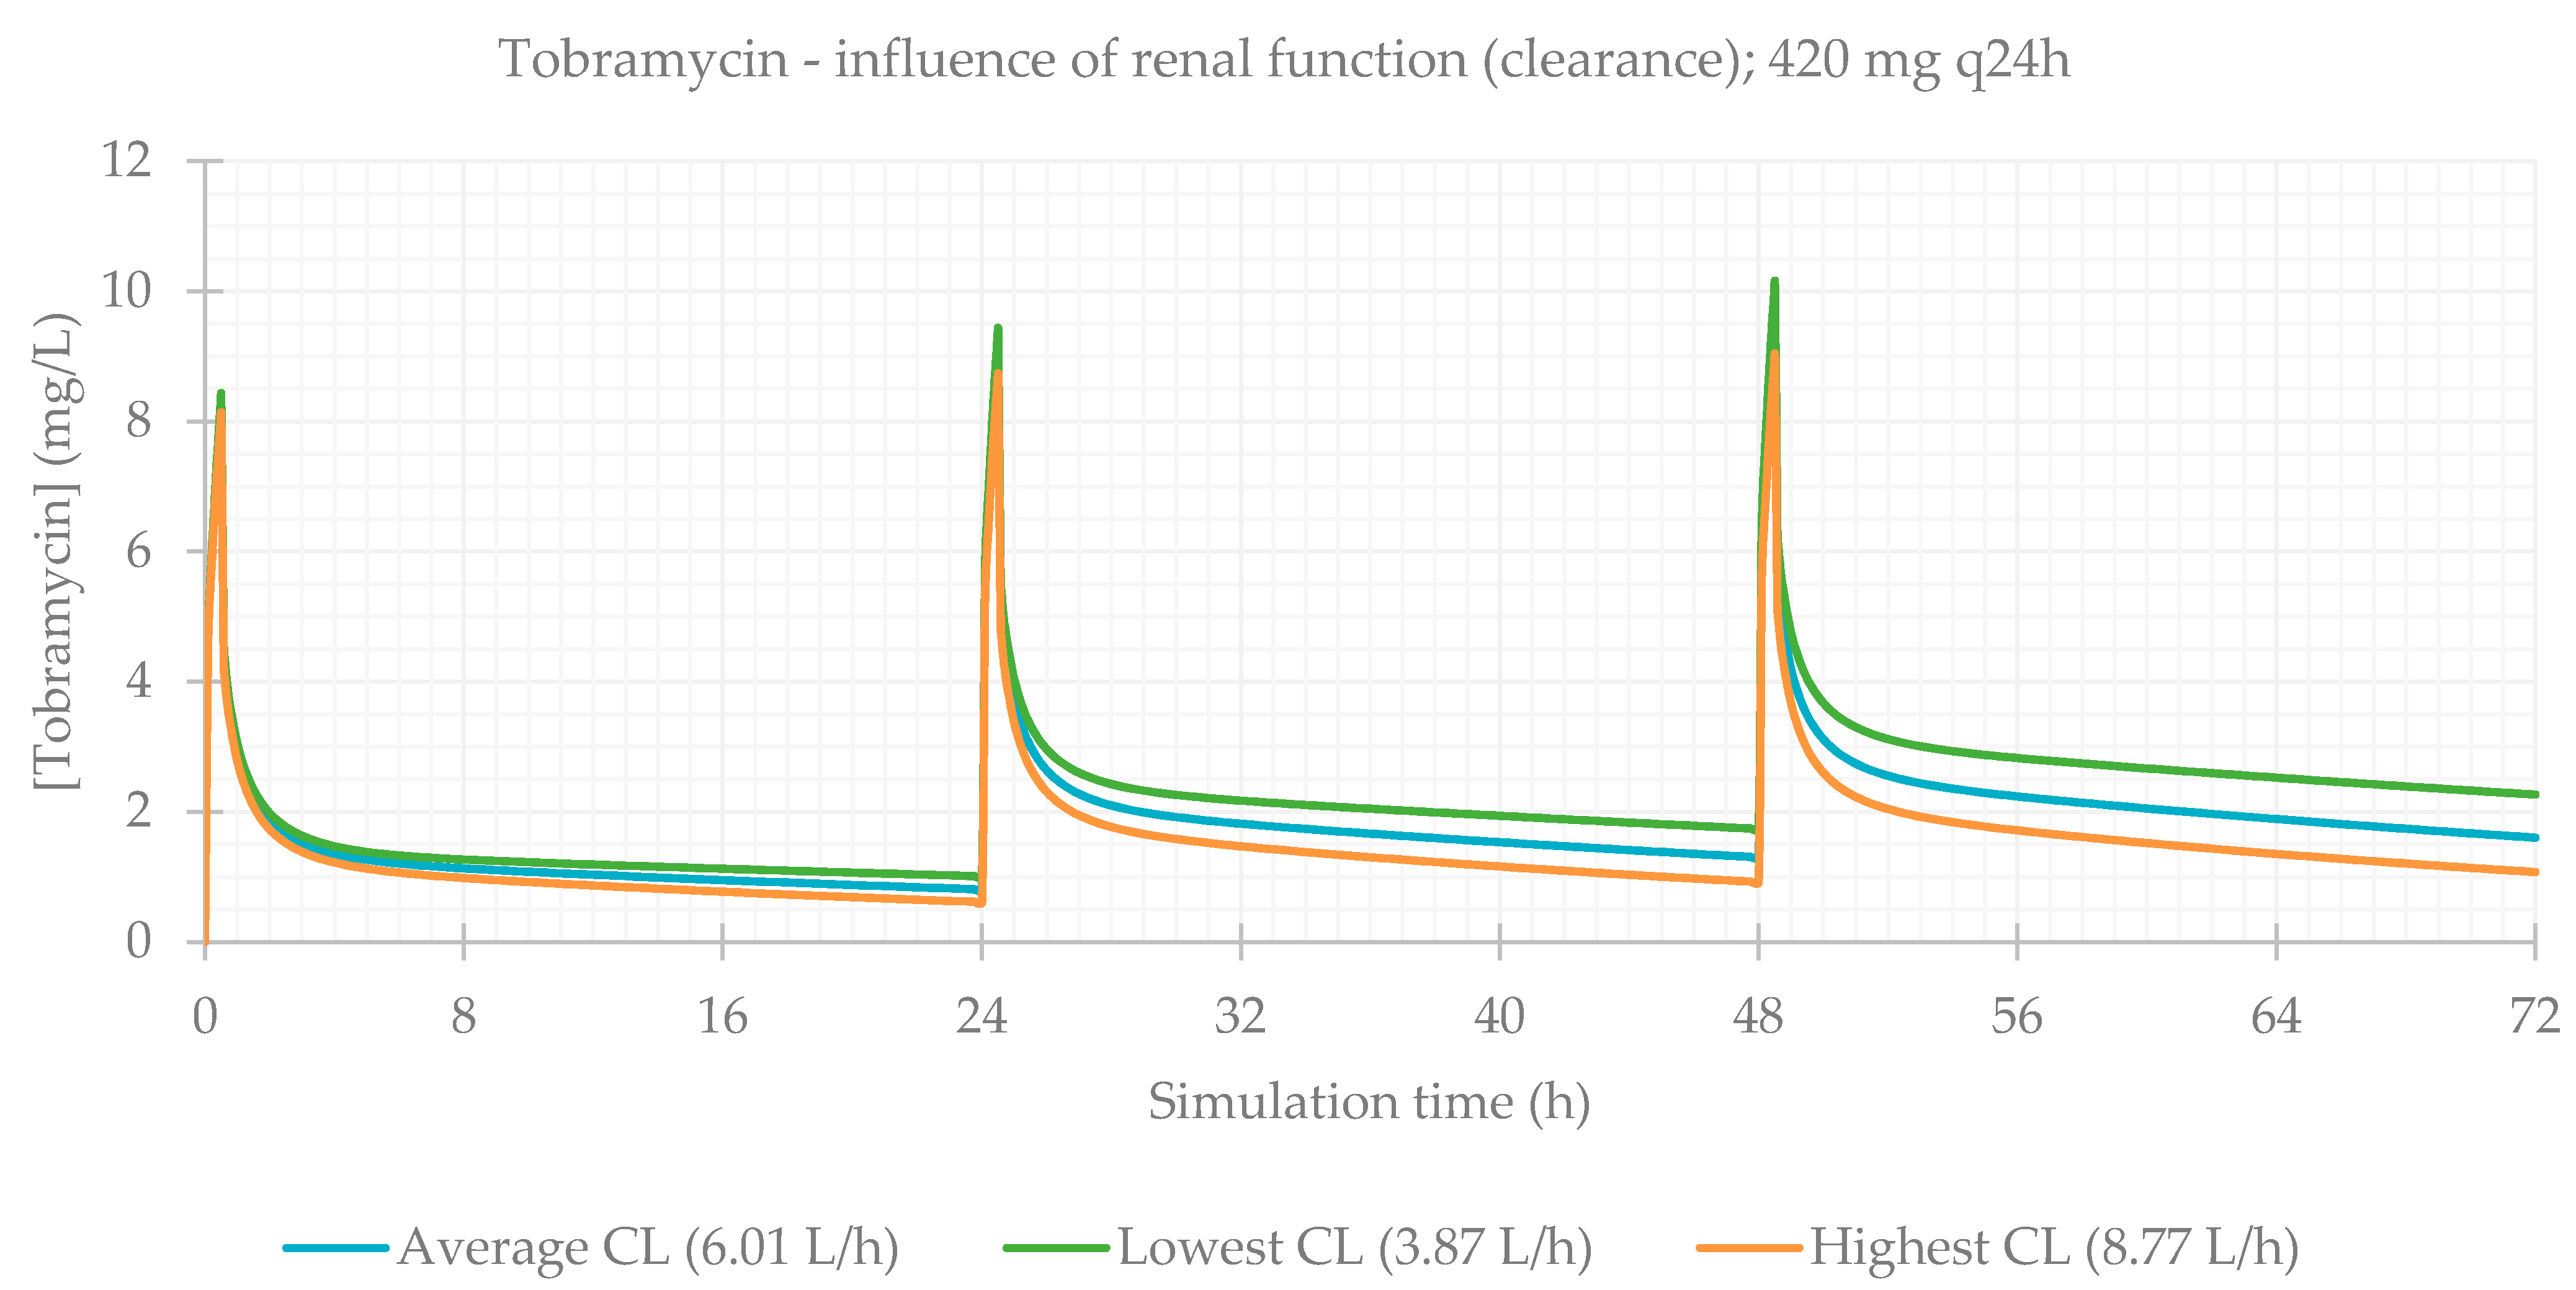
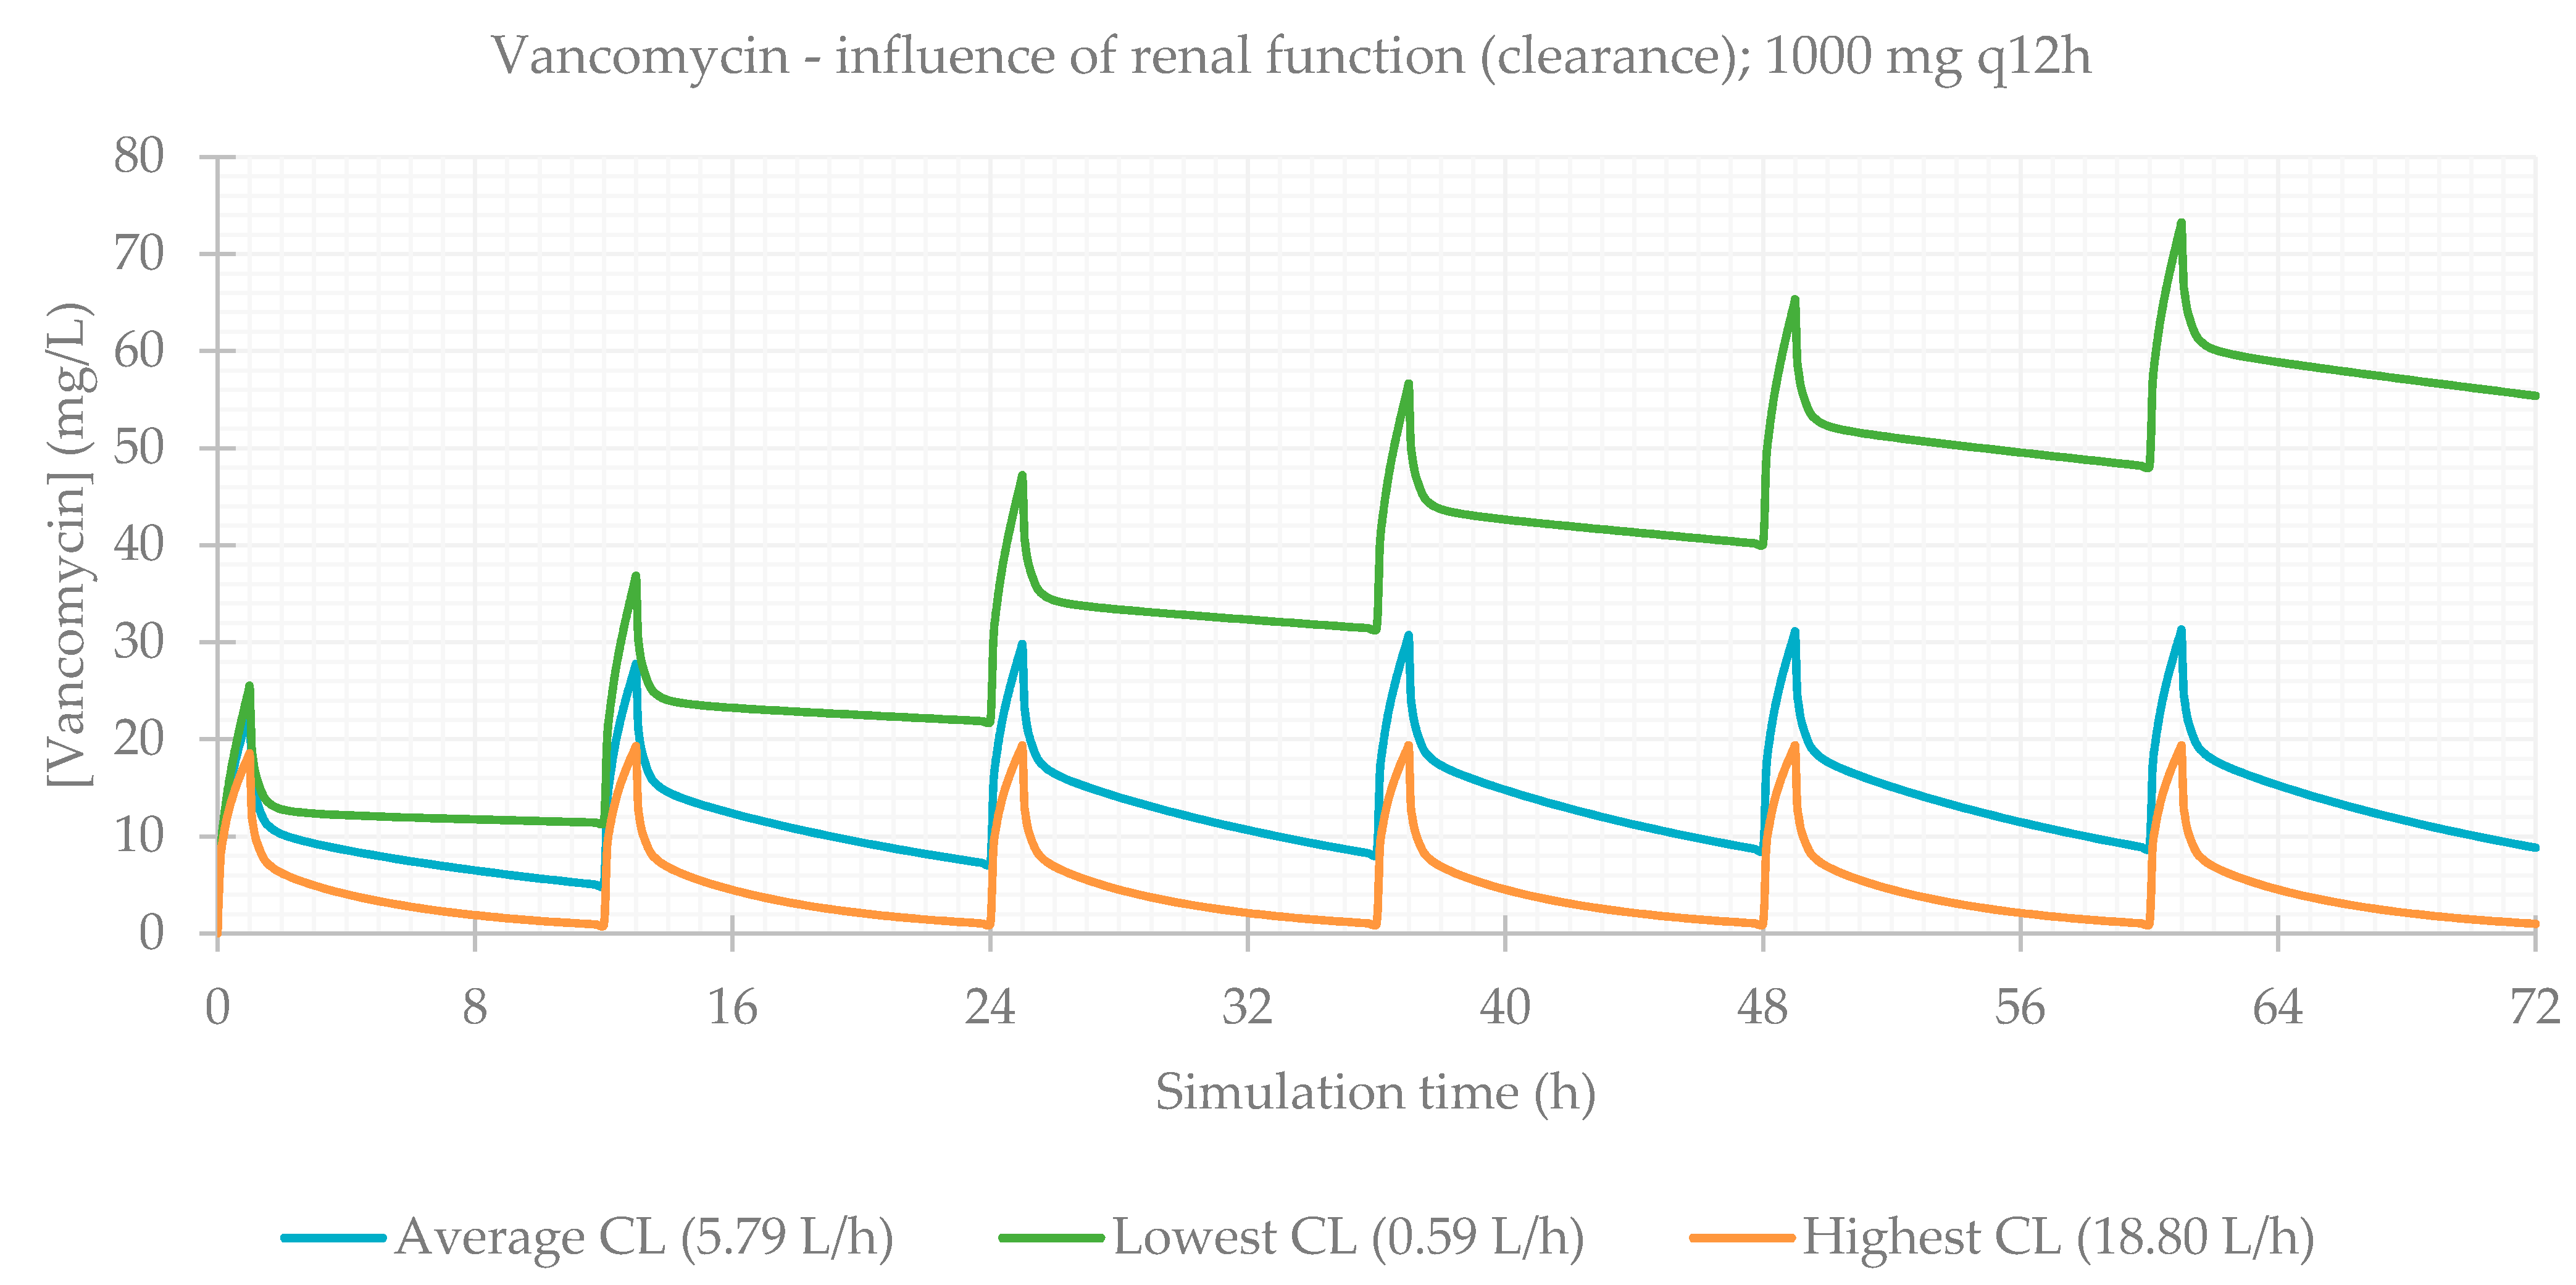
3.3. Influence of Renal Function

Finally, the influence of renal function was evaluated. This is a particularly relevant consideration, since during treatment (especially for long periods of time), kidneys can be affected as a side effect of medication, and renal function is often impaired. The PBPK simulations confirmed this, and CLCr was the most significantly impacting factor on antibiotics plasma concentrations. PK parameters are presented in Table 5 and plasma concentration–time profiles are illustrated for each antibiotic in Figure 9, Figure 10, Figure 11 and Figure 12.
When considering the lowest CLCr, antibiotic concentrations are much higher in comparison to individuals with normal functioning kidneys. This is exceptionally important in the case of vancomycin, where the differences between the lower and upper limits of observed CLCr were exceedingly significant.

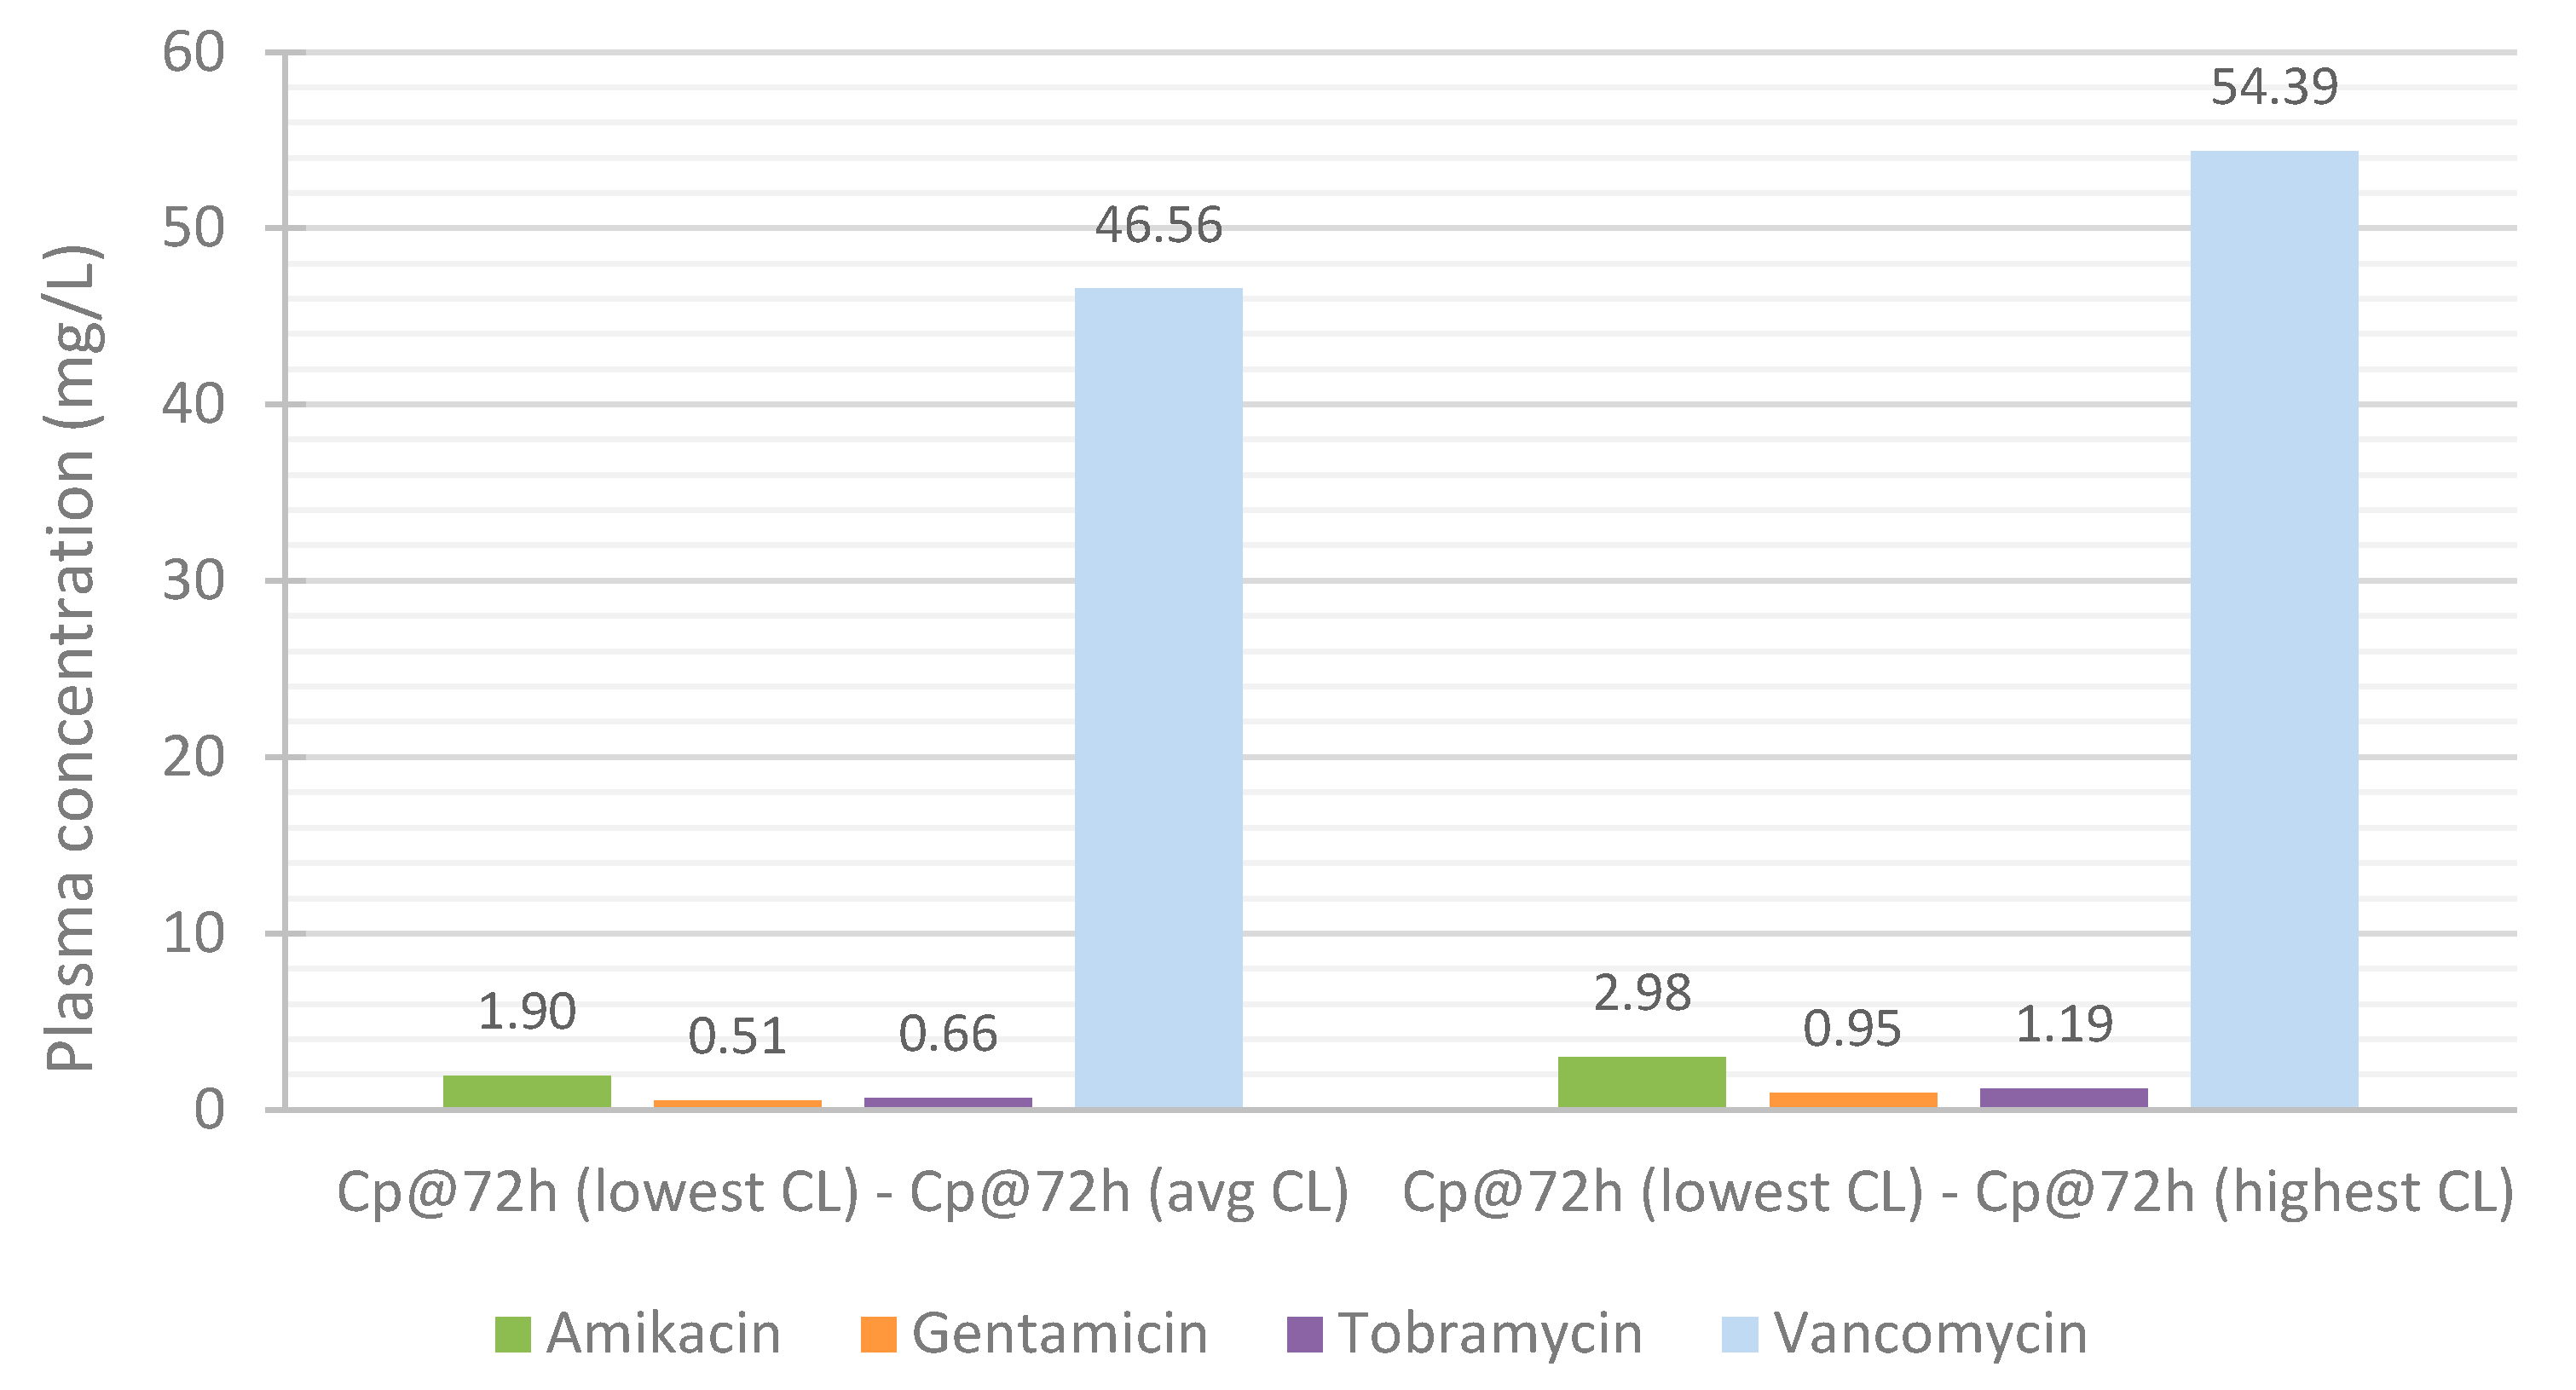
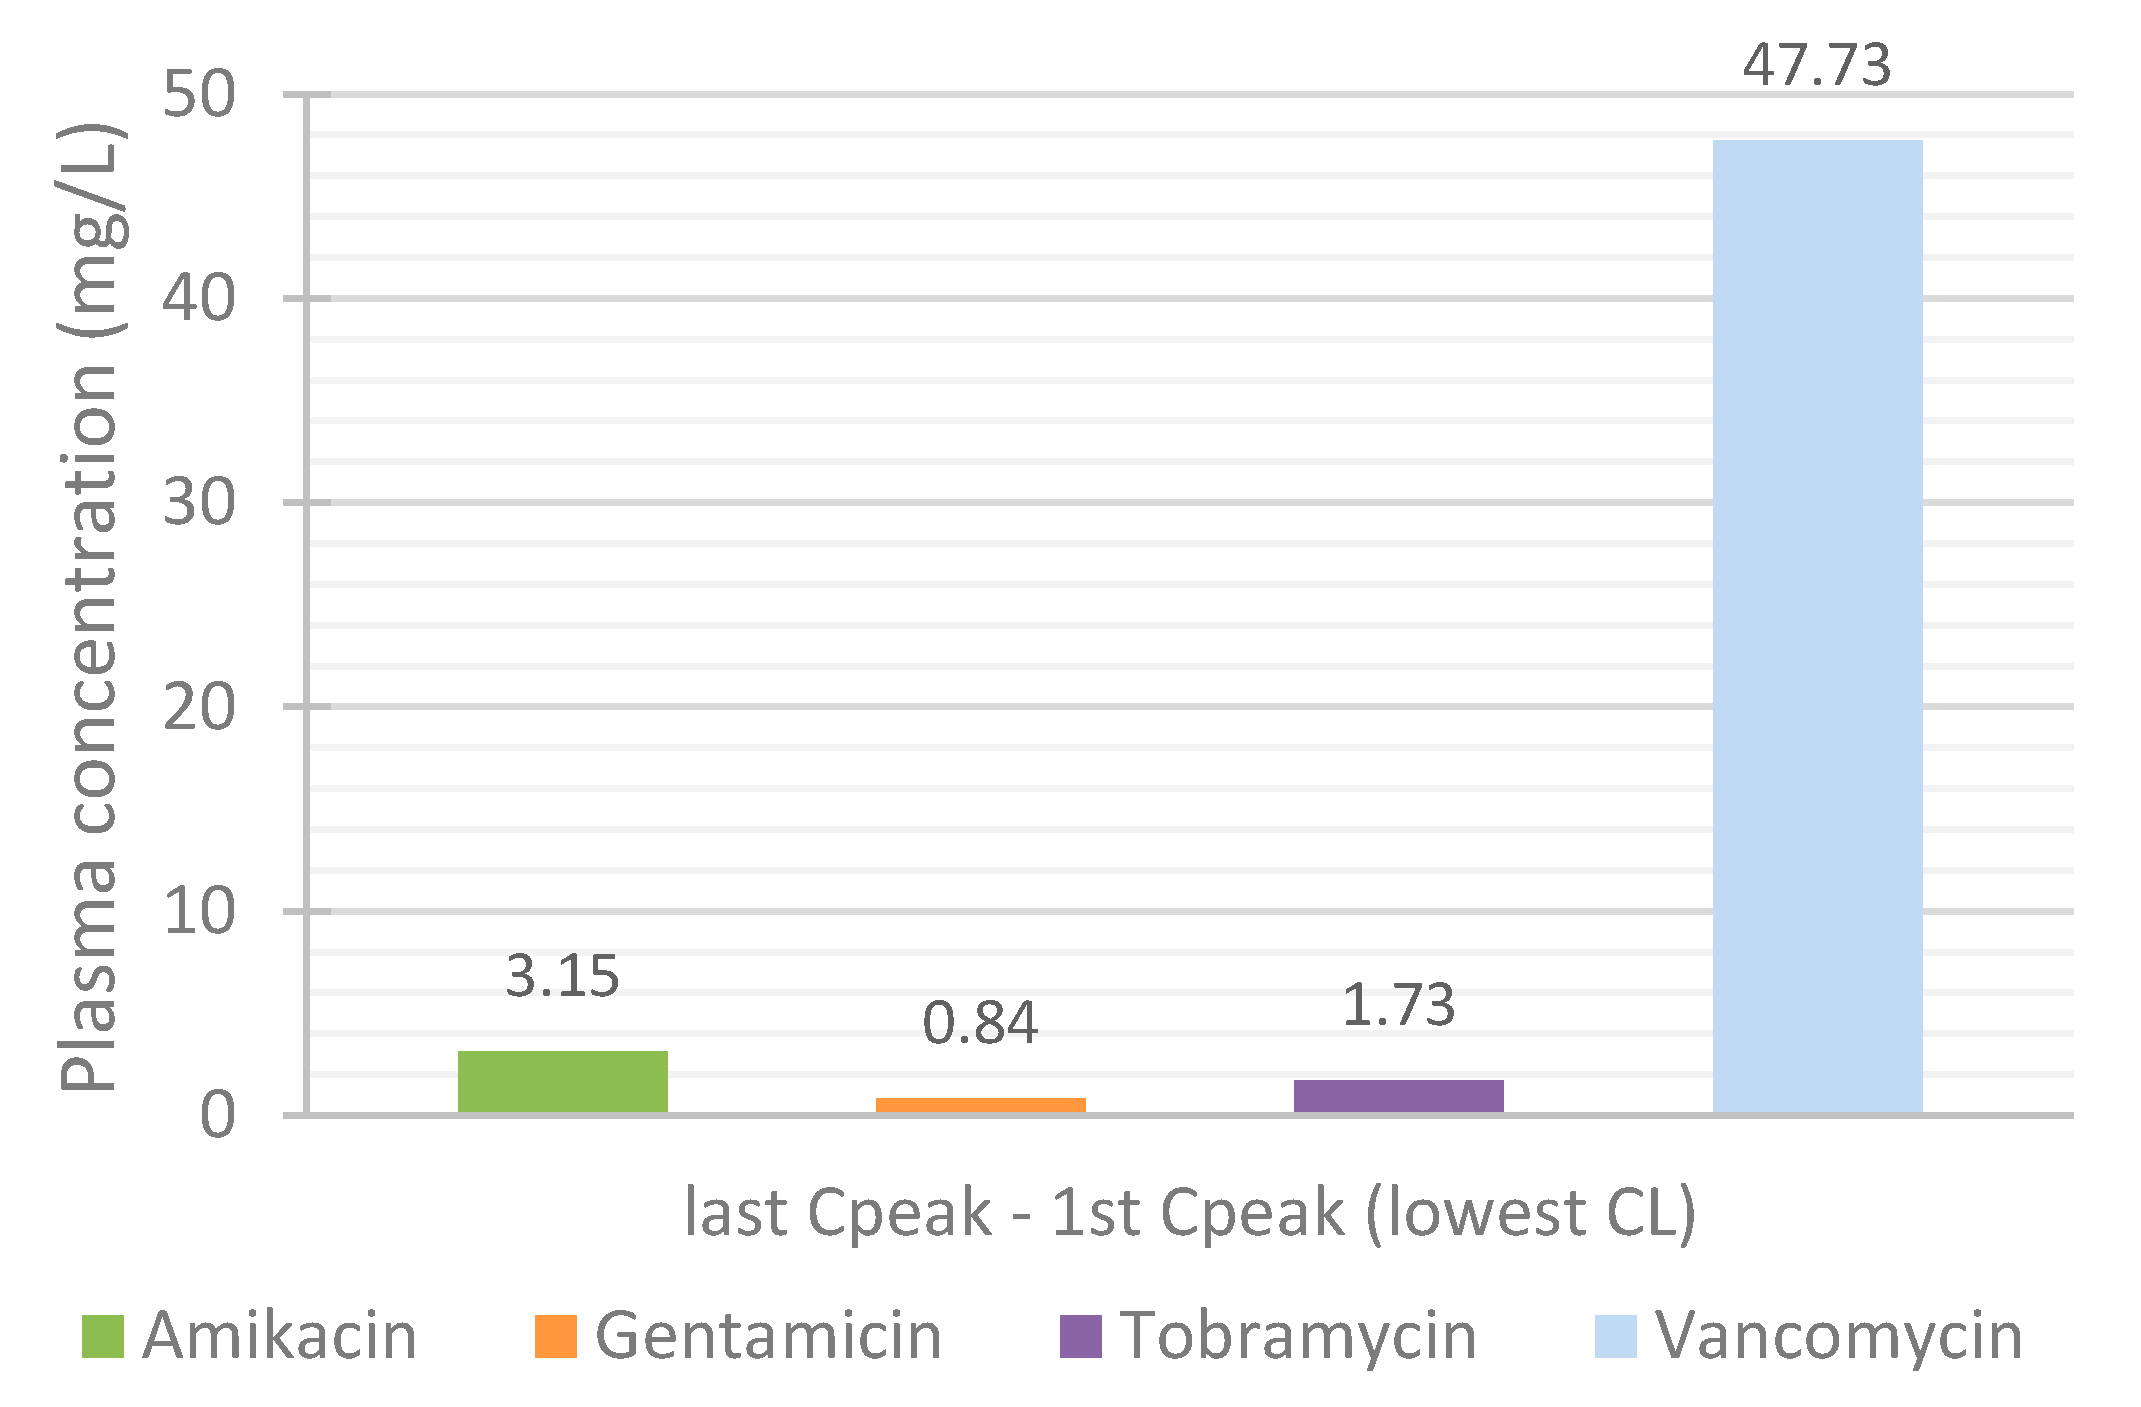
3.4. Effect of Renal Function on the Accumulation of Drugs in Plasma over Time

Since the influence of renal function on the PK profile of the antibiotics was so significant, the observed differences were further analyzed.
The differences in the predicted antibiotics concentrations at 72 h between the simulation for the lowest and average CL, and lowest and highest CL were calculated (Figure 13). For the simulations customized to represent the patients with the lowest CL, the differences between the Cpeak of the last and Cpeak of the first administrations were also determined (Figure 14). As aforementioned, renal function has a major impact on the plasma concentration profile of antibiotic vancomycin. As such, it is particularly important to closely observe patients receiving this antibiotic, monitoring their drug’s plasma concentration and changes in their renal function. Vancomycin can easily accumulate and rapidly reach toxic levels in plasma, which can lead to severe adverse effects and cause permanent damage to the kidneys.

4. Conclusions

In this work, clinical data from inpatients with severe systemic infections were analyzed and PBPK simulations were performed to study the pharmacokinetic profile of four clinically used antibiotics: amikacin, gentamicin, tobramycin, and vancomycin. The importance of therapeutic drug monitoring and regimen adjustment was further demonstrated, by highlighting the influence of parameters such as a patient’s total body weight and the significant impact of renal function on antibiotic plasma concentrations. It was made evident that patients with low body weight and especially those with impaired renal function, whether preexisting or due to kidney deterioration throughout treatment, must be closely monitored and their therapeutic regimens frequently revised to adjust to their plasma antibiotic concentrations and PK profile. We also found that renal function is the parameter that has the greatest impact on the Cp-time profile of these antibiotics, especially vancomycin, but that there are certainly other factors affecting PK and more optimizations to be made to these PBPK models, since the values obtained in the simulations may come even closer to those observed clinically. In particular, it is known that hospitalized and critically ill patients have altered PK and the fact that in this project it was not possible, due to software limitation, to insert the observed concentrations into the models, refining, optimizing, and then validating them, also contributed to the slight differences between the simulated and clinical results.
The results presented here deepen the knowledge on the impact and influence of these parameters on the biodistribution of these antibiotics. This is crucial not only to ensure a successful clinical outcome, but also to prevent serious side effects, and, as such, can assist clinicians in the process of adjusting therapeutic regimens. In this context, the helpfulness of in silico tools, such as PBPK modeling and software such as GastroPlus™, was also verified.

Supplementary Materials

The following are available online at https://www.mdpi.com/article/10.3390/life11111130/s1, Table S1: Demographic information and clinical data of the study population.

Author Contributions

Conceptualization, N.V.; methodology, A.F., H.M. and N.V.; software, A.F.; validation, N.V., A.F., H.M., J.C.O. and R.L.; investigation, A.F. and N.V.; resources, N.V. and R.L.; writing—original draft preparation, A.F.; writing—review and editing, H.M.; J.C.O., R.L. and N.V.; supervision, N.V.; project administration, N.V.; funding acquisition, R.L. and N.V. All authors have read and agreed to the published version of the manuscript.

Funding

This work was financed by FEDER—Fundo Europeu de Desenvolvimento Regional through the COMPETE 2020—Operational Programme for Competitiveness and Internationalization (POCI), Portugal 2020, and by Portuguese funds through FCT—Fundação para a Ciência e a Tecnologia, in a framework of CINTESIS, R&D Unit (reference UIDB/4255/2020). N.V. also thanks support FCT and FEDER (European Union), award number IF/00092/2014/CP1255/CT0004. RL thanks FCT through grant UID/QUI/50006/2019 (LAQV-REQUIMTE).

Institutional Review Board Statement

Not applicable.

Informed Consent Statement

Not applicable.

Data Availability Statement

Not applicable.

Acknowledgments

AF thanks FCT for a doctoral fellowship (PD/BD/135120/2017). The contents of this article are solely the responsibility of the authors and do not necessarily represent the official view of the FCT.

Conflicts of Interest

The authors declare no conflict of interest.

References

  1. Clarke, W.; Dasgupta, A. Clinical Challenges in Therapeutic Drug Monitoring: Special Populations, Physiological Conditions and Pharmacogenomics; Elsevier Science: Amsterdam, The Netherlands, 2016; ISBN 9780128020524. [Google Scholar]
  2. Kang, J.S.; Lee, M.H. Overview of therapeutic drug monitoring. Korean J. Intern. Med. 2009, 24, 1–10. [Google Scholar] [CrossRef]
  3. Buclin, T.; Thoma, Y.; Widmer, N.; André, P.; Guidi, M.; Csajka, C.; Decosterd, L.A. The Steps to Therapeutic Drug Monitoring: A Structured Approach Illustrated With Imatinib. Front. Pharmacol. 2020, 11, 177. [Google Scholar] [CrossRef]
  4. Widmer, N.; Bardin, C.; Chatelut, E.; Paci, A.; Beijnen, J.; Levêque, D.; Veal, G.; Astier, A. Review of therapeutic drug monitoring of anticancer drugs part two-Targeted therapies. Eur. J. Cancer 2014, 50, 2020–2036. [Google Scholar] [CrossRef]
  5. Muller, A.E.; Huttner, B.; Huttner, A. Therapeutic Drug Monitoring of Beta-Lactams and Other Antibiotics in the Intensive Care Unit: Which Agents, Which Patients and Which Infections? Drugs 2018, 78, 439–451. [Google Scholar] [CrossRef] [PubMed]
  6. Maitre, T.; Muret, P.; Blot, M.; Waldner, A.; Duong, M.; Si-Mohammed, A.; Chavanet, P.; Aho, S.; Piroth, L. Benefits and Limits of Antiretroviral Drug Monitoring in Routine Practice. Curr. HIV Res. 2019, 17, 190–197. [Google Scholar] [CrossRef]
  7. Papamichael, K.; Cheifetz, A.S. Therapeutic drug monitoring in patients on biologics: Lessons from gastroenterology. Curr. Opin. Rheumatol. 2020, 32, 371–379. [Google Scholar] [CrossRef] [PubMed]
  8. Schoretsanitis, G.; Paulzen, M.; Unterecker, S.; Schwarz, M.; Conca, A.; Zernig, G.; Gründer, G.; Haen, E.; Baumann, P.; Bergemann, N.; et al. TDM in psychiatry and neurology: A comprehensive summary of the consensus guidelines for therapeutic drug monitoring in neuropsychopharmacology, update 2017; a tool for clinicians. World J. Biol. Psychiatry 2018, 19, 162–174. [Google Scholar] [CrossRef] [PubMed]
  9. Leekha, S.; Terrell, C.L.; Edson, R.S. General Principles of Antimicrobial Therapy. Mayo Clin. Proc. 2011, 86, 156–167. [Google Scholar] [CrossRef] [PubMed] [Green Version]
  10. Abdul-Aziz, M.H.; Alffenaar, J.C.; Bassetti, M.; Bracht, H.; Dimopoulos, G.; Marriott, D.; Neely, M.N.; Paiva, J.A.; Pea, F.; Sjovall, F.; et al. Antimicrobial therapeutic drug monitoring in critically ill adult patients: A Position Paper. Intensive Care Med. 2020, 46, 1127–1153. [Google Scholar] [CrossRef]
  11. Mabilat, C.; Gros, M.F.; Nicolau, D.; Mouton, J.W.; Textoris, J.; Roberts, J.A.; Cotta, M.O.; van Belkum, A.; Caniaux, I. Diagnostic and medical needs for therapeutic drug monitoring of antibiotics. Eur. J. Clin. Microbiol. Infect. Dis. 2020, 39, 791–797. [Google Scholar] [CrossRef] [PubMed] [Green Version]
  12. Wicha, S.G.; Märtson, A.G.; Nielsen, E.I.; Koch, B.C.P.; Friberg, L.E.; Alffenaar, J.W.; Minichmayr, I.K. From Therapeutic Drug Monitoring to Model-Informed Precision Dosing for Antibiotics. Clin. Pharmacol. Ther. 2021, 109, 928–941. [Google Scholar] [CrossRef] [PubMed]
  13. Choi, R.; Woo, H.I.; Park, H.D.; Lee, S.Y. A nationwide utilization survey of therapeutic drug monitoring for five antibiotics in South Korea. Infect. Drug Resist. 2019, 12, 2163–2173. [Google Scholar] [CrossRef]
  14. Begg, E.J.; Barclay, M.L.; Kirkpatrick, C.M. The therapeutic monitoring of antimicrobial agents. Br. J. Clin. Pharmacol. 2001, 52 (Suppl. 1), S35–S43. [Google Scholar] [CrossRef]
  15. Reeves, D.; Lovering, A.; Thomson, A. Therapeutic drug monitoring in the past 40 years of the Journal of Antimicrobial Chemotherapy. J. Antimicrob. Chemother. 2016, 71, 3330–3332. [Google Scholar] [CrossRef] [Green Version]
  16. Cunha, B.A. Antibiotic side effects. Med. Clin. N. Am. 2001, 85, 149–185. [Google Scholar] [CrossRef]
  17. Yılmaz, Ç.; Özcengiz, G. Antibiotics: Pharmacokinetics, toxicity, resistance and multidrug efflux pumps. Biochem. Pharmacol. 2017, 133, 43–62. [Google Scholar] [CrossRef]
  18. Möhlmann, J.E.; van Luin, M.; Mascini, E.M.; van Leeuwen, H.J.; de Maat, M.R. Monitoring of tobramycin serum concentrations in selected critically ill patients receiving selective decontamination of the digestive tract: A retrospective evaluation. Eur. J. Clin. Pharmacol. 2019, 75, 831–836. [Google Scholar] [CrossRef]
  19. Coulthard, K.P.; Peckham, D.G.; Conway, S.P.; Smith, C.A.; Bell, J.; Turnidge, J. Therapeutic drug monitoring of once daily tobramycin in cystic fibrosis--caution with trough concentrations. J. Cyst. Fibros. 2007, 6, 125–130. [Google Scholar] [CrossRef]
  20. Ye, Z.K.; Tang, H.L.; Zhai, S.D. Benefits of therapeutic drug monitoring of vancomycin: A systematic review and meta-analysis. PLoS ONE 2013, 8, e77169. [Google Scholar] [CrossRef] [PubMed]
  21. Rybak, M.J. The pharmacokinetic and pharmacodynamic properties of vancomycin. Clin. Infect. Dis. Off. Publ. Infect. Dis. Soc. Am. 2006, 42 (Suppl. 1), S35–S39. [Google Scholar] [CrossRef] [PubMed]
  22. Rybak, M.; Lomaestro, B.; Rotschafer, J.C.; Moellering, R., Jr.; Craig, W.; Billeter, M.; Dalovisio, J.R.; Levine, D.P. Therapeutic monitoring of vancomycin in adult patients: A consensus review of the American Society of Health-System Pharmacists, the Infectious Diseases Society of America, and the Society of Infectious Diseases Pharmacists. Am. J. Health Pharm. 2009, 66, 82–98. [Google Scholar] [CrossRef] [PubMed]
  23. Jenkins, A.; Thomson, A.H.; Brown, N.M.; Semple, Y.; Sluman, C.; MacGowan, A.; Lovering, A.M.; Wiffen, P.J. Amikacin use and therapeutic drug monitoring in adults: Do dose regimens and drug exposures affect either outcome or adverse events? A systematic review. J. Antimicrob. Chemother. 2016, 71, 2754–2759. [Google Scholar] [CrossRef] [Green Version]
  24. Kovačević, T.; Avram, S.; Milaković, D.; Špirić, N.; Kovačević, P. Therapeutic monitoring of amikacin and gentamicin in critically and noncritically ill patients. J. Basic Clin. Pharm. 2016, 7, 65–69. [Google Scholar] [CrossRef] [Green Version]
  25. de Velde, F.; Mouton, J.W.; de Winter, B.C.M.; van Gelder, T.; Koch, B.C.P. Clinical applications of population pharmacokinetic models of antibiotics: Challenges and perspectives. Pharmacol. Res. 2018, 134, 280–288. [Google Scholar] [CrossRef]
  26. Hodiamont, C.J.; Janssen, J.M.; de Jong, M.D.; Mathôt, R.A.; Juffermans, N.P.; van Hest, R.M. Therapeutic Drug Monitoring of Gentamicin Peak Concentrations in Critically Ill Patients. Ther. Drug Monit. 2017, 39, 522–530. [Google Scholar] [CrossRef]
  27. Drennan, P.G.; Thoma, Y.; Barry, L.; Matthey, J.; Sivam, S.; van Hal, S.J. Bayesian Forecasting for Intravenous Tobramycin Dosing in Adults With Cystic Fibrosis Using One Versus Two Serum Concentrations in a Dosing Interval. Ther. Drug Monit. 2021, 43, 505–511. [Google Scholar] [CrossRef]
  28. Gottlieb, T.; Nimmo, G.R. Antibiotic resistance is an emerging threat to public health: An urgent call to action at the Antimicrobial Resistance Summit 2011. Med. J. Aust. 2011, 194, 281–283. [Google Scholar] [CrossRef]
  29. Dellit, T.H.; Owens, R.C.; McGowan, J.E.; Gerding, D.N.; Weinstein, R.A.; Burke, J.P.; Huskins, W.C.; Paterson, D.L.; Fishman, N.O.; Carpenter, C.F.; et al. Infectious Diseases Society of America and the Society for Healthcare Epidemiology of America Guidelines for Developing an Institutional Program to Enhance Antimicrobial Stewardship. Clin. Infect. Dis. 2007, 44, 159–177. [Google Scholar] [CrossRef] [PubMed]
  30. Lee, C.R.; Cho, I.H.; Jeong, B.C.; Lee, S.H. Strategies to minimize antibiotic resistance. Int. J. Environ. Res. Public Health 2013, 10, 4274–4305. [Google Scholar] [CrossRef] [PubMed] [Green Version]
  31. MacDougall, C.; Polk, R.E. Antimicrobial stewardship programs in health care systems. Clin. Microbiol. Rev. 2005, 18, 638–656. [Google Scholar] [CrossRef] [Green Version]
  32. Michaels, K.; Mahdavi, M.; Krug, A.; Kuper, K. Implementation of an antimicrobial stewardship program in a community hospital: Results of a three-year analysis. Hosp. Pharm. 2012, 47, 608–616. [Google Scholar] [CrossRef]
  33. Pollack, L.A.; Srinivasan, A. Core elements of hospital antibiotic stewardship programs from the Centers for Disease Control and Prevention. Clin. Infect. Dis. 2014, 59 (Suppl. 3), S97–S100. [Google Scholar] [CrossRef] [PubMed] [Green Version]
  34. Ferreira, A.; Martins, H.; Oliveira, J.C.; Lapa, R.; Vale, N. In silico pharmacokinetic study of vancomycin using PBPK modeling and therapeutic drug monitoring. Curr. Drug Metab. 2021, 22, 150–162. [Google Scholar] [CrossRef]
  35. Ferreira, A.; Lapa, R.; Vale, N. Combination of Gemcitabine with Cell-Penetrating Peptides: A Pharmacokinetic Approach Using In Silico Tools. Biomolecules 2019, 9, 693. [Google Scholar] [CrossRef] [PubMed] [Green Version]
  36. Santos, J.; Lobato, L.; Vale, N. Clinical pharmacokinetic study of latrepirdine via in silico sublingual administration. In Silico Pharmacol. 2021, 9, 29. [Google Scholar] [CrossRef] [PubMed]
  37. Cockcroft, D.W.; Gault, M.H. Prediction of creatinine clearance from serum creatinine. Nephron 1976, 16, 31–41. [Google Scholar] [CrossRef]
  38. Amikacin. Available online: https://go.drugbank.com/drugs/DB00479 (accessed on 1 February 2021).
  39. Gentamicin. Available online: https://go.drugbank.com/drugs/DB00798 (accessed on 1 February 2021).
  40. Gonçalves-Pereira, J.; Martins, A.; Póvoa, P. Pharmacokinetics of gentamicin in critically ill patients: Pilot study evaluating the first dose. Clin. Microbiol. Infect. 2010, 16, 1258–1263. [Google Scholar] [CrossRef] [Green Version]
  41. Tobramycin. Available online: https://go.drugbank.com/drugs/DB00684 (accessed on 1 February 2021).
  42. Aminimanizani, A.; Beringer, P.M.; Kang, J.; Tsang, L.; Jelliffe, R.W.; Shapiro, B.J. Distribution and elimination of tobramycin administered in single or multiple daily doses in adult patients with cystic fibrosis. J. Antimicrob. Chemother. 2002, 50, 553–559. [Google Scholar] [CrossRef] [PubMed] [Green Version]
  43. Tobramycin for Injection. Available online: https://reference.medscape.com/drug/nebcin-injection-tobramycin-342521#10 (accessed on 1 February 2021).
  44. Vancomycin. Available online: https://go.drugbank.com/drugs/DB00512 (accessed on 1 February 2021).
  45. Miller, N.A.; Reddy, M.B.; Heikkinen, A.T.; Lukacova, V.; Parrott, N. Physiologically Based Pharmacokinetic Modelling for First-In-Human Predictions: An Updated Model Building Strategy Illustrated with Challenging Industry Case Studies. Clin. Pharmacokinet. 2019, 58, 727–746. [Google Scholar] [CrossRef] [PubMed] [Green Version]
  46. Wagner, C.; Zhao, P.; Pan, Y.; Hsu, V.; Grillo, J.; Huang, S.M.; Sinha, V. Application of Physiologically Based Pharmacokinetic (PBPK) Modeling to Support Dose Selection: Report of an FDA Public Workshop on PBPK. CPT Pharmacomet. Syst. Pharmacol. 2015, 4, 226–230. [Google Scholar] [CrossRef]
  47. Kovar, L.; Schräpel, C.; Selzer, D.; Kohl, Y.; Bals, R.; Schwab, M.; Lehr, T. Physiologically-Based Pharmacokinetic (PBPK) Modeling of Buprenorphine in Adults, Children and Preterm Neonates. Pharmaceutics 2020, 12, 578. [Google Scholar] [CrossRef] [PubMed]
  48. Fuhr, L.M.; Marok, F.Z.; Hanke, N.; Selzer, D.; Lehr, T. Pharmacokinetics of the CYP3A4 and CYP2B6 Inducer Carbamazepine and Its Drug–Drug Interaction Potential: A Physiologically Based Pharmacokinetic Modeling Approach. Pharmaceutics 2021, 13, 270. [Google Scholar] [CrossRef]
  49. Zapke, S.E.; Willmann, S.; Grebe, S.-O.; Menke, K.; Thürmann, P.A.; Schmiedl, S. Comparing Predictions of a PBPK Model for Cyclosporine With Drug Levels From Therapeutic Drug Monitoring. Front. Pharmacol. 2021, 12, 1134. [Google Scholar] [CrossRef] [PubMed]
  50. Li, J.; Jiang, J.; Wu, J.; Bao, X.; Sanai, N. Physiologically based pharmacokinetic modeling of central nervous system pharmacokinetics of CDK4/6 inhibitors to guide selection of drug and dosing regimen for brain cancer treatment. Clin. Pharmacol. Ther. 2021, 109, 494–506. [Google Scholar] [CrossRef] [PubMed]
  51. Wang, K.; Yao, X.; Zhang, M.; Liu, D.; Gao, Y.; Sahasranaman, S.; Ou, Y.C. Comprehensive PBPK model to predict drug interaction potential of Zanubrutinib as a victim or perpetrator. CPT Pharmacomet. Syst. Pharmacol. 2021, 10, 441–454. [Google Scholar] [CrossRef] [PubMed]
Figure 1. Amikacin plasma concentration–time profile showing the influence of therapeutic regimens and biological sex (considering the average of the study population: 57 years old, 66.0 kg, 169 cm, CL = 6.07 L/h).
Life 11 01130 g001
Figure 2. Gentamicin plasma concentration–time profile showing the influence of therapeutic regimens and biological sex (considering the average of the study population: 58 years old, 66.0 kg, 165 cm, CL = 5.94 L/h).
Life 11 01130 g002
Figure 3. Tobramycin plasma concentration–time profile showing the influence of therapeutic regimens and biological sex (considering the average of the study population: 15 years old, 33.0 kg, 146 cm, CL = 6.01 L/h).
Life 11 01130 g003
Figure 4. Vancomycin plasma concentration–time profile showing the influence of therapeutic regimens and biological sex (considering the average of the study population: 63 years old, 69.0 kg, 163 cm, CL = 5.79 L/h).
Life 11 01130 g004
Figure 5. Amikacin plasma concentration–time profile showing the influence of body weight (for an 800 mg q24h dose, considering a male individual with the average characteristics of the study population: 57 years old, 169 cm, CL = 6.07 L/h).
Life 11 01130 g005
Figure 6. Gentamicin plasma concentration–time profile showing the influence of body weight (for a 200 mg q24h dose, considering a male individual with the average characteristics of the study population: 58 years old, 165 cm, CL = 5.94 L/h).
Life 11 01130 g006
Figure 7. Tobramycin plasma concentration–time profile showing the influence of body weight (for a 420 mg q24h dose, considering a male individual with the average characteristics of the study population: 15 years old, 146 cm, CL = 6.01 L/h).
Life 11 01130 g007
Figure 8. Vancomycin plasma concentration–time profile showing the influence of body weight (for a 1000 mg q12h dose, considering a male individual with the average characteristics of the study population: 63 years old, 163 cm, CL = 5.79 L/h).
Life 11 01130 g008
Figure 9. Amikacin plasma concentration–time profile showing the influence of renal function (for an 800 mg q24h dose, considering a male individual with the average characteristics of the study population: 57 years old, 66.0 kg, 169 cm).
Life 11 01130 g009
Figure 10. Gentamicin plasma concentration–time profile showing the influence of renal function (for a 200 mg q24h dose, considering a male individual with the average characteristics of the study population: 58 years old, 66.0 kg, 165 cm).
Life 11 01130 g010
Figure 11. Tobramycin plasma concentration–time profile showing the influence of renal function (for a 420 mg q24h dose, considering a male individual with the average characteristics of the study population: 15 years old, 33.0 kg, 146 cm).
Life 11 01130 g011
Figure 12. Vancomycin plasma concentration–time profile showing the influence of renal function (for a 1000 mg q12h dose, considering a male individual with the average characteristics of the study population: 63 years old, 69.0 kg, 163 cm).
Life 11 01130 g012
Figure 13. Influence of renal function on the accumulation of the antibiotics in plasma throughout treatment: difference in the plasma concentration at 72 h.
Life 11 01130 g013
Figure 14. Influence of renal function on the accumulation of the antibiotics in plasma throughout treatment: difference between the Cpeak of the last and Cpeak of the first simulated administration.
Life 11 01130 g014
Table 1. Summary of collected clinical data, with the indication of the average value, lower and upper limits for each parameter. Normal range values (CHUP reference) are also presented.
AmikacinGentamicinTobramycinVancomycin
nt (nsex)8 (F: 1; M: 7)22 (F: 8; M: 14)5 (F: 4; M: 1)47 (F: 21; M: 26)
Age (years)14–87 (avg 57)7–88 (avg 58)13–19 (avg 15)19–93 (avg 63)
Weight (kg)50.0–92.5 (avg 66.0)15.5–85.0 (avg 66.0)25.8–44.5 (avg 33.0)29.0–140. (avg 69.0)
Height (cm)163–180 (avg 169)108–185 (avg 165)130–158 (avg 146)147–185 (avg 163)
Cmin (mg/L)0.30–16.40 (avg 3.70)
(ref 1–8)
0.20–4.80 (avg 1.05)
(ref 0.5–2)
0.06–0.23 (avg 0.17)
(ref 0.5–2; <1 CF)
4.50–45.60 (avg 16.34)
(ref 15–20)
Cmax (mg/L)19.70–87.80 (avg 38.97)
(ref 20–30)
2.90–19.50 (avg 9.22)
(ref 5–10)
16.32–36.12 (avg 27.05)
(ref 5–10; 20–30 CF)
11.20–60.10 (avg 25.99)
(ref < 40)
[Cr] (mg/dL)0.47–1.58 (avg 0.93)0.29–1.89 (avg 0.83)0.35–0.64 (avg 0.49)0.27–4.78 (avg 1.00)
CL (L/h) *1.40–11.30
(avg 6.07)
1.67–15.89
(avg 5.94)
3.87–8.77
(avg 6.01)
0.59–18.80
(avg 5.79)
* Estimation using the Cockcroft–Gault equation. Ref: normal range (CHUP). CF: Cystic fibrosis.
Table 2. Physicochemical properties of antibiotics and input parameters in GastroPlus™.
AmikacinGentamicinTobramycinVancomycin
Molecular weight585.61477.61467.521449.28
logP−5 1−1.79 1; −3.1 2−4.8 1; −5.8 22.48 1; −3.1 2
pKa8.1 212.55; 10.18 212.54; 9.83 22.99; 9.93 2
Solubility166.49 g/L, pH = 11.73 1;
50 g/L 2
56.54 g/L, pH = 11.51 1;
12.6 g/L 2
59.47 g/L, pH = 11.34 1; freely soluble 20.26 g/L, pH = 8.17 1;
0.225 g/L 2
Diffusion Coefficient0.53 cm2/s × 105 10.56 cm2/s × 105 10.6 cm2/s × 105 10.32 cm2/s × 105 1
Drug particle density1.2 g/mL1.2 g/mL1.2 g/mL1.2 g/mL
Mean particle radius25252525
Peff0.0202 cm/s × 10−4 10.0891 cm/s × 10−4 10.0368 cm/s × 10−4 10.0747 cm/s × 10−4 1
Fup98.75% 1; >90% 285.4% 1; >70% 2100% 1; >70% 221.36% 1; ~50% 2
Blood/plasma ratio1.23 11.11 11.31 10.68 1
T1/22–3 h2–3 h2–3 h~6 h (4–11 h)
Vc0.24 1; ~0.34 L/kg 20.38 1; 0.2–0.3 L/kg0.3 1; 0.2–0.3 L/kg0.4–1 L/kg
Clearance6.00 L/h3.42 L/h8.48 L/h4.03 L/h
Typical dosing for susceptible infections7.5 mg/kg q12h
15 mg/kg q24h
1 mg/kg q8h1 mg/kg q8h1000 mg q12h
Common dosing in CHUPVariable:
400–800 mg
q24h or q48h
120 mg q8h
200 mg q24h
70 mg q12h
70 mg q8h
420 mg q24h
1 g q12h
1 g q24h
1 predicted by GastroPlus™; 2 from DrugBank and references [38,39,40,41,42,43,44].
Table 3. Influence of therapeutic regimens and biological sex on the pharmacokinetic parameters of the four studied antibiotics.
Drug & PosologyFa (%) 1FDp (%) 2F (%) 3Cmax (mg/L) 4Tmax (h) 5AUC0-inf (µg∙h/mL) 6AUC0-t (µg∙h/mL) 7Cmax liver (mg/L) 8
Amikacin
400 mg q24h99.98099.96499.9645.98148.5197.57094.83664.761
800 mg q24h99.98099.96499.96411.96248.5395.150189.670129.520
800 mg q24h female99.97899.96099.96011.79048.5395.060209.520128.610
Gentamicin
70 mg q12h99.85999.83499.8341.44660.568.97132.73114.831
120 mg q8h99.86499.83899.8382.98164.5163.85081.28731.975
200 mg q24h99.84599.82299.8223.30448.5100.65051.34531.876
200 mg q24h female99.82999.80699.8063.24648.5100.63056.32131.524
Tobramycin
250 mg q24h99.97199.97199.9715.70248.5124.78078.23062.346
500 mg q24h99.97199.97199.97111.40348.5249.570156.460124.690
420 mg q24h99.97199.97199.9719.57948.5209.640131.430104.740
420 mg q24h female99.96999.96999.9699.46048.5209.640139.840104.770
Vancomycin
500 mg q12h99.92999.92199.92115.63261.0517.990452.87030.871
1000 mg q24h99.92699.92199.92125.54749.0518.000477.99050.086
1000 mg q12h99.92999.92199.92131.26361.01036.000905.74061.742
1000 mg q12h female99.93099.92199.92129.20261.01036.000901.46057.773
1 fraction absorbed as a percent of the dose (crossing the lumen and entering enterocytes); 2 percent of the dose that has reached the portal vein; 3 bioavailability; 4 maximum plasma concentration reached in the central compartment, in mg/L; 5 time to reach maximum plasma concentration, in hours; 6 area under the plasma concentration–time curve, in µg∙h/mL, extrapolated to infinity; 7 area under the plasma concentration–time curve, in µg∙h/mL, for the time of the simulation; 8 maximum concentration reached in the liver, in mg/L.
Table 4. Influence of total body weight on the pharmacokinetic parameters of the four studied antibiotics.
Drug & PosologyFa (%) 1FDp (%) 2F (%) 3Cmax (mg/L) 4Tmax (h) 5AUC0-inf (µg∙h/mL) 6AUC0-t (µg∙h/mL) 7Cmax liver (mg/L) 8
Amikacin
800 mg q24h BW avg (66.0 kg)99.98099.96499.96411.96248.5395.150189.670129.520
800 mg q24h BW min (50.0 kg)99.98199.96599.96514.81348.5395.250223.520161.780
800 mg q24h BW max (92.5 kg)99.98299.96699.9669.16148.5394.940151.39097.834
Gentamicin
200 mg q24h BW avg (66.0 kg)99.84599.82299.8223.30448.5100.65051.34531.876
200 mg q24h BW min (15.5 kg)99.91099.90599.9059.55548.5100.89090.41897.446
200 mg q24h BW max (85.0 kg)99.68099.65699.6569.54648.5100.63090.20097.126
Tobramycin
420 mg q24h BW avg (33.0 kg)99.97199.97199.9719.57948.5209.640131.430104.740
420 mg q24h BW min (25.8 kg)99.97399.97399.97311.47948.5209.660147.220127.010
420 mg q24h BW max (44.5 kg)99.97099.97099.9707.64648.5209.600111.74082.333
Vancomycin
1000 mg q12h BW avg (69.0 kg)99.92999.92199.92131.26361.01036.000905.74061.742
1000 mg q12h BW min (29.0 kg)99.95699.95499.95448.45961.01036.3001005.00095.749
1000 mg q12h BW max (140.0 kg)99.93699.92699.92622.53561.01035.800736.33044.587
1 fraction absorbed as a percent of the dose (crossing the lumen and entering enterocytes); 2 percent of the dose that has reached the portal vein; 3 bioavailability; 4 maximum plasma concentration reached in the central compartment, in mg/L; 5 time to reach maximum plasma concentration, in hours; 6 area under the plasma concentration–time curve, in µg∙h/mL, extrapolated to infinity; 7 area under the plasma concentration–time curve, in µg∙h/mL, for the time of the simulation; 8 maximum concentration reached in the liver, in mg/L.
Table 5. Influence of renal function (creatinine clearance) on the pharmacokinetic parameters of the four studied antibiotics.
Drug & PosologyFa (%) 1FDp (%) 2F (%) 3Cmax (mg/L) 4Tmax (h) 5AUC0-inf (µg∙h/mL) 6AUC0-t (µg∙h/mL) 7Cmax liver (mg/L) 8
Amikacin
800 mg q24h CL avg (6.068 L/h)99.98099.96499.96411.96248.5395.150189.670129.520
800 mg q24h CL min (1.401 L/h)99.97499.95099.95013.29348.51705.900258.260147.360
800 mg q24h CL max (11.298 L/h)99.98599.97399.97311.01548.5212.320142.930117.190
Gentamicin
200 mg q24h CL avg (5.941 L/h)99.84599.82299.8223.30448.5100.65051.34531.876
200 mg q24h CL min (1.667 L/h)99.78999.75199.7513.66748.5355.60069.99936.212
200 mg q24h CL max (15.887 L/h)99.90899.89999.8992.86048.537.74430.15226.809
Tobramycin
420 mg q24h CL avg (6.007 L/h)99.97199.97199.9719.57948.5209.640131.430104.740
420 mg q24h CL min (3.868 L/h)99.96599.96599.96510.14948.5325.460158.850111.740
420 mg q24h CL max (8.771 L/h)99.97799.97799.9779.03248.5143.600106.33098.209
Vancomycin
1000 mg q12h CL avg (5.787 L/h)99.92999.92199.92131.26361.01036.000905.74061.742
1000 mg q12h CL min (0.590 L/h)99.78999.74399.74373.19261.010090.0002659.400146.400
1000 mg q12h CL max (18.796 L/h)99.97699.97499.97419.35661.0319.140313.79038.136
1 fraction absorbed as a percent of the dose (crossing the lumen and entering enterocytes); 2 percent of the dose that has reached the portal vein; 3 bioavailability; 4 maximum plasma concentration reached in the central compartment, in mg/L; 5 time to reach maximum plasma concentration, in hours; 6 area under the plasma concentration–time curve, in µg∙h/mL, extrapolated to infinity; 7 area under the plasma concentration–time curve, in µg∙h/mL, for the time of the simulation; 8 maximum concentration reached in the liver, in mg/L.
Publisher’s Note: MDPI stays neutral with regard to jurisdictional claims in published maps and institutional affiliations.

