
Real-Time Hybrid Deep Learning-Based Train Running Safety Prediction Framework of Railway Vehicle


Abstract
1. Introduction
2. Background and Literature Review
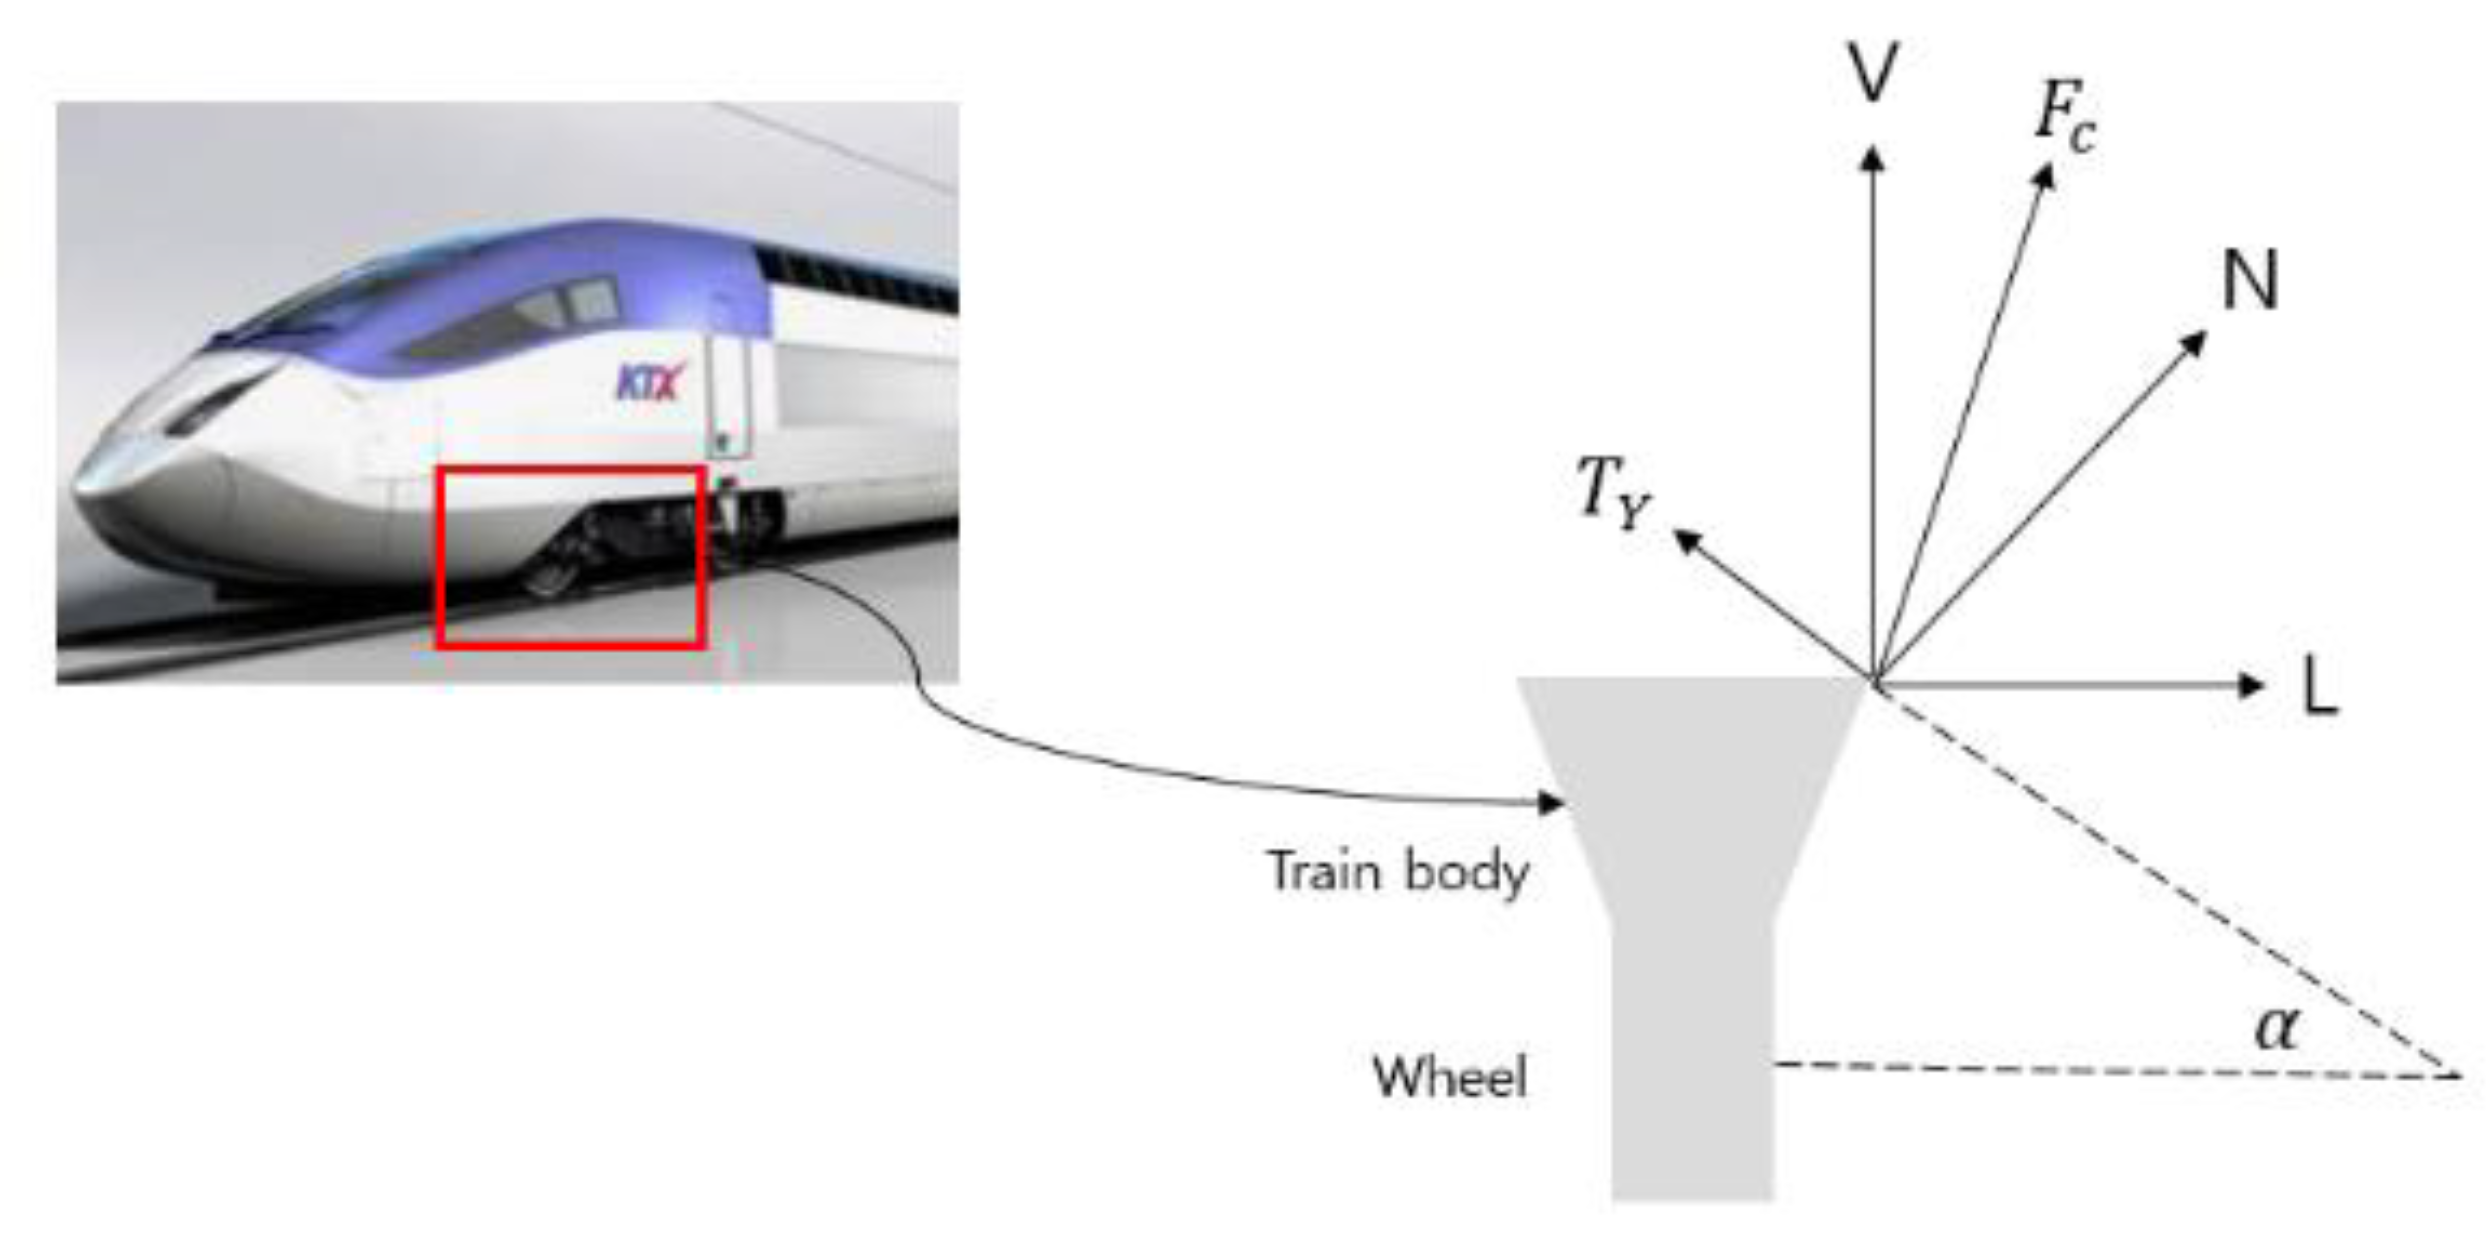
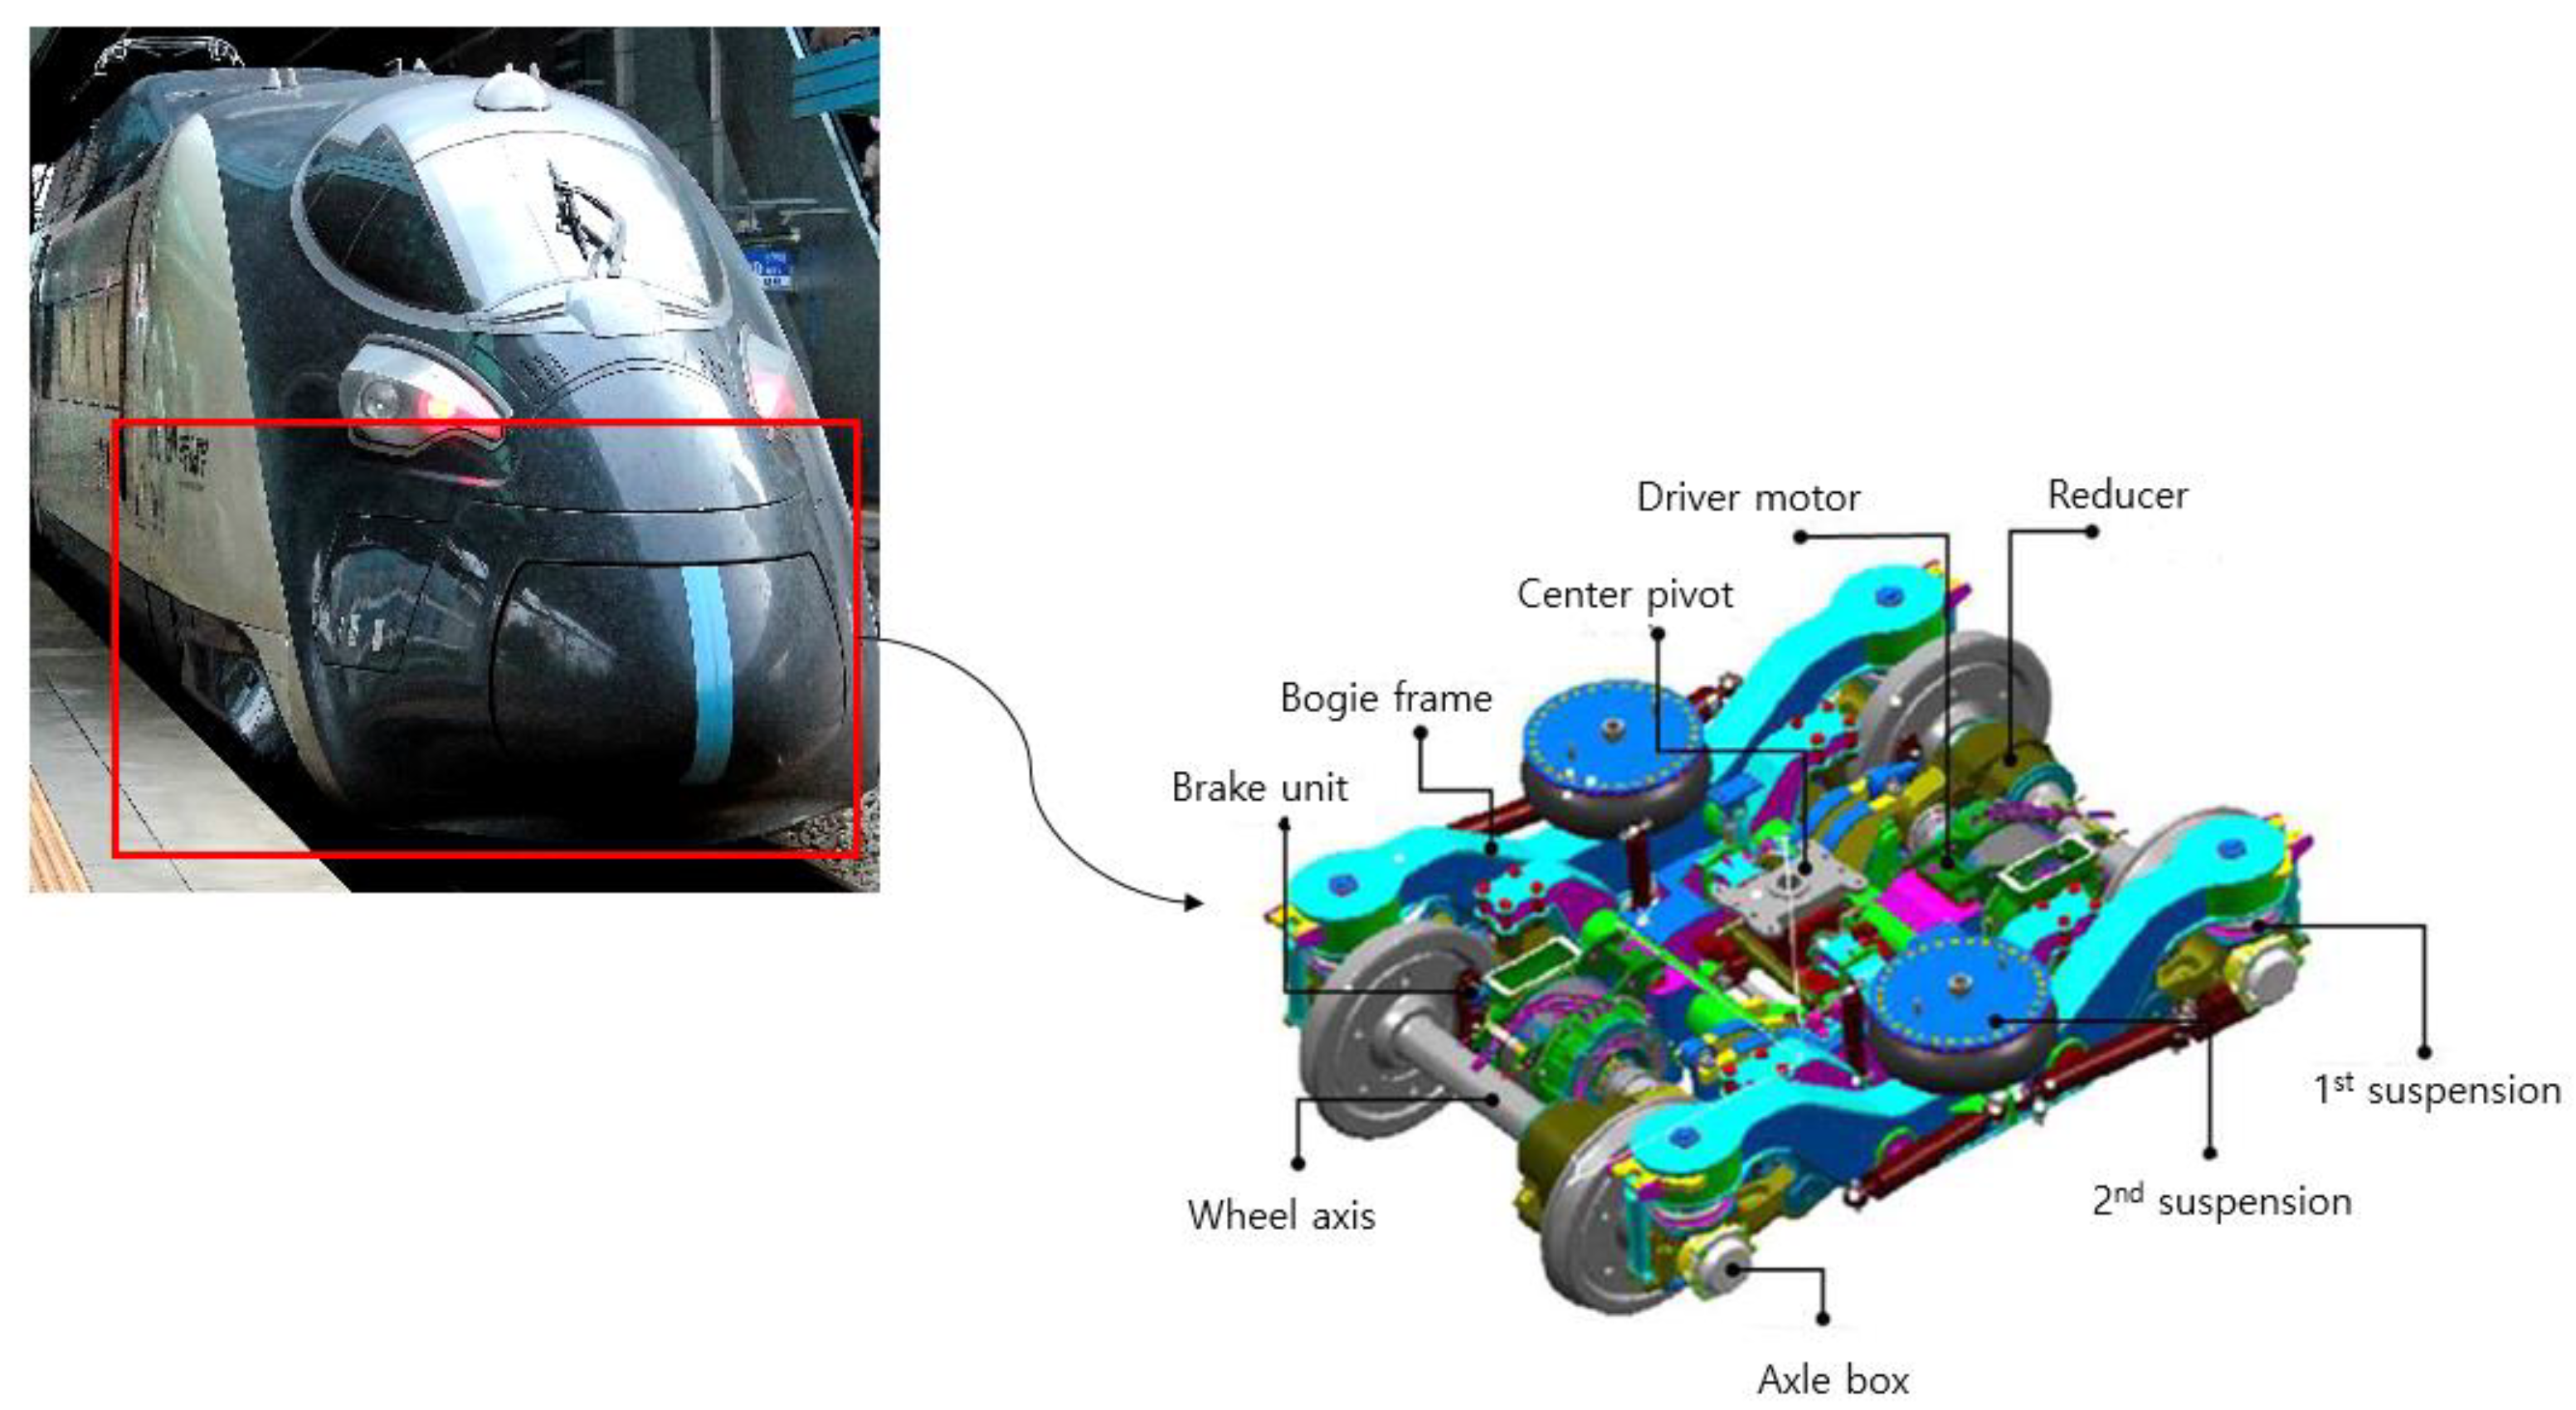
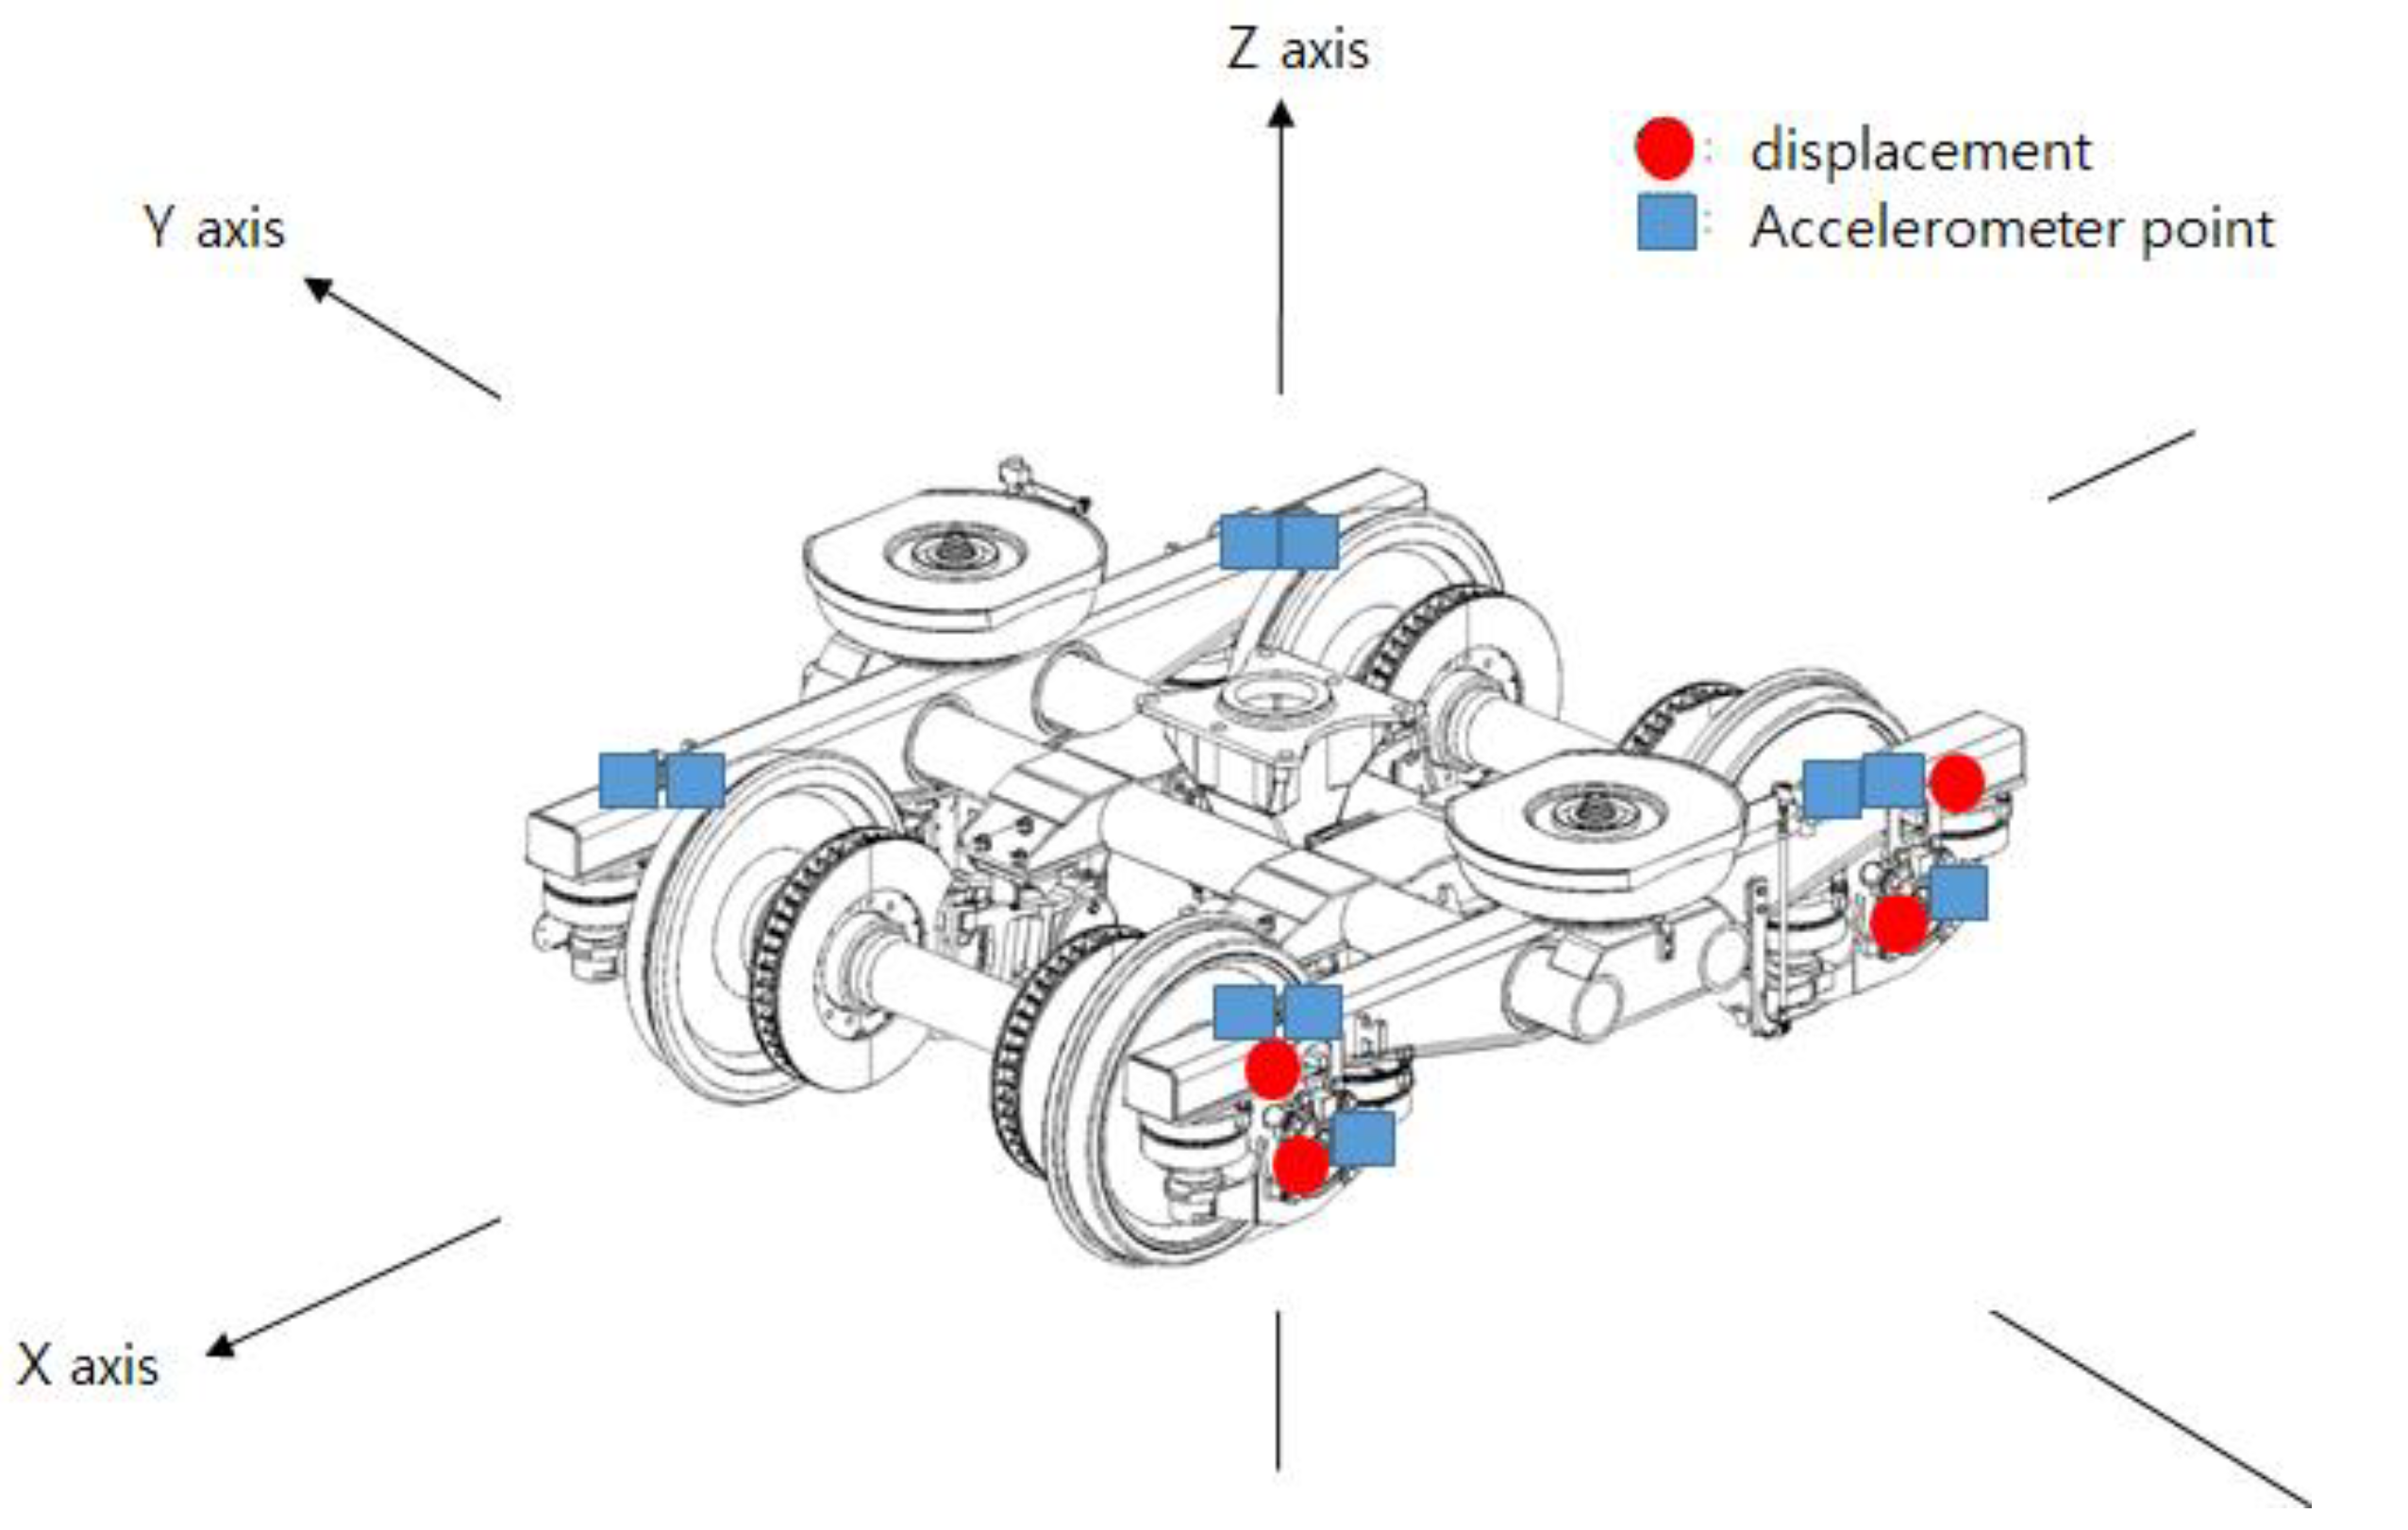
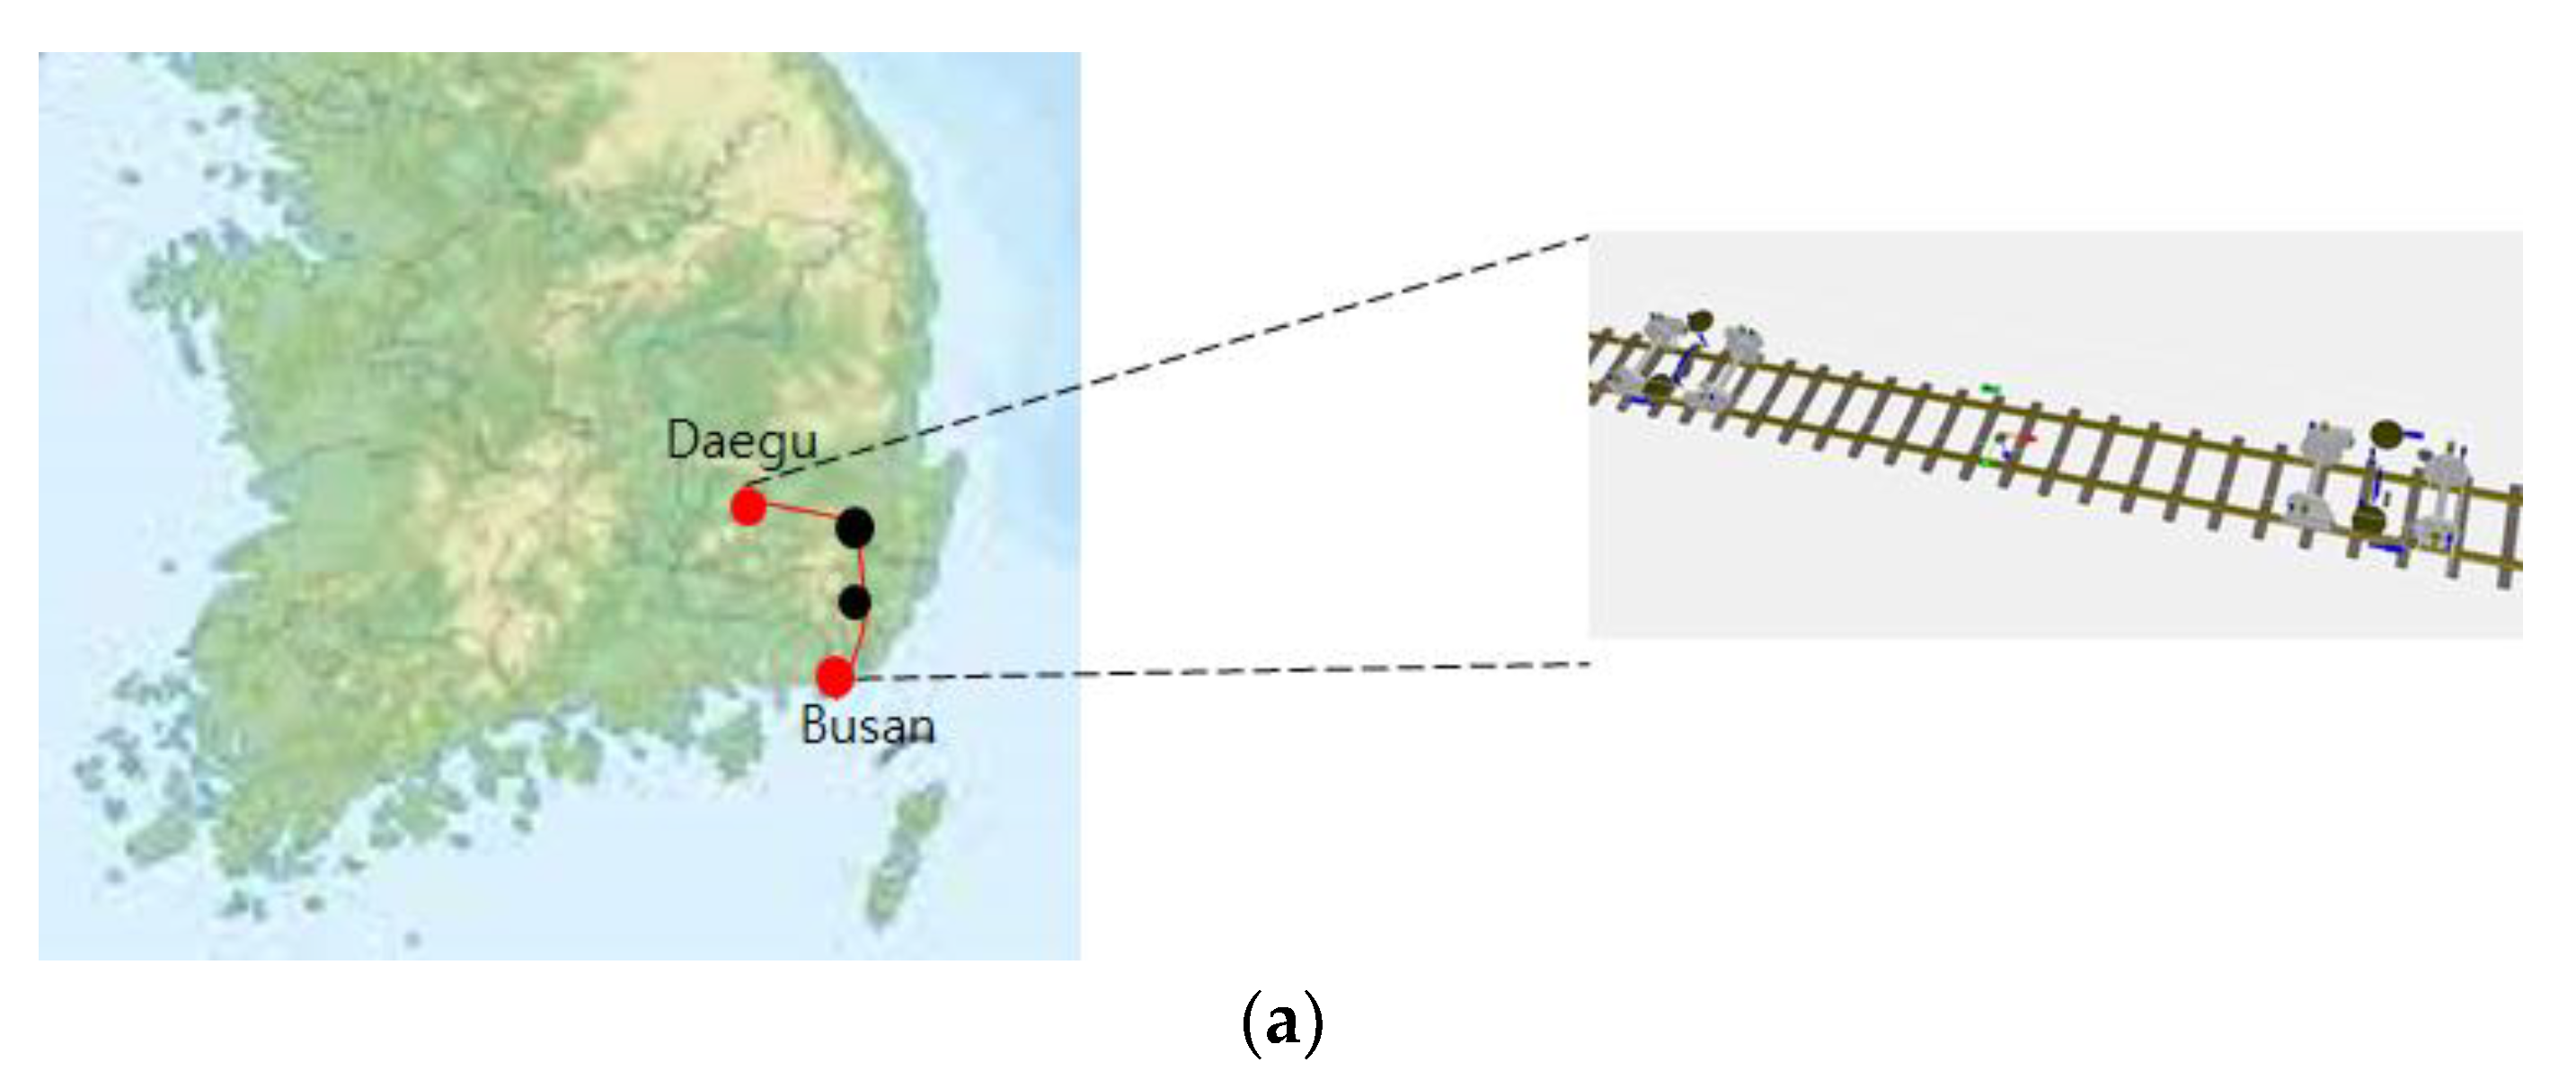
3. Results Train Running Safety Data and Measurement Framework
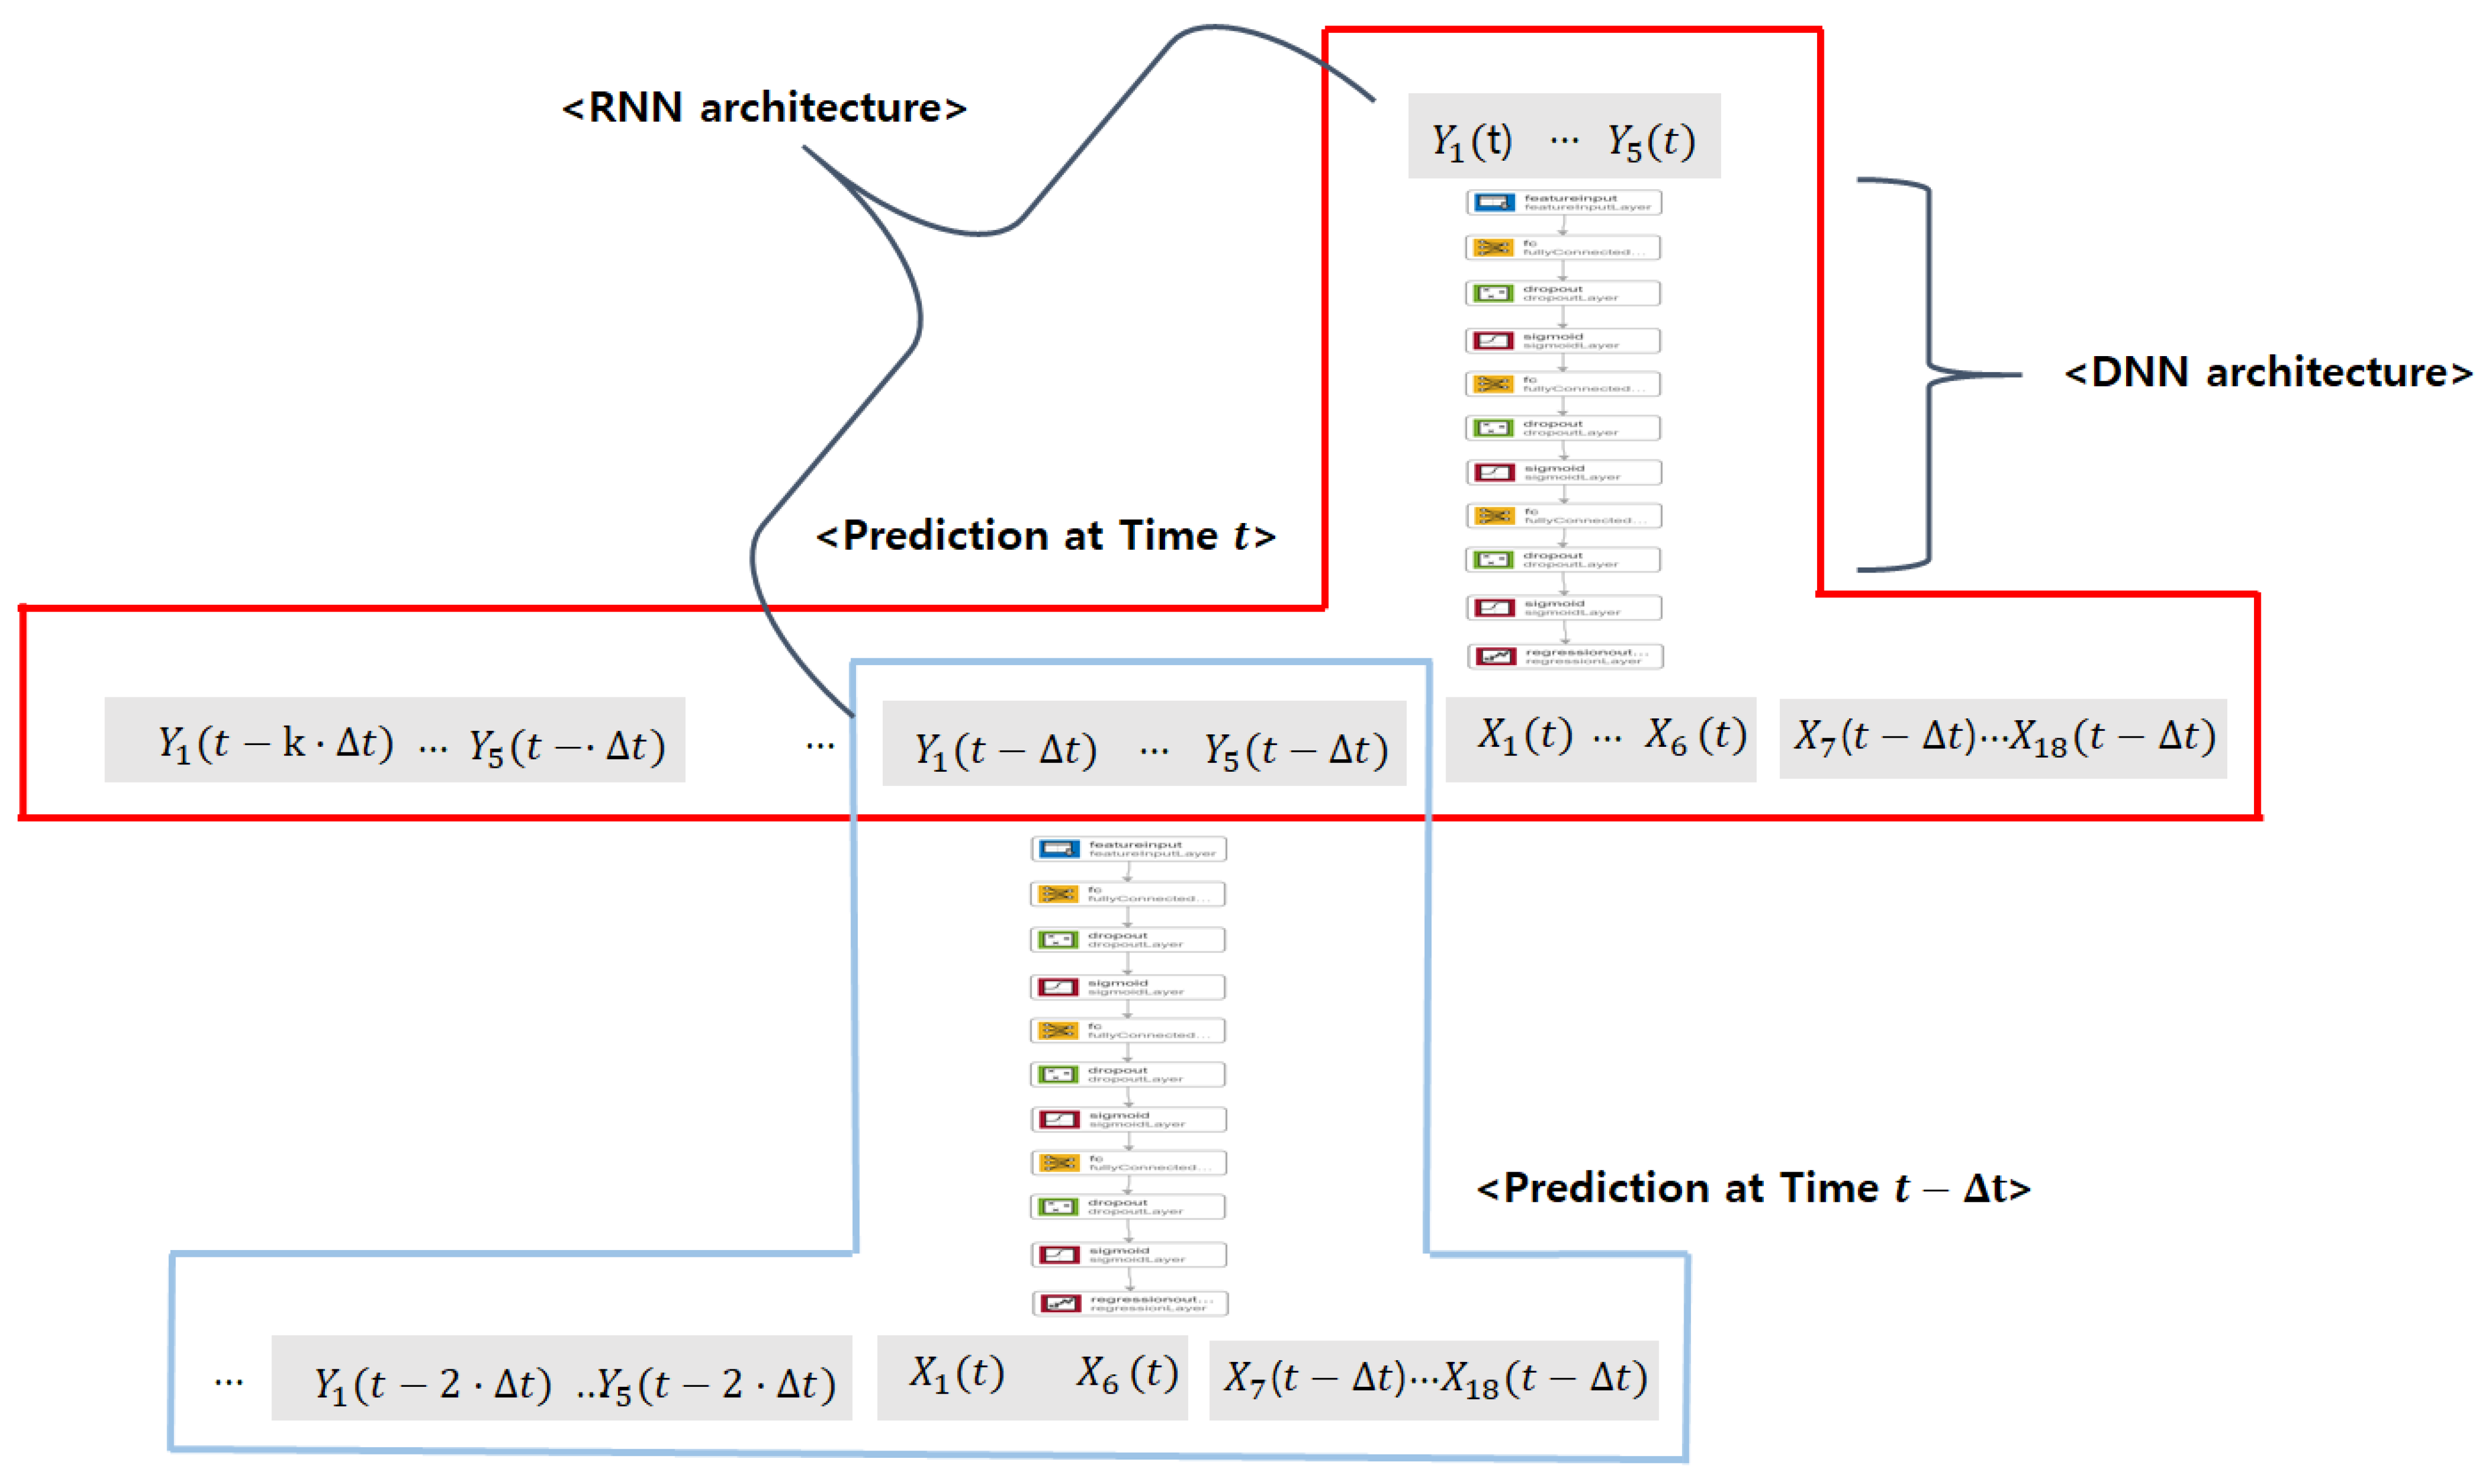
4. Real-Time Deep-Learning-Based Train Running Safety Prediction Framework
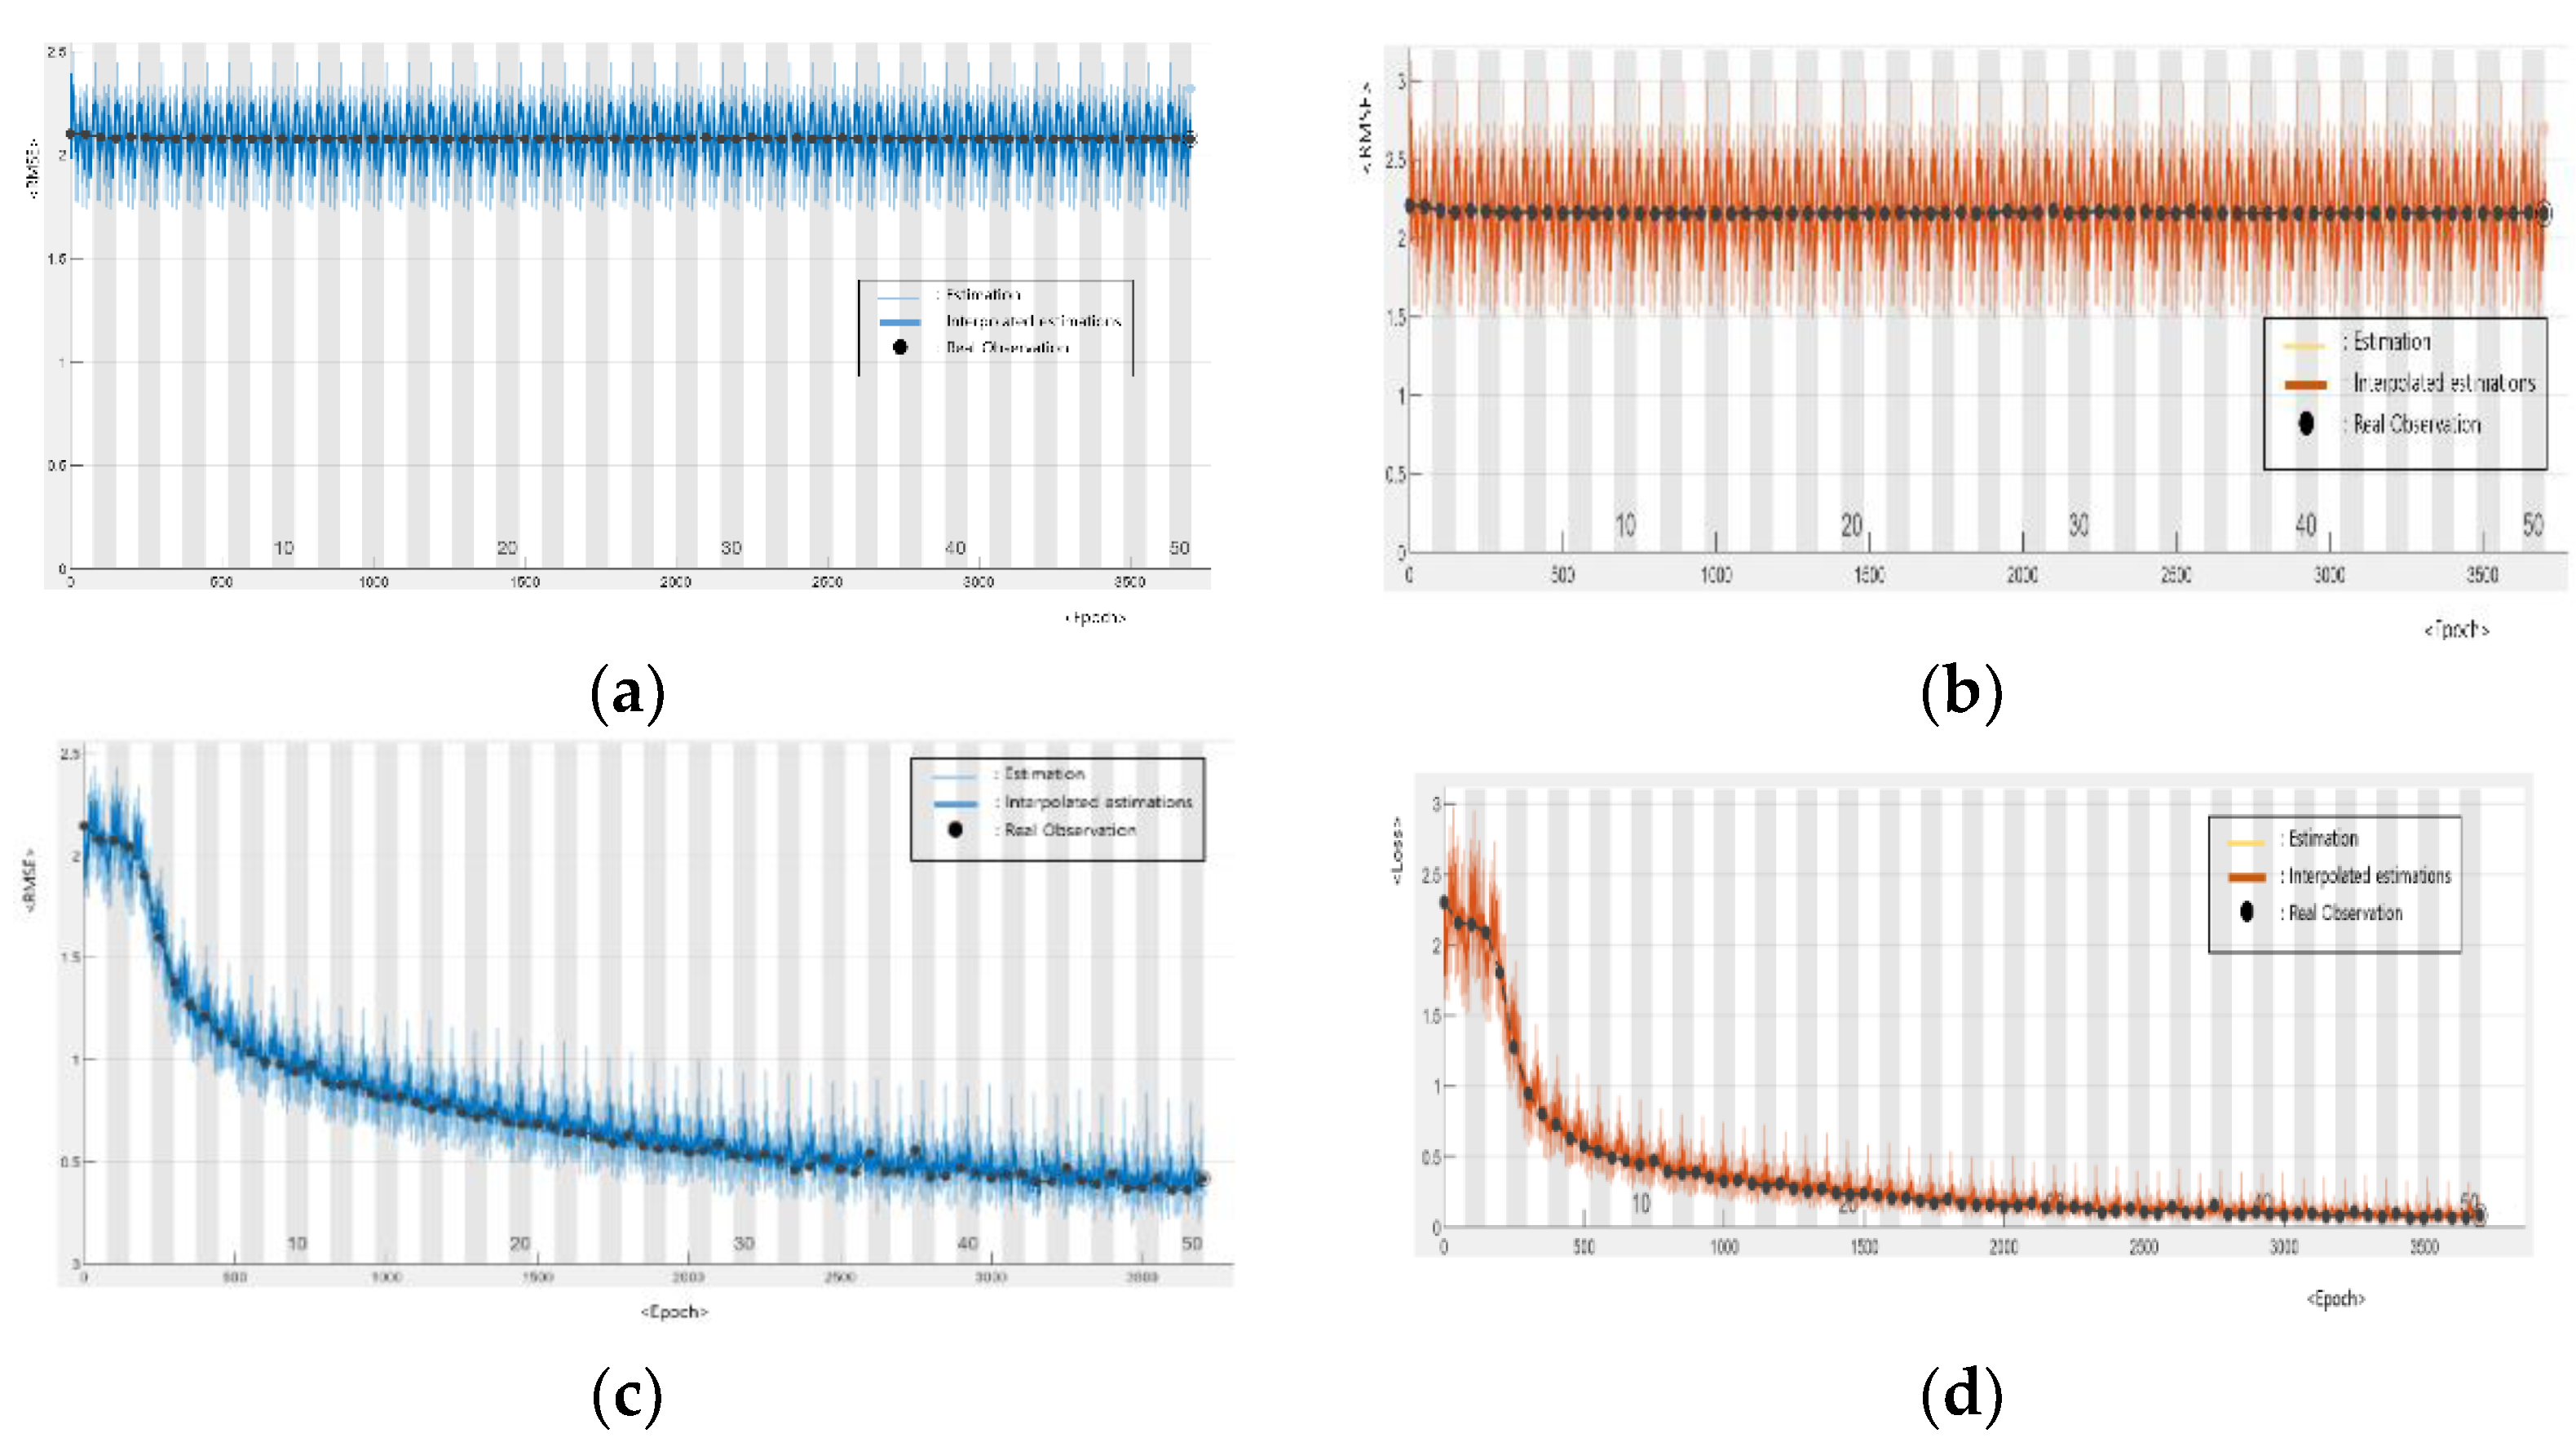
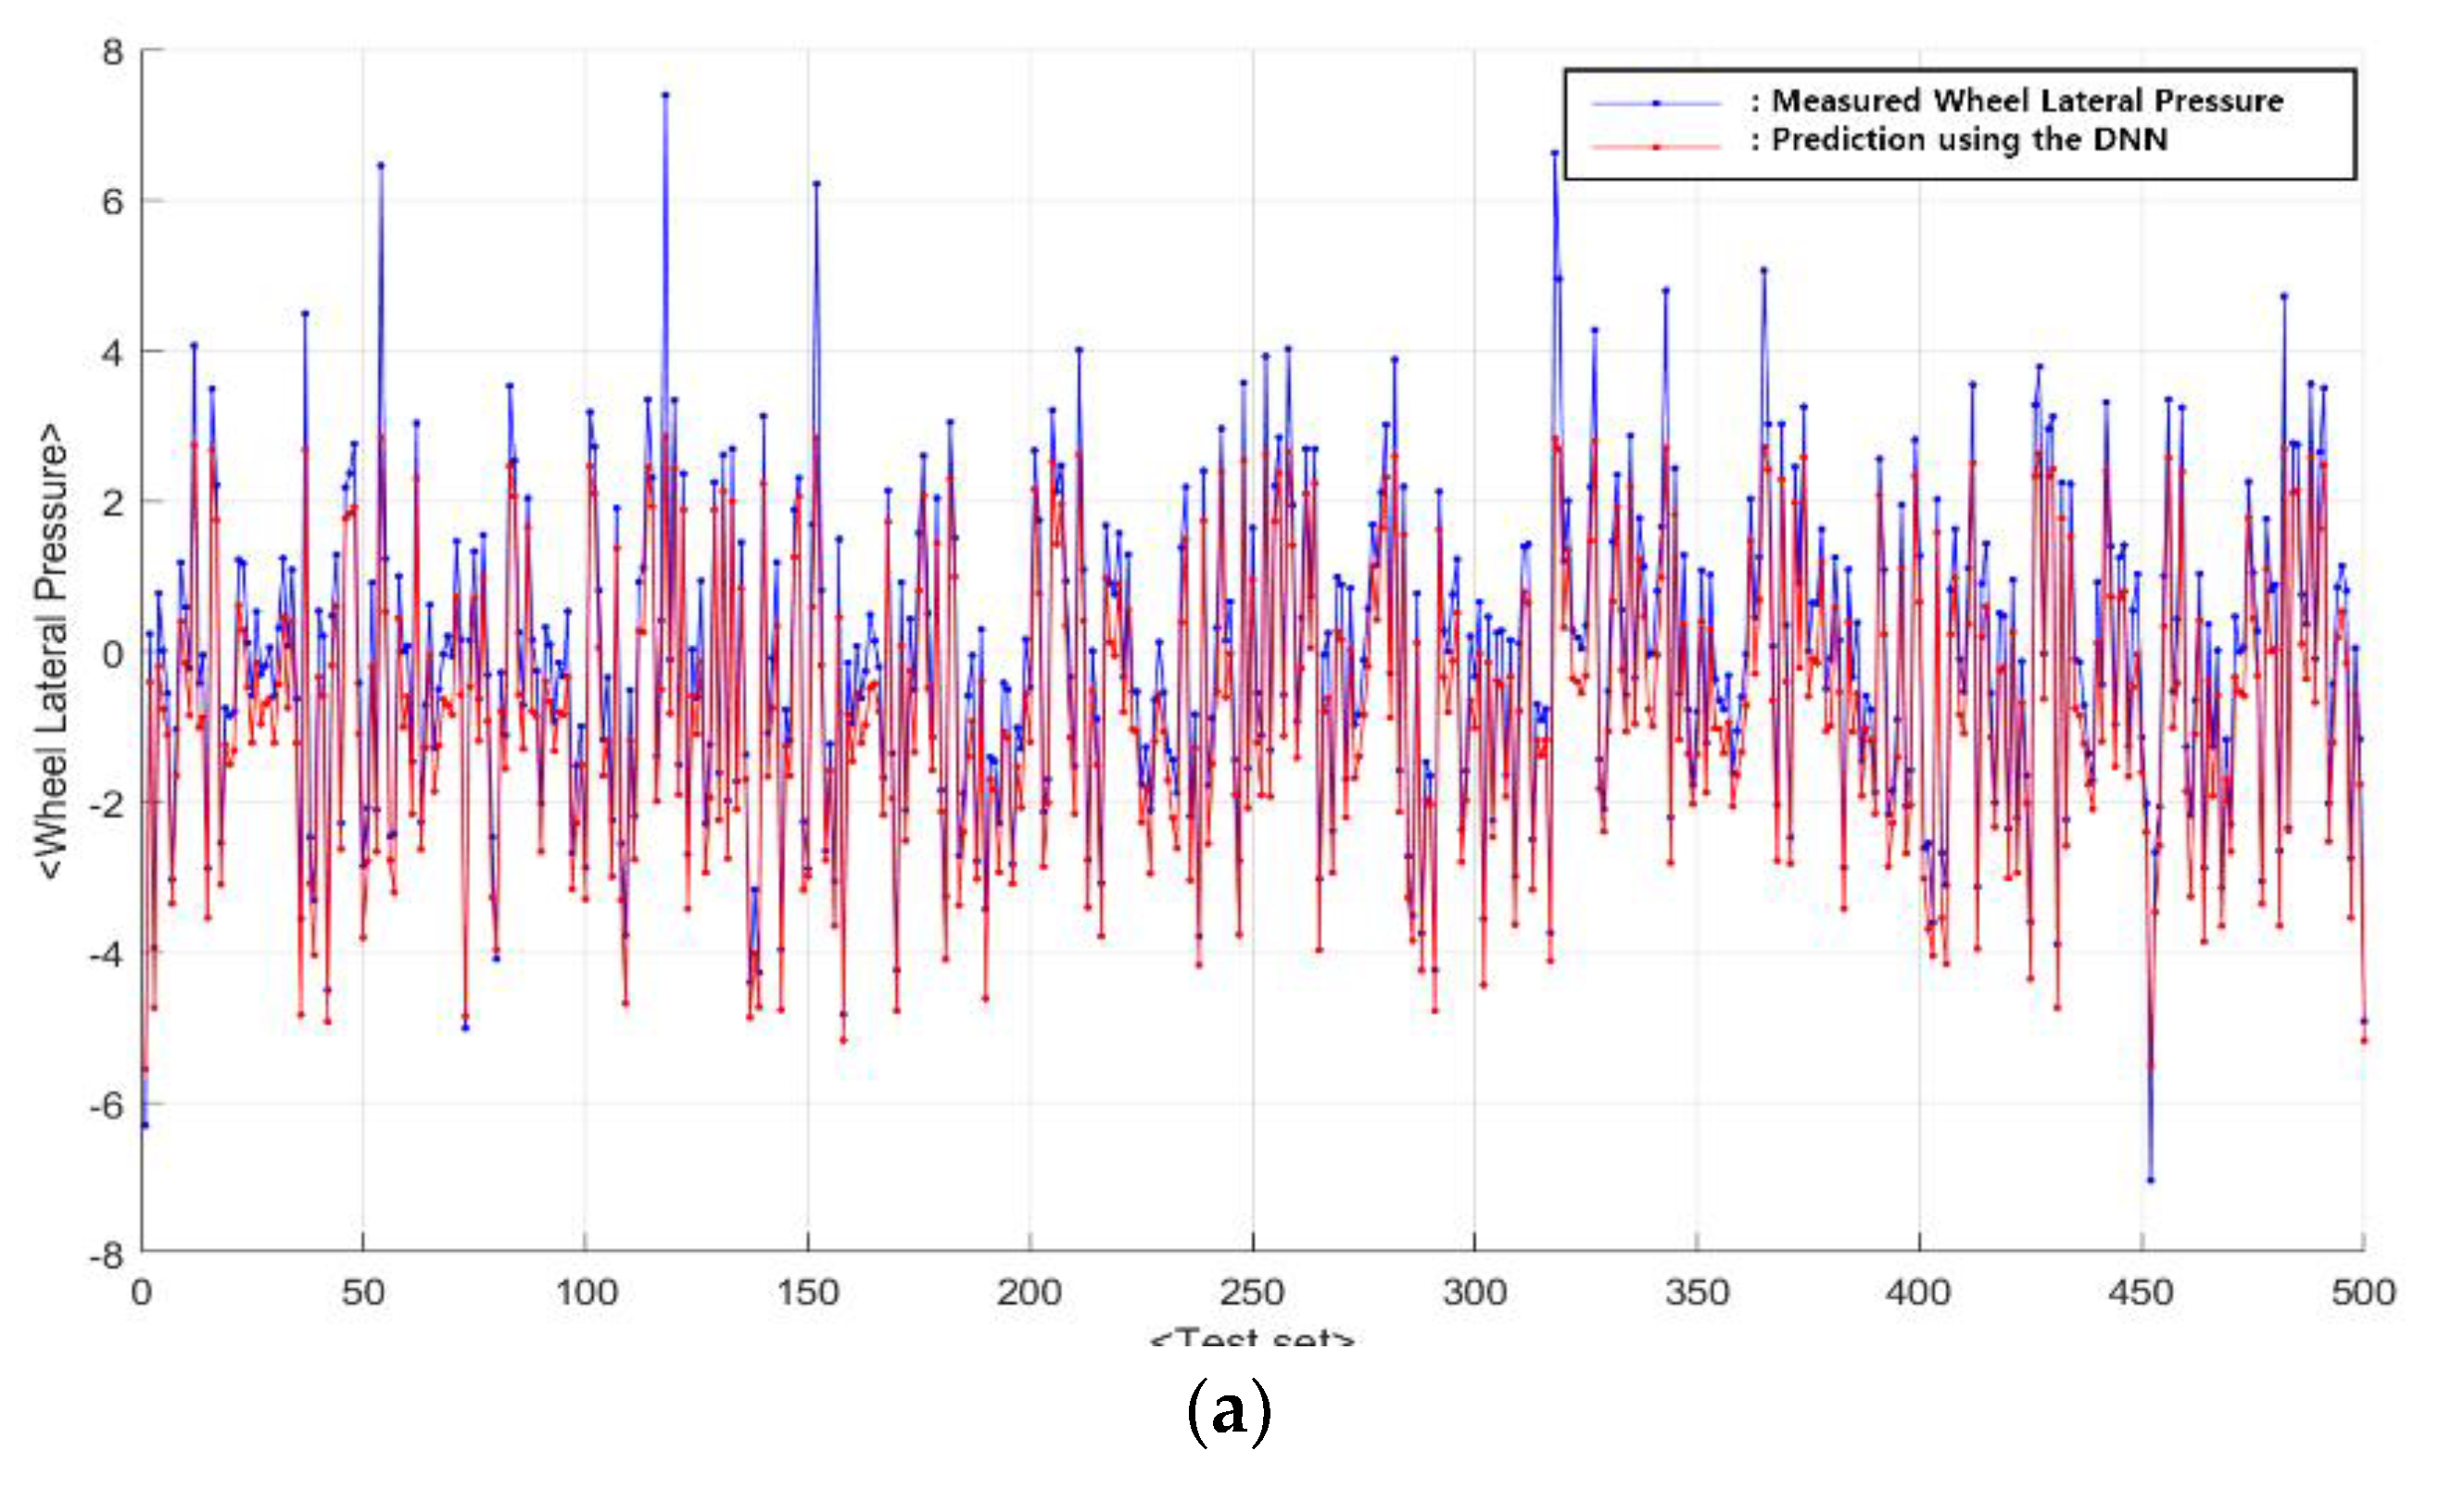
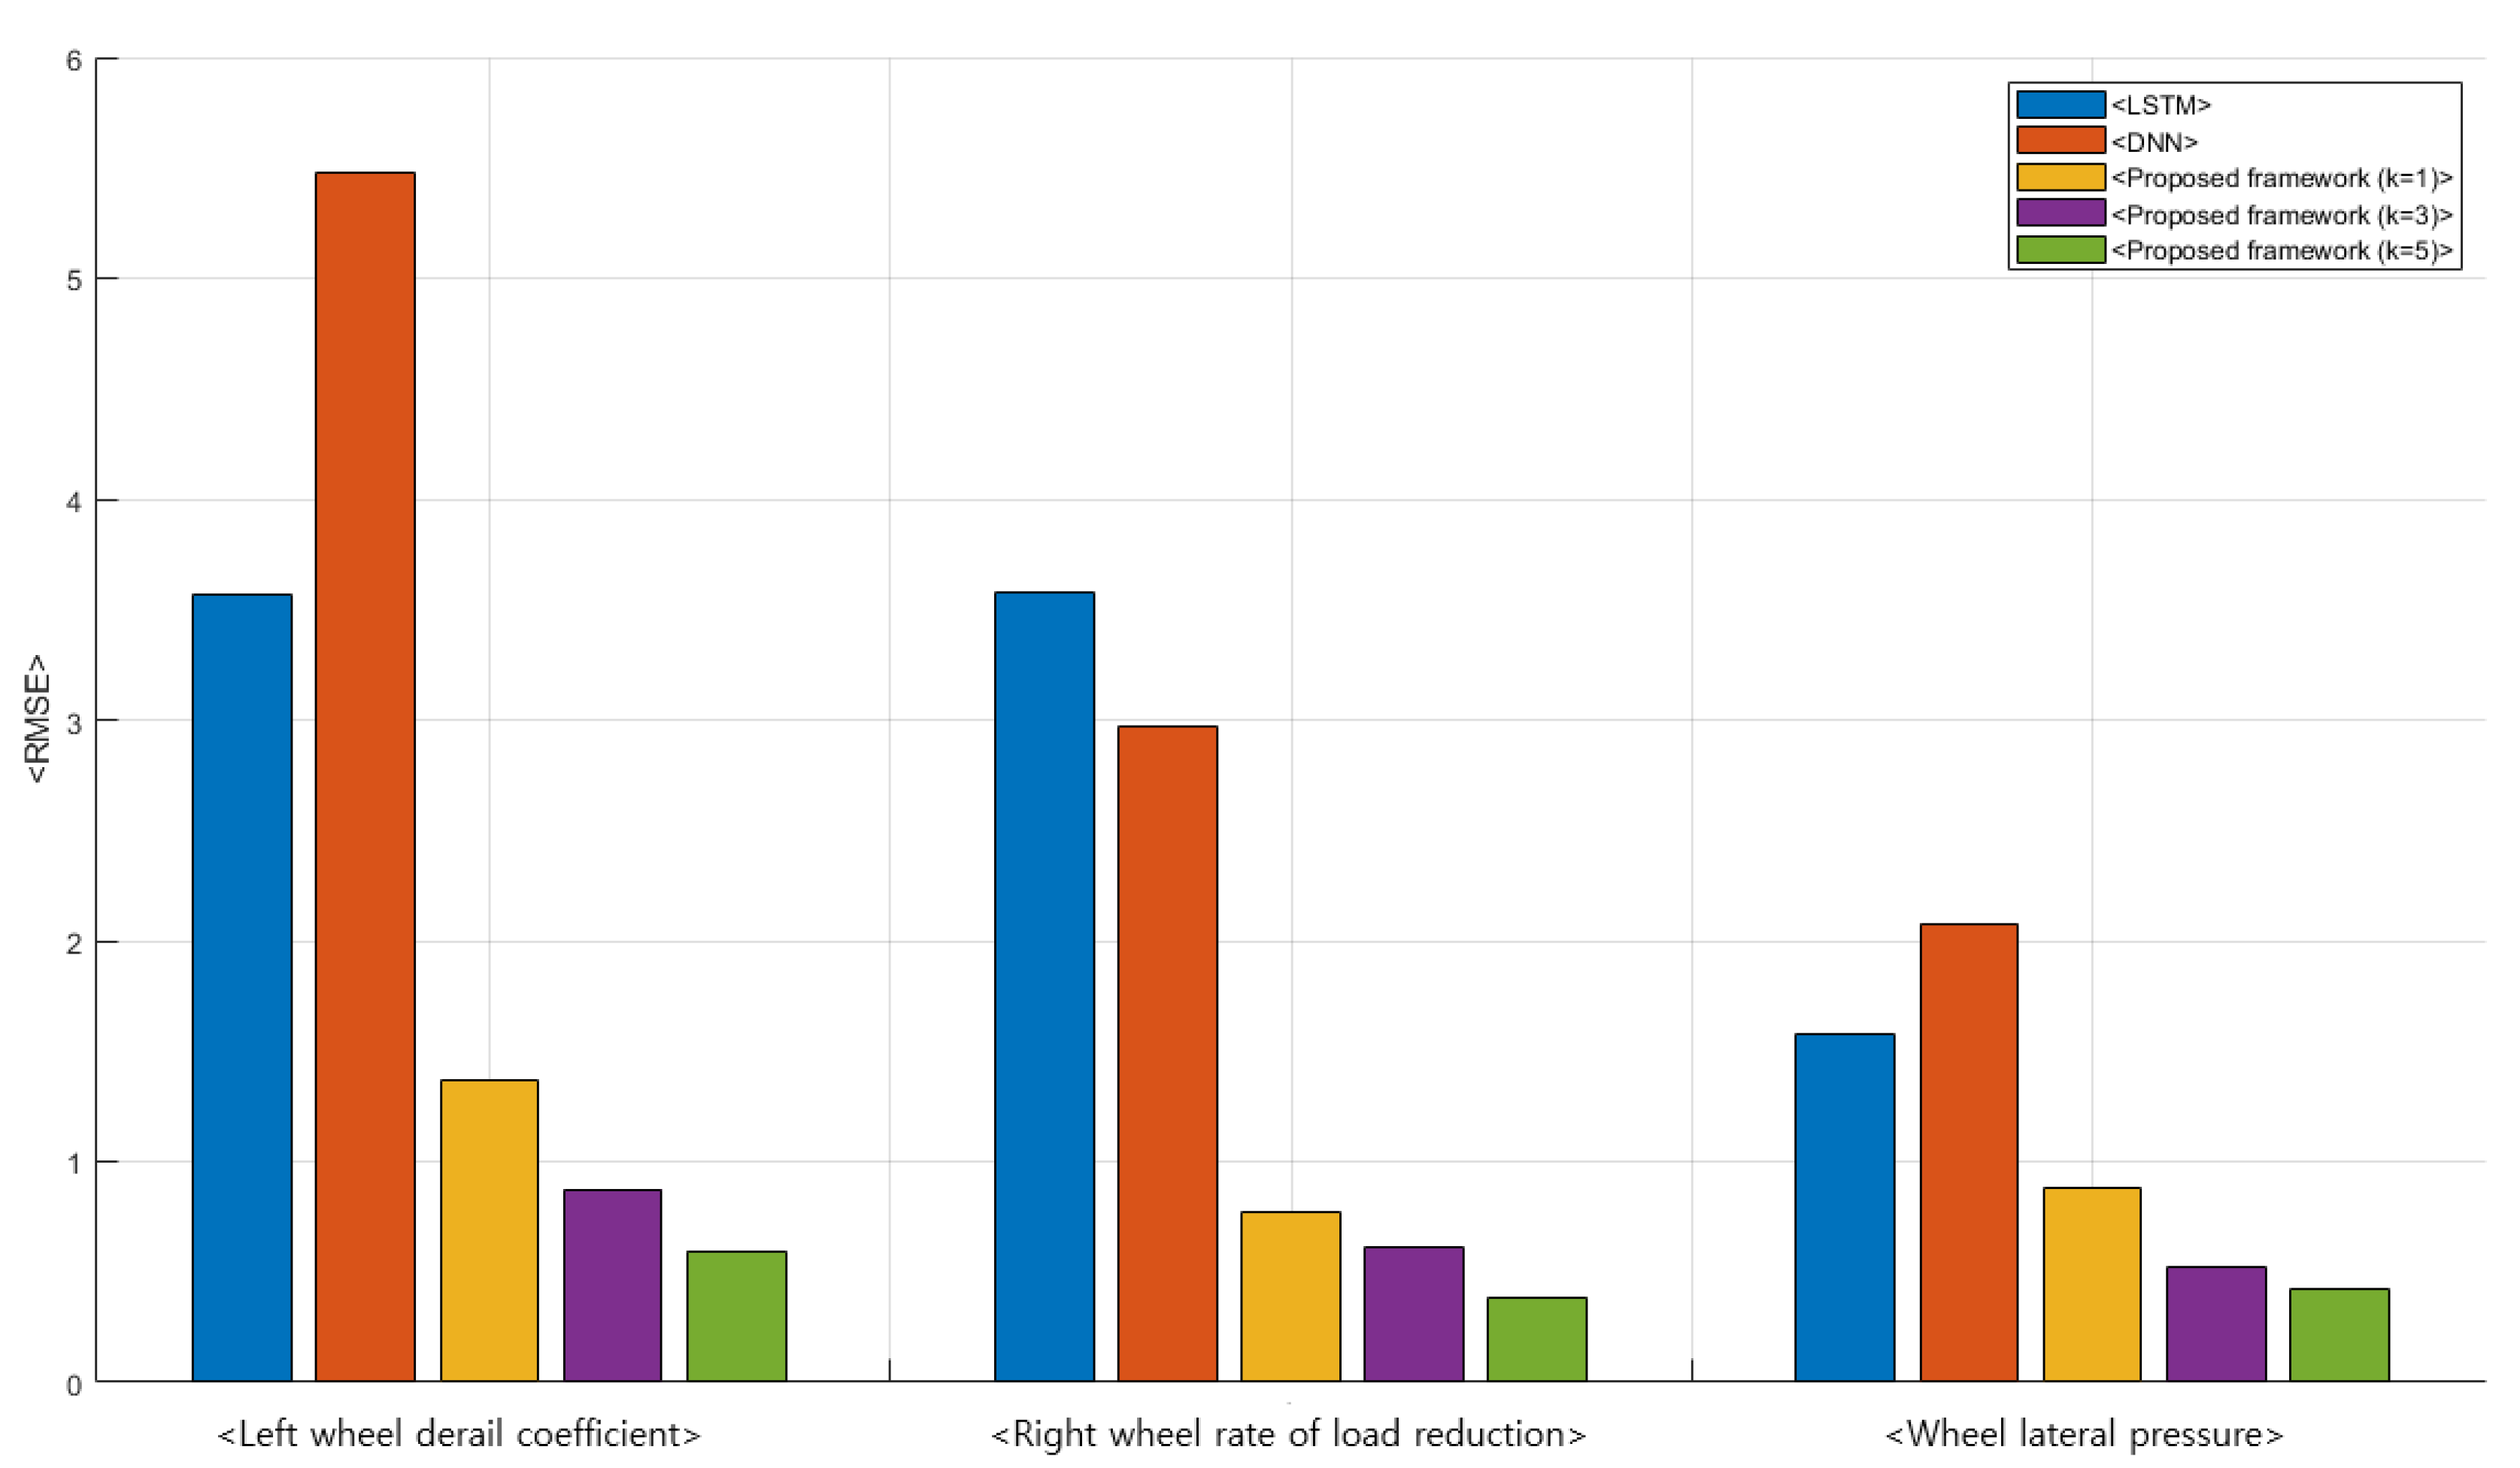
5. Verification and Analysis of Hybrid Deep-Learning Prediction Framework for Train Running Safety
6. Conclusions and Further Study
Author Contributions
Funding
Institutional Review Board Statement
Informed Consent Statement
Data Availability Statement
Conflicts of Interest
References
- UIC. Testing and Approval of Railway Vehicles from the Point of View of Their Dynamic Behaviour-Safety-Track Fatigue-Ride Quality, 4th ed.; International Union of Railways: Paris, France, 2009. [Google Scholar]
- BSI. BS EN 14067-1, Railway Applications- Aerodynamics-Part1: Symbols and Units, 3rd ed.; British Standard Institution: London, UK, 2011. [Google Scholar]
- BSI. BS EN 14067-6:2018-TC Railway Applications-Aerodynamics: Requirements and Test Procedures for Cross Wind Assessment, 1st ed.; British Standard Institution: London, UK, 2020. [Google Scholar]
- KRRI. KRTS-VE-Part31-2014(R1) Technical Specifications for High Speed Railway Vehicles, 1st ed.; Korea Railroad Research Institute: Uiwang, Korea, 2014. [Google Scholar]
- KRRI. KRTS-VE-Part21-2015(R1) Technical Specifications for High Speed Railway Vehicles, 1st ed.; Korea Railroad Research Institute: Uiwang, Korea, 2015. [Google Scholar]
- BSI. EN 14363:2016 Railway Applications—Testing and Simulation for the Acceptance of Running Characteristics of Railway Vehicles-Running Behavior and Stationary Tests, 1st ed.; British Standard Institution: London, UK, 2016. [Google Scholar]
- UIC. UIC Code 518 OR Testing and Approval of Railway Vehicles from the Point of View of Their Dynamic Behavior-Safety-Track Fatigue-Ride Quality, 1st ed.; Worldwide Railway Organisation: Paris, France, 2003. [Google Scholar]
- KRRI. KRTS-VE-Part51-2017(R1) Technical Specifications for High Speed Railway Vehicles, 1st ed.; Korea Railroad Research Institute: Uiwang, Korea, 2017. [Google Scholar]
- Arvidsson, T.; Andersson, C.; Karoumi, R. Train running safety on non-ballasted bridges. Int. J. Rail Transp. 2018, 7, 1–22. [Google Scholar] [CrossRef]
- Diang, Y.; Sun, P.; Wang, G.; Song, Y.; Wu, L.; Yue, Q.; Li, A. Early-warning method of train running safety of a high-speed railway bridge based on transverse vibration monitoring. Shock Vib. 2015, 2015, 1–9. [Google Scholar] [CrossRef]
- Choi, J.; Kim, J.; Chung, J.; Lee, S. Evaluation of Training running safety for direct fixation concrete track on light rapid transit. J. Korean Soc. Saf. 2017, 32, 41–46. [Google Scholar]
- Jang, S.; Yang, S. Assessment of train running safety, ride comfort and track serviceability at transition between floating slab track and conventional concrete track. J. Korean Soc. Railw. 2012, 15, 48–61. [Google Scholar] [CrossRef][Green Version]
- Kim, M.K.; Eom, B.G.; Lee, H.S. Running Safety Analysis of Railway Vehicle Passing through Curve Depending on Rail Inclination Change. Korean Soc. Noise Vib. Eng. 2013, 23, 199–208. [Google Scholar] [CrossRef][Green Version]
- Oh, J.T.; Kwon, T.S. A Study on the Assessment of Derailment Factor for the Enhancement of Train Running Safety. In Proceedings of the Spring Conference & Annual Meeting of the Korean Society for Railway, Changwon, Korea, 6 October 2000; Volume 2000, pp. 210–217. [Google Scholar]
- Seo, S.; Park, J.H.; Min, S.H. Studies on Safety Criteria for Trains Running on Floating Railway Bridges. Advances in Structural Engineering. Available online: https://journals.sagepub.com/doi/abs/10.1177/1369433220980524 (accessed on 30 March 2021).
- Zhang, X.; Zhou, S.; Di, H.; He, C. A semi-analytical model of the train-floating slab track-tunnel-soil system considering the non-nonlinear wheel/rail contact. J. Rail Rapid Transit 2018, 232, 2063–2078. [Google Scholar] [CrossRef]
- Alawad, H.; Kaewunruen, S.; An, M. A deep learning approach towards railway safety risk assessment. IEEE Access 2020, 8, 102811–102832. [Google Scholar] [CrossRef]
- Yang, C.; Sun, Y.; Ladubec, C.; Liu, Y. Developing machine learning-based models for railway inspection. Appl. Sci. 2021, 11, 1–15. [Google Scholar]
- He, K.; Zhang, X.; Ren, S.; Sun, J. Deep residual learning for image recognition. In Proceedings of the 2016 IEEE Conference on Computer Vision and Pattern Recognition, Las Vegas, NV, USA, 27–30 June 2016; pp. 1063–6919. [Google Scholar]
- Lee, H.; Han, S.; Park, K. Generative adversarial network-based missing data handling and remaining useful life estimation for smart train control and monitoring systems. J. Adv. Transp. 2020, 2020, 1–15. [Google Scholar]
- Vampire Pro. Available online: https://www.ensco.com/rail/vampire (accessed on 10 January 2021).
- Cherchas, D.B. Determination of railway wheel climb probability based on the derailment coefficient. J. Frankl. Inst. 1981, 312, 31–40. [Google Scholar] [CrossRef]
- Wang, P.; Wang, J.; Ma, X.; Ma, D.; Xu, J.; Q, Y. Theoretical 3D model for Quasistatic critical derailment coefficient of railway vehicles and a simplified formula. Math. Probl. Eng. 2017, 2018, 1–14. [Google Scholar] [CrossRef]
- Wang, K.; Huang, C.; Zhai, W.; Liu, P.; Wang, S. Progress on wheel-rail dynamic performance of railway curve negotiation. J. Traffic Transp. Eng. 2014, 1, 209–220. [Google Scholar] [CrossRef]
- Vollebregt, E. Detailed wheel/rail geometry processing with the conformal contact approach. Multibody Syst. Dyn. 2020, 2020, 1–33. [Google Scholar] [CrossRef]
- Zhou, L.; Brunskill, H.; Pletz, M.; Daves, W.; Scheriau, S.; Lewis, R. Real-time measurement of dynamic wheel-rail contacts using ultrasonic reflectometry. J. Tribol. 2019, 141, 1–9. [Google Scholar] [CrossRef]
- Jo, Y.; Lee, H. Electricity demand forecasting framework using modified attention-based LSTM. J. Korean Inst. Intell. Syst. 2020, 30, 242–250. [Google Scholar] [CrossRef]
- Zhang, Q.; Zhuang, Y.; Wei, Y.; Jiang, H.; Yang, H. Railway safety risk assessment and control optimization method based on FTA-FPN: A case study of Chinese high-speed railway station. J. Adv. Transp. 2020, 2020, 1–11. [Google Scholar] [CrossRef]
- Bae, H.; Yun, K.; Moon, J.; Lim, N. Impact force evaluation of the derailment containment wall for high-speed train through a collision simulation. Adv. Civ. Eng. 2018, 2018, 1–14. [Google Scholar] [CrossRef]
- Rahmadani, F.; Lee, H. Hybrid deep learning-based epidemic prediction framework of COVID-19: South Korea case. Appl. Sci. 2020, 10, 8539. [Google Scholar] [CrossRef]


| Symbol | Terms | Unit |
|---|---|---|
| L | Lateral force | kN |
| V | Vertical force | kN |
| N | Normal force | kN |
| Contact angle (Flange contact angle) | ||
| Tangential force | kN | |
| Y | Lateral force per a wheel axis | kN |
| P | Axle load | kN |
| Friction coefficient | (R is real number) | |
| Gap between consecutive vertical forces | kN |
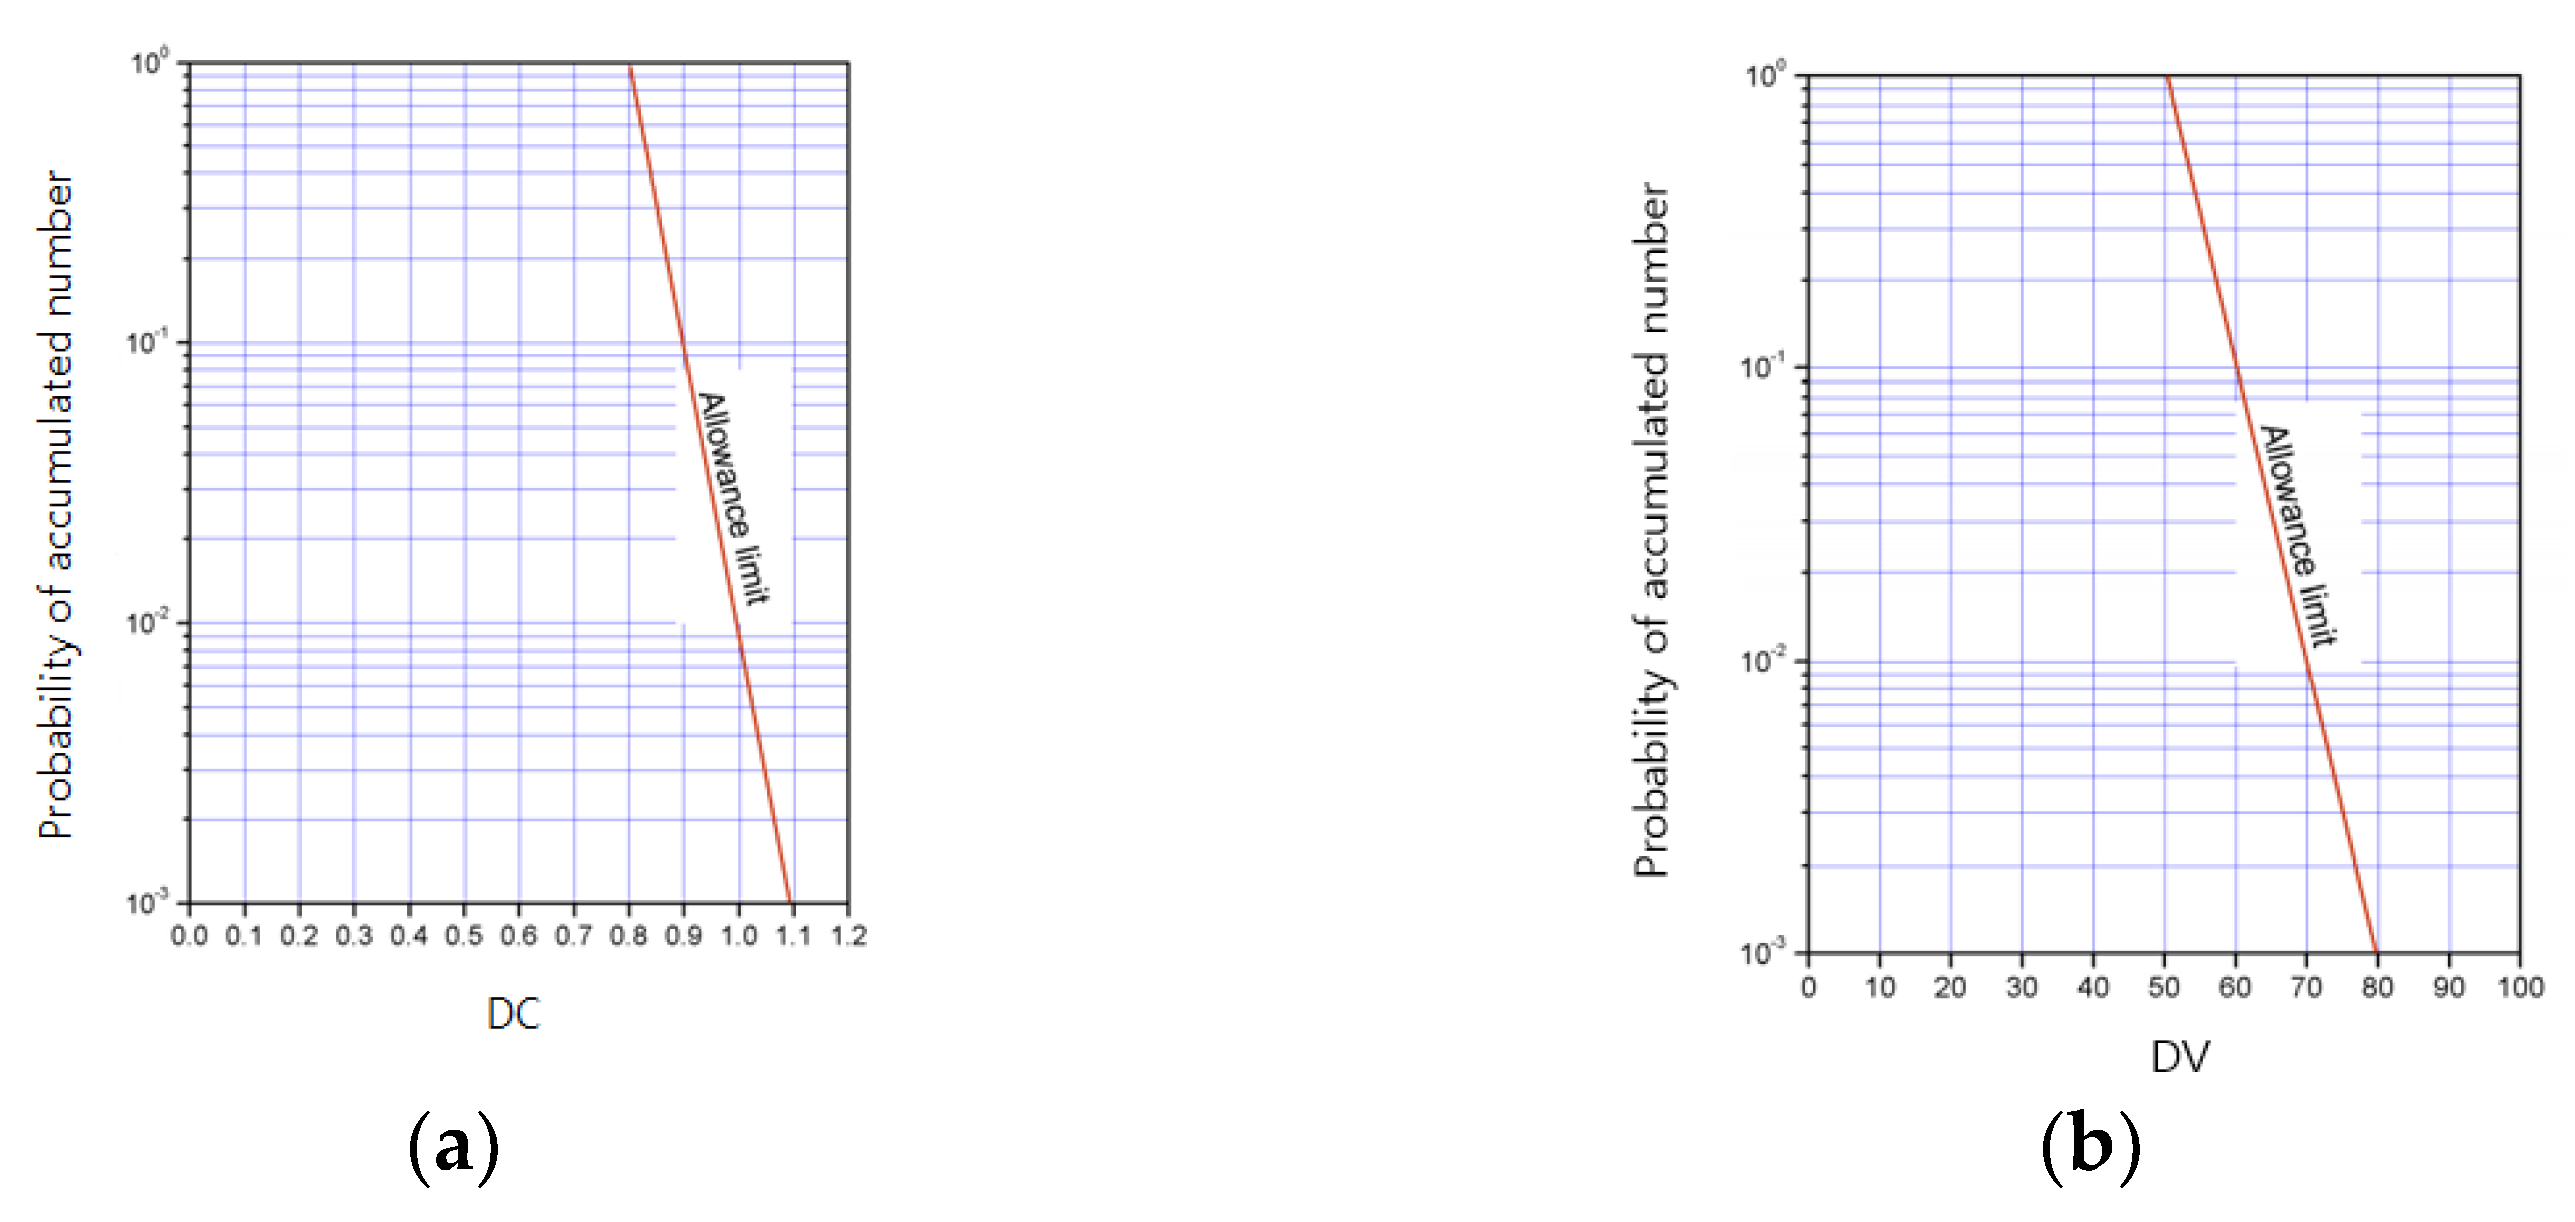
| Classification | Measurements | Unit | Criteria |
|---|---|---|---|
| Train running safety | Rate of wheel load reduction (DV) | , R is a real number | |
| Derailment coefficient (DC) | R | ||
| Lateral displacement of rail head (LD) | mm |
| Existing Research Studies | Characteristics | Used Methods | Issues |
|---|---|---|---|
| Arvidsson et al. [9] | - Running safety simulation under non-ballasted bridge environments - Simulation analysis of running safety and passenger comport | - Simulation using 2D train-track-bridge model | - Predefined model-based simulation studies |
| Ding, et al. [10] | - Early warning framework with vibrations of an express train | - Nonlinear equation-based regress model | - Monitoring-based early warning framework |
| Choi, et al. [11] | - Light rail (LRT)-based vibration measurement on real running environment | - Real measurement | - Limited in small distance-measurement |
| Jang and Yang [12] | - Numerical simulation—Consideration on transition between floating slab track and concrete track | - DIASTARS-based CAE simulation | - Limited experimental condition |
| Kim, et al. [13] | - CAE-based simulation studies | - Input of “real railway models and conditions” | - CAE-based analysis |
| Oh and Kwon [14] | - Measure on real train - Exemplary proof of DV’s importance on running safety | - Vibration measurement on trains with different weights | - Single factor (weight)-based experiment |
| Seo, et al. [15] | - Simulation study- Relationship between train wheels and floating railway bridges | - Modeling of floating railway bridges - Nonlinear equation-based wheel motion model | - Nonlinear equation-based simulation model |
| Zhang, et al. [16] | - 3D simulation model of train-induced vibration of a floating slab | - Train/environment model-based simulation | - Model-based simulation study |
| Classification | Attribute | Unit | Data Source | |
|---|---|---|---|---|
| Modeling Input Form Real Measurement | Generation Using Transient Analysis | |||
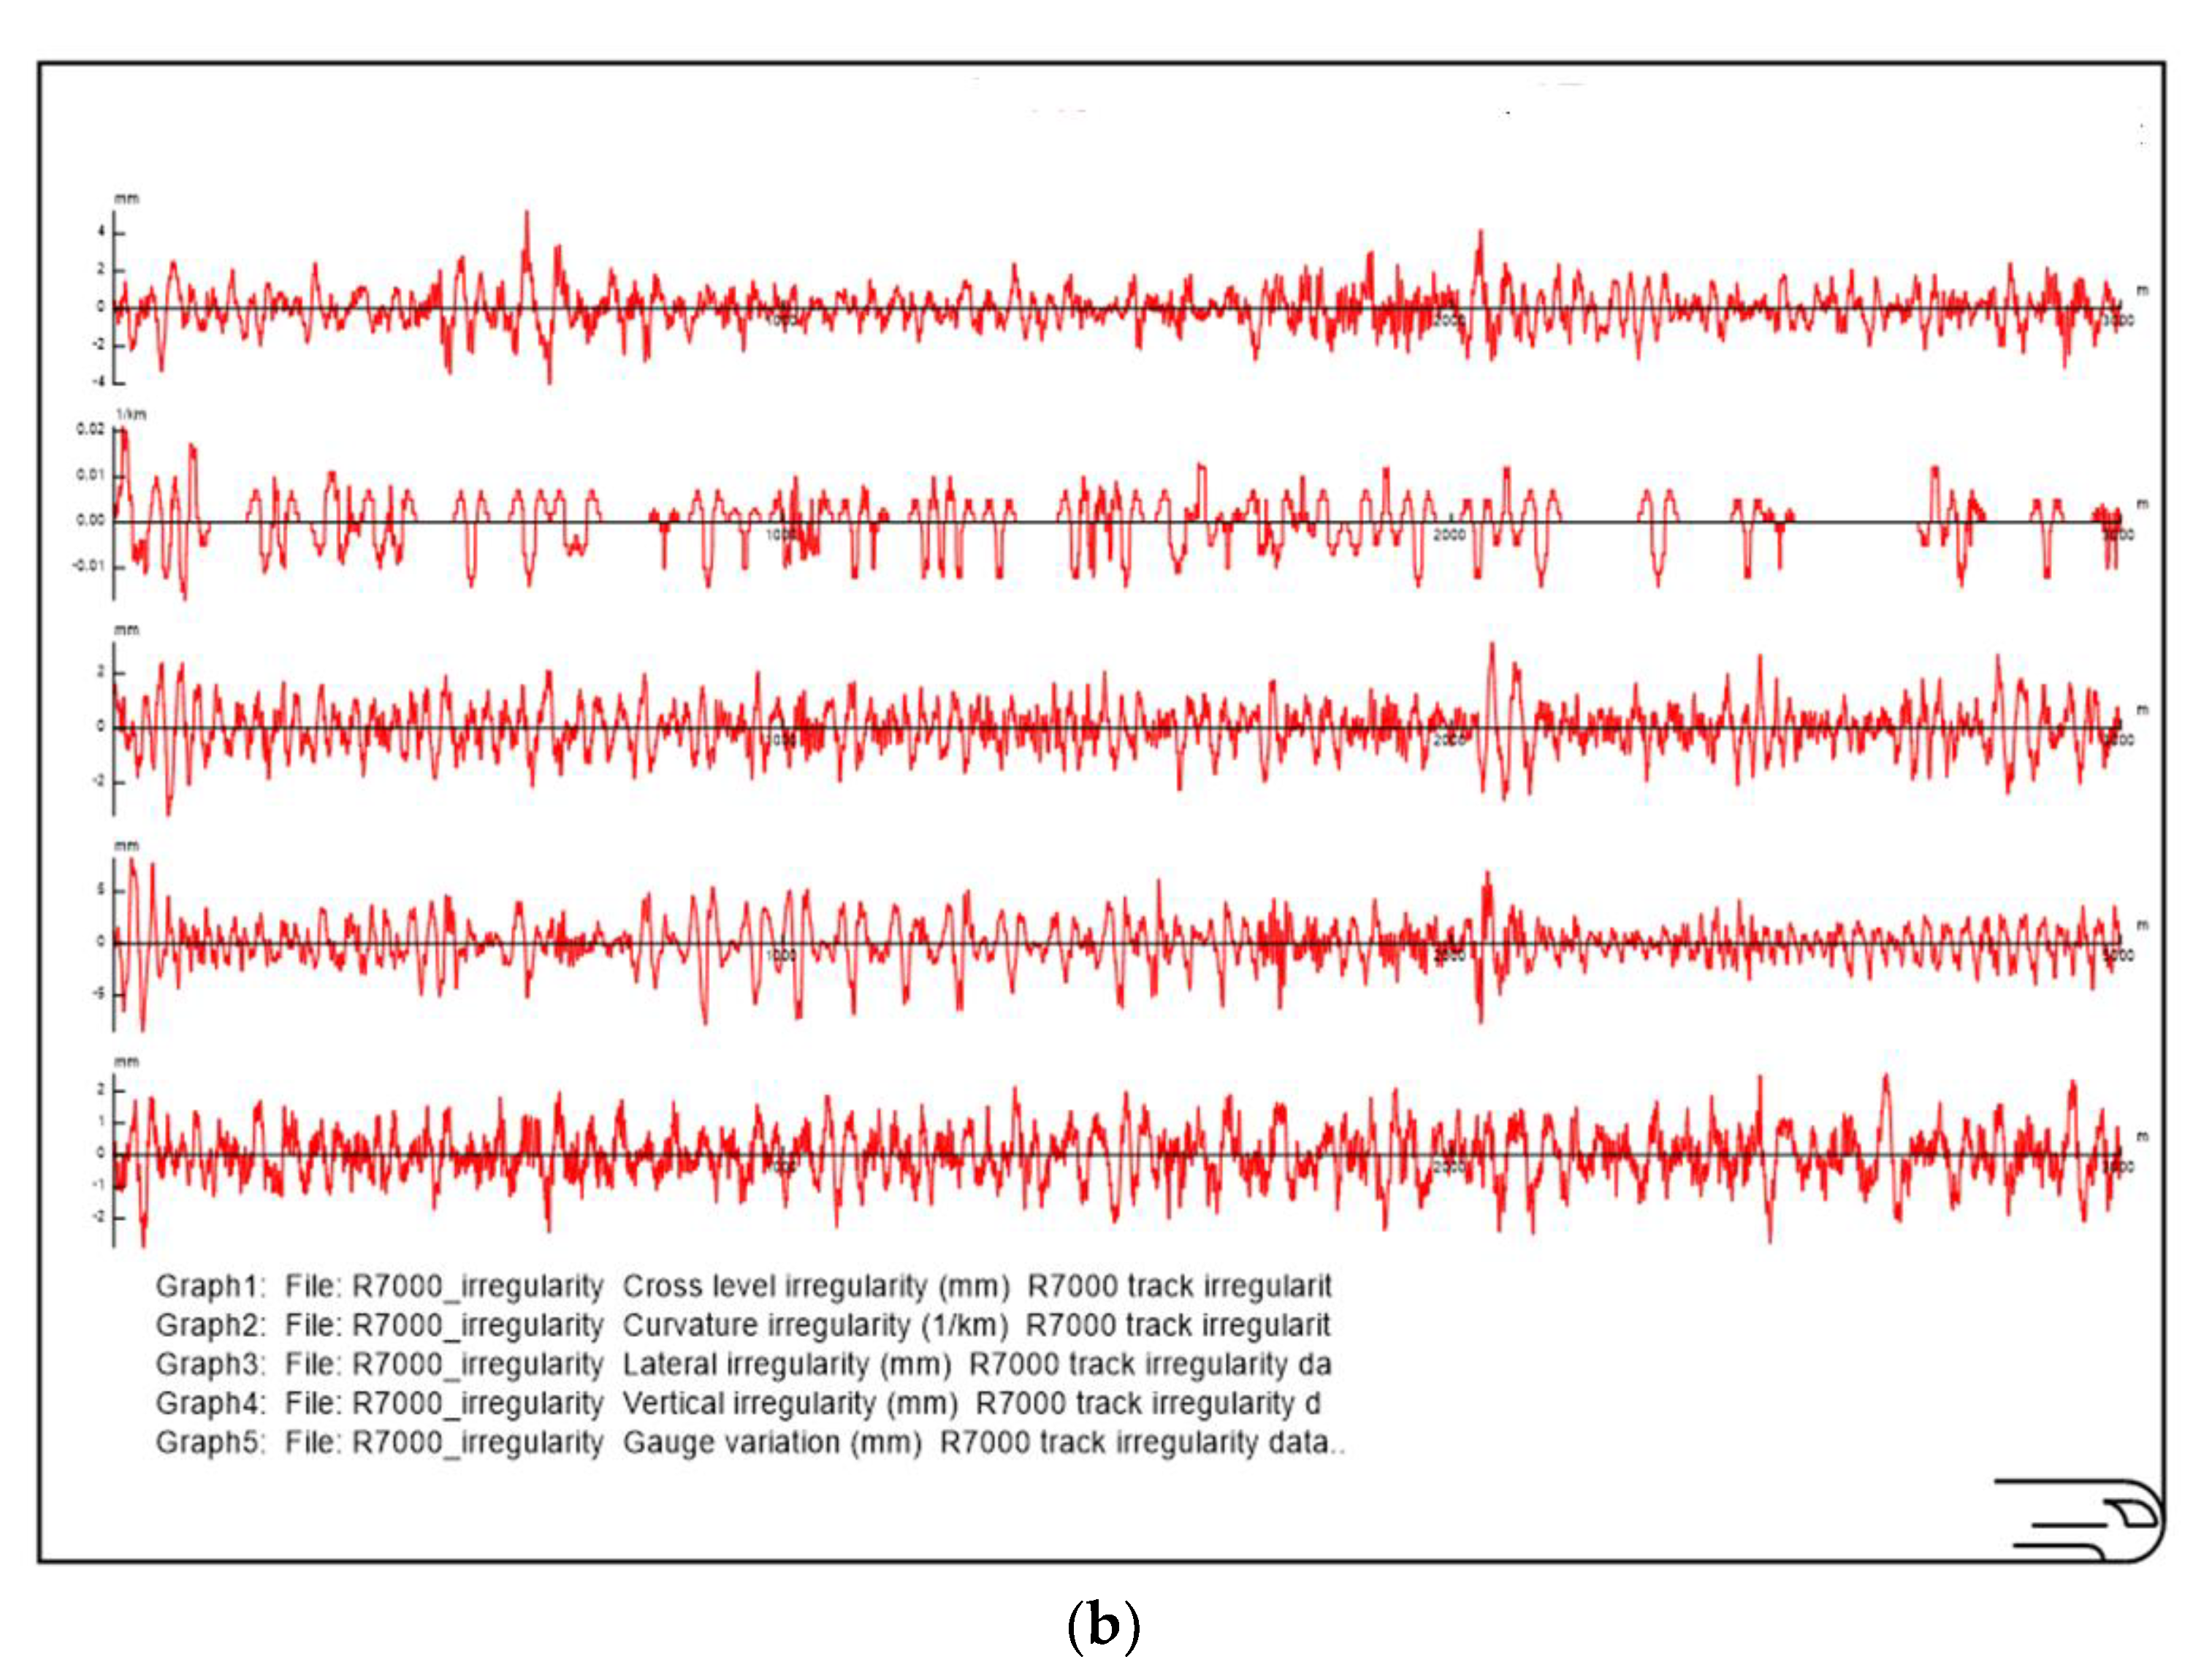
| Railway model data | Railway point (distance) | mm | O | - |
| Cross level irregularity (cant) | mm | O | - | |
| Curvature irregularity | 1/km | O | - | |
| Lateral irregularity | mm | O | - | |
| Vertical irregularity | mm | O | - | |
| Gauge variation | mm | O | - | |
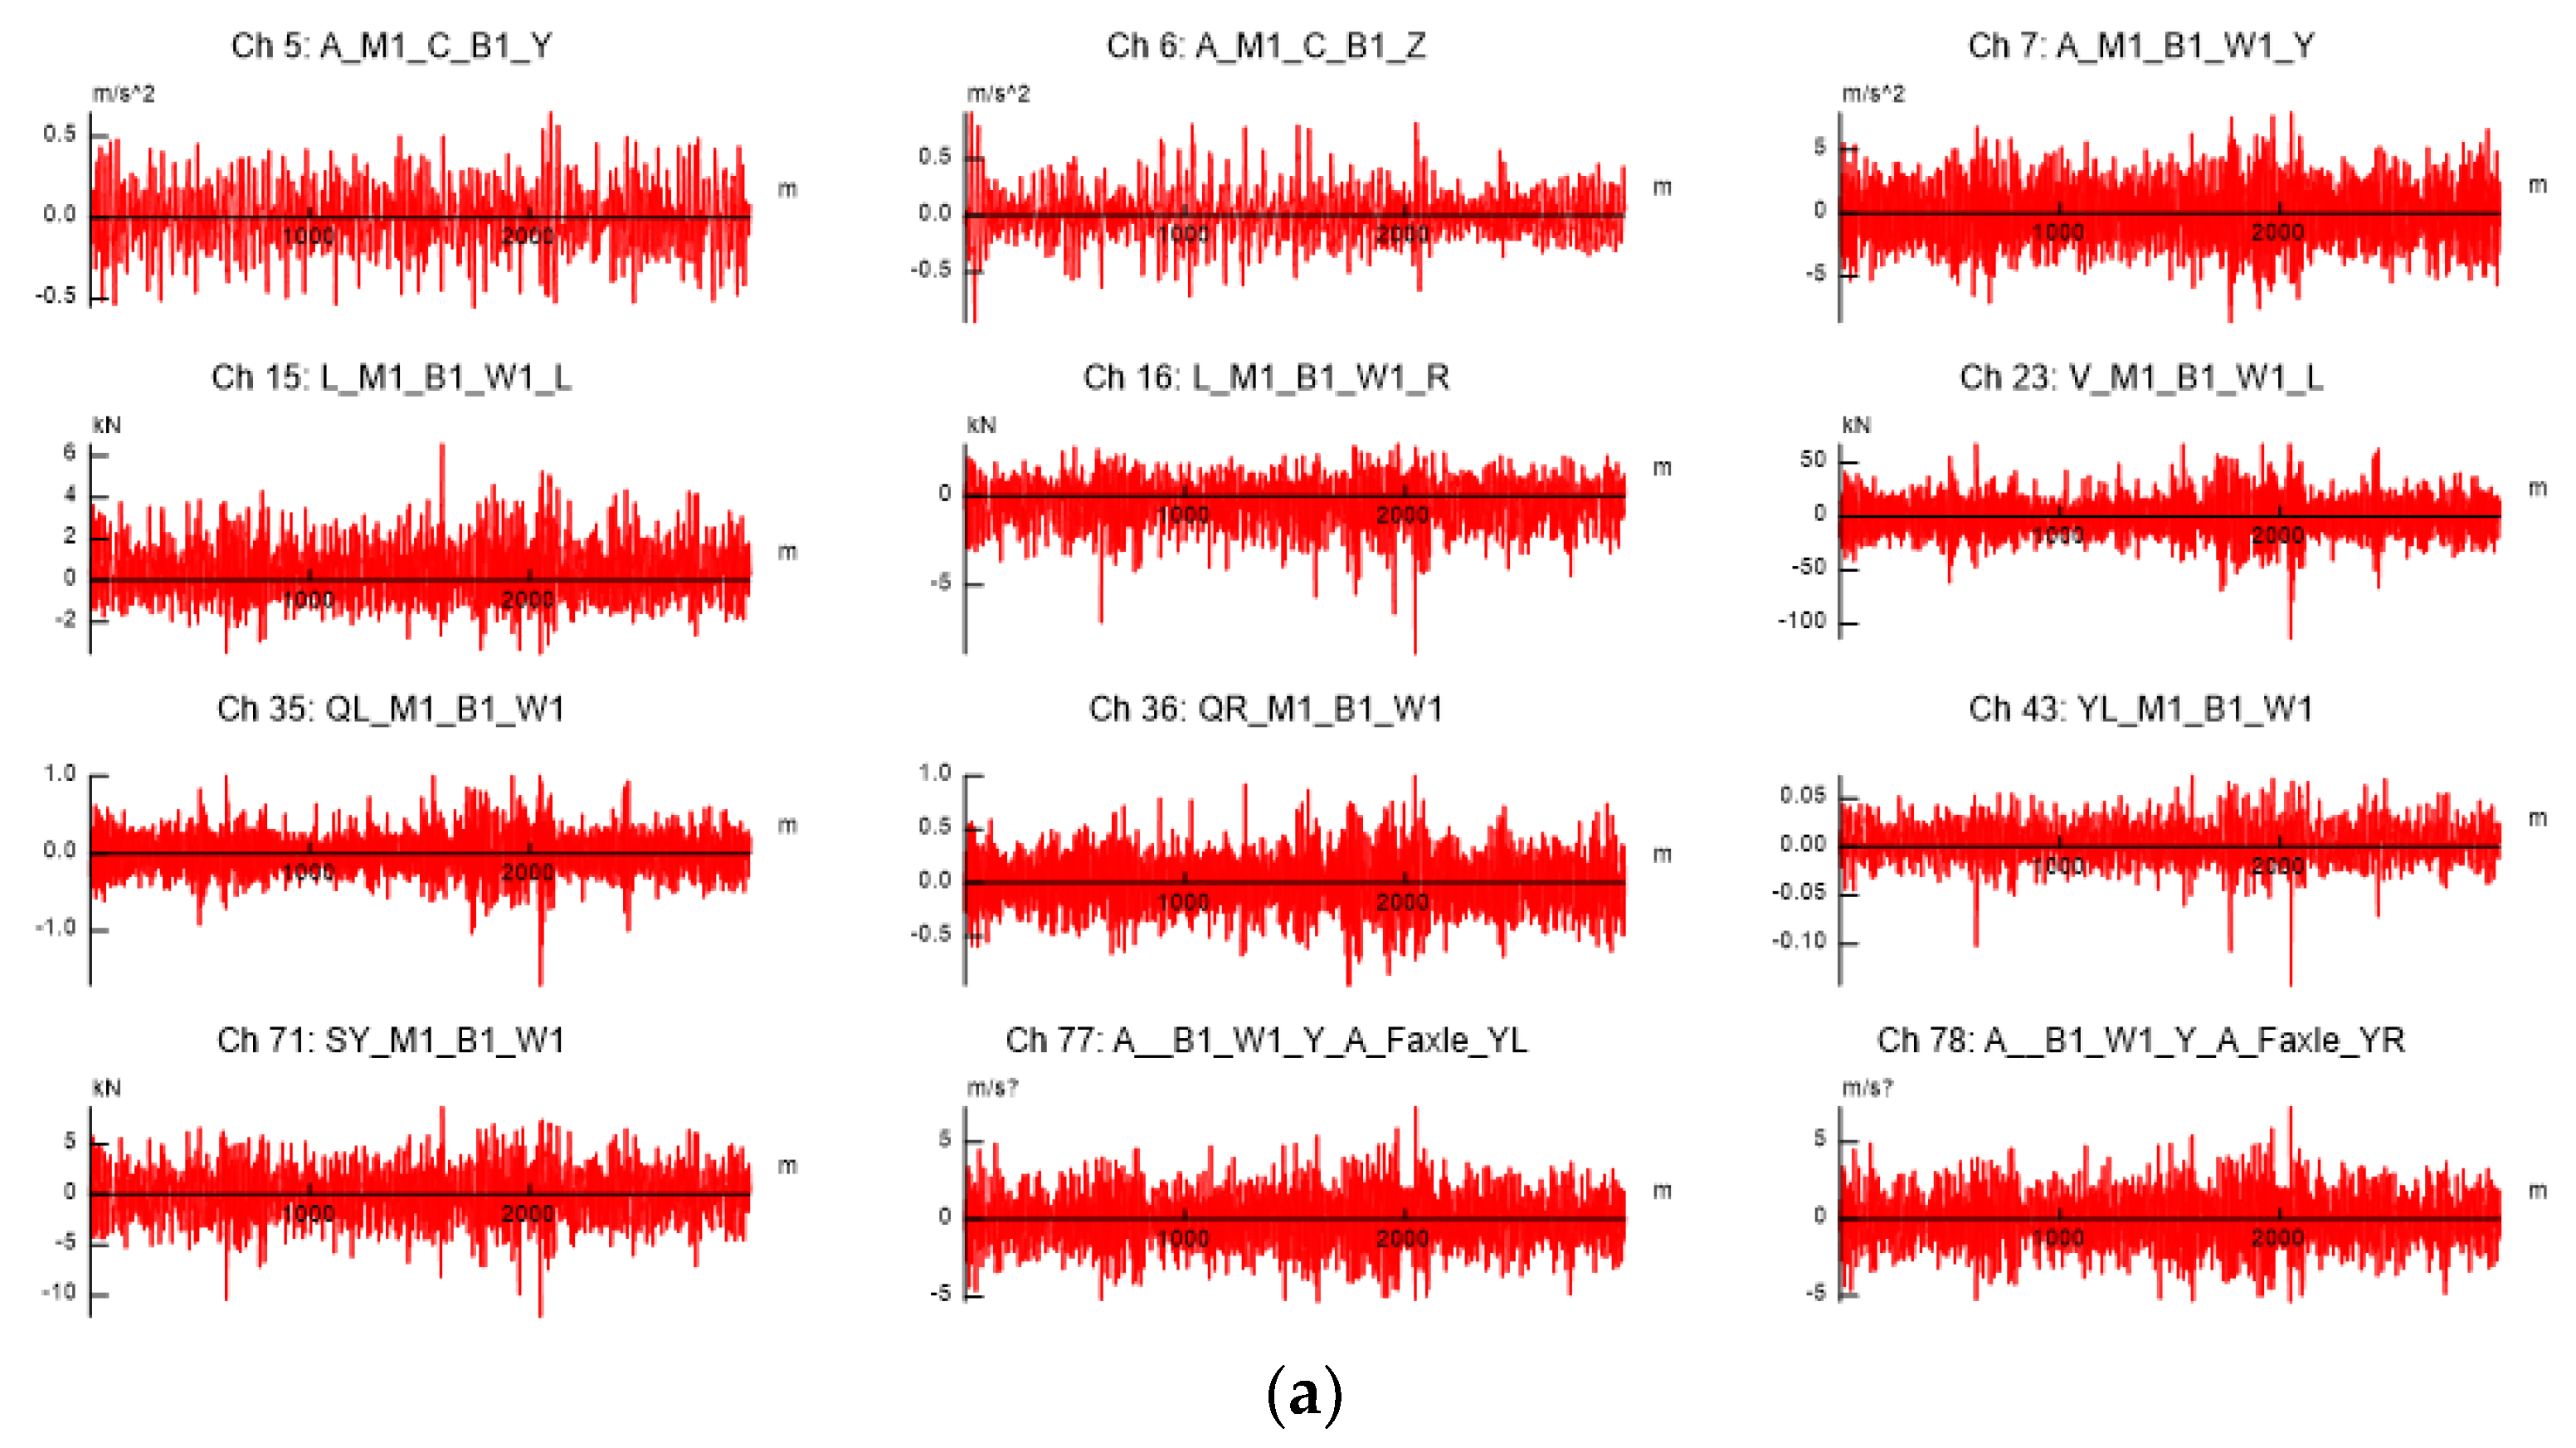
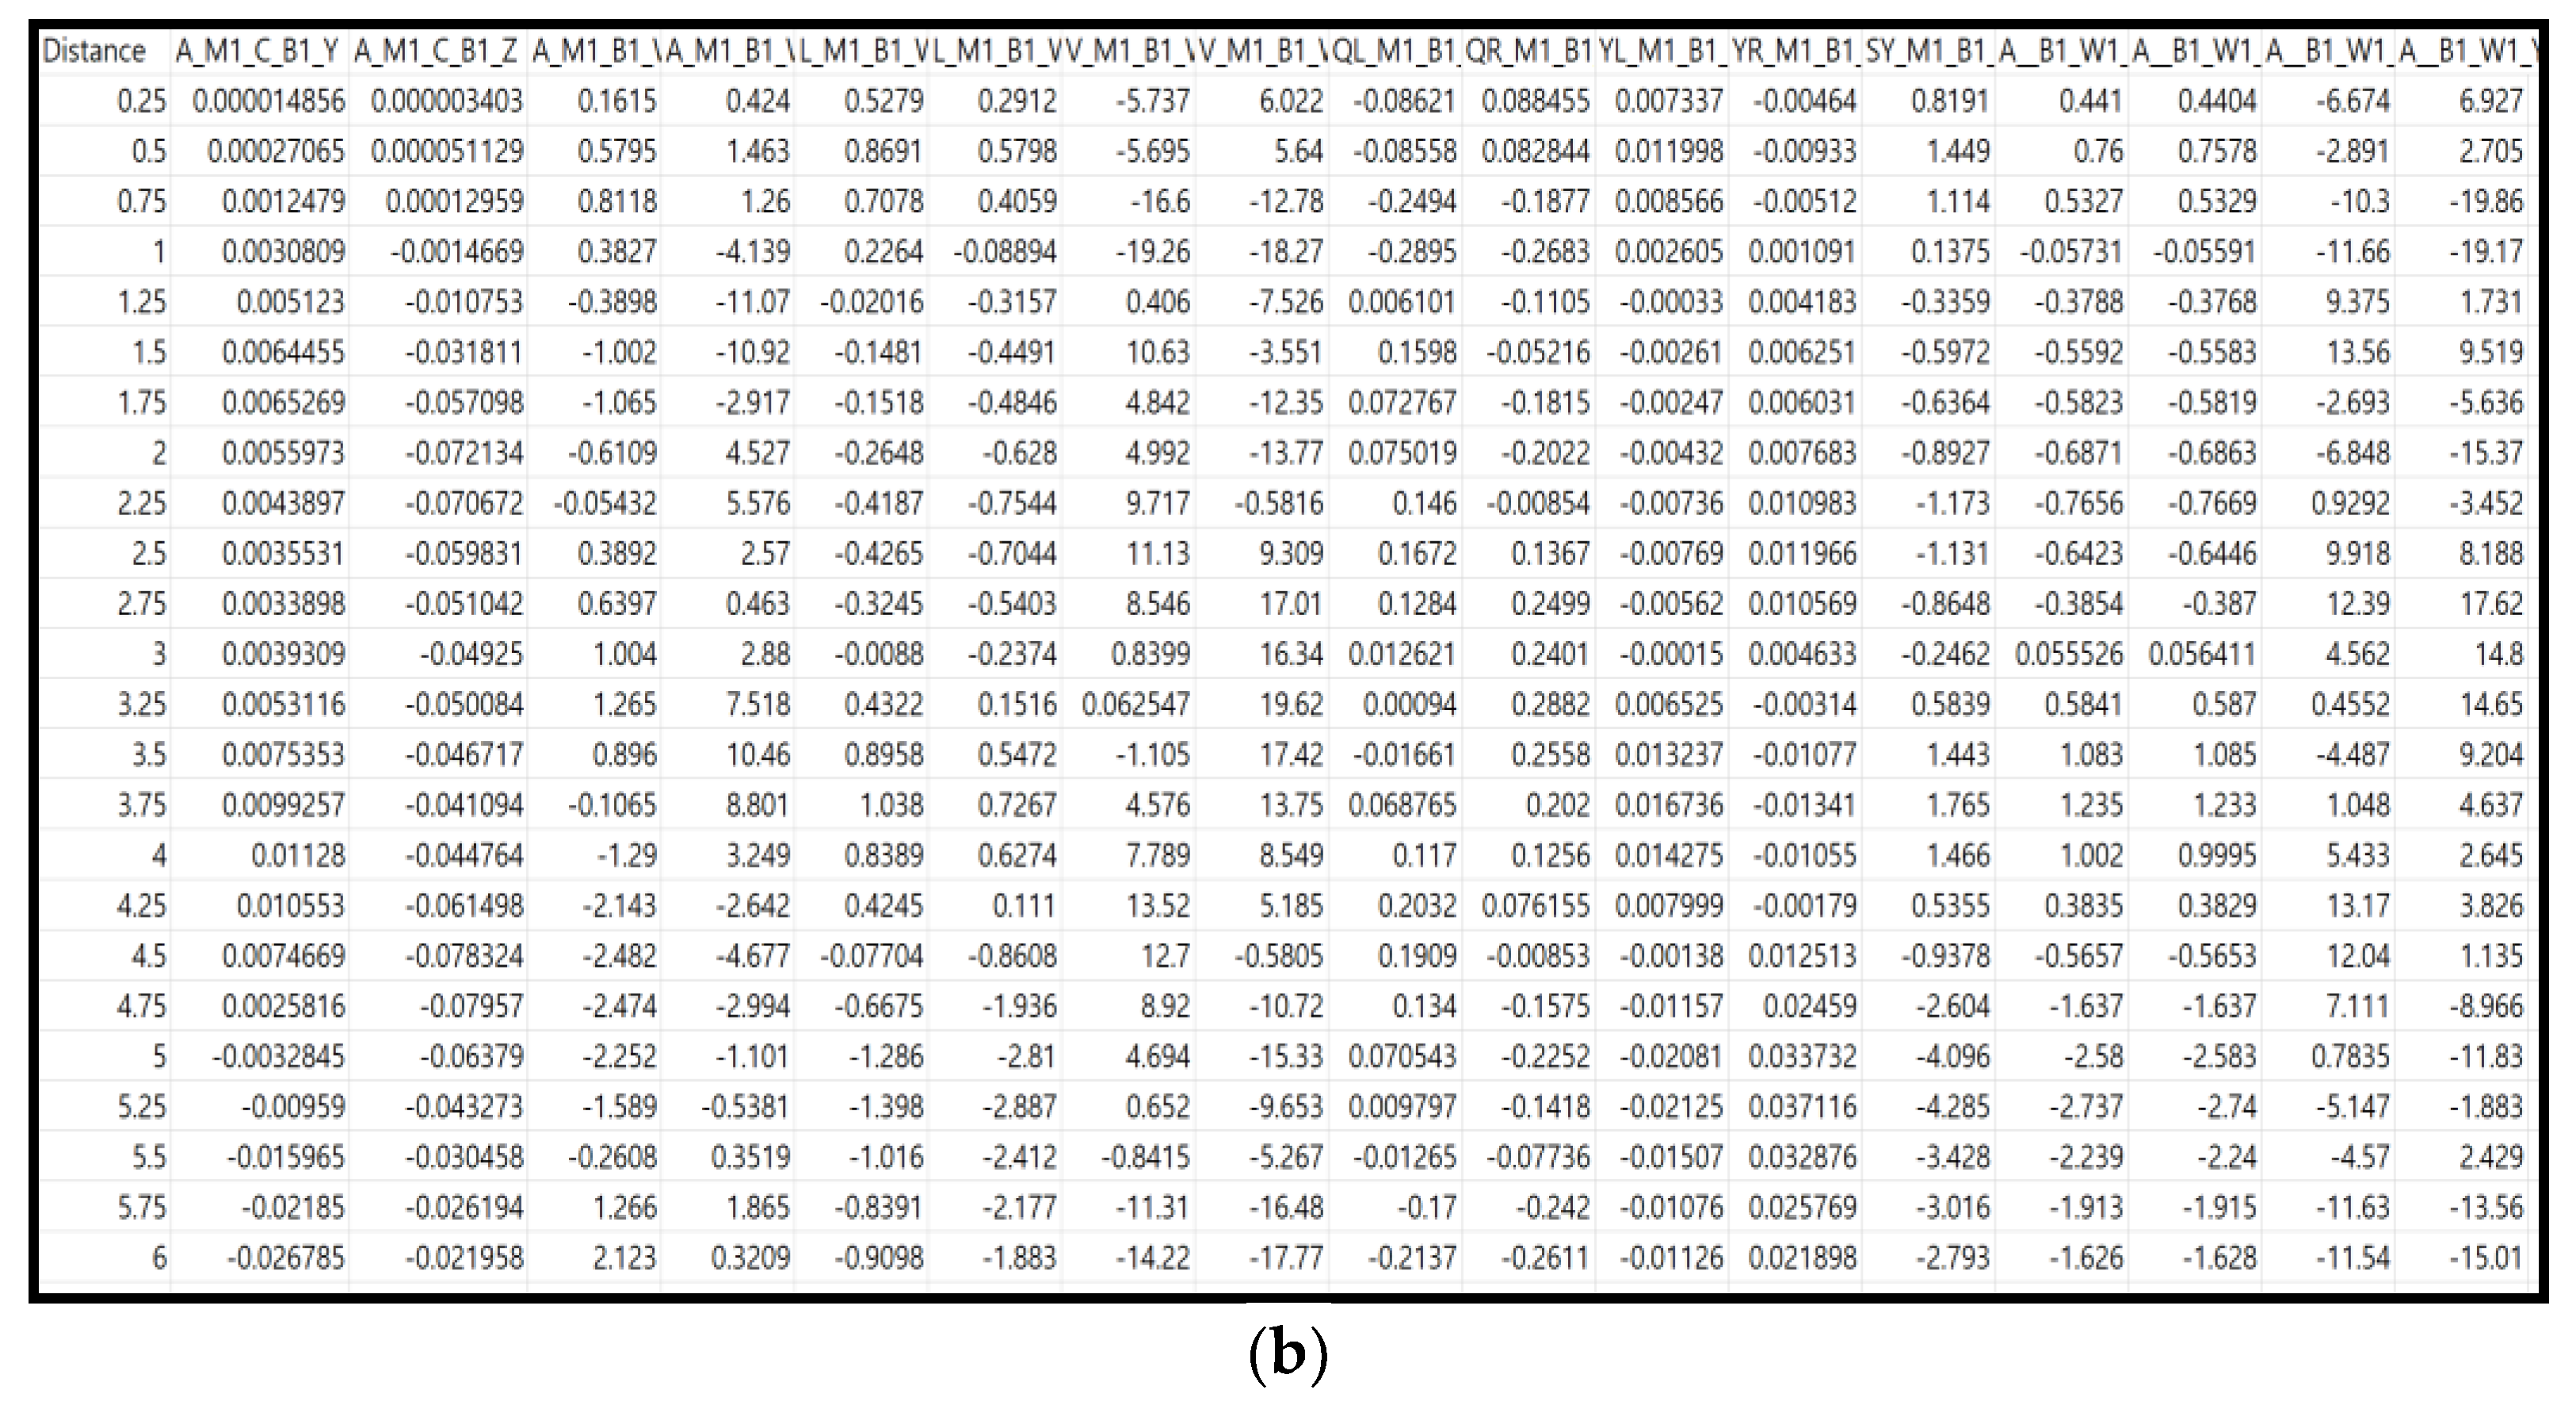
| Train structure/ simulation data | Bogie upper frame lateral vibration | - | O | |
| Bogie upper frame vertical vibration | - | O | ||
| Bogie upper body lateral vibration | - | O | ||
| Bogie upper body vertical vibration | - | O | ||
| Left wheel lateral weight | kg | - | O | |
| Right wheel lateral weight | kg | - | O | |
| Left wheel vertical weight | kg | - | O | |
| Right wheel vertical weight | kg | - | O | |
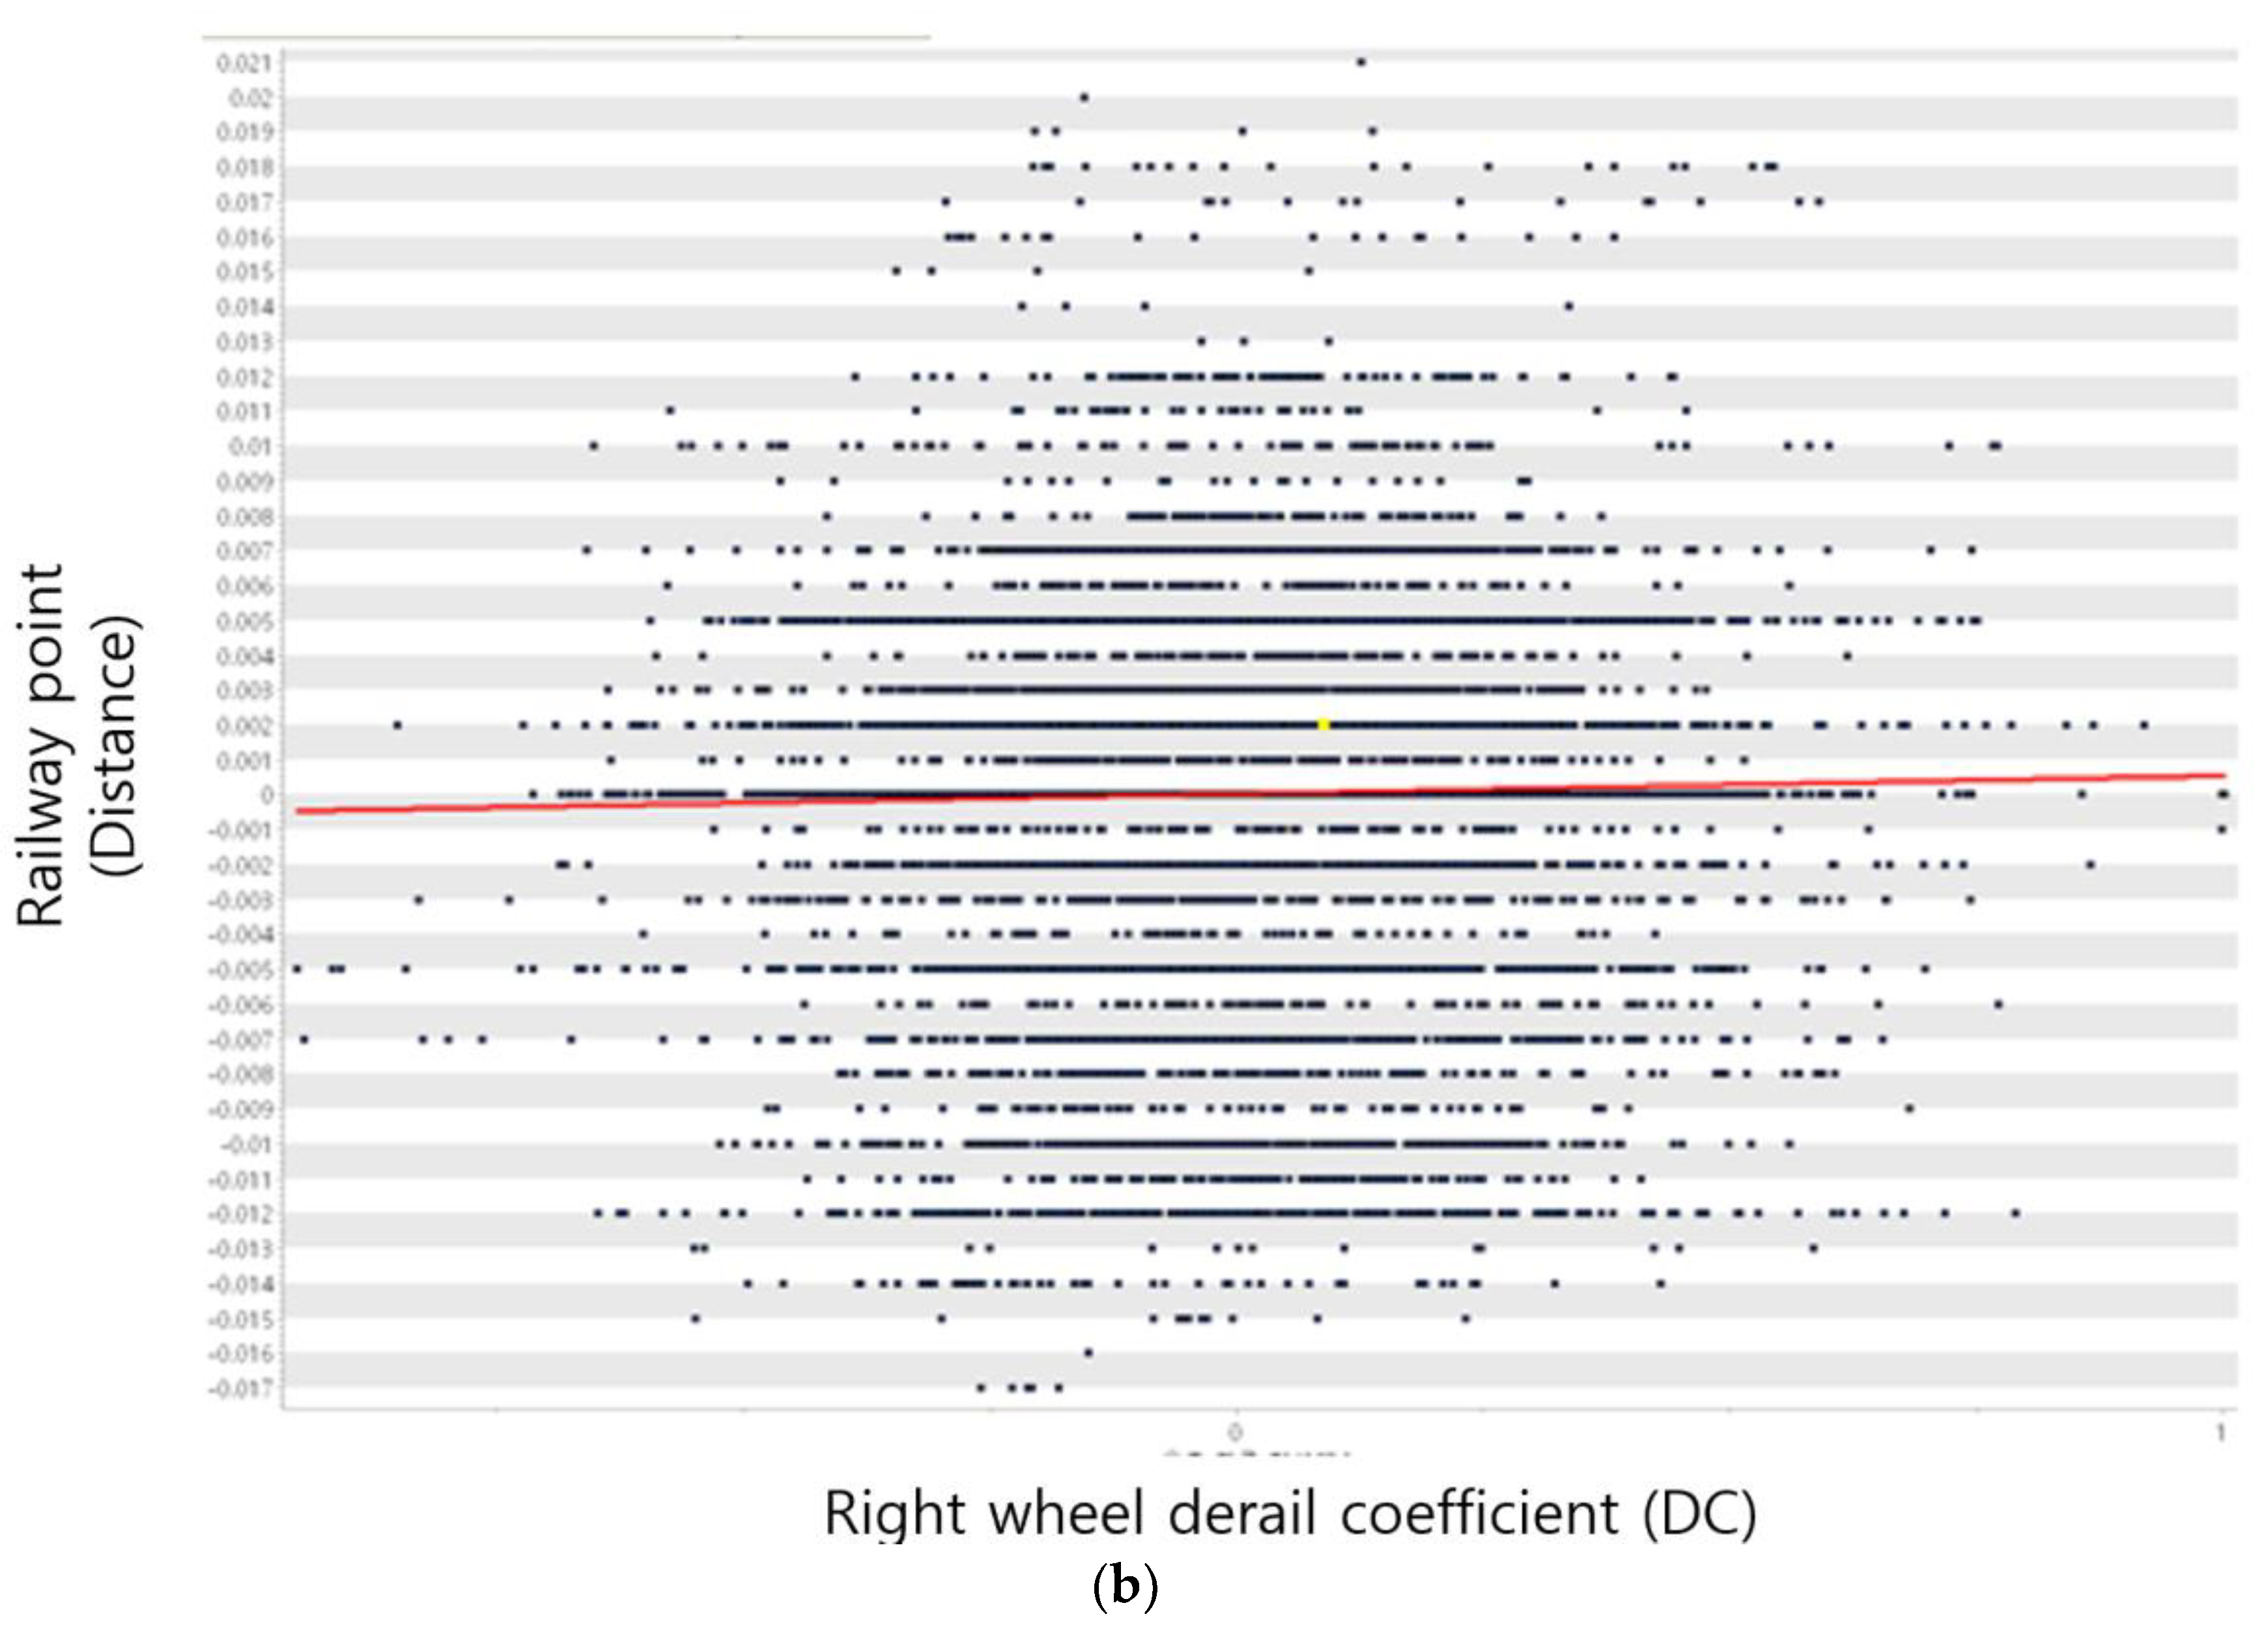
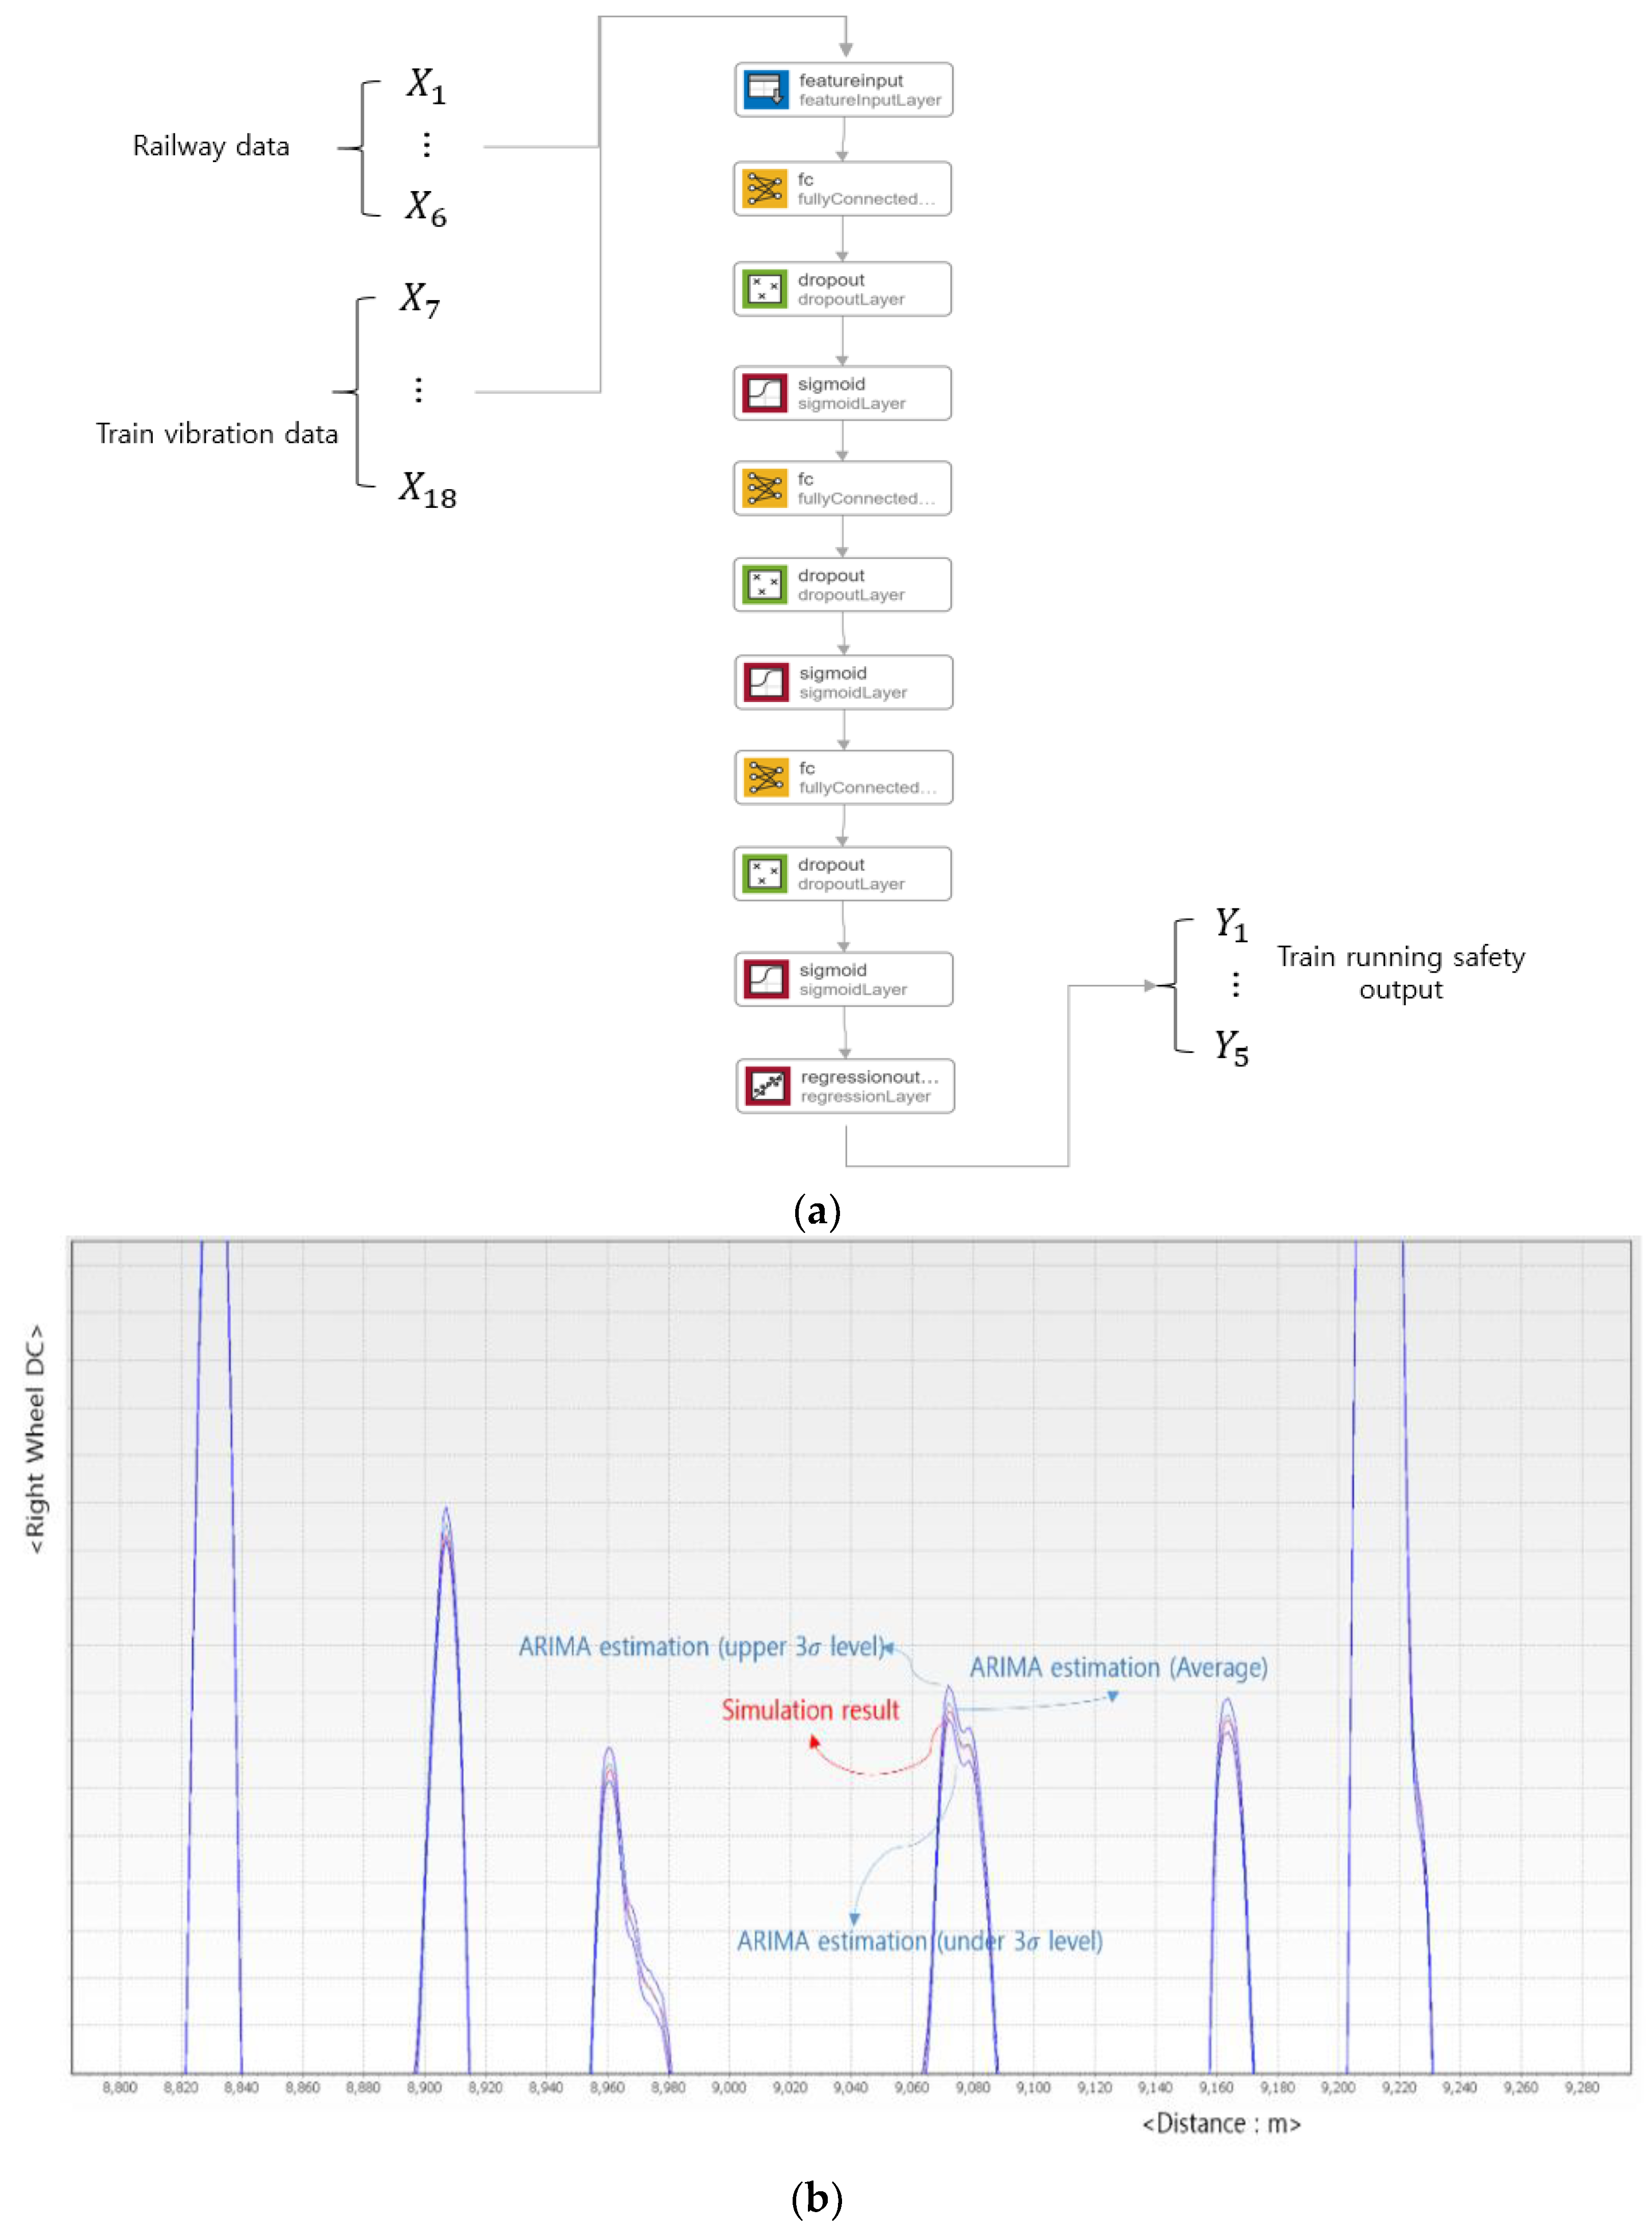
| Left wheel derail coefficient (DC) | Real number | - | O | |
| Right wheel derail coefficient (DC) | Real number | - | O | |
| Left wheel rate of load reduction (DV) | Real number | - | O | |
| Right wheel rate of load reduction (DV) | Real number | - | O | |
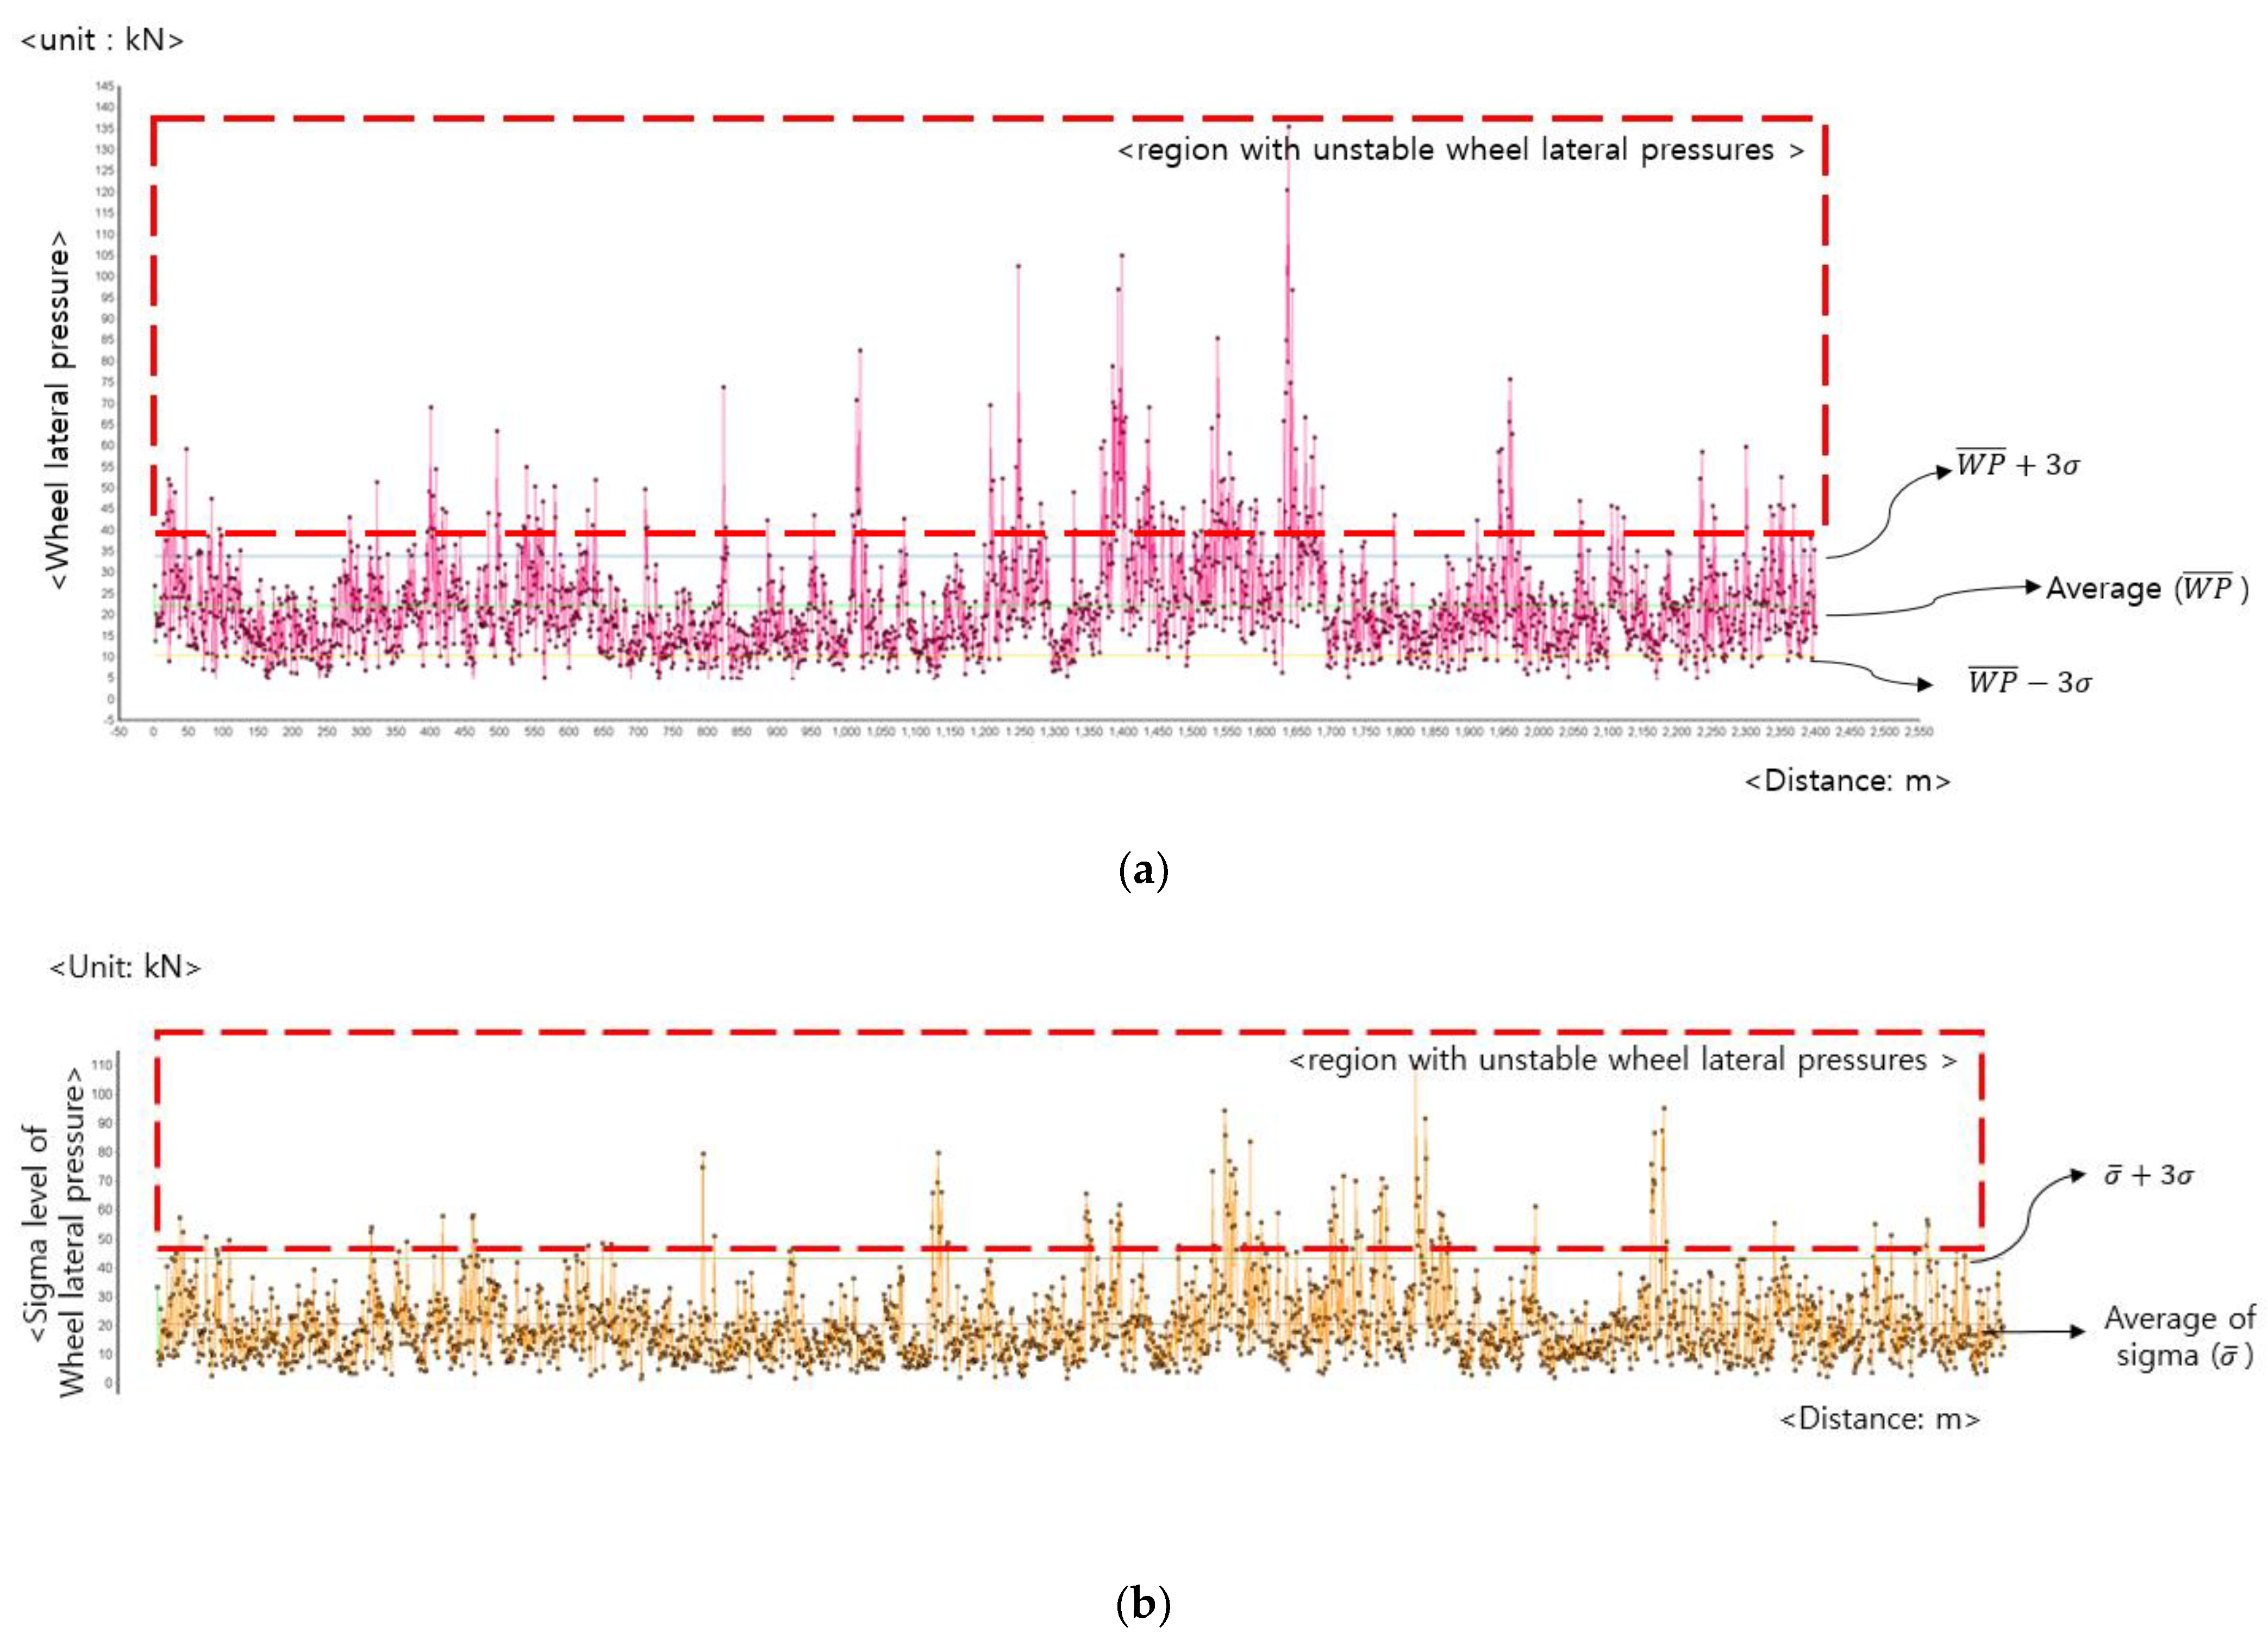
| Body frame lateral pressure (body frame lateral forces) | kN | - | O | |
| Left axle box lateral vibration | - | O | ||
| Right axle box lateral vibration | - | O | ||
| Left axle box vertical vibration | - | O | ||
| Right axle box vertical vibration | - | O | ||
| Wheel lateral pressure wheel lateral forces) | kN | - | O | |
| Attribute (Railway Model Parameters) | Relationships with Train Structure and Mechanism |
|---|---|
| Railway point (distance) | - Little relationship (r* < 0.01) |
| Cant | - Weak relationship: Left axle box vertical vibration - little relationship with the other factors |
| Curvature irregularity | - Little relationship (r* < 0.01) |
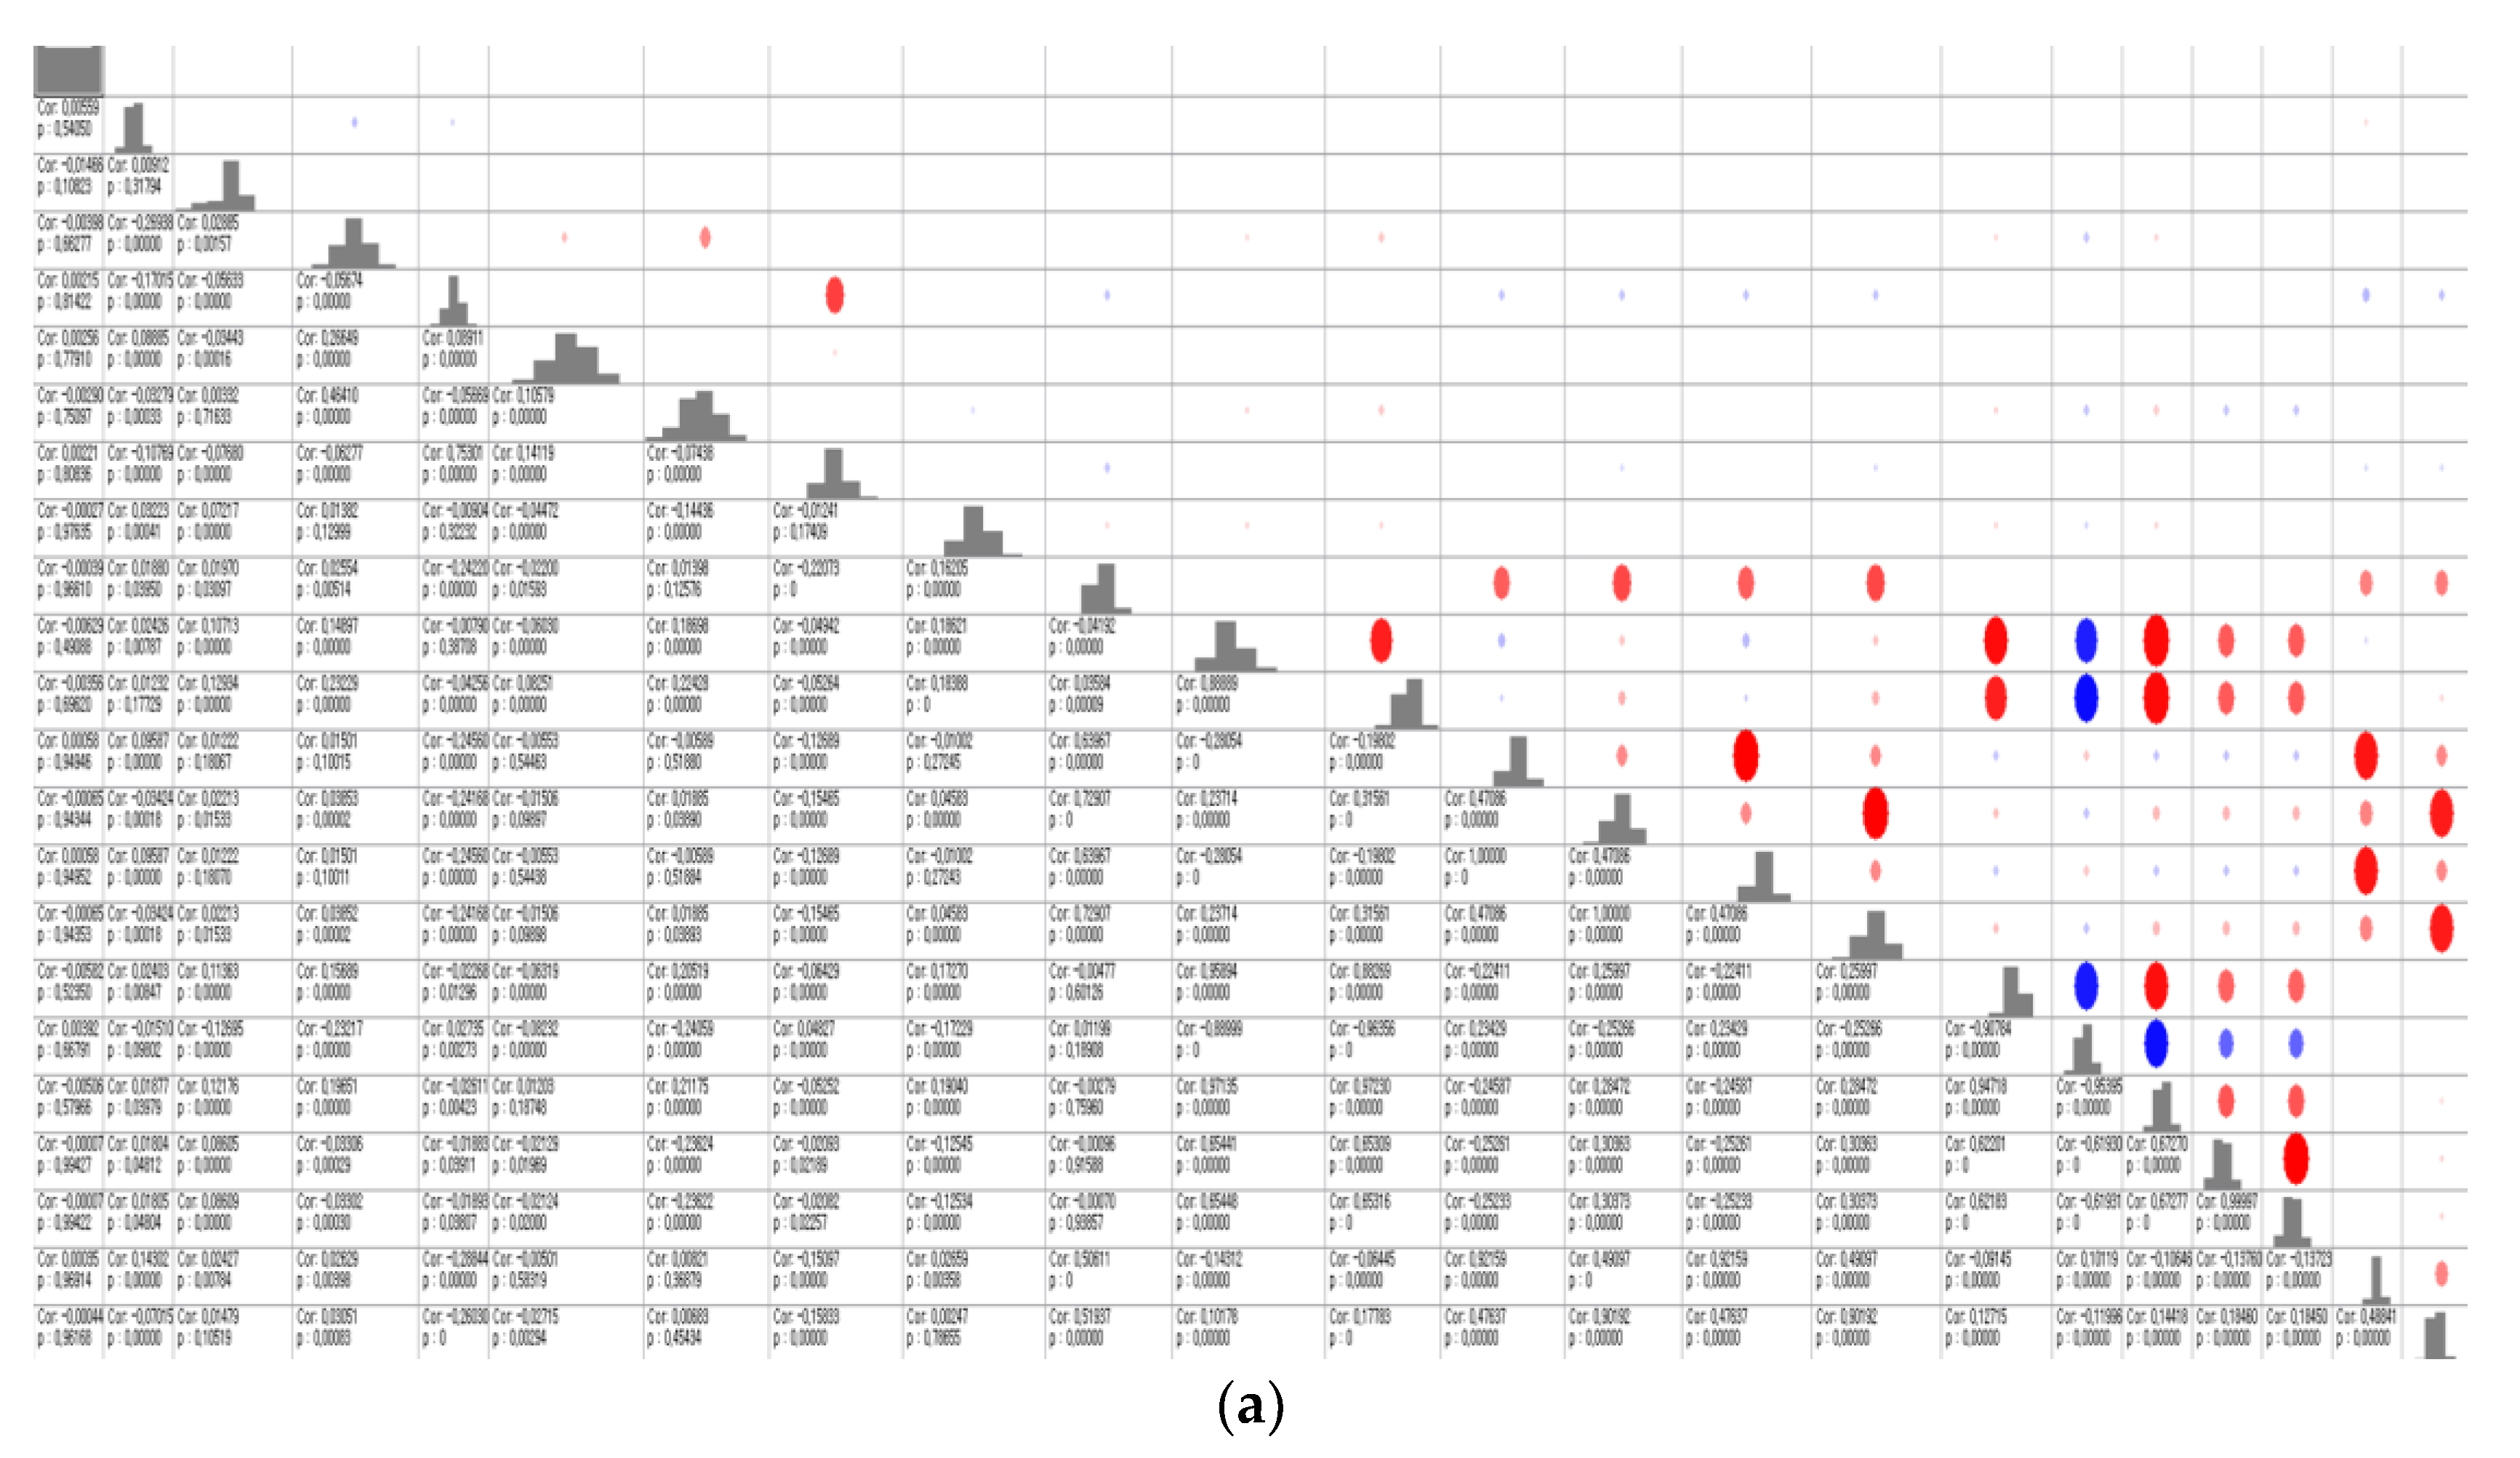
| Lateral irregularity | - Strong relationship: Bogie upper frame lateral vibration - Weak relationship: Right wheel lateral weight, Right wheel DV, wheel lateral pressure - little relationship with the other factors |
| Vertical irregularity | - Strong relationship: Bogie upper frame vertical vibration - Weak relationship: Left/right wheel vertical weight, Left/right wheel DC, Left/right axle box vertical vibration - little relationship with the other factors |
| Gauge variation | - Weak relationship: Wheel lateral pressure - little relationship with the other factors |
| Classification | A DNN without Recurrent Data | The Proposed Hybrid Network |
|---|---|---|
| Input | , | |
| Output | ||
| Layer architecture | 4 hidden layers Number of hidden nodes in each hidden layer = {40,30,15,5} | 4 hidden layers Number of hidden nodes in each hidden layer = {50,30,15,5} |
| Activation functions | Sigmoid/ReLU Sigmoid: RelU: max(0,x) | |
| Learning parameters | Epoch = 5000/optimization method = ADAM () = 0.001 Dropout rate = 0.2 | |
Publisher’s Note: MDPI stays neutral with regard to jurisdictional claims in published maps and institutional affiliations. |
© 2021 by the authors. Licensee MDPI, Basel, Switzerland. This article is an open access article distributed under the terms and conditions of the Creative Commons Attribution (CC BY) license (https://creativecommons.org/licenses/by/4.0/).
Share and Cite
Lee, H.; Han, S.-Y.; Park, K.; Lee, H.; Kwon, T. Real-Time Hybrid Deep Learning-Based Train Running Safety Prediction Framework of Railway Vehicle. Machines 2021, 9, 130. https://doi.org/10.3390/machines9070130
Lee H, Han S-Y, Park K, Lee H, Kwon T. Real-Time Hybrid Deep Learning-Based Train Running Safety Prediction Framework of Railway Vehicle. Machines. 2021; 9(7):130. https://doi.org/10.3390/machines9070130
Chicago/Turabian StyleLee, Hyunsoo, Seok-Youn Han, Keejun Park, Hoyoung Lee, and Taesoo Kwon. 2021. "Real-Time Hybrid Deep Learning-Based Train Running Safety Prediction Framework of Railway Vehicle" Machines 9, no. 7: 130. https://doi.org/10.3390/machines9070130
APA StyleLee, H., Han, S.-Y., Park, K., Lee, H., & Kwon, T. (2021). Real-Time Hybrid Deep Learning-Based Train Running Safety Prediction Framework of Railway Vehicle. Machines, 9(7), 130. https://doi.org/10.3390/machines9070130