Abstract
Freezing–thawing action has a great impact on the physical and mechanical deterioration processes of rock materials in cold areas where environmental changes are very complicated. The direct shear test under unloading normal stress was adopted to investigate the shear mechanical behavior of sandstone samples after a freezing–thawing cycle in this paper. The failure shear displacement (Dsf), the failure normal displacement (Dnf), the shear displacement of unloading (Dsu), and the normal displacement of unloading (Dnu) were analyzed to describe the evolution of shear and normal deformation during the test. The results indicated that the shear displacement increased as the freezing–thawing cycle duration increased in a direct shear test under unloading normal stress. The unloading rate and the number of freezing–thawing cycles affected the failure pattern of the rock sample significantly in both the direct shear test under unloading normal stress and the direct shear test. The three-dimensional inclination angle, the distortion coefficient, and the roughness correlation coefficient of the fracture surface are dependent on the number of freezing–thawing cycles and the unloading rate. The surface average gradient mode of the fracture surface decreased as the freezing–thawing cycle times and unloading rate rose.
1. Introduction
Freezing–thawing (F-T) action has a great impact on the physical and mechanical deterioration processes of rock materials in cold regions. The extraction of oil and the construction of transportation facilities (e.g., extracting natural gas—resource exploitation and construction, new roads and culverts) are faced with many problems of geotechnical engineering in cold regions. For example, frost heaving cracking the surrounding rock of a tunnel, instability of a support structure [1,2,3,4], weathering and denudation of rocky slopes, instability of a high-risk rock mass, rock cavity frost heaving of a liquefied natural gas reservoir, and freeze–thaw weathering of rock relics in cold regions, affect the safety of engineering [5,6,7,8,9,10]. Therefore, it is of great significance to deeply understand the mechanism and evolution law of freezing–thawing damage to rock [11,12,13,14,15].
Many experiments have been carried out to study the effects of freezing–thawing cycles on the physical/mechanical properties of rock [16,17,18,19,20,21]. The investigated properties include density, porosity, P-wave velocity, point load strength, elastic modulus, Poisson’s ratio, and uniaxial compression strength (UCS). These studies were mainly carried out in the context of static or quasi-static loading conditions [22,23,24,25,26,27,28,29,30]. Most tri-axial unloading tests were used to study the influences of the unloading path on rock deformation, strength, and energy evolution after a freezing–thawing cycle [31,32,33,34,35,36,37,38]. However, the tri-axial unloading test cannot directly and effectively simulate the shear failure mechanism of rock that has suffered only from unloading normal stress. Therefore, it is necessary to understand the shear mechanical behavior of rocks under unloading normal stress.
Importantly, shear failure of rock mass induced by unloading normal stress is particularly prominent in many geotechnical engineering disasters. In a direct shear test, an expected constant normal stress is first applied, and then the shear stress is continuously loaded until the rock sample fails [39,40,41,42,43,44,45,46]. However, a direct shear test cannot show the shear failure of rock when the normal stress is removed, because the normal stress of the whole direct shear test remains unchanged [47,48,49,50,51]. Therefore, an innovative experimental method was proposed and direct shear tests under unloading normal stress (DSTUNS) were carried out to reveal the shear mechanical behavior of sandstone. However, few systematic studies have focused on the direct shear tests under unloading normal stress (DSTUNS) for rocks that were subjected to freeze–thaw cycles [52,53,54,55,56,57]. Thus, the shear failure caused by unloading normal stress is also an important failure mode of rock.
In this study, there were a total of six test groups, corresponding to treatments of freeze–thaw weathering with different numbers of cycles: 0 (no treatment), 10, 20, 30, 40, and 50. The normal stress on a sample after the freezing–thawing cycles was unloaded at a rate of 1, 2, 3, or 4 MPa/min. Direct shear tests under unloading normal stress (DSTUNS) were carried out on the DSZ-1000 electro-hydraulic servo rock triaxial shear permeability testing machine produced by Sichuan Dexiang technology and innovation company. The shear displacement, normal displacement, failure pattern, and fracture surface roughness were systematically studied for sandstone samples exposed to the freezing–thawing cycle in the DSTUNS.
2. Materials and Experimental Methods
2.1. Specimen Preparation
Samples were collected from Wuding County of Yunnan province. According to the rock identification report, samples were yellow and block-like fine sand, and the main component of the debris was quartz. SEM analysis showed that the samples had a fine-grain structure. X-ray analysis showed that the main components of the samples were quartz (62%), feldspar (22%), calcite (9%), and kaolinite (7%). The samples of fine-grained sandstone taken by the rock core sampler were shaped as cubes at both ends: The collected samples needed to be cut into cubes of a suitable height at both ends by a rock cutting machine, and then processed into samples according to international rock mechanics standards. Samples were processed to produce the standard cubes. The parallelism and the flatness of the end faces were within ±0.05 and ±0.02 mm, respectively. Samples were dried in the drying box 105 °C for 24 h. Standard cube samples measuring approximately 50 mm wide × 50 mm long × 50 mm thick were selected for the DSTUNS.
2.2. Freeze–Thaw Cycle Test
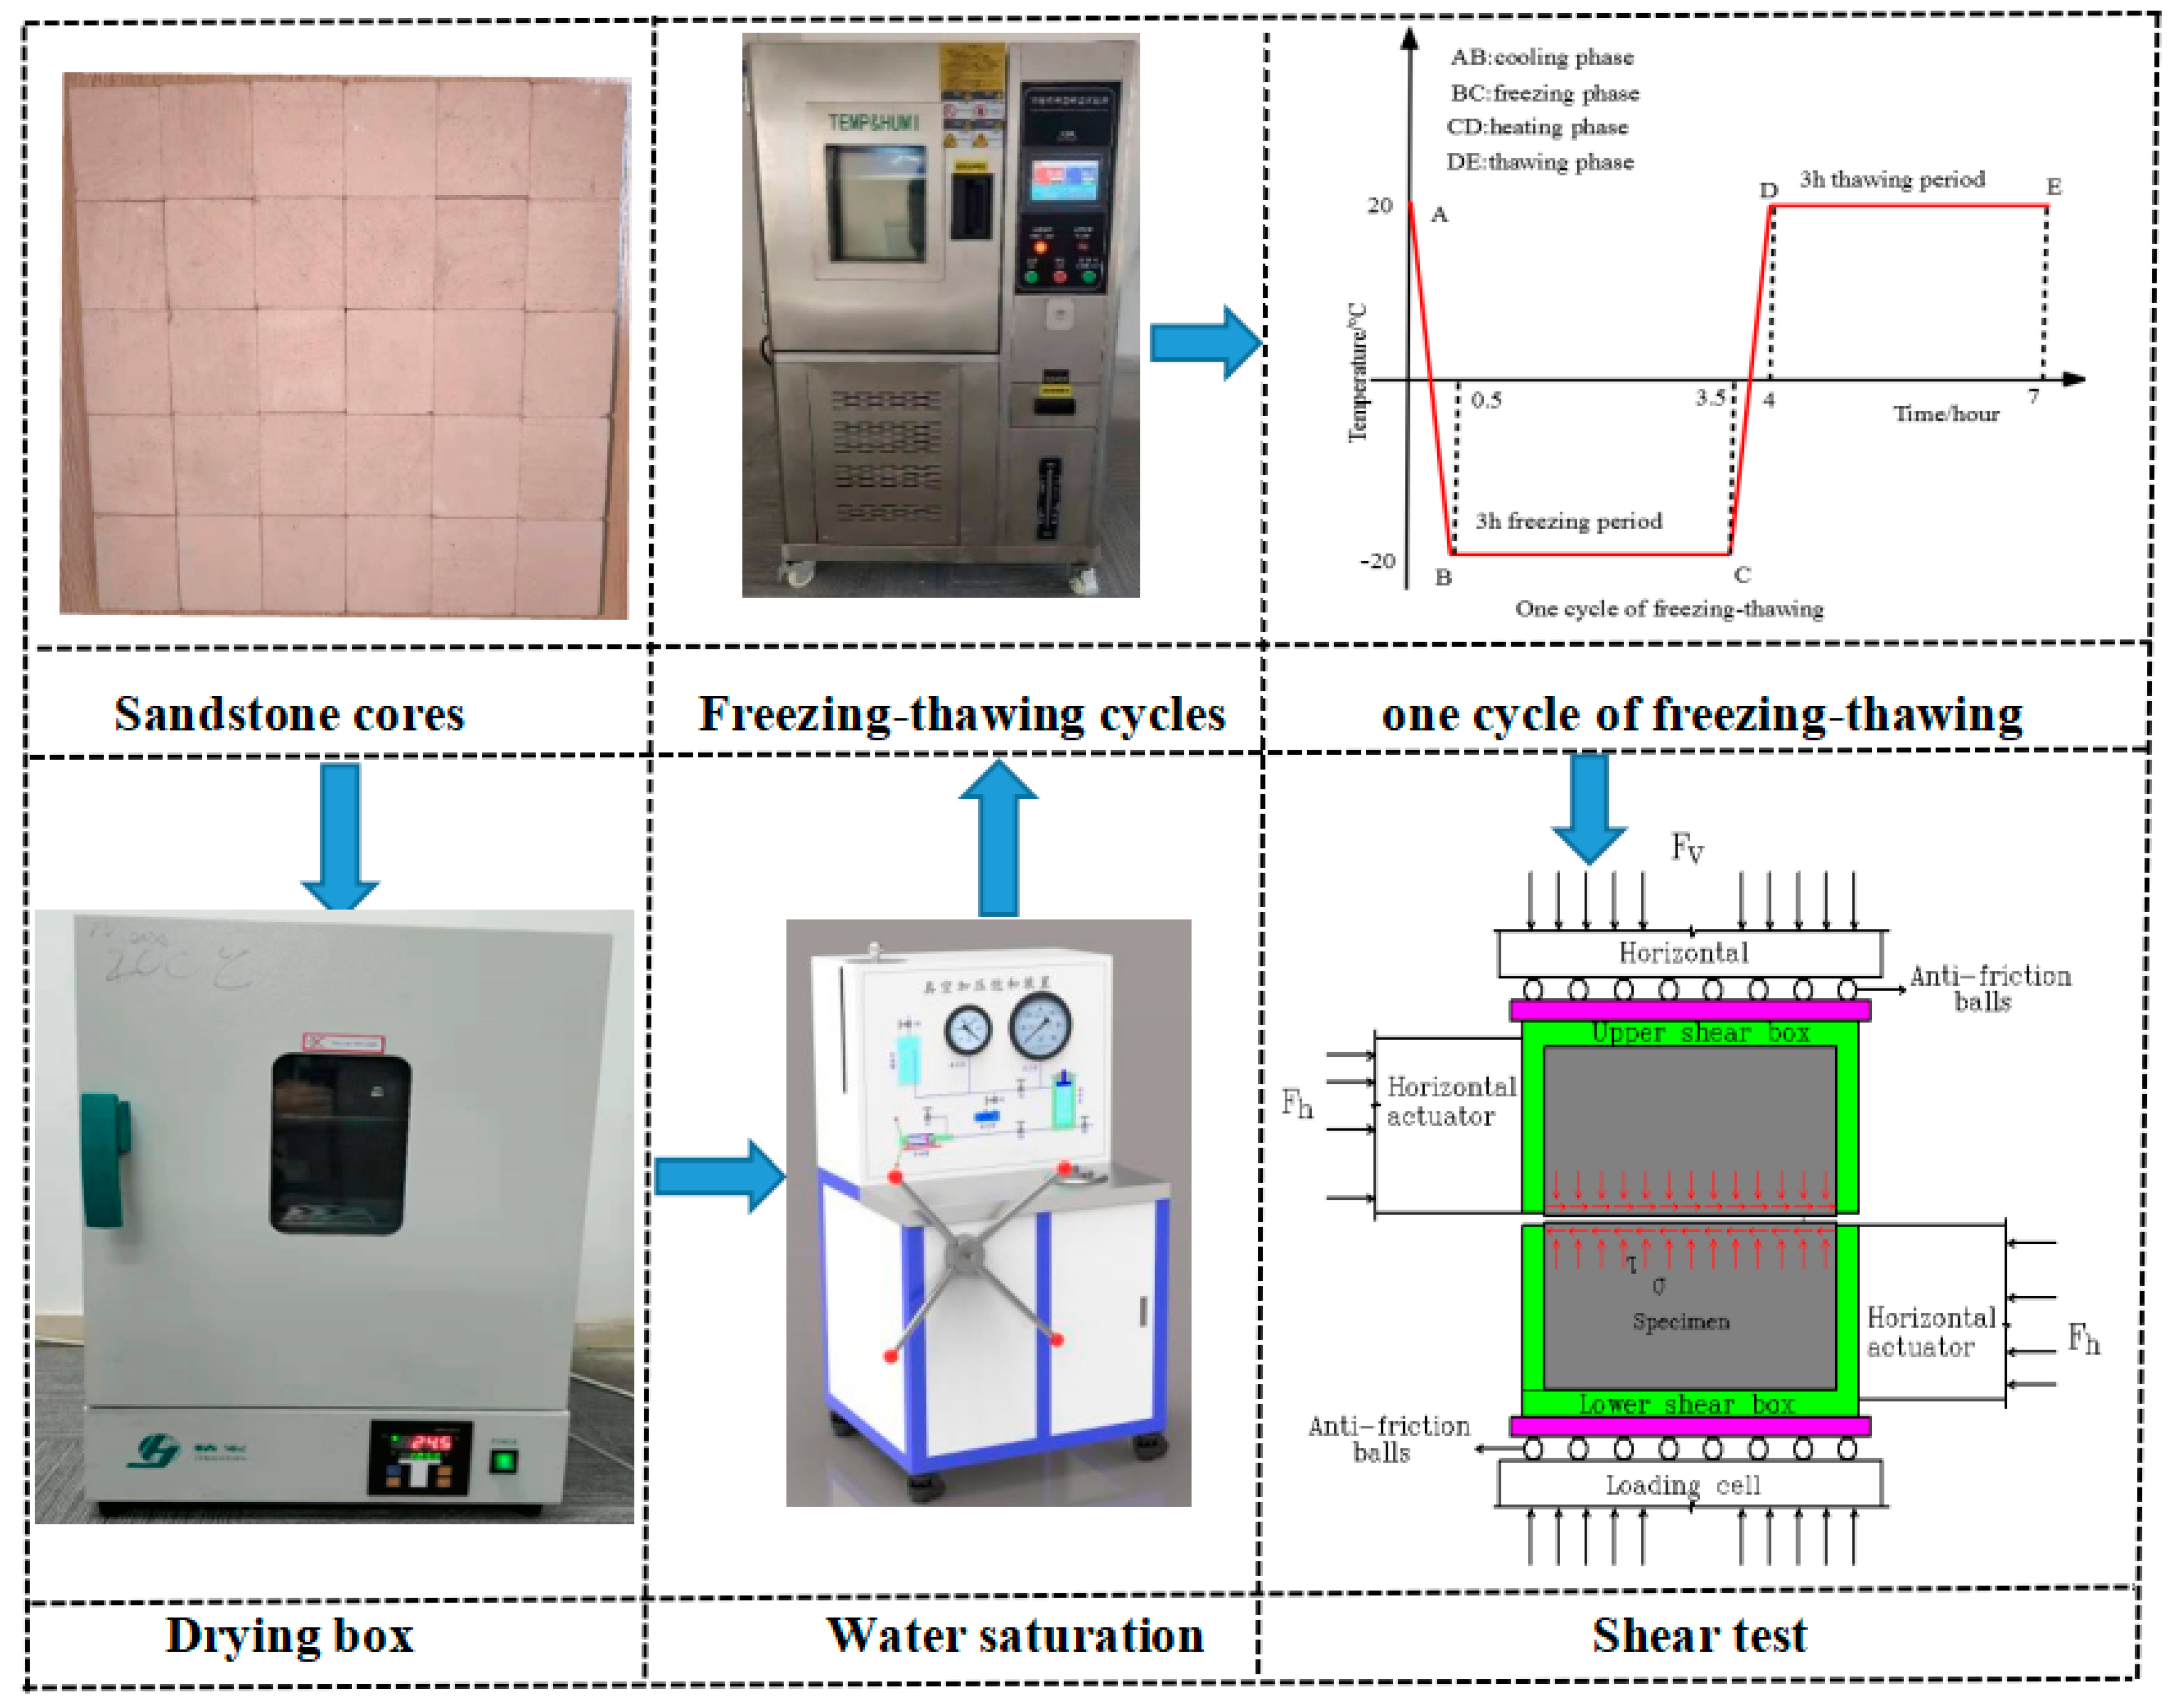
The freezing–thawing cycle tests were performed in a programmable constant temperature and humidity test chamber with a minimum temperature of −90 °C, a maximum temperature of 200 °C, and accuracy of ±0.2 °C (Figure 1). Samples were dried in the drying box at 105 °C for 24 h, vacuumed at −0.1 MPa in the vacuum chamber for 10 h, and then pressurized at 20 MPa. Samples were then saturated in distilled water for 24 h. According to the temperatures in the cold areas in the northeast and northwest of China, the temperature range of the freezing–thawing cycles was set to –20 to 20 °C. The time interval of temperature conversion was 3 h, and the duration was 3 h. A cycle of the experimental freezing–thawing process is shown in Figure 1.
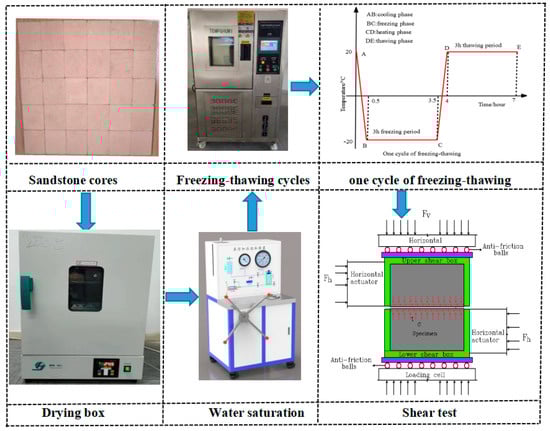
Figure 1.
Diagram of test equipment and procedures.
2.3. Experimental Scheme
A new loading path was designed and direct shear tests under unloading normal stress (DSTUNS) were performed to reveal the shear failure of rock under the condition of unloading normal stress. The tests were carried out on the DSZ-1000 electro-hydraulic servo rock tri-axial shear permeability testing machine at normal temperature (25 °C). The maximum values of the test system in the vertical and horizontal direction were 1000 and 300 kN, respectively. This testing machine can automatically record the displacement and force in both directions during the test. The stress state and auxiliary device of the rock sample are shown in Figure 1. The test system mainly includes a computer system, a control system, and a loading system. In the DSTUNS, the testing process includes three steps, as illustrated in Figure 2.
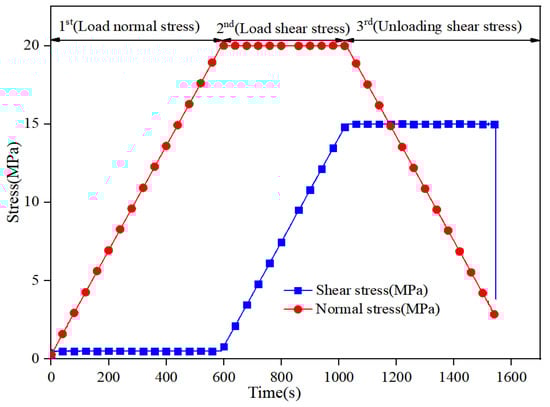
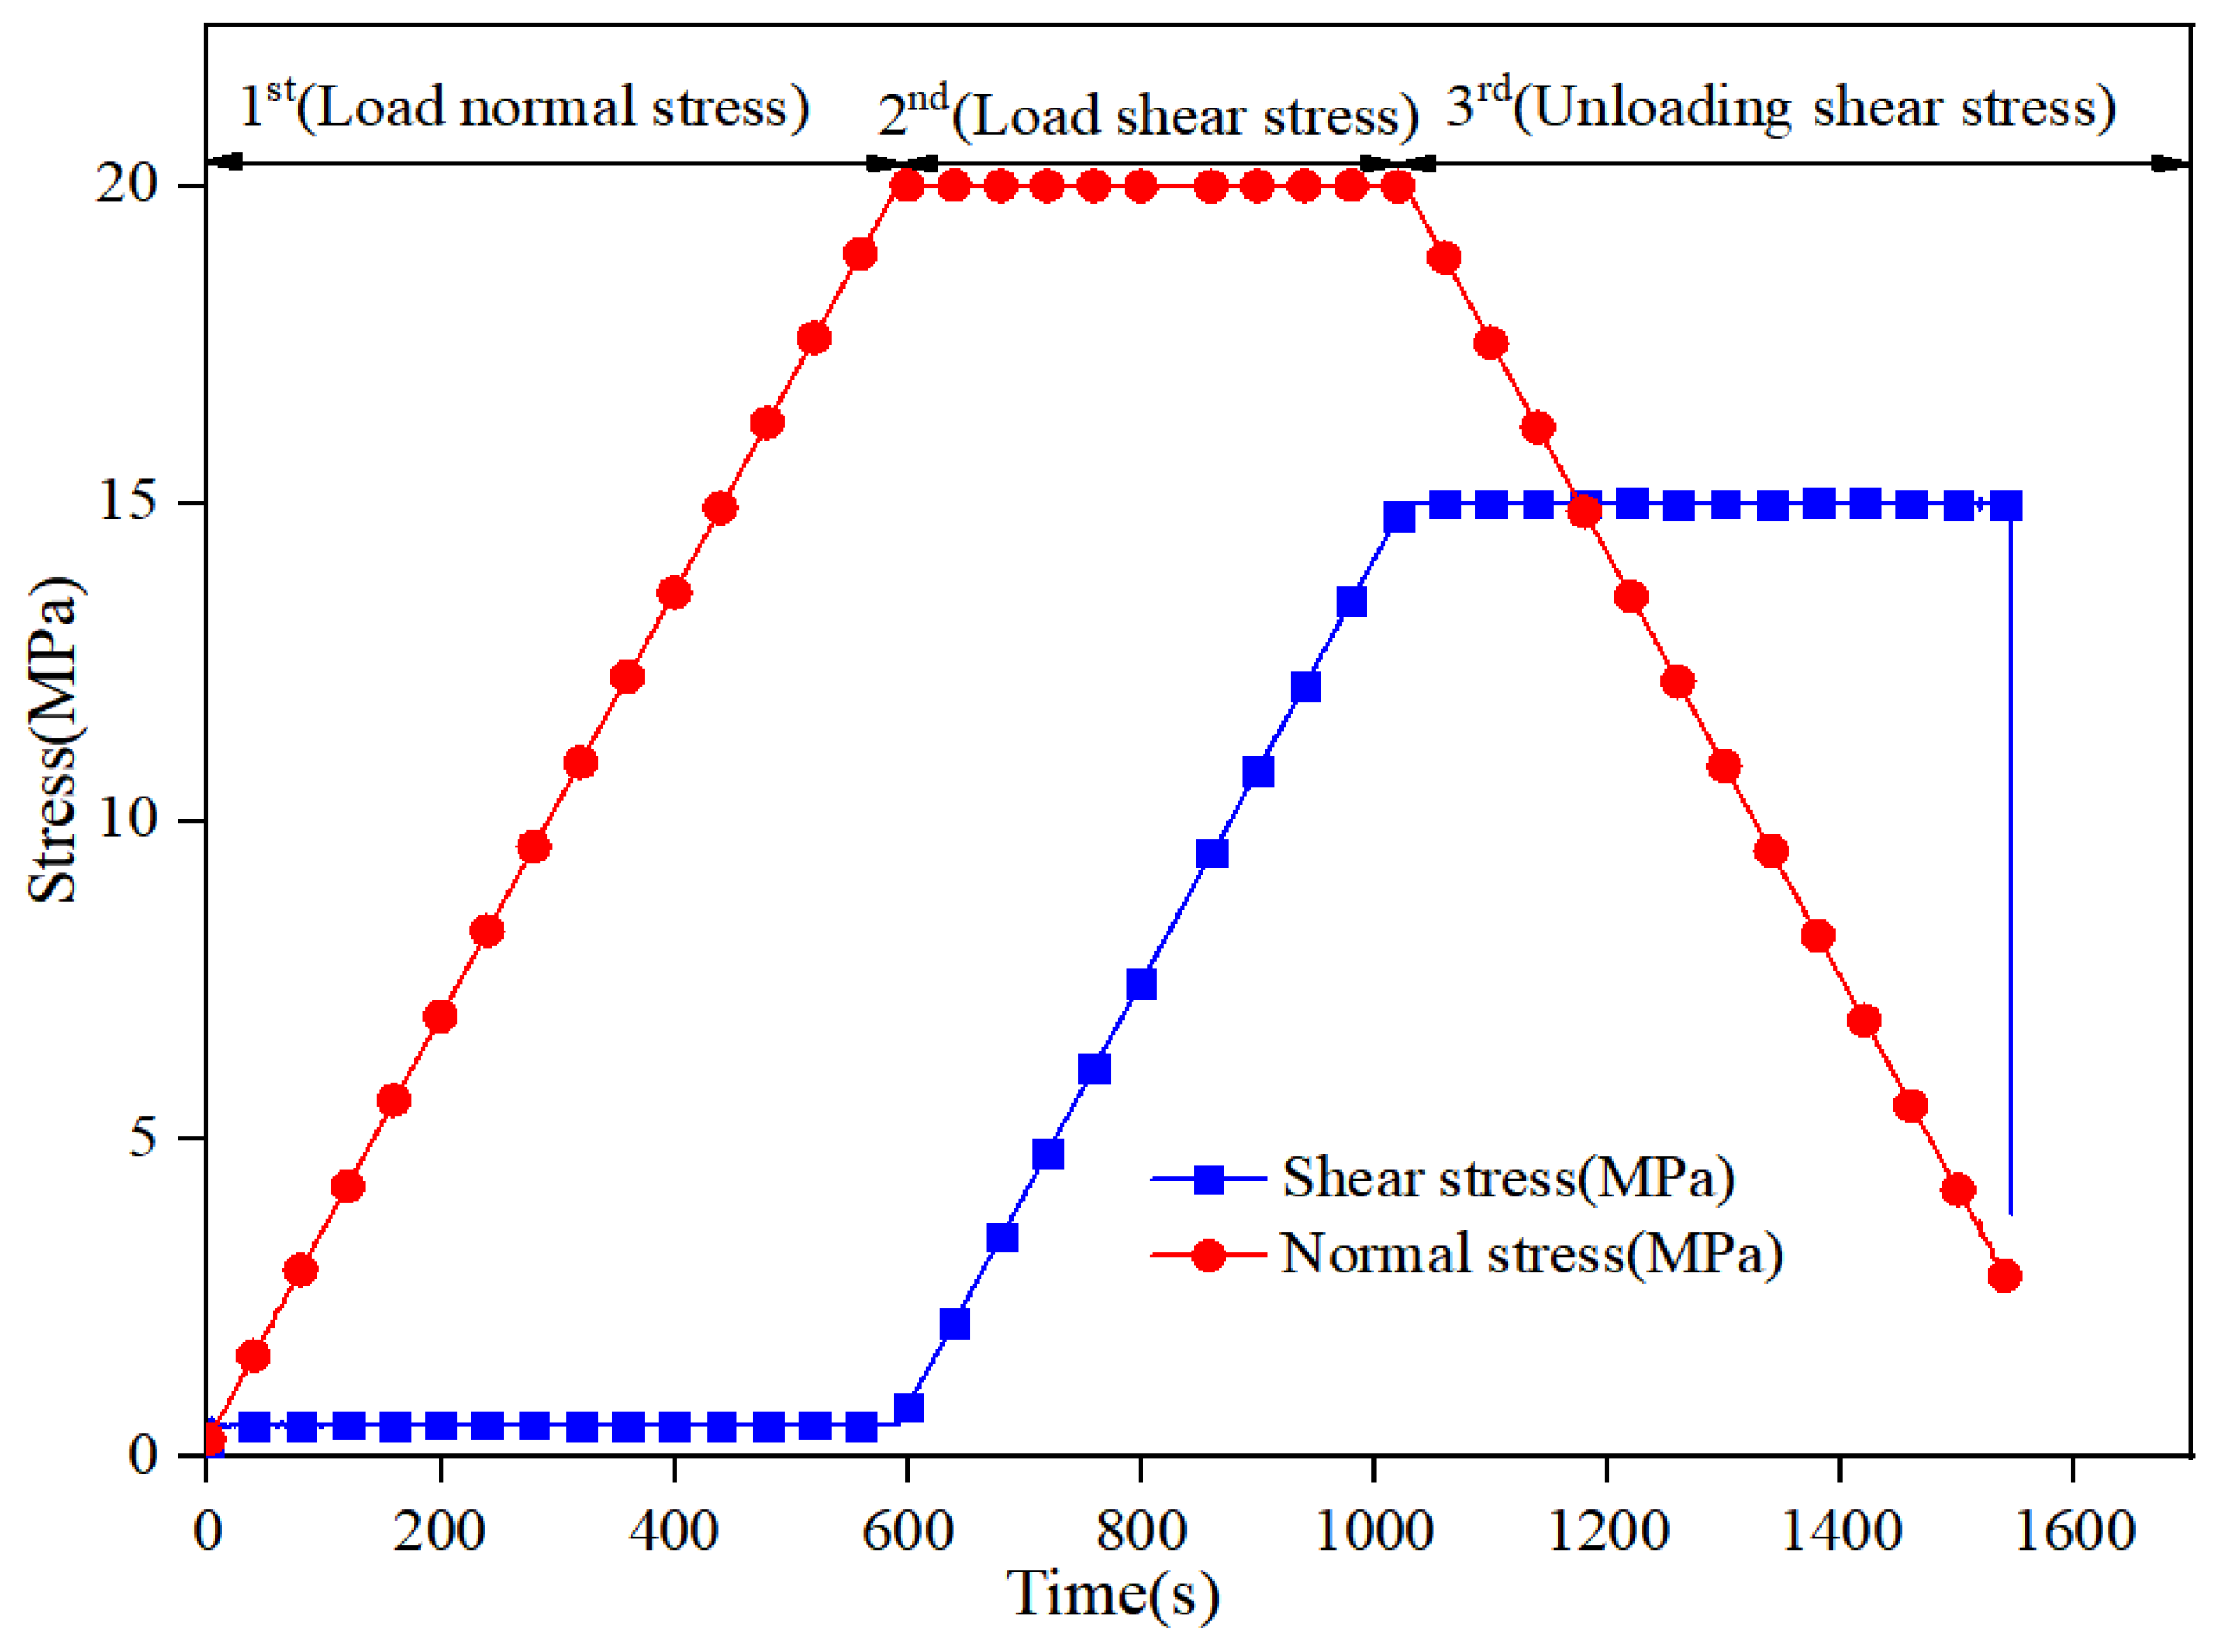
Figure 2.
Stress path of direct shear tests under unloading normal stress (DSTUNS).
First step: Loading the normal stress to 20 MPa at a rate of 2 MPa/min.
Second step: Loading the shear stress to 15 MPa at a rate of 2 MPa/min while leaving the normal stress constant. After the shear stress reaches the desired level, the stress-controlled mode is selected to maintain a constant shear stress.
Third step: Unloading the normal stress at a rate of 1, 2, 3, or 4 MPa/min until the samples are broken, while the shear stress remains constant.
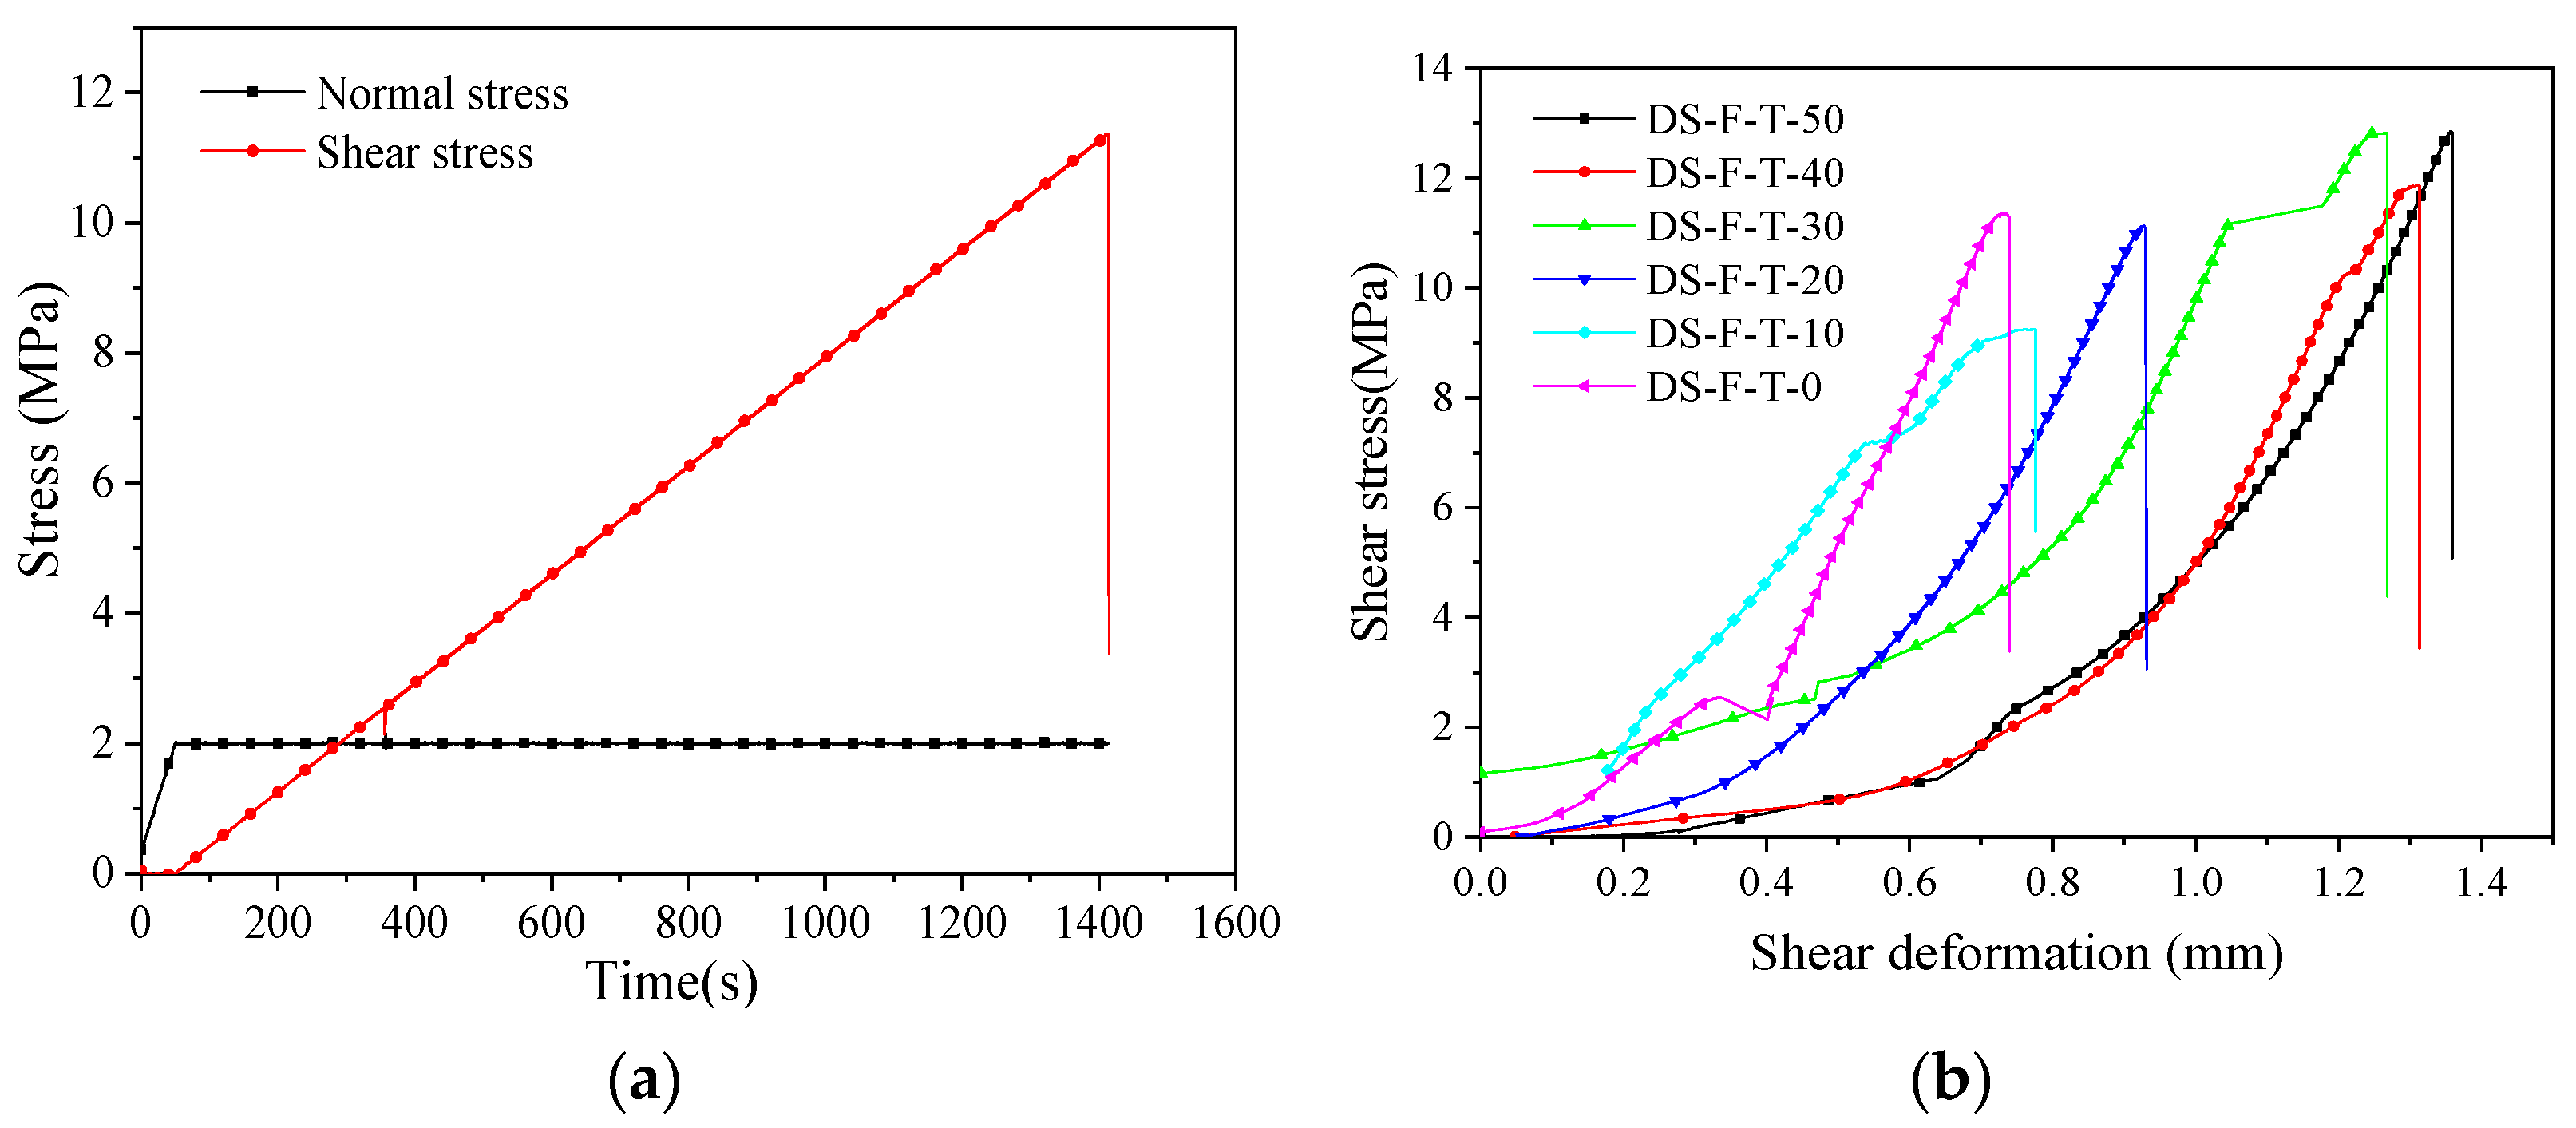
The shear resistance of rock was closely related to normal stress. If the shear stress was too large or the normal stress was greater than the UCS, the rock samples would be broken before unloading the normal stress. In contrast, if the shear stress was less than a value, the samples would not be broken when the normal stress was unloaded to zero. Therefore, the direct shear test and the uniaxial compression test were carried out to determine the normal stress and the shear stress. The normal stress was less than UCS. Under the normal stress condition, the shear stress was greater than the shear strength, and under the condition that the normal stress was zero, the shear strength of the direct shear test was less than the shear strength under the constant normal stress condition. In the first and the second steps, the set values of 20 and 15 MPa for the shear stress and the normal stress were obtained by the direct shear test (Figure 3).
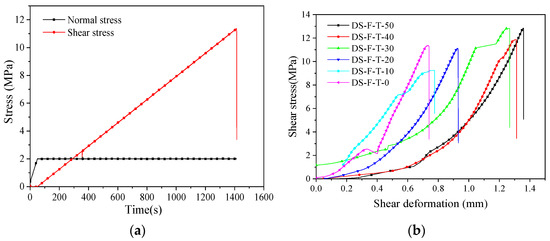
Figure 3.
Stress path and stress–strain curves of direct shear tests. (a) Stress path (DS-F-T-0). (b) Stress–strain curves.
The samples’ test scheme was carried out according to Table 1.

Table 1.
Sandstone samples’ shear test scheme under the different conditions.
3. Results and Discussions
3.1. Direct Shear Test Results
The direct shear tests of samples after different freezing–thawing cycles (0, 10, 20, 30, 40, and 50 times) were carried out at normal temperature (25 °C). First, 2 MPa normal stress was applied to the sample at a speed of 2 MPa/min. At the same time, the normal stress was kept constant and the shear stress was applied to the samples at a speed of 0.5 MPa/min until the sample was broken, and the failure stress was obtained when the samples were broken. The set values of 20 and 15 MPa for the shear stress and the normal stress were obtained for the DSTUNS. The stress path of the direct shear test on the untreated freezing–thawing sample is shown in Figure 3a. The failure shear stress of the samples was 11 MPa.
The stress–strain curves of samples after different freezing–thawing cycles’ treatment (0, 10, 20, 30, 40, and 50 times) under the direct shear test are shown in Figure 3b. The change of peak shear stress was not obvious, but the shear deformation changed obviously as the freezing–thawing cycle times increased. The shear deformation of samples exhibited an upward trend as the freezing–thawing cycle duration increased. It indicated that the samples had different degrees of deterioration after freezing–thawing cycles. After 50 freezing–thawing cycles, the shear deformations were 0.7351, 0.9621, 0.9275, 1.246, 1.3103, and 1.357 mm, respectively. Thus, the rock samples demonstrated varying extents of deterioration after freezing–thawing cycles. The development of micropores and cracks led to deterioration and damage to the internal structure of rock samples as the freezing–thawing cycle duration increased. The damage also resulted in rock looseness, which reduced samples’ compactness [58].
3.2. Deformation
3.2.1. Displacement Histories
The stress path of the DSTUNS is shown in Figure 2. According to the results of the direct shear test, the preset shear stress was 15 MPa, and the normal stress was 20 MPa. Based on this, the normal stress was loaded to the predetermined value of 20 MPa at a rate of 2 MPa/min. Then, the shear stress was loaded to the predetermined value of 15 MPa at the same rate.
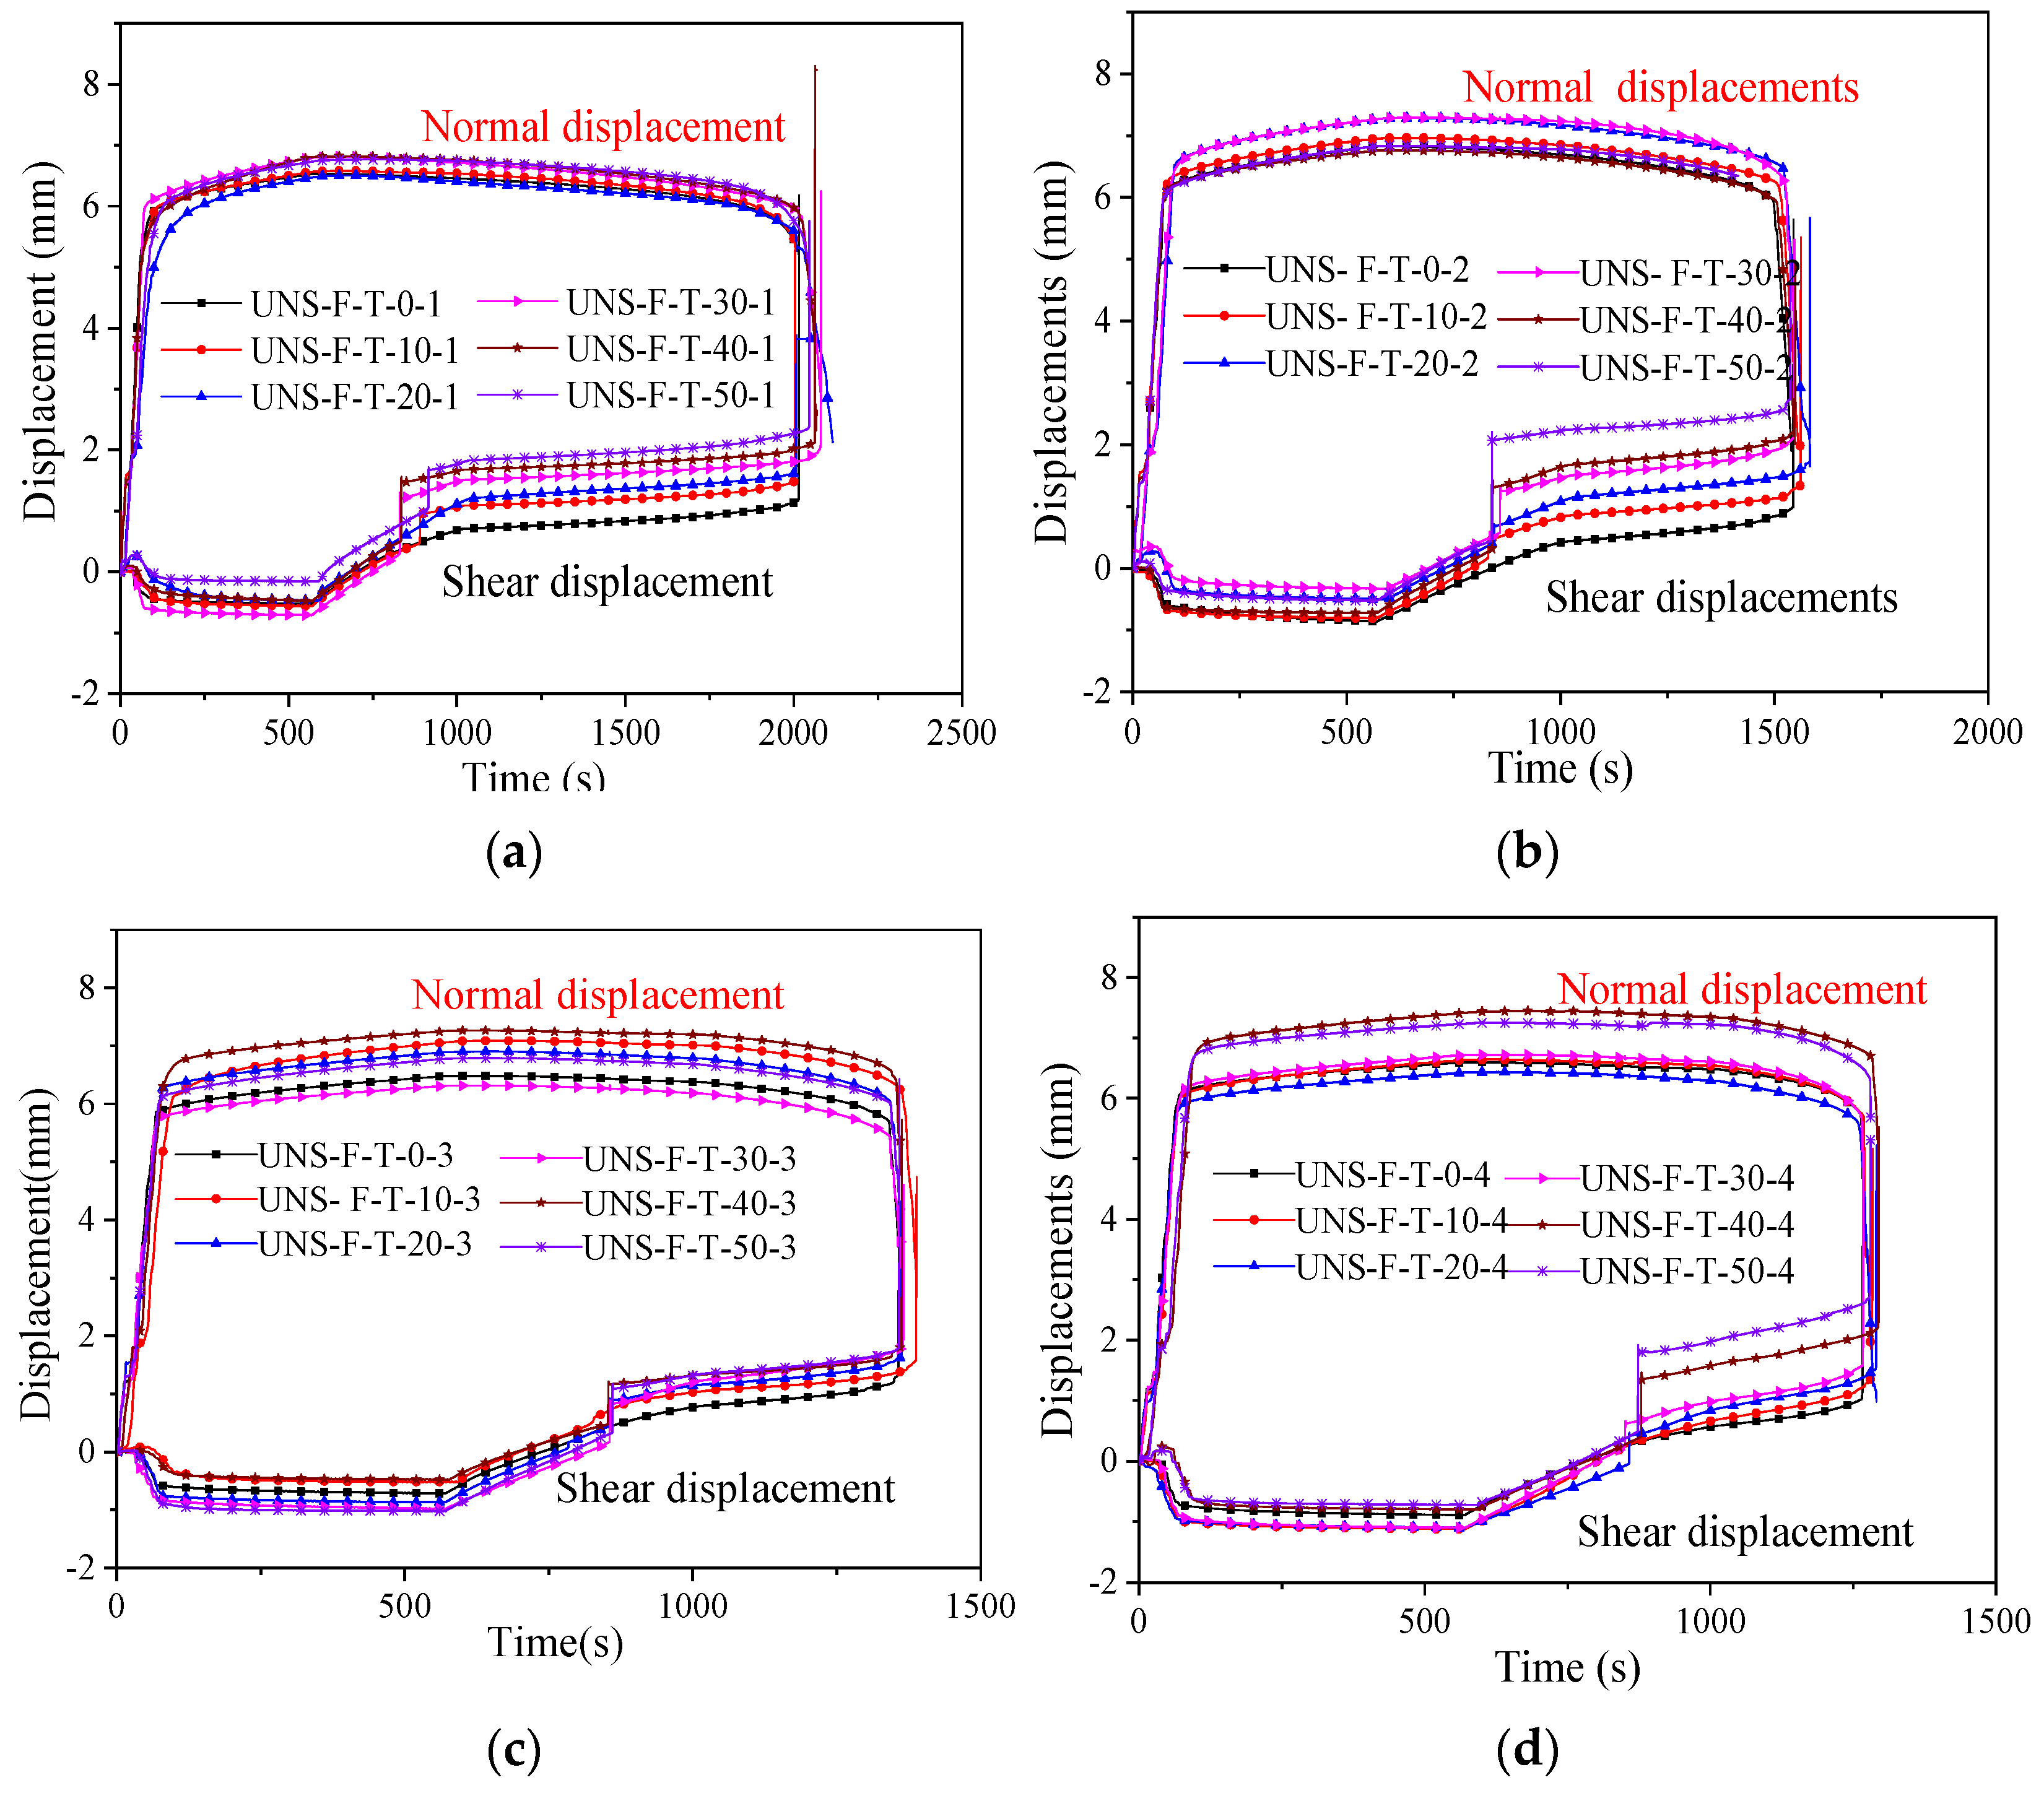
The normal stress of samples after different freezing–thawing cycles was reduced at rates of 1, 2, 3, or 4 MPa/min. The normal displacement and the shear displacement change with time are shown in Figure 4. The trends of the normal displacement and the shear displacement of samples with different freezing–thawing cycles were basically same. In the DSTUNS, when the unloading rate was 1 MPa/min, different freezing–thawing cycles had little effect on the normal displacement, but obviously affected the shear displacement. The shear displacement increased as the number of freezing–thawing cycles increased. Herein, the increased displacement was defined as positive, and the decreased displacement was defined as negative. For sample UNS-F-T-50-2 (Figure 4), for example, when the number of freezing–thawing cycles was 50, the unloading rate was 2 MPa/min, and the normal displacement increased as the normal stress increased. The samples showed shear expansion action. The shear displacement changed from 0 to negative and continued to be reduced. When the normal stress reached 20 MPa, the normal displacement was 6.7793 mm and the shear displacement was 0.3984 mm. Then, the normal stress was invariant, and the shear stress was loaded at the same time. As the shear stress increased, the shear displacement gradually increased, and the normal displacement gradually decreased. When the shear stress reached 15 MPa, the shear displacement was 2.2256 mm and the normal displacement decreased to 6.6359 mm. Then, the shear stress was kept constant and the normal stress was unloaded at a rate of 2 MPa/min. The normal displacement was gradually decreasing, and the shear displacement gradually increased as the normal stress decreased. When the samples were destroyed, the normal displacement sharply decreased and the shear displacement dramatically increased. The normal displacement of the samples was 5.5898 mm, and the shear displacement was 2.5615 mm (Figure 4b).
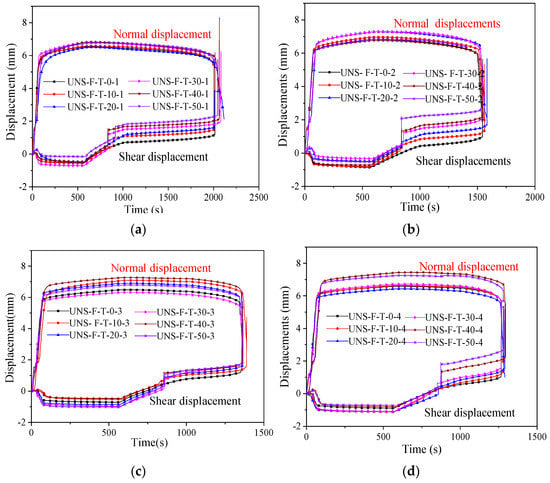
Figure 4.
Curves of shear and normal displacements versus time in the DSTUNS: (a) 1 MPa/min, (b) 2 MPa/min, (c) 3 MPa/min, and (d) 4 MPa/min.
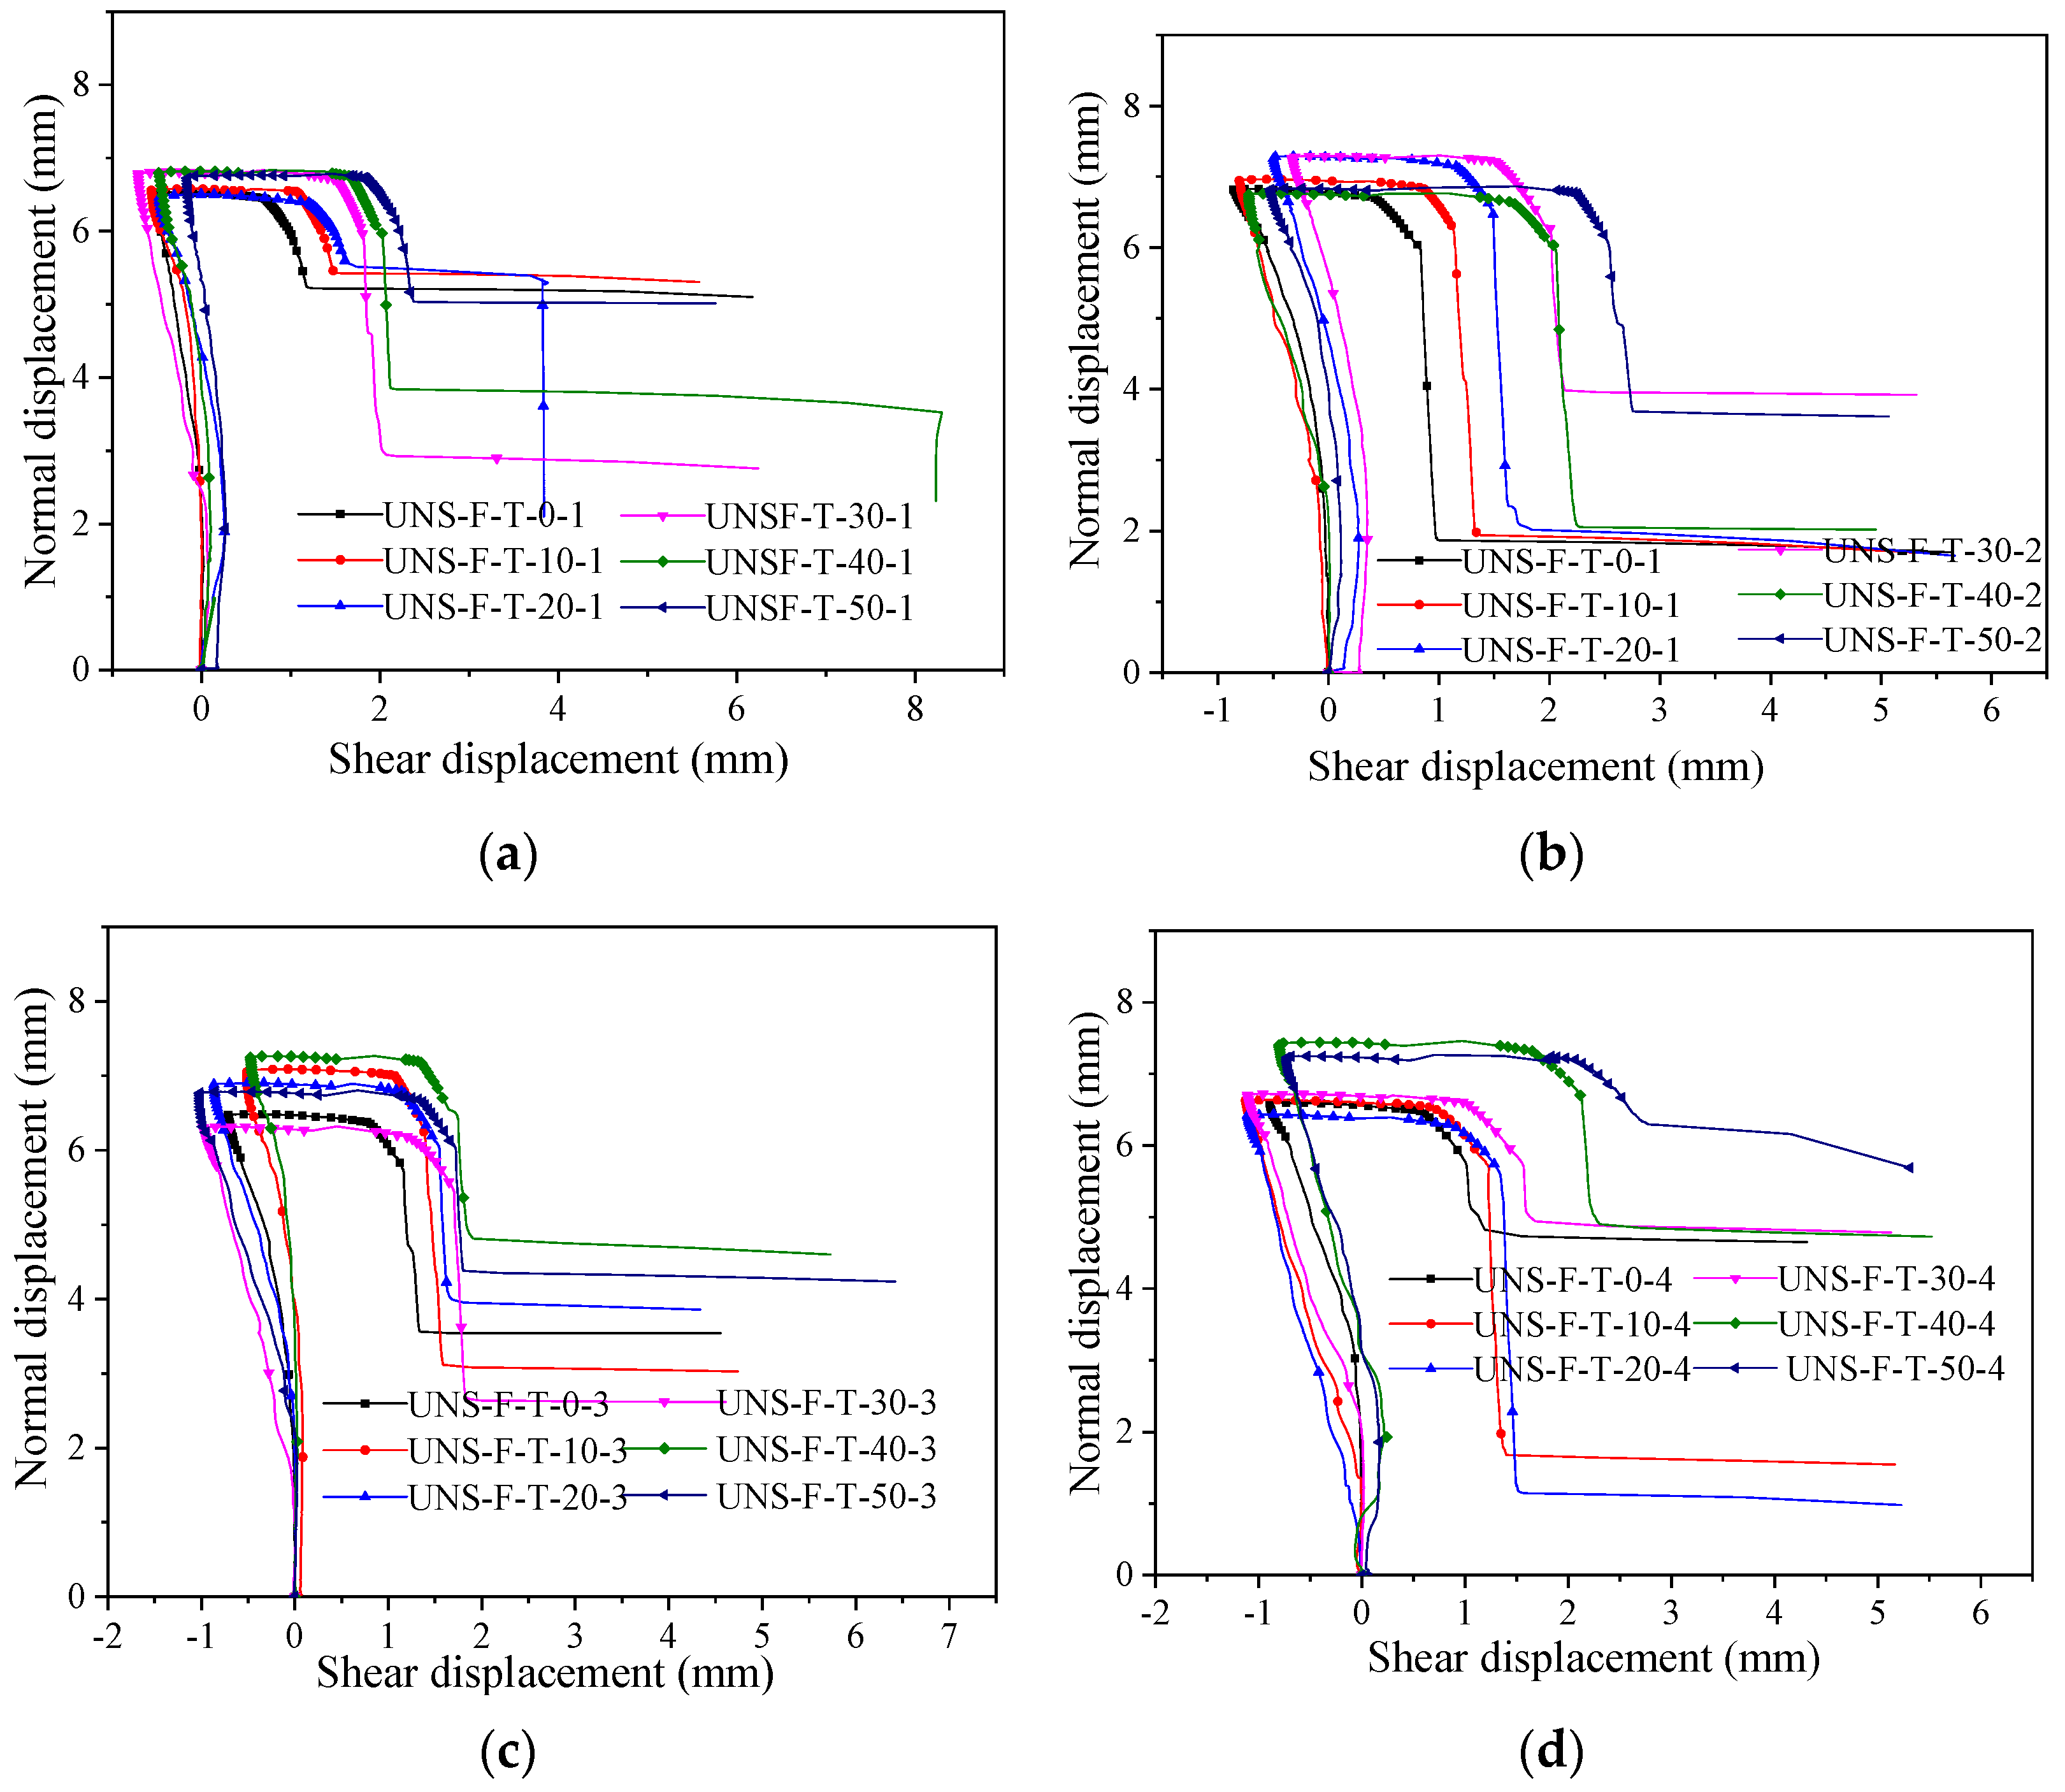
Figure 5 shows the relationship between the shear displacement and the normal displacement. It could be seen from the diagram that the normal displacement increased rapidly as the normal stress increased, and the shear displacement decreased slowly from 0 to negative at the initial stage of loading. When the normal stress reached the preset value (20 MPa), the shear stress was loaded. As the shear stress increased, the normal displacement decreased slowly. When the shear stress reached the preset value, the normal stress was unloaded. Furthermore, the normal displacement decreased rapidly until the samples were broken and the test was finished. The normal displacement decreased rapidly due to the unloading normal stress.
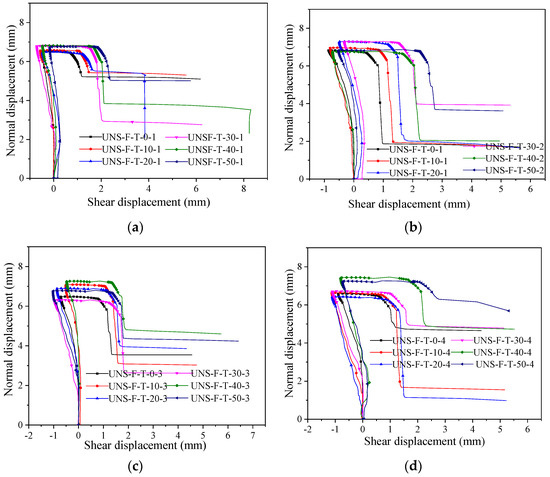
Figure 5.
Curves of normal displacement versus shear displacement in the DSTUNS: (a) 1 MPa/min, (b) 2 MPa/min, (c) 3 MPa/min, and (d) 4 MPa/min.
3.2.2. Characteristic of Displacements
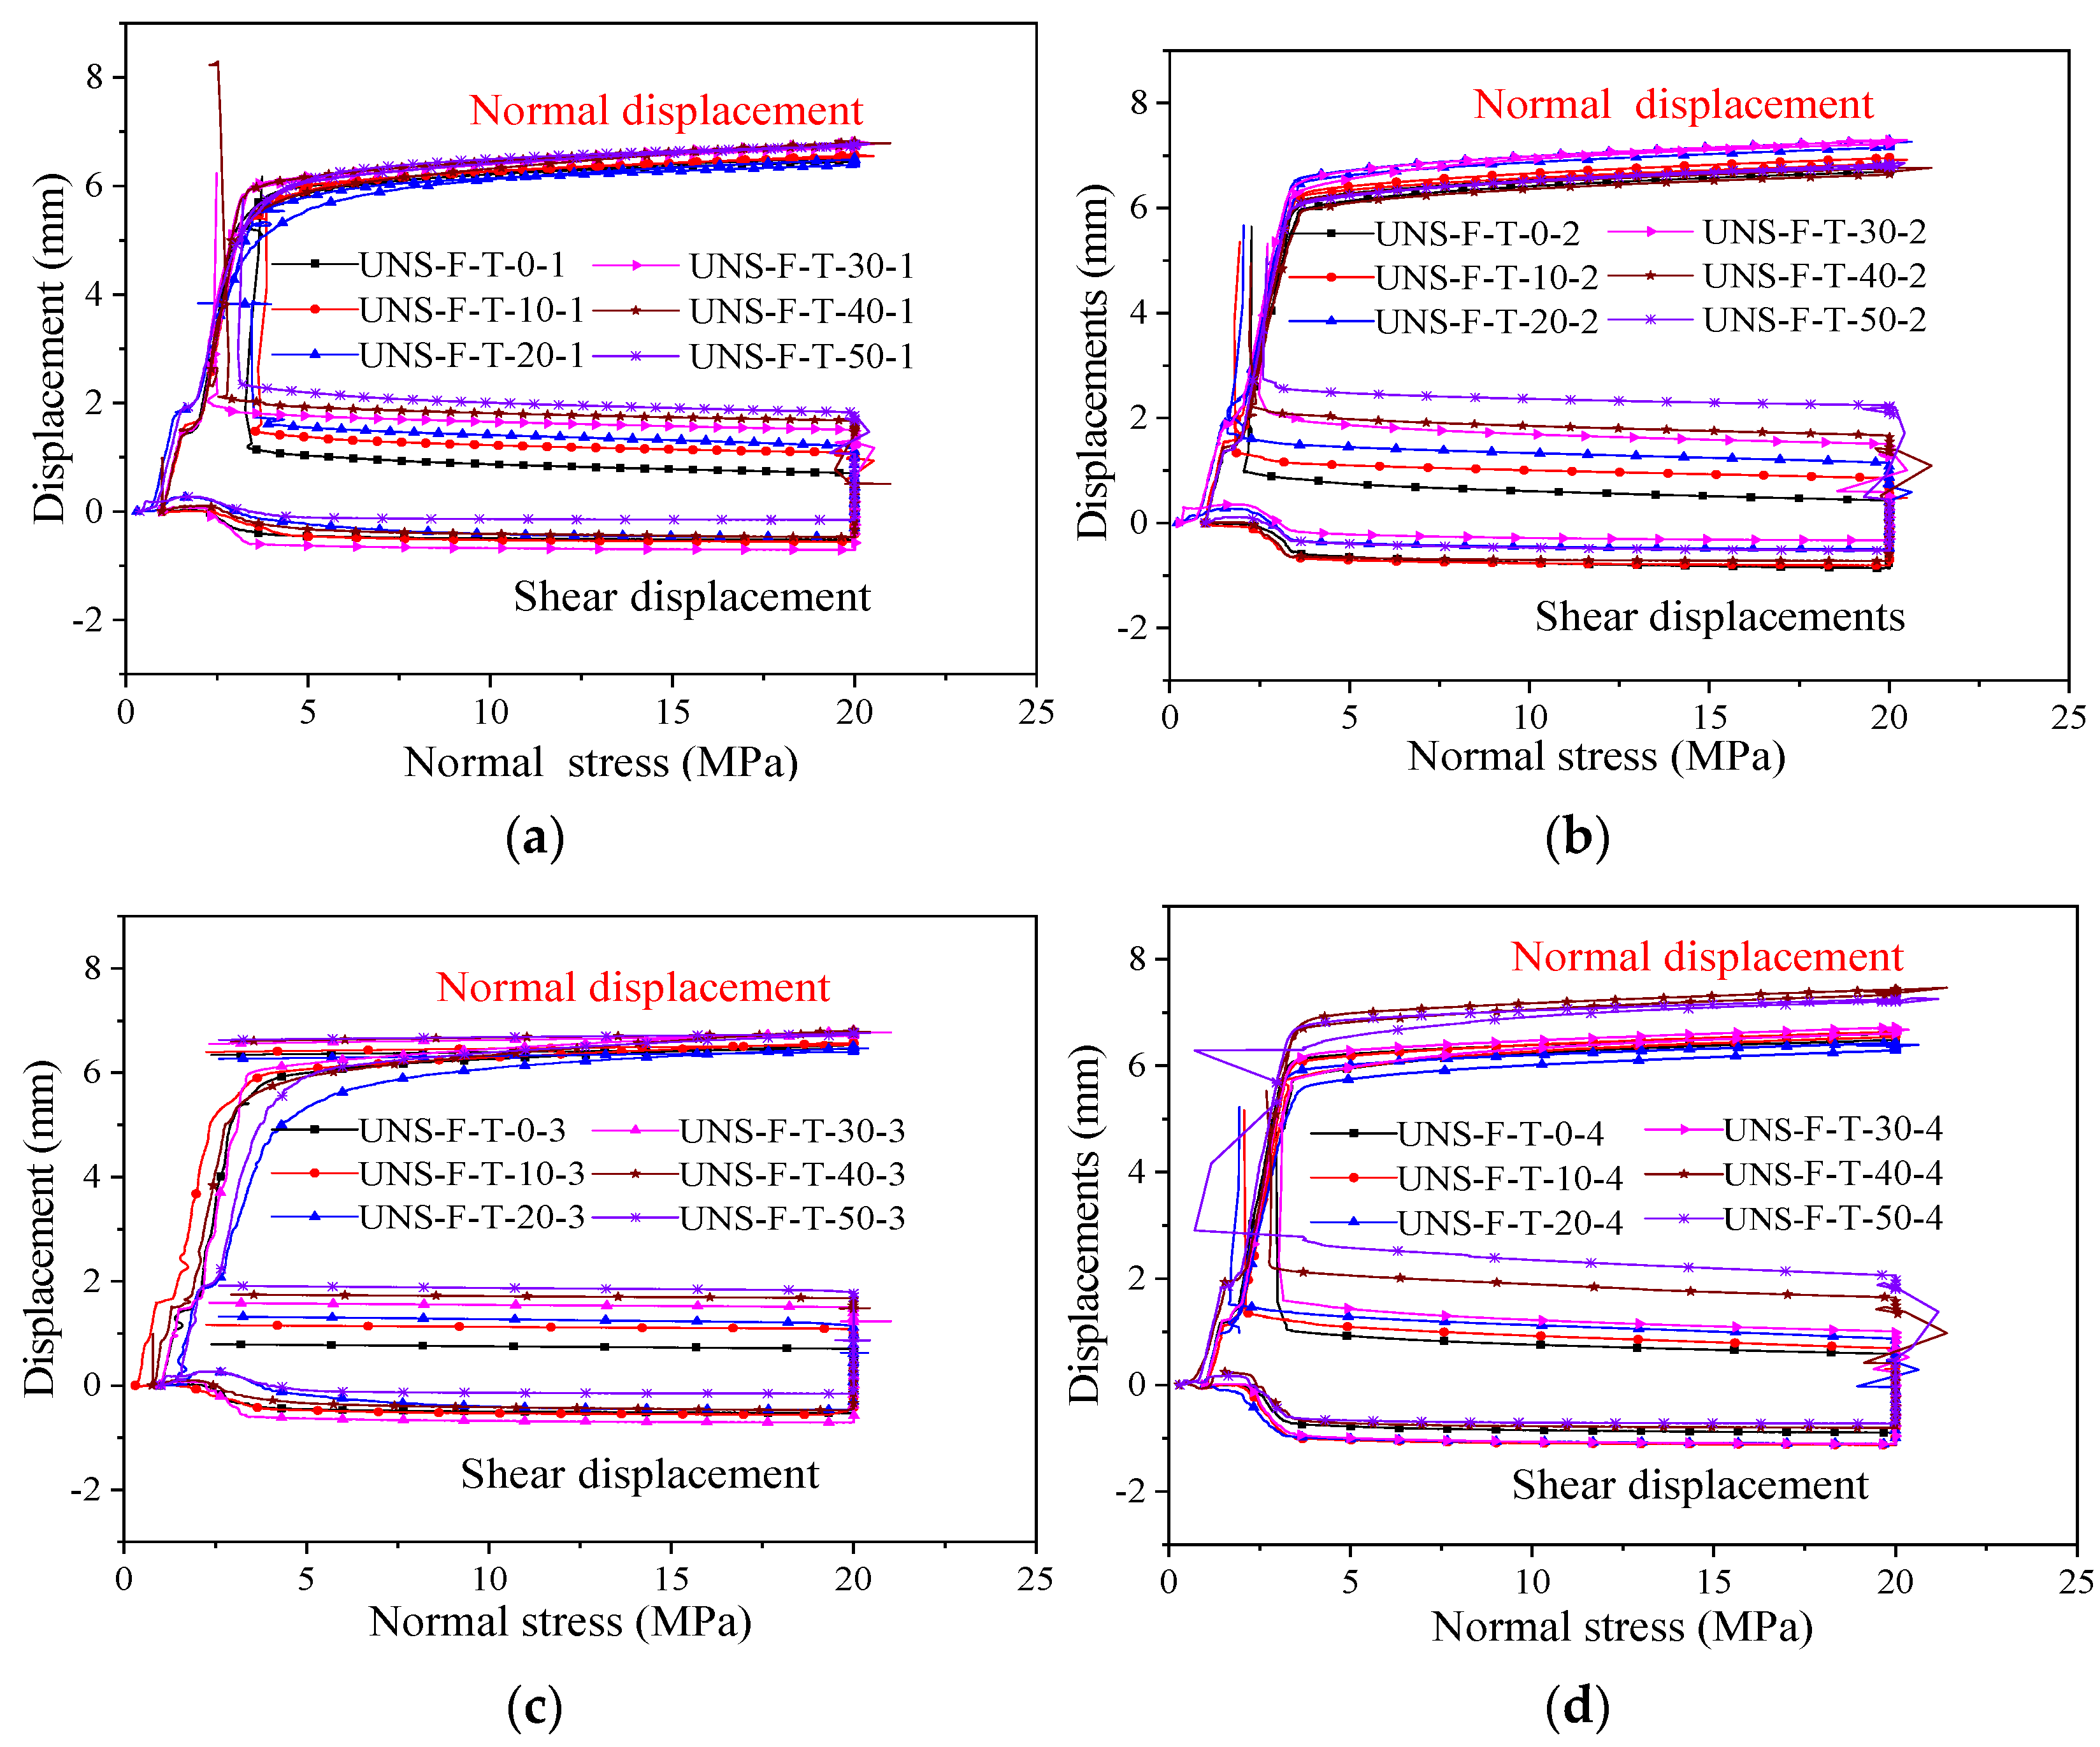
The curves of the shear and the normal displacements versus normal stress are shown in Figure 6. The trend of normal displacement and shear displacement of samples after the freezing–thawing cycle was basically consistent at the same unloading rate, and the shear displacement increased as the freezing–thawing cycle times increased. The effect of freezing–thawing cycles was not obvious on the normal displacement as the unloading rate increased. However, the shear displacement increased more and more obviously as the freezing-–thawing cycle times increased. The reason was that the samples after the freezing–thawing cycles suffered freezing–thawing damage, which weakened the brittleness of the samples and resulted in the significant increase of shear strain before failure.
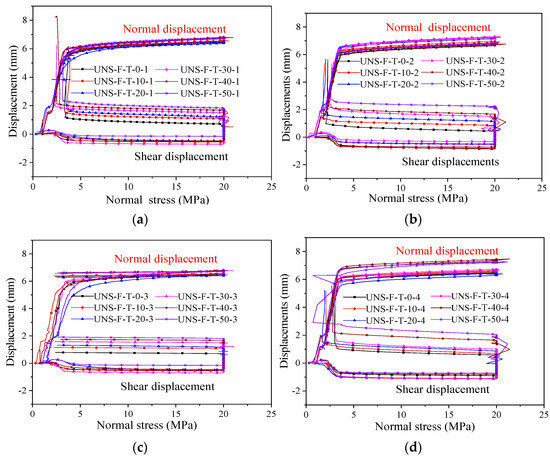
Figure 6.
Curves of the shear and normal displacements versus normal stress in the DSTUNS: (a) 1 MPa/min, (b) 2 MPa/min, (c) 3 MPa/min, and (d) 4 MPa/min.
The typical curve of the shear and normal displacements versus the normal stress can be simplified as shown in Figure 7. For example, point A and point a represent normal displacements and shear displacements at the same time, respectively. The normal displacement curve was O-a-b-c, and the shear displacement curve was O-A-B-C. When the normal stress was loaded, the normal displacement gradually changed from point o to point a, and the shear stress gradually changed from point O to point A. During the application of shear stress, the normal stress changed from point a to point b, and the shear displacement changed from point A to point B. During the process of unloading normal stress, the normal displacement changed from point b to point c, and the shear displacement changed from point B to point C.
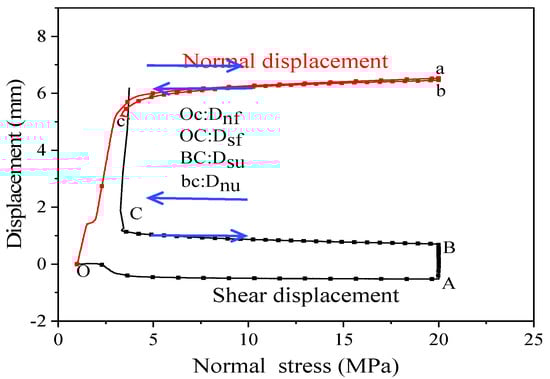
Figure 7.
Typical curves of the shear and normal displacements with normal stress (UNS-F-T-0-1) in the DSTUNS.
In order to study the effects of freezing–thawing cycles and unloading rate on the normal displacement and the shear displacement, the failure normal displacement (Dnf), the failure shear displacement (Dsf), the normal displacement of unloading (Dnu), and the shear displacement of unloading (Dsu) were defined, respectively, as shown in Figure 7. The failure normal displacement was the normal displacement of the samples when failure occurs, which was normal displacement at point c. The failure shear displacement was the shear displacement when the sample was destroyed, namely, the shear displacement at point C. The unloading normal displacement was the normal displacement produced during the unloading process, i.e., the displacement from point b to point c (the value of point c minus the value of point b). The unloading shear displacement was the shear displacement generated during unloading, that is the displacement from point B to point C.
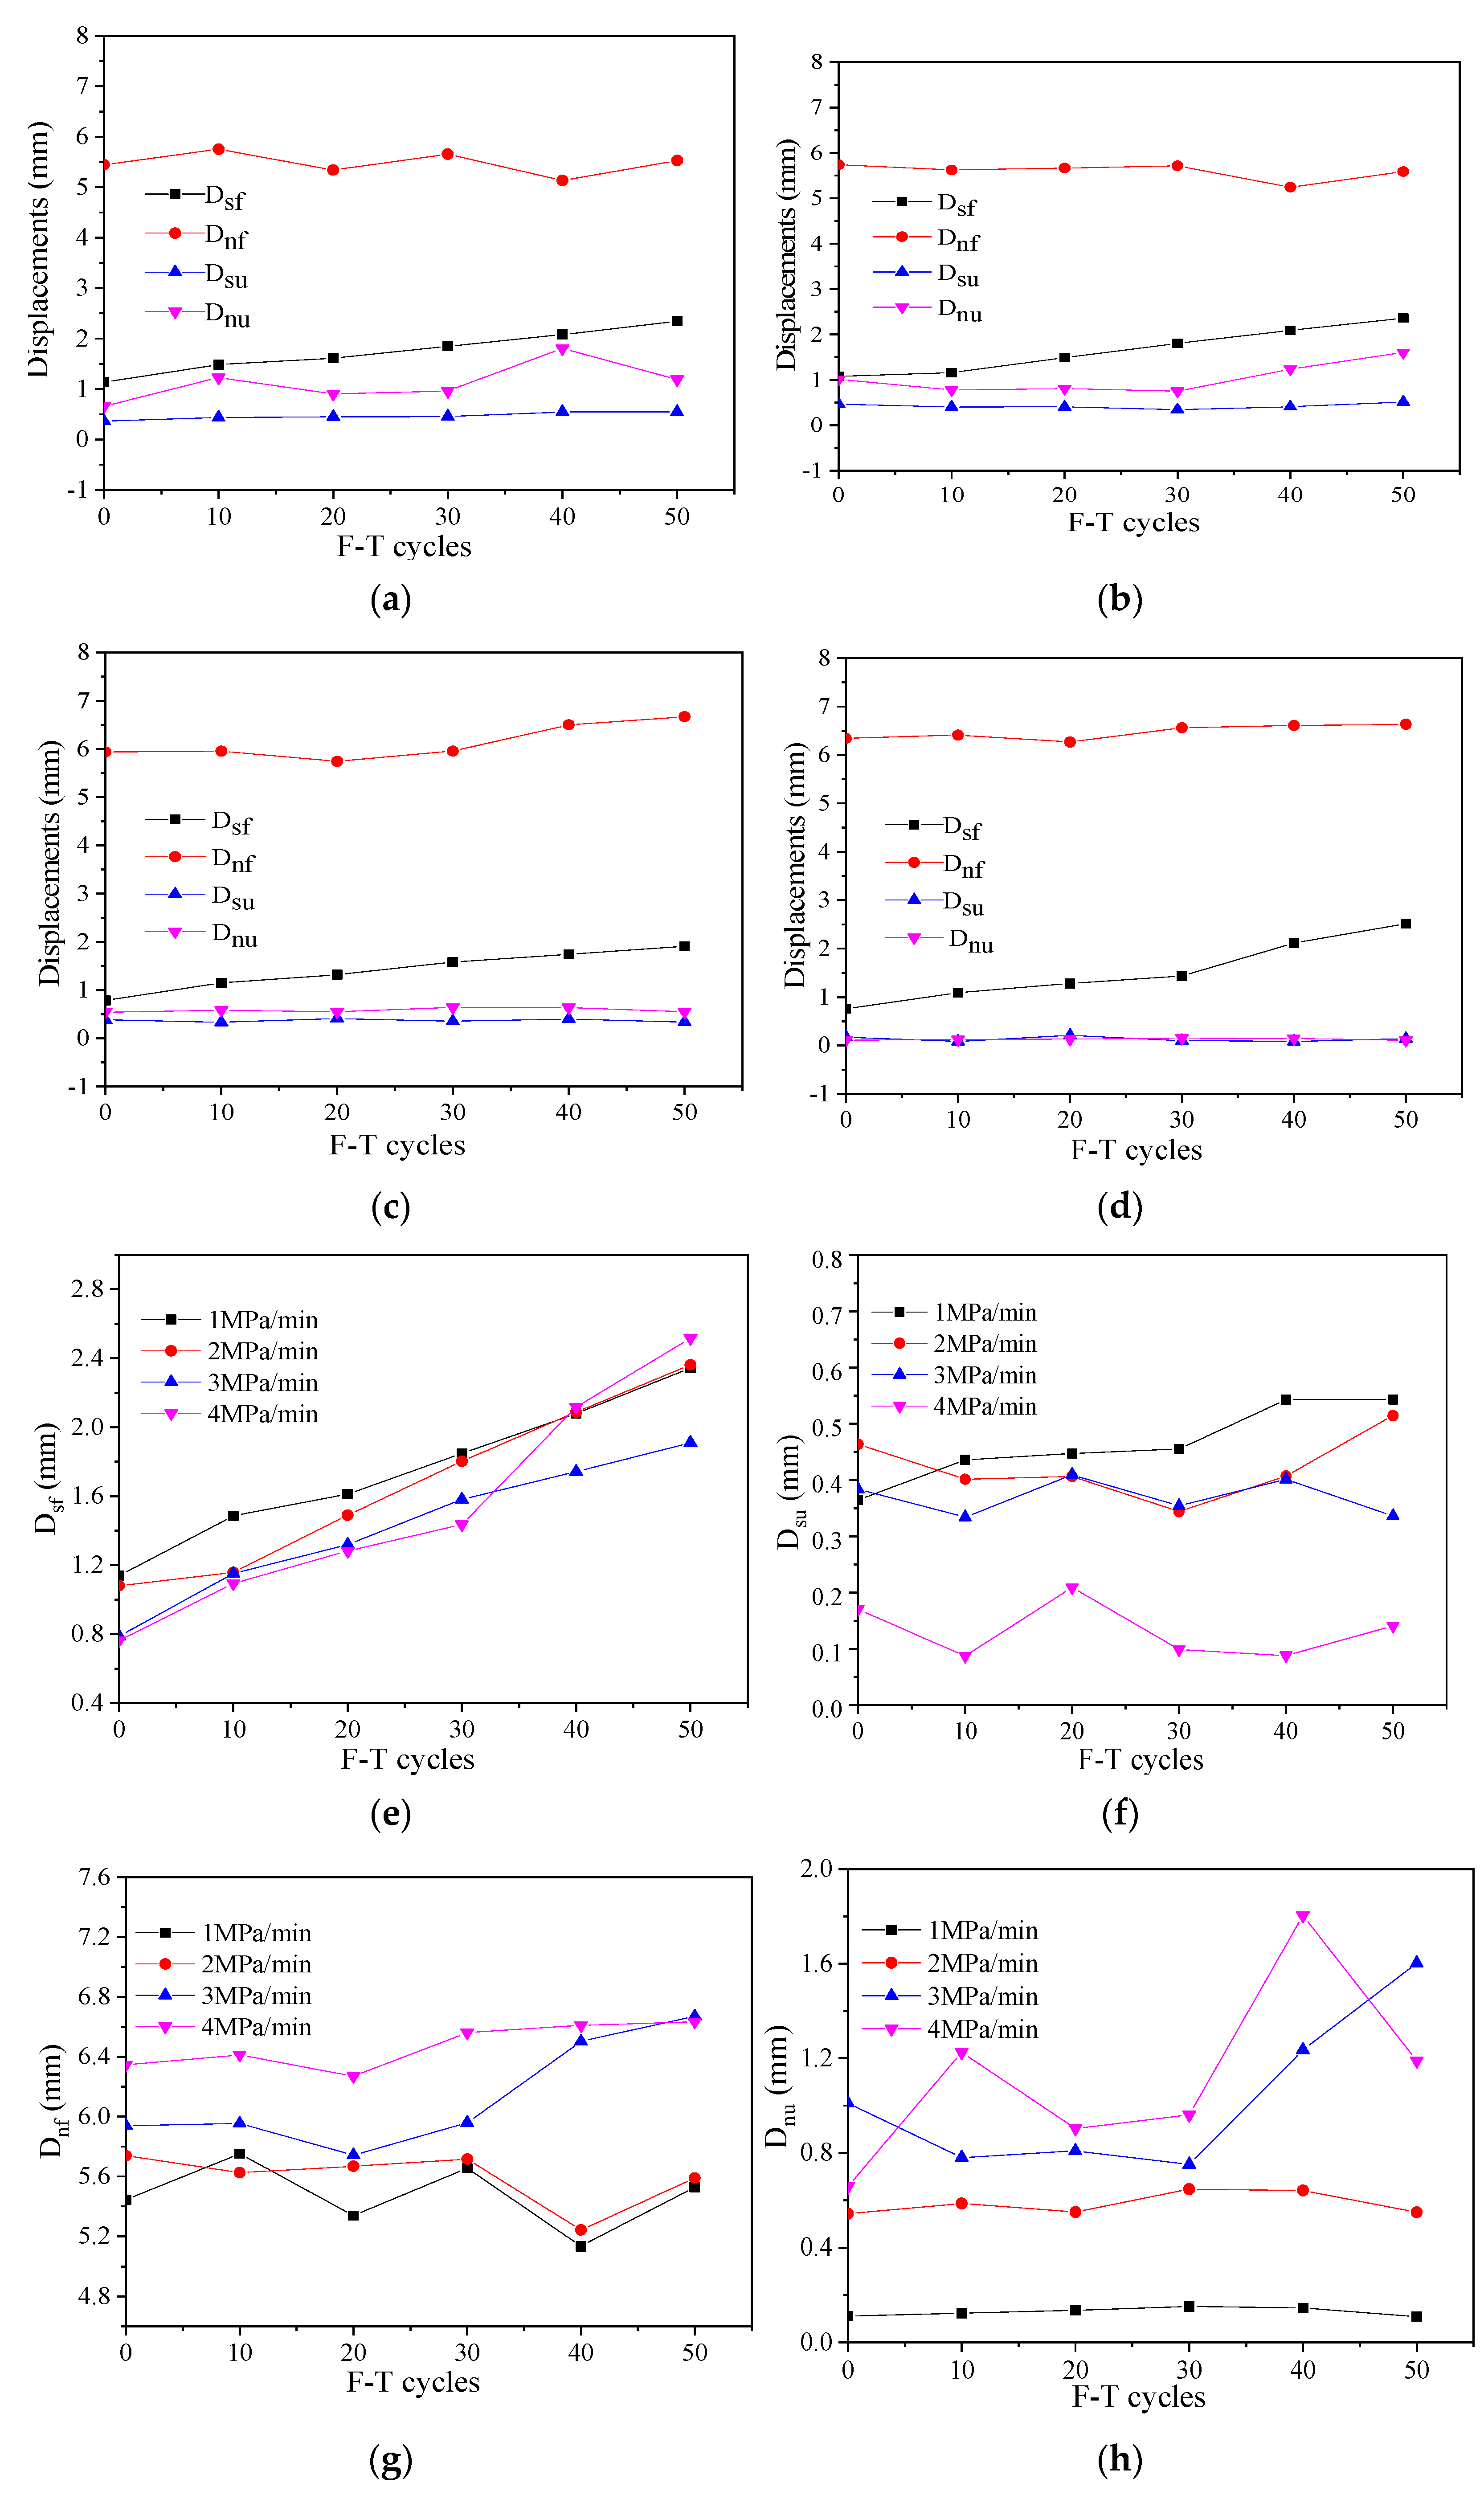
Figure 8 shows the change in the Dsf, Dnf, Dnu, and Dsu with the number of freezing–thawing cycles and unloading rate. Overall, the Dsf exhibited an obvious increase as the number of freezing–thawing cycles increased. However, Dnf, Dsu, and Dnu did not show significant changes as the number of freezing–thawing cycles and unloading rate rose, as shown in Figure 8a–d. The main reason was that the deformation energy was consumed by freezing–thawing cycle damage. Furthermore, the values of Dnf were much bigger than those of Dsu and Dnu, which were kept at a low level. The unloading shear fracture was a transient fracture during the DSTUNS, resulting in a little accumulation of the unloading displacement.
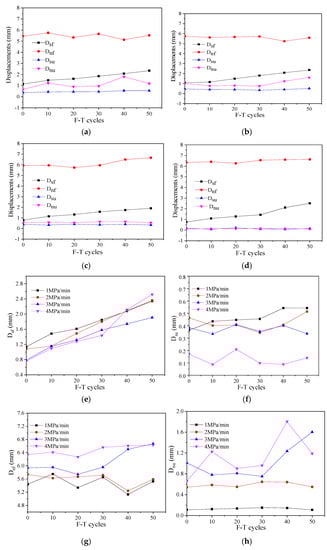
Figure 8.
The change of Dsf, Dnf, Dsu, and Dnu with different numbers of freezing–thawing cycles and unloading rates in the DSTUNS: (a) 1 MPa/min, (b) 2 MPa/min, (c) 3 MPa/min, (d) 4 MPa/min, (e) Dsf, (f) Dsu, (g) Dnf, and (h) Dnu.
As shown in Figure 8e, as the number of freezing–thawing cycles increased from 0 to 50, the Dsf increased from 1.1387 to 2.3428 mm, which represented a growth of 105.74% (with a constant unloading rate of 1 MPa/min), a growth of 218.56% from 1.0805 to 2.3615 mm (at a constant unloading rate of 2 MPa/min), a growth of 242.38% from 0.7881 to 1.9102 mm (at a constant unloading rate of 3 MPa/min), and a growth of 330.05% from 0.7628 to 2.5176 mm (at a constant unloading rate of 4 MPa/min), respectively. It was similar to the change rule of Dsu (Figure 8f) whereby values were decreased as the unloading rate increased before cycle times less than 30. However, when the cycle times were higher than 40, Dsf has an obvious increase due to the freezing–thawing cycle damage on samples. For Dnf and Dnu shown in Figure 8g,h, the Dnf and Dnu fluctuated largely when the number of freezing–thawing cycles was constant, but increased significantly as the unloading rate increased from 1 to 4 MPa/min. This observation suggested that a higher freezing–thawing cycle can induce a larger shear displacement under unloading normal stress. The Dnf and Dnu comprised elastic deformation release and shear dilatancy deformation under unloading normal stress. Furthermore, the Dnf and Dnu increased significantly only when the number of freezing–thawing cycles was unchanged for the large enough unloading rate. It indicated that the unloading rate has a large impact on the shear dilatancy whatever the direct shear test and the DSTUNS on samples after freezing–thawing cycles.
3.3. Failure Pattern
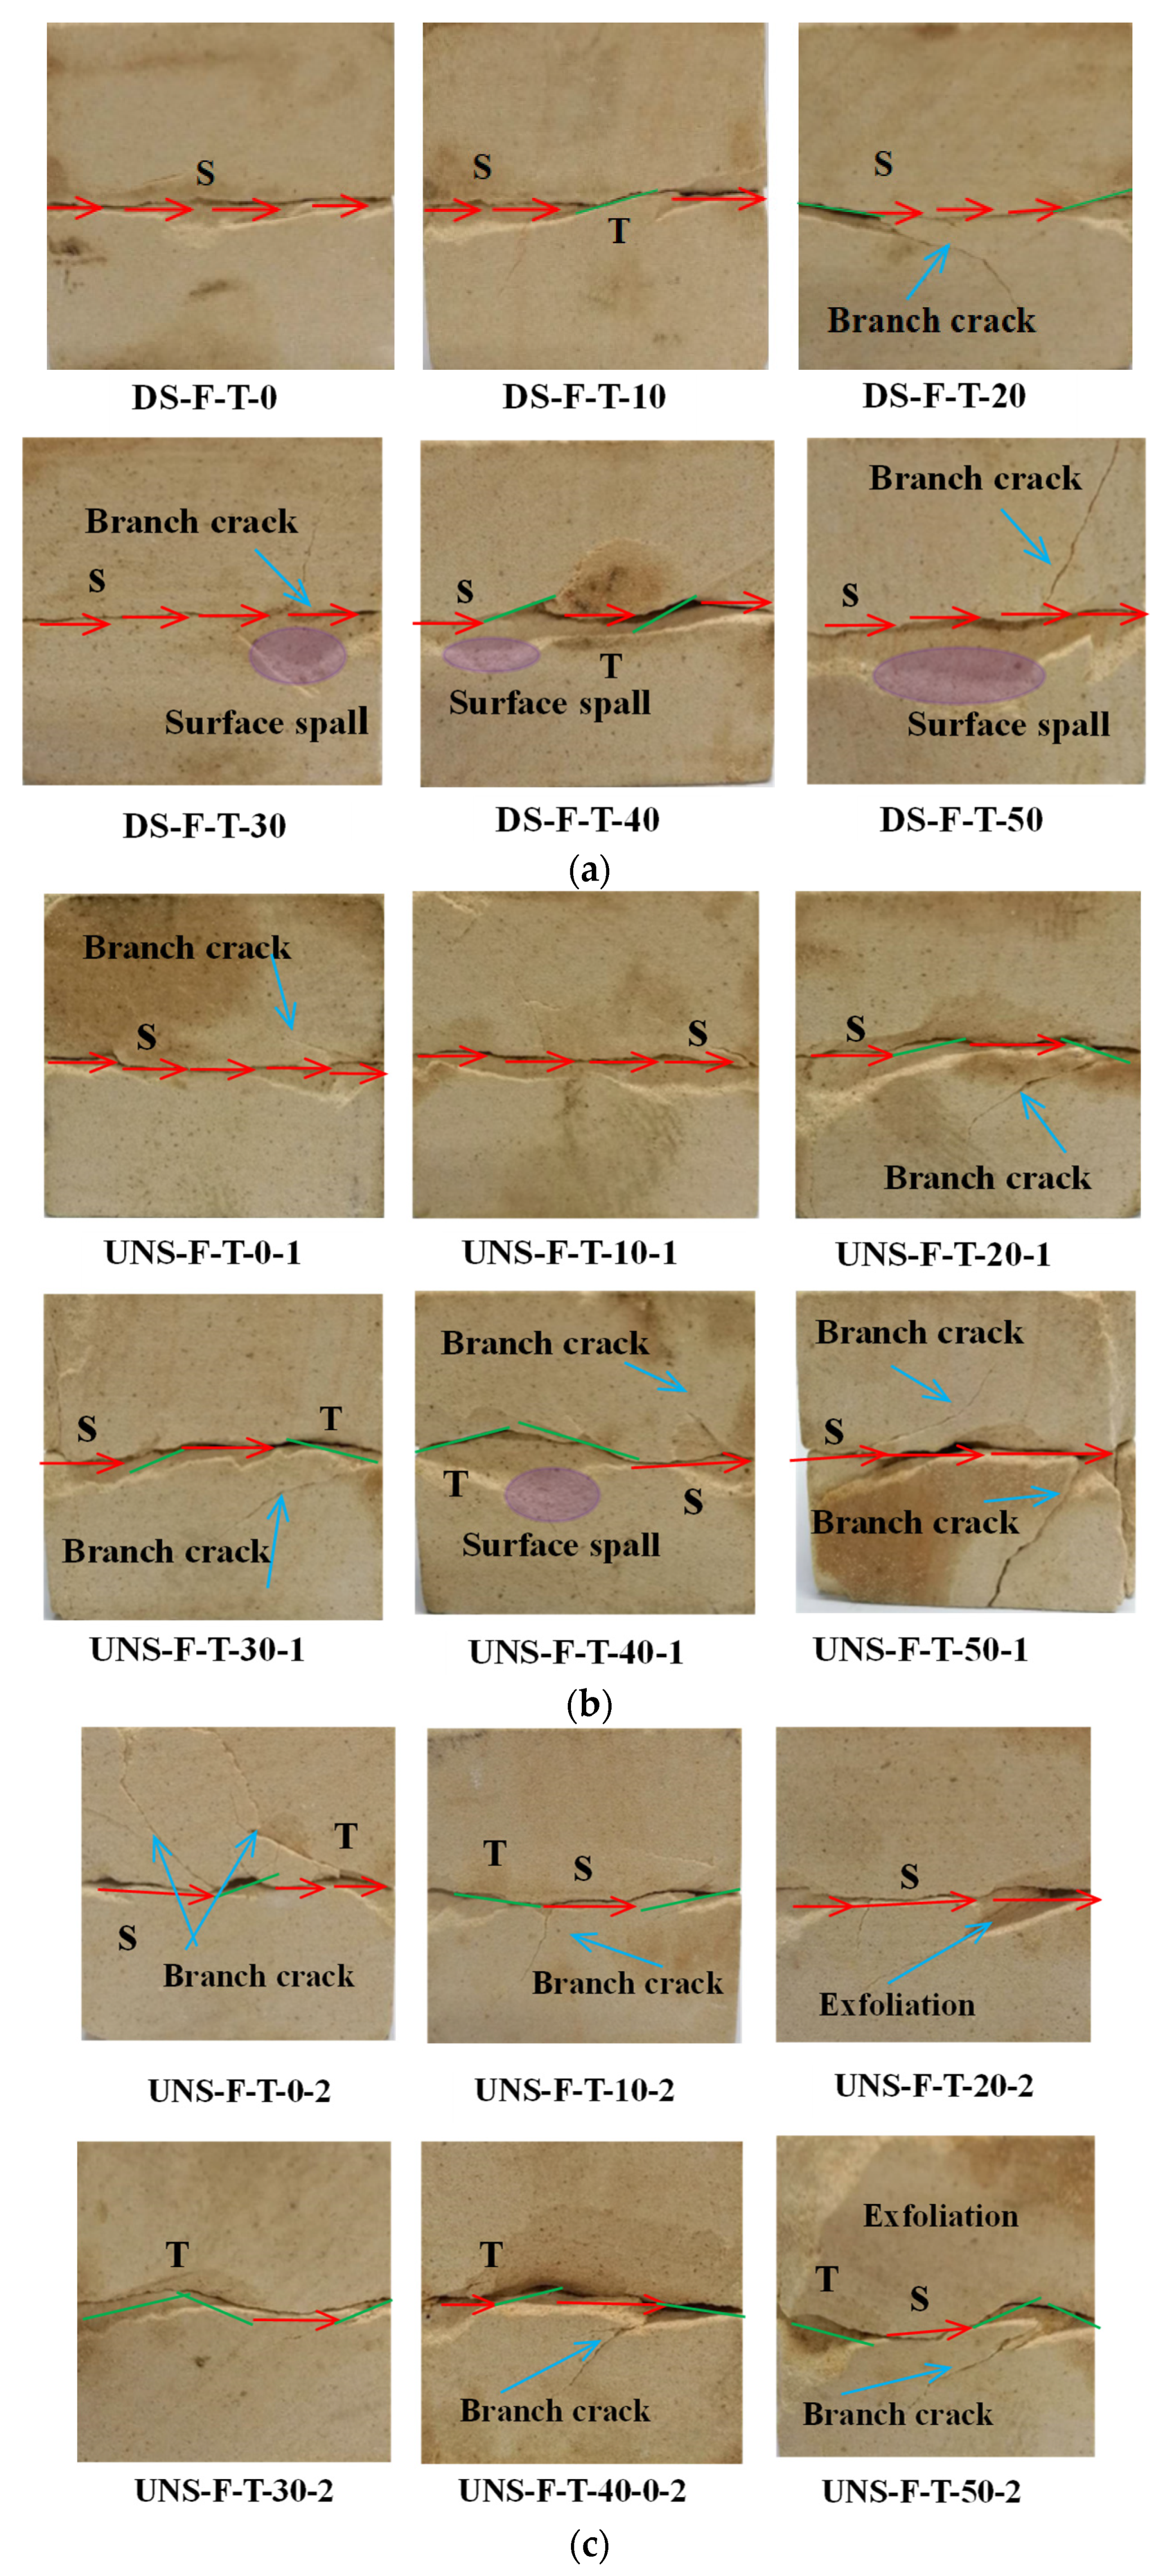
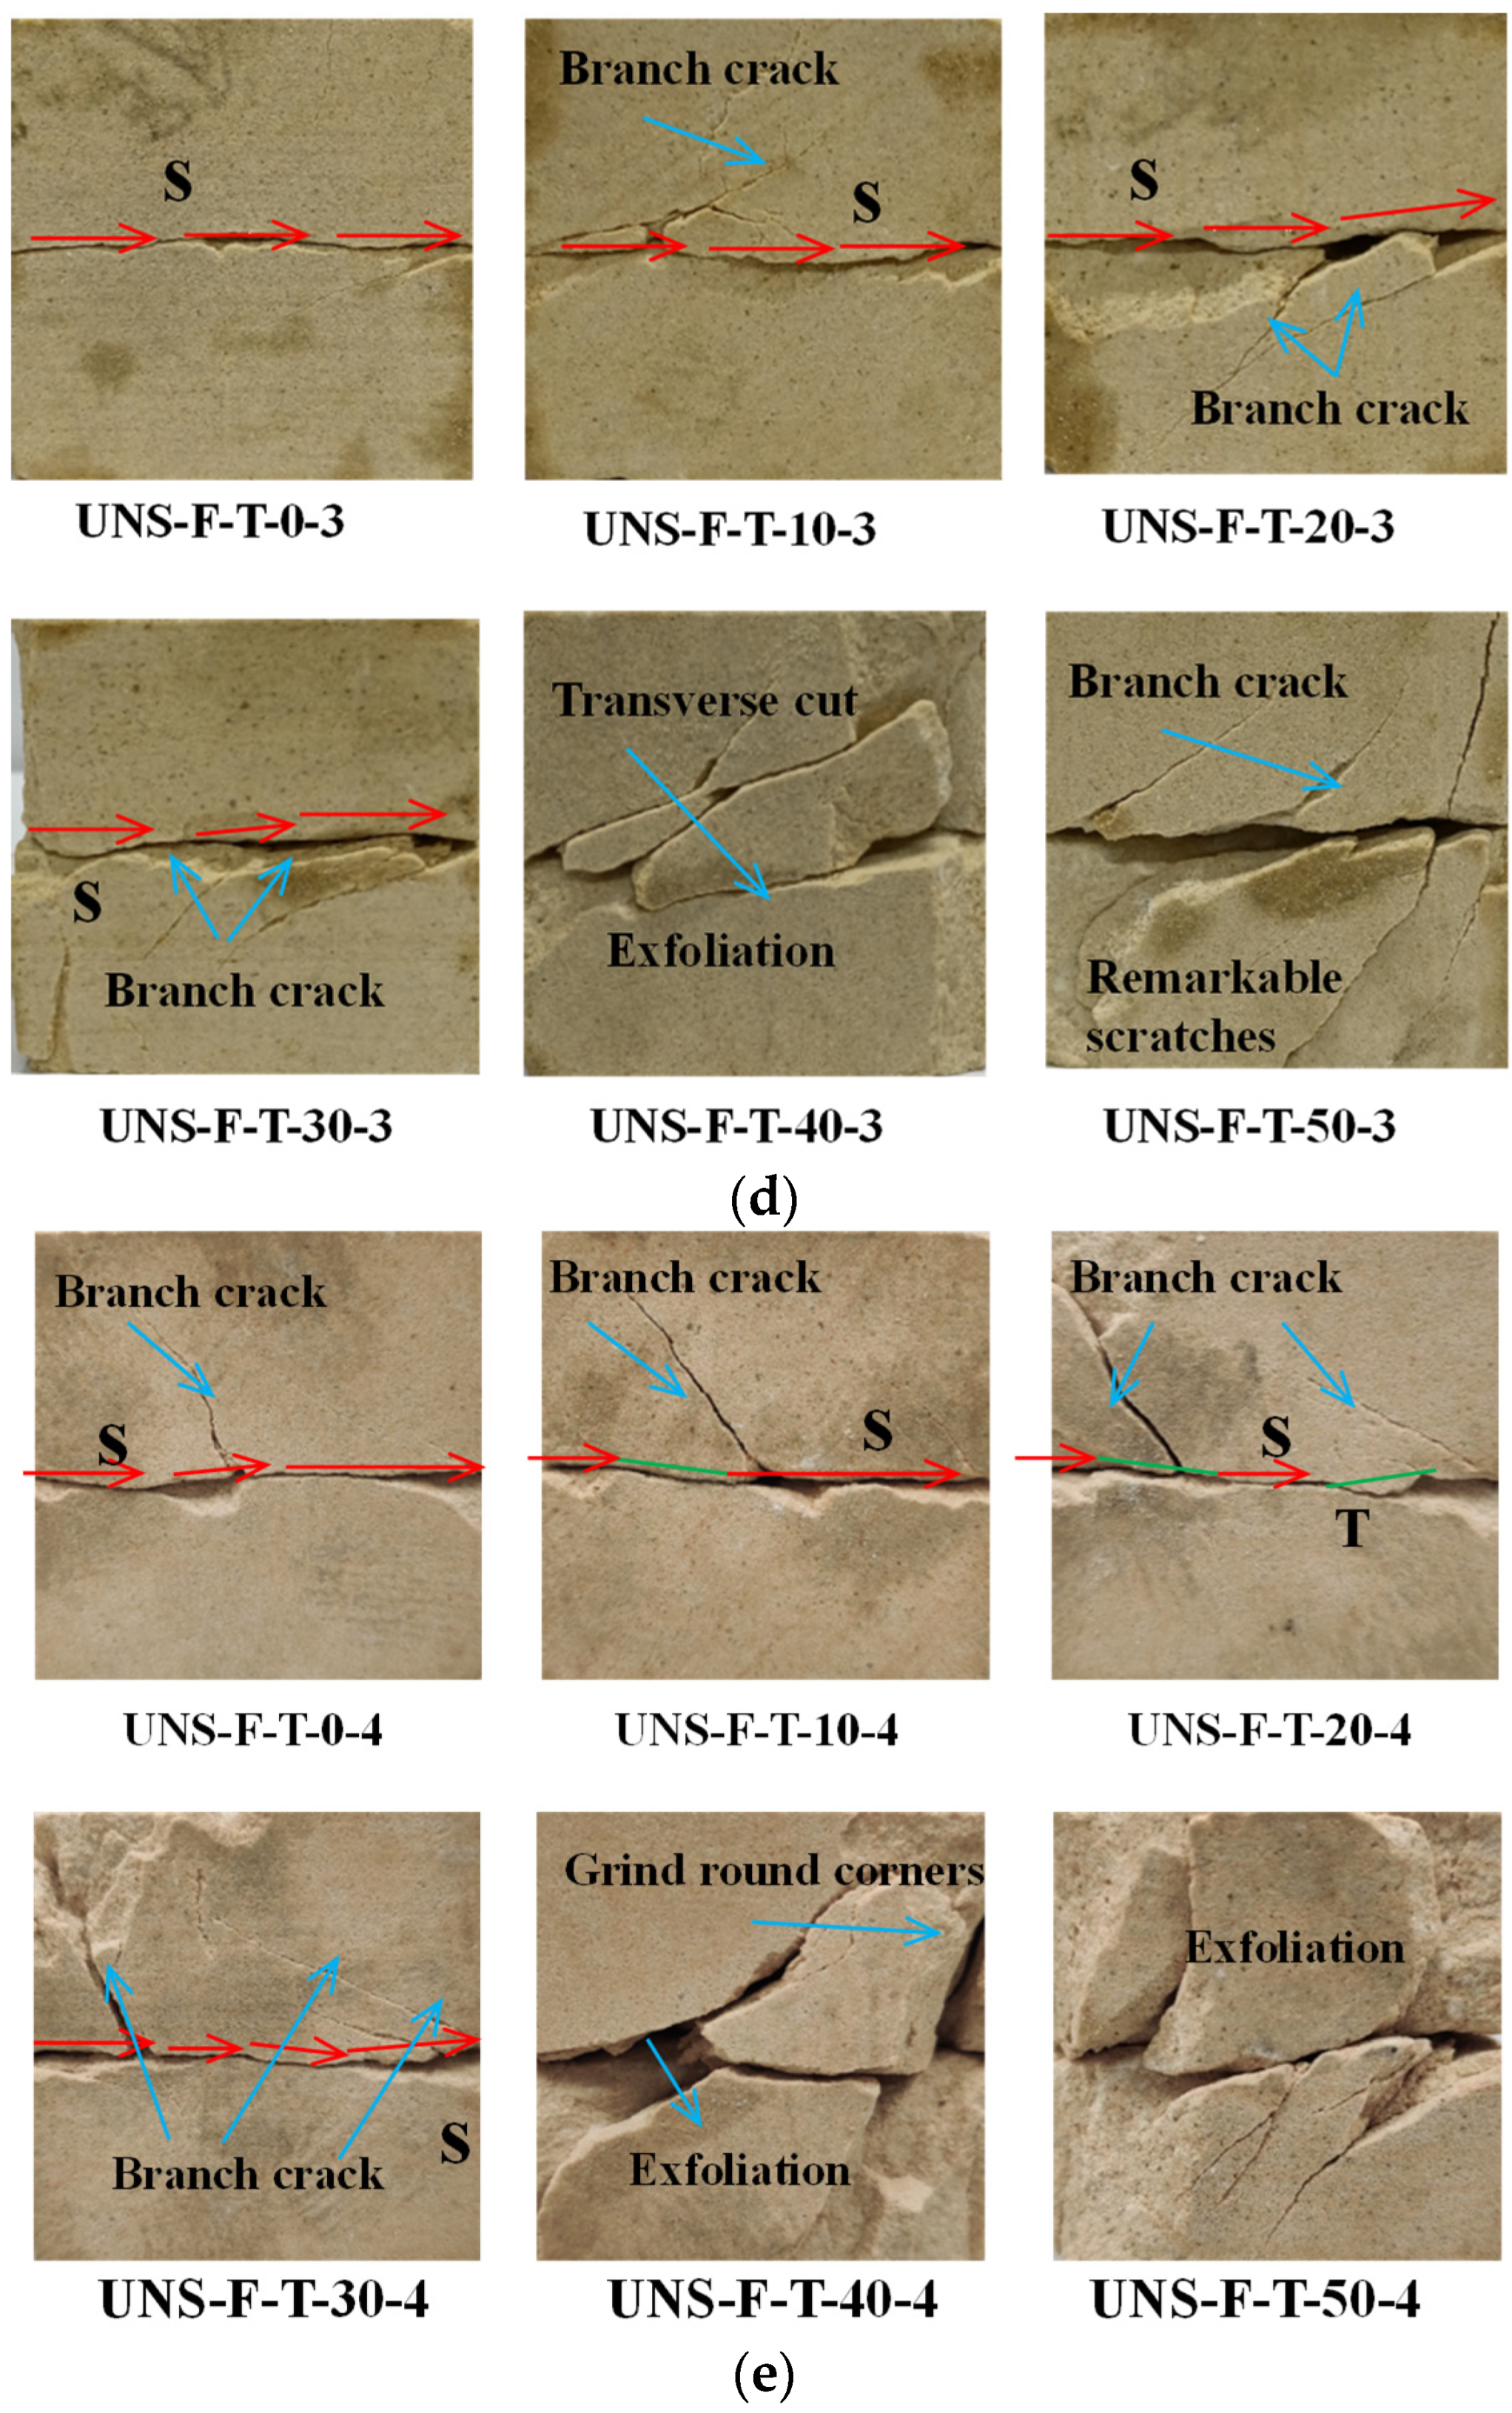
The failure patterns of the direct shear test under the unloading normal stress and the direct shear test are displayed in Figure 9. In Figure 9, “T” represents tensile crack and “S” represents shear crack. The tensile crack was characterized by grain opening degree, while the shear crack was characterized by shear displacement between grains and spallings of the rock surface.
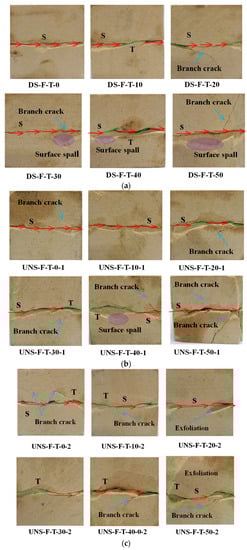
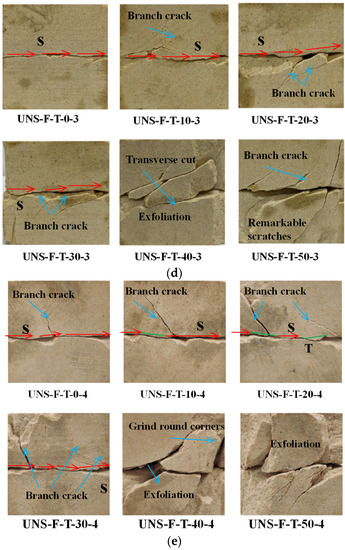
Figure 9.
Failure patterns of samples for unloading normal stress direct shear test (DSTUNS). (a) Direct shear test constant normal stress, (b) unloading normal stress direct shear test (1 MPa/min), (c) unloading normal stress direct shear test (2 MPa/min), (d) unloading normal stress direct shear test (3 MPa/min), and (e) unloading normal stress direct shear test (4 MPa/min).
Most of the cracks formed in the DSTUNS and direct shear test were uneven and S-shaped. The S-shaped cracks were not obvious in some direct shear tests (Figure 9a). However, they were particularly obvious in the DSTUNS (Figure 9c). Moreover, in the DSTUNS, all the samples showed evident surface exfoliation around the primary cracks (Figure 9b–e).
When the unloading rate was 1 MPa, as the number of freezing–thawing cycles increased, the surfaces spallings became more obvious. It indicated that higher freezing–thawing cycles led to a larger area of surface spallings. When the unloading rate increased from 1 to 4 MPa at the same freezing–thawing cycle times, the change of the surface spalling was not significant, particularly when the freezing–thawing cycle times were ≤30. Therefore, surface spallings were more sensitive to the change of the number of freezing–thawing cycles than the unloading rate in the DSTUNS when the freezing–thawing cycle times were ≤30 in the direct shear test. It was different from the DSTUNS, where surface spallings occurred obviously only on the samples as the number of freezing–thawing cycles increased in the direct shear test (Figure 9a). When the number of freezing–thawing cycles was less than 30, only slight surface spallings occurred locally. Generally speaking, from the point of view of failure morphology, the effects of the direct shear test were relatively narrow and single on the fracture surface. There were few other cracks nearby.
However, the shear fracture phenomena were obvious in the DSTUNS, such as obvious scratches, shear damage, peeling off, grinding round angle, transverse cutting, and block trituration (Figure 9). When the unloading rate was higher than 3 MPa/min, branch cracks and fragments were much higher than in other samples in the DSTUNS, especially for samples that experienced more than 40 freezing–thawing cycles. The reason was that the minerals were harvested closely with each other before being exposed to low temperatures. During freezing, a large number of microcracks appear in the rock due to the excessive frost heave stress. For samples with low freezing–thawing cycle times, the integrity of the samples after the freezing–thawing cycle tests was basically the same as that before freezing, indicating that the samples with low freezing–thawing cycles were less affected by the frost heave effect. The results were consistent with previous studies [56,57]. It was shown that the frost damage of high-frequency freezing–thawing rock was more serious. As a whole, the results indicated that the unloading rate and the number of freezing–thawing cycles affected the failure pattern of the rock sample significantly in both the DSTUNS and the direct shear test, based upon experimental results.
4. Fracture Surface Roughness
4.1. D Roughness Parameters
Belem et al. [59] proposed five three-dimensional roughness parameters to describe the roughness characteristics of the fracture surfaces. The four parameters are: the 3D average inclination angle, , the surface relative roughness coefficient, , the surface distortion parameter, , and the surface average gradient mode, . When scanning the fracture surface using an optical scanner, the X, Y, and Z coordinates of multiple points were recorded in the point cloud file. The three adjacent points obtained by scanning can form a triangular element plane. The angle between the normal direction of the triangle and the Z coordinates was . The mean value of the 3D average inclination angle was used to describe the roughness of the fracture surface, which represents the average spatial direction of the rough fracture surface.
4.2. Triangulated Point Cloud
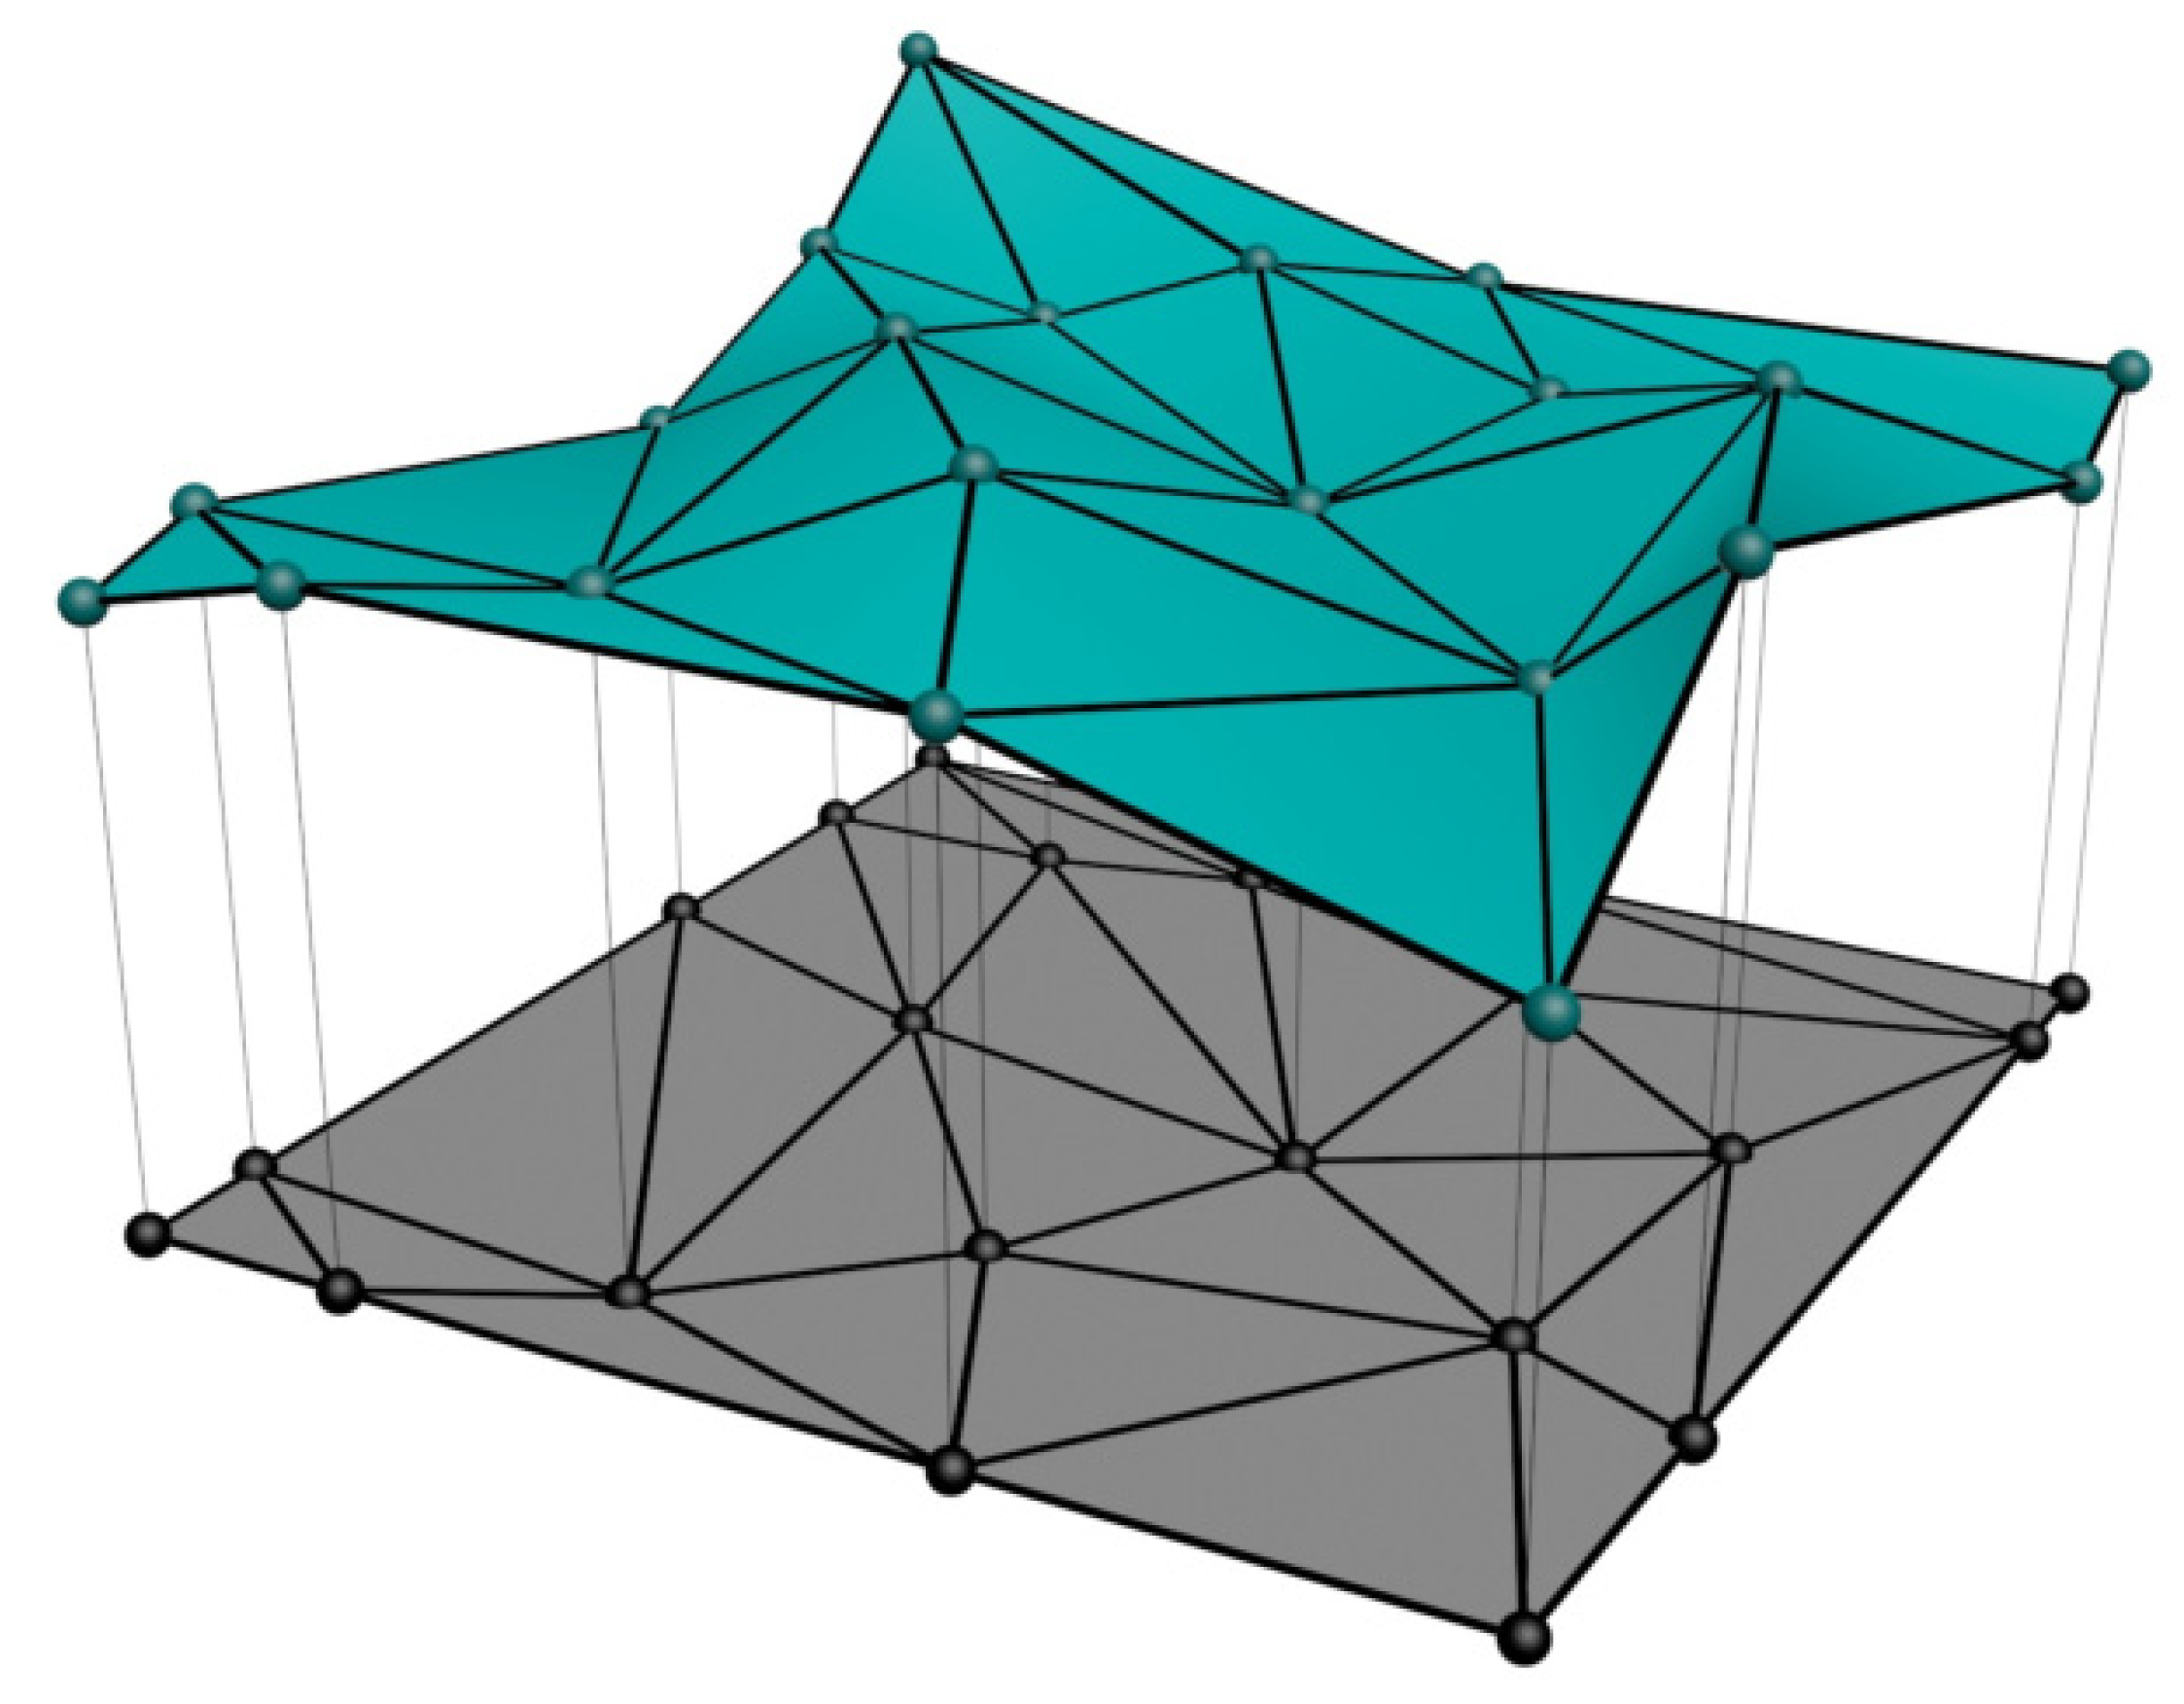
The point cloud was obtained when scanning the rock fracture surface by a Cronos three-dimensional optical scanner. It was necessary to calculate the spatial parameters of the triangular element by the coordinates of the points of adjacent rows and columns in the process of 3D roughness parameter calculation, but the point cloud could not be realized in the calculation process. As a result, it was necessary to triangulate the point cloud through MATLAB program language. Then, the effect of tensile stress on fracture surface roughness was analyzed. The schematic diagram of triangulated point cloud treatment is shown in Figure 10 [60]. Based on the MATLAB program language, the flow chart of calculating the 3D roughness parameters of the rock fracture surface was plotted in Figure 11.
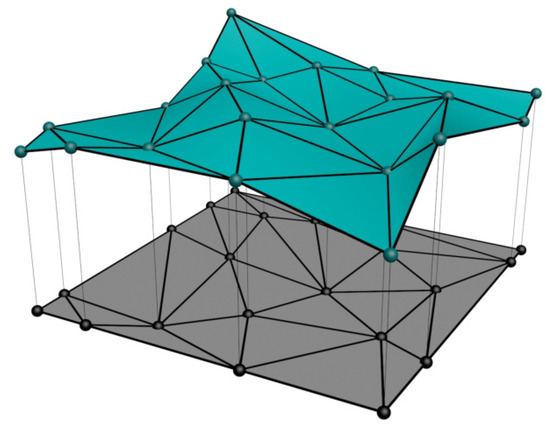
Figure 10.
Schematic diagram of a triangulated irregular network (TIN) and its planar projection.
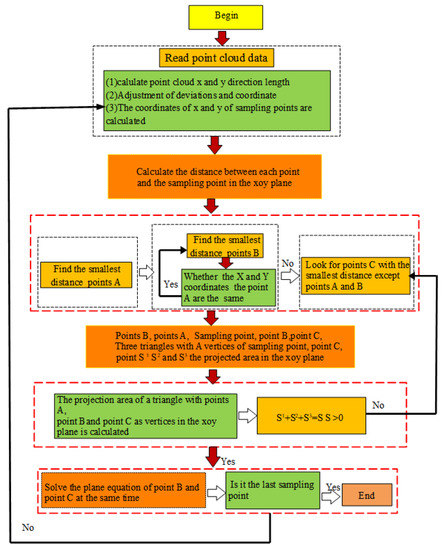
Figure 11.
Flow chart for the process of calculating the 3D roughness parameters.
The morphology of the fracture surface before and after triangulated treatment was shown in Figure 12. It could be seen from the diagram that the point clouds after triangulated treatment were arranged regularly, and the section morphology after treatment was basically no different from that before treatment. Therefore, the above method could be used to triangulate the point cloud and select the sampling interval according to the needs. After the triangulated point cloud, the morphology of the section did not change, so it could be used for the microscopic characteristic analysis of the fracture surface.
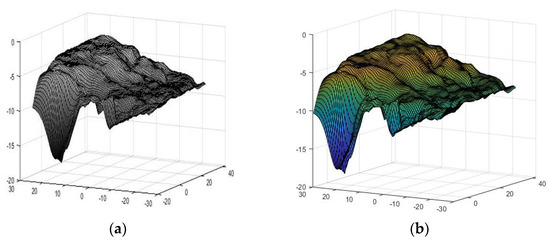
Figure 12.
Comparison of the fracture surfaces before and after the triangulated point cloud (mm): (a) without triangulated point cloud and (b) triangulated point cloud.
4.3. Roughness Variation Rule
Under different freezing–thawing cycle times and unloading rates (1 MPa/min, 4 MPa/min), the roughness parameters θS1, Rs1, TS1, Z2S1 (1 MPa/min), θS4, Rs4, TS4, and Z2S4 (4 MPa/min) of the fracture surface of sandstone samples are as shown in Table 2. The three-dimensional inclination angle and the roughness correlation coefficient of the fracture surface increased as the number of freezing–thawing cycles increased at the 1 and 4 MPa/min unloading rates. The three-dimensional inclination angle and the roughness correlation coefficient of the fracture surface decreased as the unloading rate increased at the same freezing–thawing cycle times. The distortion coefficient of the fracture surface increased and the first derivative root mean square of the fracture surface decreased as the freezing–thawing cycle times increased at the same unloading rate. Under the same freezing–thawing cycle, the distortion coefficient and the first derivative root mean square of the fracture surface decreased as the unloading rate increased.
Table 2.
3D roughness parameters.
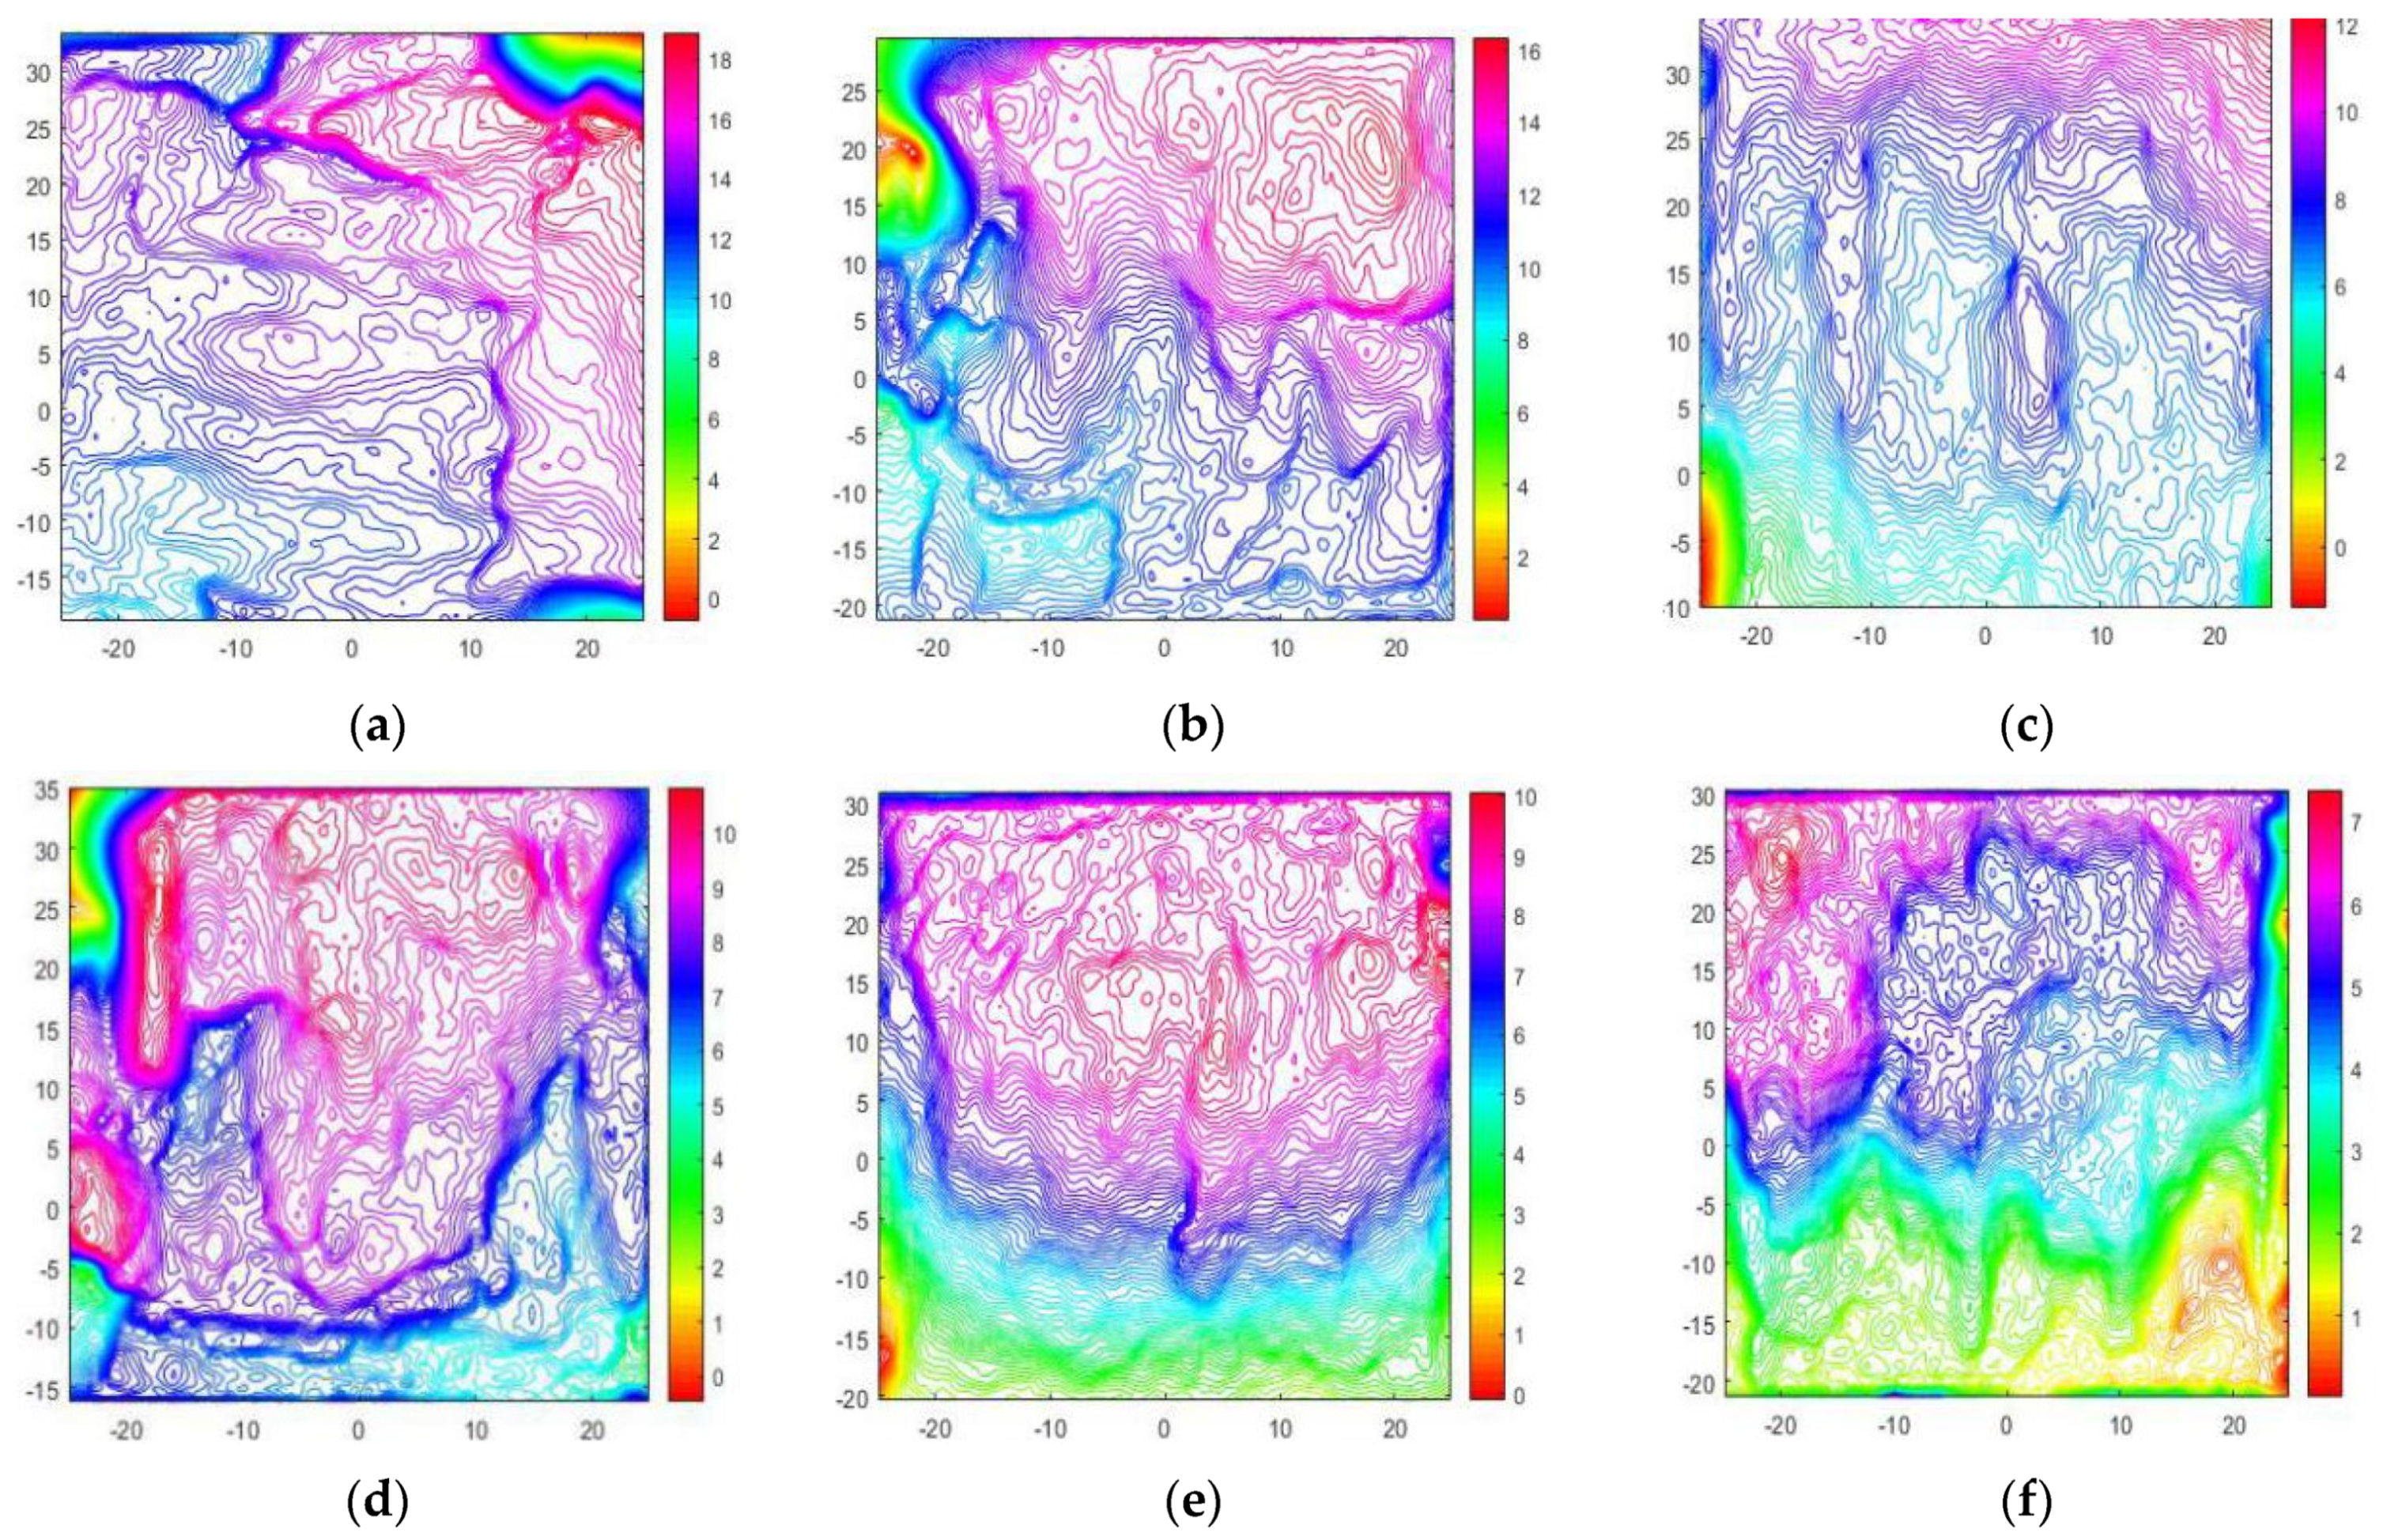
It could be seen from Figure 13 that the fluctuation of the fracture surface increased gradually as the number of freezing–thawing cycles increased at the 4 MPa/min unloading rate. The number of freezing–thawing cycles was reduced from 50 to 0, and the maximum elevation on the fracture surface was reduced from about 18 to 7 mm. It indicated that the freezing–thawing cycle action has a significant influence on the roughness of the fracture surface of samples in the DSTUNS. Essentially speaking, the freezing–thawing cycle action caused freezing–thawing damage between mineral grains in sandstone samples.

Figure 13.
Isopleths of the fracture surface under the 4 MPa/min unloading rate. (a) UNS-F-T-50-4, (b) UNS-F-T-40-4, (c) UNS-F-T-30-4, (d) UNS-F-T-20-4, (e) UNS-F-T-10-4, and (f) UNS-F-T-0-4.
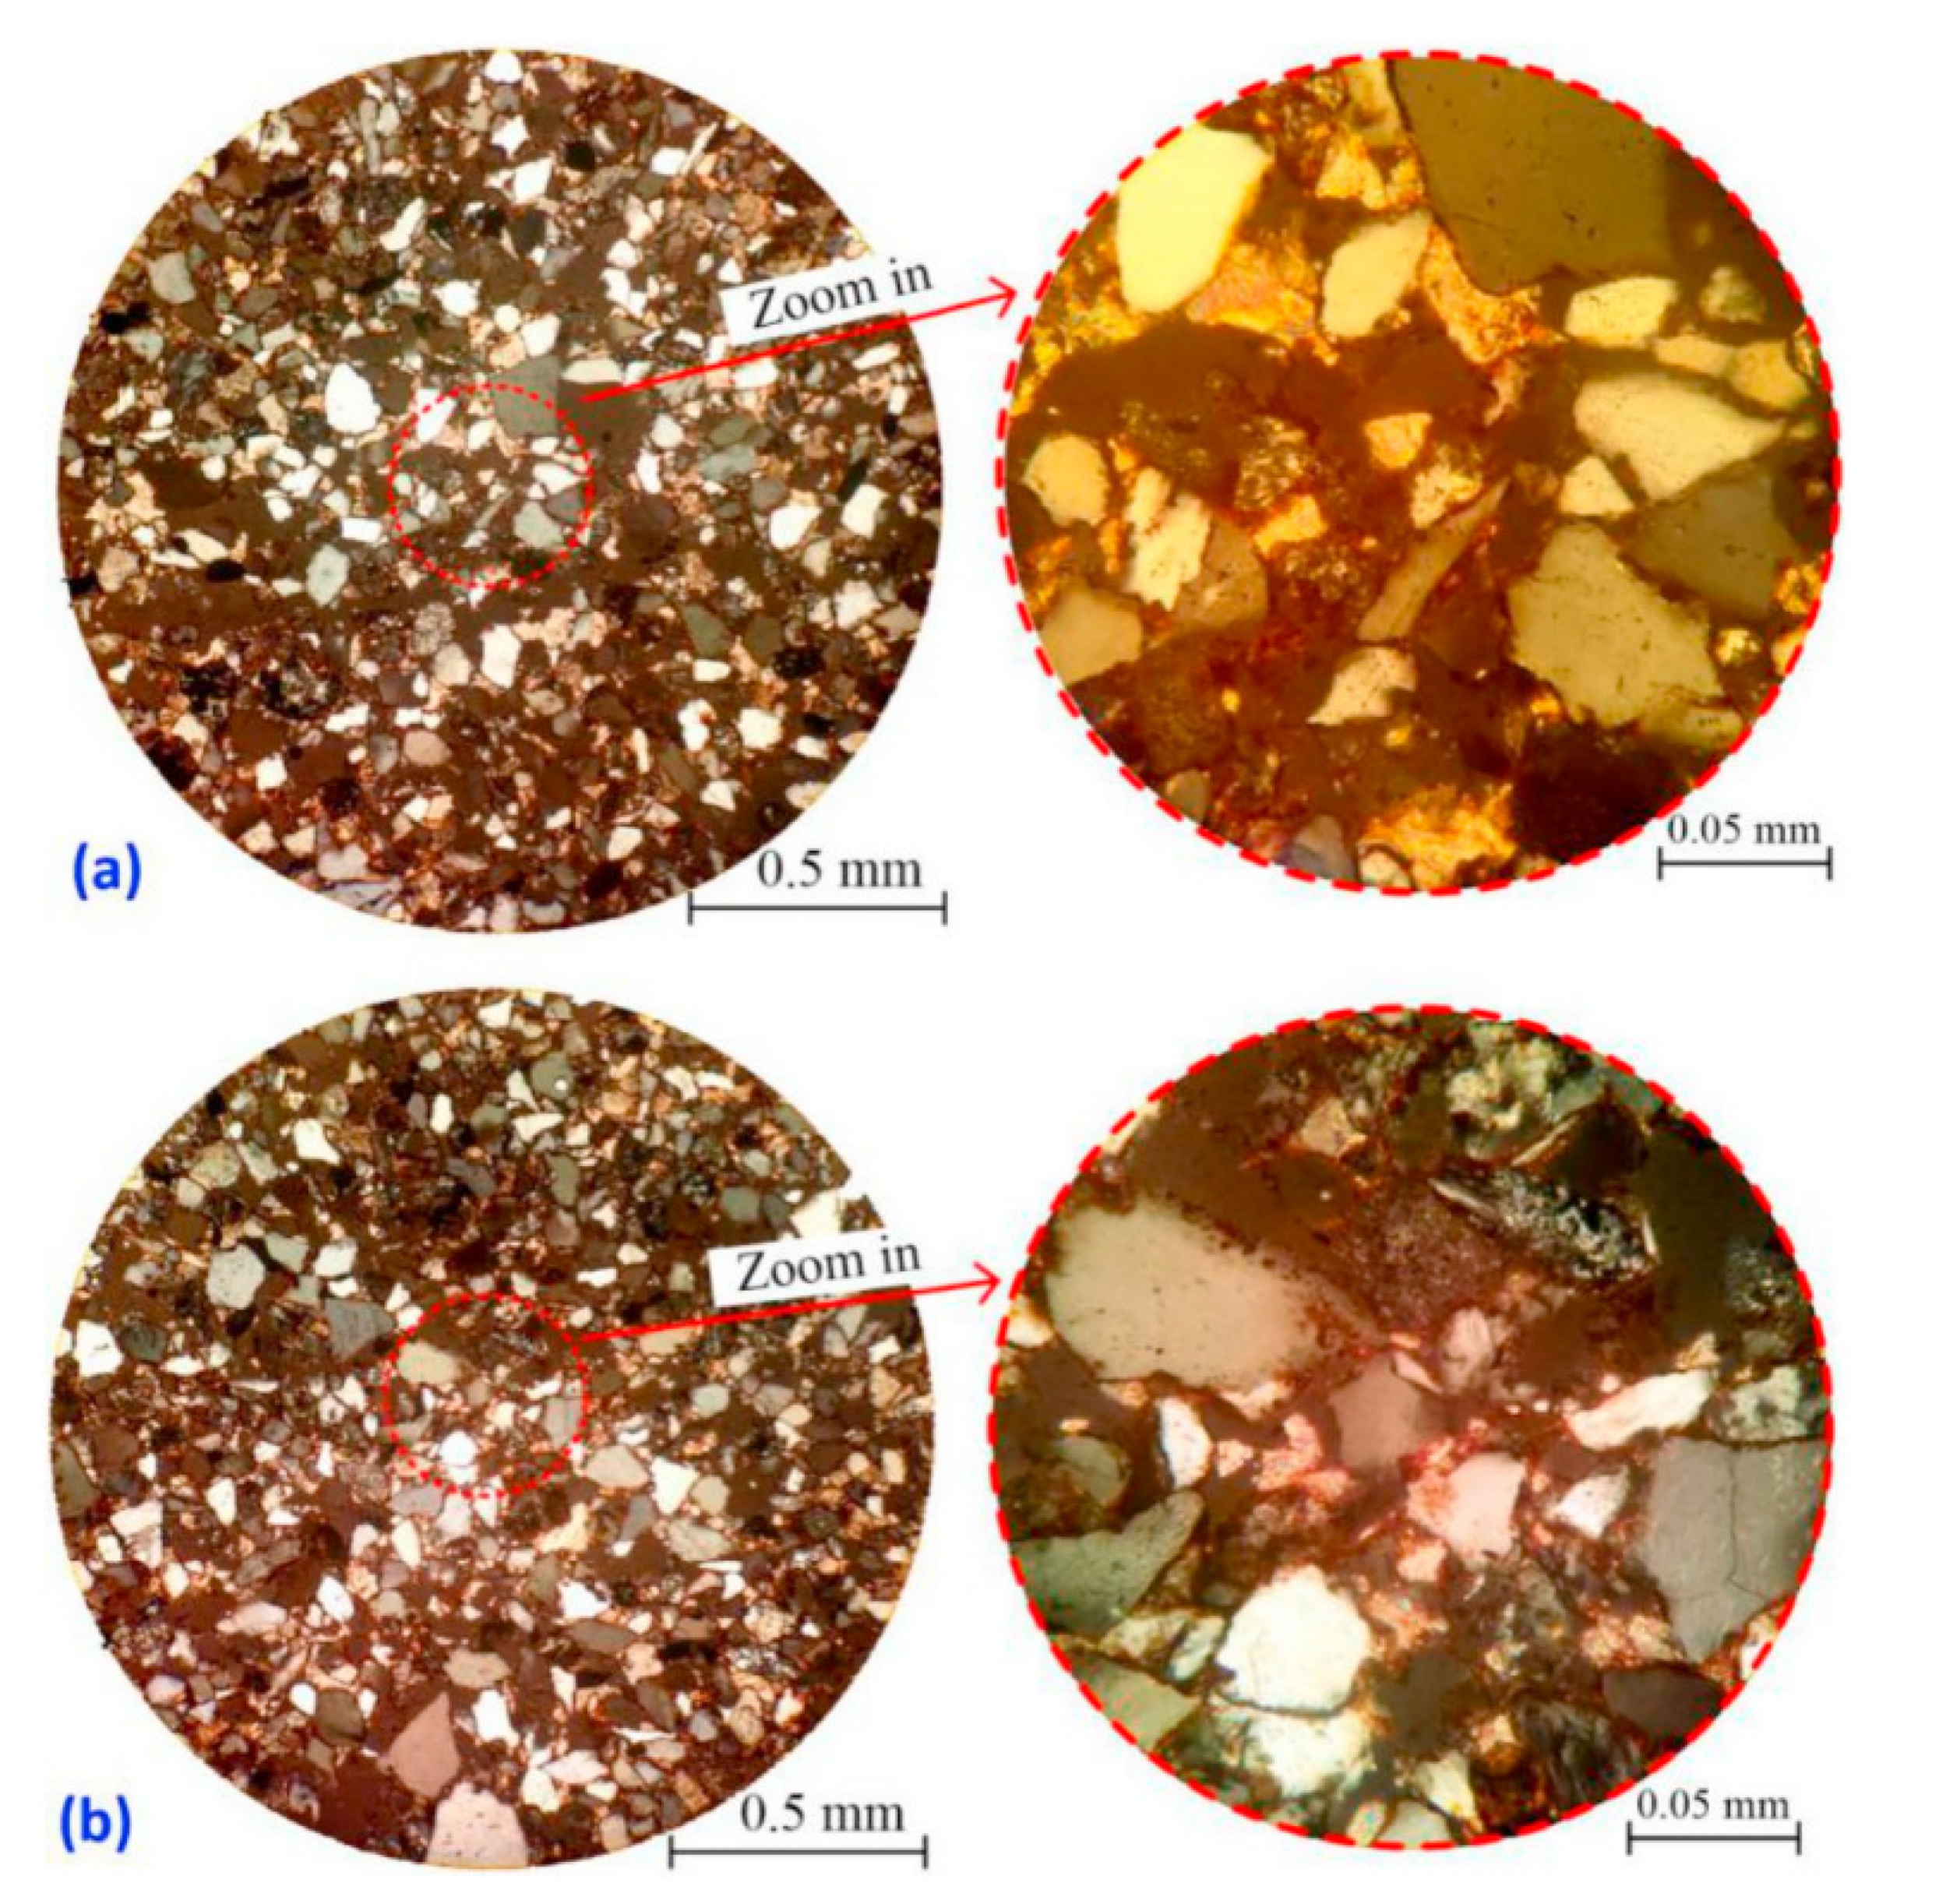
Previous studies have shown that for low permeability rocks, the local pore frost heave pressure can reach 60 MPa. This pressure greatly exceeds the tensile strength of the rock, and may cause cracks to initiate and propagate at the pore boundaries while the stress balance is maintained throughout the frozen rock, as shown in Figure 14 [58]. Figure 14 presents microscopic images showing the distribution characteristics of mineral particles before and after freezing for Wuding sandstone. The minerals were previously tightly packed together before exposure to the low temperature, and considerable trans-granular microcracks were observed when exposed to the low temperature. The findings were consistent with previous studies.
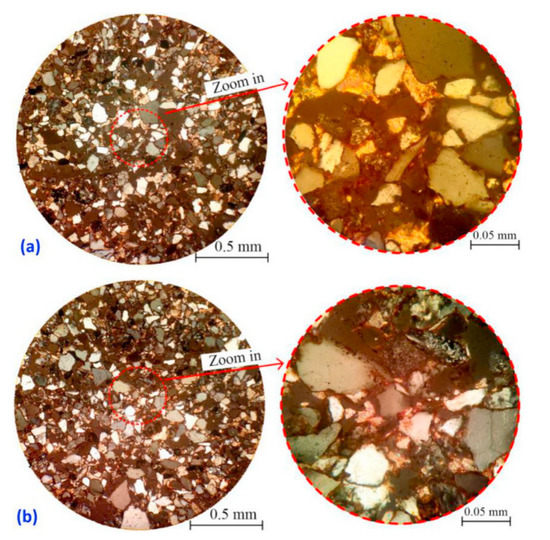
Figure 14.
Microscopic images of Wuding sandstone: (a) before freezing and (b) after freezing [58].
Therefore, the frozen rock can also be assumed as an elastic porous material, and the ice pressure could be theoretically deduced from the coupling expansion relationship between rock pores and ice. The pores were considered to be spheres uniformly distributed in the rock, so the ice pressure can be derived from the following equation [61]:
where, μi is the Poisson’s ratio of ice, n is the porosity, μs is the Poisson’s ratio of porous rock, Tf is the freezing temperature of the rock sample, Ei is the elastic modulus of ice, Es is the elastic modulus of porous rock, and Tm is the freezing point of bulk water at normal pressure. Furthermore, κ is the conversion coefficient defining the relationship between the elastic modulus of the rock matrix and the elastic modulus of porous rock. It could be expressed as:
Equation (1) showed that the ice pressure in the pores of rocks was closely related to porosity and the inherent mechanical properties of the rock itself. It can be seen that the ice pressure could be equivalent to the effective tensile stress on the rock surface [62]. When the effective tensile stress on the rock was bigger than the strength of pores or the bond strength between mineral grains, micro-cracks would initiate and propagate. This process was accumulated during the freezing–thawing cycle action of sandstone samples. Then, the accumulated damages in freezing–thawing cycle samples were not uniformly distributed, which could induce different roughness of the shear surface. Moreover, the higher the number of freezing–thawing cycles, the greater the roughness of the failure surface in the DSTUNS.
5. Conclusions
This paper discussed the shear mechanical behavior of sandstone after freezing–thawing cycle action in the DSTUNS. The effects of the different freezing–thawing cycle times and different unloading rates on the normal and shear characteristic displacements, the failure pattern, and the fracture surface roughness were investigated. The conclusions are summarized as follows:
(1) The shear deformation changed obviously, and the shear deformation of sandstone samples exhibited an upward trend as the numbers of freezing–thawing cycles increased. It indicated that samples had different degrees of deterioration after freezing–thawing cycles under the direct shear test. The different freezing–thawing cycle times have little effect on normal displacement, but the effect on shear displacement was obvious. This observation suggested that a higher freezing–thawing cycle can induce a larger shear displacement in the DSTUNS. The Dnf and Dnu comprised elastic deformation release and shear dilatancy deformation in the DSTUNS. Furthermore, the Dnf and Dnu increased significantly only when the numbers of freezing–thawing cycles were unchanged for a large unloading rate. It indicated that the unloading rate has a large impact on the shear dilatancy when the direct shear test and the DSTUNS for samples were exposed to freezing–thawing cycles.
(2) The unloading rate and the number of freezing–thawing cycles affected the failure pattern of the rock sample significantly in both the DSTUNS and the direct shear test. It showed that the frost damage of high-frequency freezing–thawing rock was more serious.
(3) The three-dimensional inclination angle and the roughness correlation coefficient of the fracture surface increased as the number of freezing–thawing cycles increased at the same unloading rate. The three-dimensional inclination angle and the roughness correlation coefficient of the fracture surface decreased as the unloading rate increased at the same freezing–thawing cycle times. The distortion coefficient of the fracture surface increased and the surface average gradient mode of the fracture surface decreased as the freezing–thawing cycle times increased at the same unloading rate. The distortion coefficient and the surface average gradient mode of the fracture surface decreased as the unloading rate increased at the same freezing–thawing cycle times.
Author Contributions
Conceptualization, S.L. and J.B.; Data curation, S.L.; Formal analysis, C.W.; Funding acquisition, C.W. and J.B.; Investigation, S.L.; Methodology, J.B.; Project administration, J.B.; Resources, J.B.; Software, K.Z.; Supervision, C.W. and J.B.; Validation, J.B. and C.W.; Visualization, J.L.; Writing (original draft), S.L.; Writing (review and editing), S.L., F.G. and K.Z. All authors have read and agreed to the published version of the manuscript.
Funding
This research was funded by the National Natural Science Foundation of China [52164001, 52064006, and 52004072], the Science and Technology Support Project of Guizhou [[2020]4Y044, [2021]N404, and [2021]N511], Talents of Guizhou University [Grant No. 201901], the Special Research Funds of Guizhou University [Grant Nos. 201903, 202011, 202012], Guizhou University Cultivation Program [[2020] No. 1], and the Higher Education research project of Guizhou University [GDGJYJ2021009]And The APC was funded by Guizhou University.
Institutional Review Board Statement
Not applicable.
Informed Consent Statement
Not applicable.
Data Availability Statement
Some or all data, models, or codes that support the findings of this study are available from the corresponding author (fgan@gzu.edu.cn.) upon reasonable request.
Acknowledgments
This work was supported by the National Natural Science Foundation of China (52164001, 52064006, and 52004072), the Science and Technology Support Project of Guizhou ([2020]4Y044, [2021]N404, and [2021]N511), Talents of Guizhou University (Grant No. 201901), the Special Research Funds of Guizhou University (Grant Nos. 201903, 202011, 202012), Guizhou University Cultivation Program ([2020] No. 1), and the Higher Education research project of Guizhou University (GDGJYJ2021009).
Conflicts of Interest
We declare that we do not have any commercial or associative interest that represents a conflict of interest in connection with the work submitted.
References
- Bi, J.; Zhou, X.P.; Qian, Q.H. The 3D Numerical Simulation for the Propagation Process of Multiple Pre-existing Flaws in Rock-Like Materials Subjected to Biaxial Compressive Loads. Rock Mech. Rock Eng. 2016, 49, 1611–1627. [Google Scholar] [CrossRef]
- Zhang, J.B.; Fu, H.L.; Hang, Z.; Wu, Y.; Chen, W.; Shi, Y. Experimental study on the tensile strength and failure characteristics of transversely isotropic rocks after freeze-thaw cycles. Cold Reg. Sci. Technol. 2019, 163, 68–77. [Google Scholar] [CrossRef]
- Zhao, Y.; Zhang, Y.; Yang, H.; Liu, Q.; Tian, G. Experimental study on relationship between fracture propagation and pumping parameters under constant pressure injection conditions. Fuel 2022, 307, 121789. [Google Scholar] [CrossRef]
- Zhou, X.P.; Niu, Y.; Zhang, Z.J.; Shen, X.C.; Zheng, Y.; Berto, F. Experimental study on effects of freeze-thaw fatigue damage on the cracking behaviors of sandstone containing two unparallel fissures. Fatigue Fract. Eng. Mater. Struct. 2019, 42, 1322–1340. [Google Scholar] [CrossRef]
- Wu, Z.J.; Fan, L.F.; Liu, Q.S.; Ma, G.W. Micro-mechanical modeling of the macro-mechanical response and fracture behavior of rock using the numerical manifold method. Eng. Geol. 2017, 225, 49–60. [Google Scholar] [CrossRef]
- Huang, S.B.; Liu, Y.Z.; Guo, Y.L.; Zhang, Z.; Cai, Y. Strength and failure characteristics of rock-like material containing single crack under freeze-thaw and uniaxial compression. Cold Reg. Sci. Technol. 2019, 162, 1–10. [Google Scholar] [CrossRef]
- Wu, Z.J.; Xu, X.Y.; Liu, Q.S.; Yang, Y. A zero-thickness cohesive element-based numerical manifold method for rock mechanical behavior with micro-voronoi grains. Eng. Anal. Bound. Elem. Methods 2018, 96, 94–108. [Google Scholar] [CrossRef]
- Zhao, Y.; Wang, C.L.; Ning, L.; Zhao, H.F.; Bi, J. Pore and fracture development in coal under stress conditions based on nuclear magnetic resonance and fractal theory. Fuel 2022, 309, 122112. [Google Scholar] [CrossRef]
- Fang, W.; Jiang, N.; Luo, X.D. Establishment of damage statistical constitutive model of loaded rock and method for determining its parameters under freeze-thaw condition. Cold Reg. Sci. Technol. 2019, 160, 31–38. [Google Scholar] [CrossRef]
- Yang, X.R.; Jiang, A.N.; Li, M.J. Experimental investigation of the time-dependent behavior of quartz sandstone and quartzite under the combined effects of chemical erosion and freeze–thaw cycles. Cold Reg. Sci. Technol. 2019, 161, 51–62. [Google Scholar] [CrossRef]
- Wang, Z.; Zhu, Z.D.; Zhu, S. Thermo-mechanical-water migration coupled plastic constitutive model of rock subjected to freeze-thaw. Cold Reg. Sci. Technol. 2019, 161, 71–80. [Google Scholar] [CrossRef]
- Zhao, Y.; He, P.F.; Zhang, Y.F.; Wang, C.L. A new criterion for a toughness-dominated hydraulic fracture crossing a natural frictional interface. Rock Mech. Rock Eng. 2019, 52, 2617–2629. [Google Scholar] [CrossRef]
- Liu, Q.S.; Qian, Z.C.; Wu, Z.J. Micro/Macro Physical and Mechanical Variation of Red Sandstone Subjected to Cyclic Heating and Cooling: An Experimental Study. Bull. Eng. Geol. Environ. 2017, 78, 1485–1499. [Google Scholar] [CrossRef]
- Wang, Y.; Feng, W.K.; Wang, H.J.; Han, J.; Li, C. Geomechanical and acoustic properties of intact granite subjected to freeze-thaw cycles during water-ice phase transformation in beizhan’s open pit mine slope, Xinjiang, China. Water 2019, 11, 2309. [Google Scholar] [CrossRef] [Green Version]
- Gao, F.; Cao, S.P.; Zhou, K.P.; Lin, Y.; Zhu, L. Damage characteristics and energy-dissipation mechanism of frozen-thawed sandstone subjected to loading. Cold Reg. Sci. Technol. 2020, 169, 102920. [Google Scholar] [CrossRef]
- Liu, H.Y.; Yuan, X.P.; Xie, T.C. A damage model for frost heaving pressure in circular rock tunnel under freezing-thawing cycles. Tunn. Undergr. Space Technol. 2019, 83, 401–408. [Google Scholar] [CrossRef]
- Fogue-Djombou, Y.I.; Corn, S.; Clerc, L.; Salze, D.; Garcia-Diaz, E. Freeze-thaw resistance of limestone roofing tiles assessed through impulse vibration monitoring and finite element modeling in relation to their microstructure. Constr. Build. Mater. 2019, 205, 656–667. [Google Scholar] [CrossRef]
- Seyed Mousavi, S.Z.; Tavakoli, H.; Moarefvand, P.; Rezaei, M. Assessing the effect of freezing-thawing cycles on the results of the triaxial compressive strength test for calc-schist rock. Int. J. Rock Mech. Min. Sci. 2019, 123, 104090. [Google Scholar] [CrossRef]
- Niu, Y.; Zhou, X.P.; Zhang, J.Z.; Qian, Q.H. Experimental study on crack coalescence behavior of double unparallel fissure-contained sandstone specimens subjected to freeze-thaw cycles under uniaxial compression. Cold Reg. Sci. Technol. 2019, 158, 166–181. [Google Scholar] [CrossRef]
- Li, J.L.; Kaunda, R.B.; Zhou, K.P. Experimental investigations on the effects of ambient freeze-thaw cycling on dynamic properties and rock pore structure deterioration of sandstone. Cold Reg. Sci. Technol. 2018, 154, 133–141. [Google Scholar] [CrossRef]
- Wu, F.; Liu, J.; Zou, Q.L.; Li, C.B.; Chen, J.; Gao, R.B. A triaxial creep model for salt rocks based on variable-order fractional derivative. Mech. Time-Depend. Mater. 2020, 25, 101–118. [Google Scholar] [CrossRef]
- Yuan, X.Q.; Liu, H.Y.; Liu, J.P. A damaging model of jointed rock under coupled action of freezing and thawing. Rock Mech. Rock Eng. 2015, 34, 1602–1611. [Google Scholar]
- Wu, F.; Zhang, H.; Zou, Q.L.; Li, C.; Gao, R. Viscoelastic-plastic damage creep model for salt rock based on fractional derivative theory. Mech. Time-Depend. Mater. 2020, 150, 103600. [Google Scholar] [CrossRef]
- Zhang, H.M.; Meng, X.Z.; Yang, G.S. A study on mechanical properties and damage model of rock subjected to freeze-thaw cycles and confining pressure. Cold Reg. Sci. Technol. 2020, 174, 103056. [Google Scholar] [CrossRef]
- Zhao, Y.; Du, C.; Bi, J.; Wang, C.L. Experimental investigation of triaxial compression and permeability of gritstone in geothermal environment. Bull. Eng. Geol. Environ. 2021, 80, 6971–6988. [Google Scholar] [CrossRef]
- Zhang, J.Z.; Zhou, X.P. AE event rate characteristics of flawed granite: From damage stress to ultimate failure. Geophys. J. Int. 2020, 222, 795–814. [Google Scholar] [CrossRef]
- Zhang, H.M.; Yang, G.S. Research on damage model of rock under coupling action of freeze-thaw and load. Chin. J. Rock Mech. Rock Eng. 2010, 29, 471–476. [Google Scholar]
- Zhao, Y.; Wang, C.L.; Bi, J. Analysis of fractured rock permeability evolution under unloading conditions by the model of elastoplastic contact between rough surfaces. Rock Mech. Rock Eng. 2020, 53, 5795–5808. [Google Scholar] [CrossRef]
- Zhou, X.P.; Bi, J.; Qian, Q.H. Numerical simulation of crack growth and coalescence in rock-like materials containing multiple pre-existing flaws. Rock Mech. Rock Eng. 2015, 48, 1097–1114. [Google Scholar] [CrossRef]
- Zhou, X.P.; Cheng, H.; Feng, Y.F. An experimental study of crack coalescence behaviour in rock-like materials containing multiple flaws under uniaxial compression. Rock Mech. Rock Eng. 2014, 47, 1961–1986. [Google Scholar] [CrossRef]
- Zhou, X.P.; Zhang, Y.X.; Ha, Q.L.; Zhu, K.S. Micromechanical modelling of the complete stress-strain relationship for crack weakened rock subjected to compressive loading. Rock Mech. Rock Eng. 2008, 41, 747–769. [Google Scholar] [CrossRef]
- Zhao, Y.; Bi, J.; Wang, C.L.; Liu, P.F. Effect of Unloading Rate on the Mechanical Behavior and Fracture Characteristics of Sandstones Under Complex Triaxial Stress Conditions. Rock Mech. Rock Eng. 2021, 54, 4851–4866. [Google Scholar] [CrossRef]
- Bi, J.; Liu, P.F.; Gan, F. Effects of the cooling treatment on the dynamic behavior of ordinary concrete exposed to high temperatures. Constr. Build. Mater. 2020, 248, 118688. [Google Scholar] [CrossRef]
- Wei, M.D.; Dai, F.; Liu, Y.; Li, A.; Yan, Z.L. Influences of loading method and notch type on rock fracture toughness measurements: From the perspectives of T-stress and fracture process zone. Rock Mech. Rock Eng. 2021, 54, 4965–4986. [Google Scholar] [CrossRef]
- Wei, M.D.; Dai, F.; Xu, N.W.; Zhao, T.; Liu, Y. An experimental and theoretical assessment of semi-circular bend specimens with chevron and straight-through notches for mode I fracture toughness testing of rocks. Int. J. Rock Mech. Min. Sci. 2017, 99, 28–38. [Google Scholar] [CrossRef]
- Zhao, Y.; Wang, C.L.; Teng, M.Y.; Bi, J. Observation on microstructure and shear behavior of mortar due to thermal shock. Cem. Concr. Compos. 2021, 121, 104106. [Google Scholar] [CrossRef]
- Zhao, Y.L.; Liu, Q.; Zhang, C.S.; Liao, J.; Lin, H.; Wang, Y.X. Coupled seepage-damage effect in fractured rock masses: Model development and a case study. Int. J. Rock Mech. Min. Sci. 2021, 144, 104822. [Google Scholar] [CrossRef]
- Zhao, Y.L.; Wang, Y.X.; Wang, W.J.; Tang, L.M.; Liu, Q. Modeling of rheological fracture behavior of rock cracks subjected to hydraulic pressure and far field stresses. Theor. Appl. Fract. Mech. 2019, 101, 59–66. [Google Scholar] [CrossRef]
- Zerathe, S.; Lebourg, T.; Braucher, R.; Bourlès, D. Mid-Holocene cluster of large-scale landslides revealed in the Southwestern Alps by 36Cl dating. Insight on an Alpine-scale landslide activity. Quat. Sci. Rev. 2014, 90, 106–127. [Google Scholar] [CrossRef]
- Zhao, Y.L.; Zhang, L.Y.; Liao, J.; Wang, W.J.; Liu, Q.; Tang, L.M. Experimental study of fracture toughness and subcritical crack growth of three rocks under different environments. Int. J. Geomech. 2020, 20, 04020128. [Google Scholar] [CrossRef]
- Shen, Y.J.; Yang, H.W.; Xi, J.M.; Yang, Y. A novel shearing fracture morphology method to assess the influence of freeze-thaw actions on concrete-granite interface. Cold Reg. Sci. Technol. 2020, 169, 102900. [Google Scholar] [CrossRef]
- Takara, K.; Yamashiki, Y.; Sassa, K.; Ibrahim, A.B.; Fukuoka, H. A distributed hydrological–geotechnical model using satellite-derived rainfall estimates for shallow landslide prediction system at a catchment scale. Landslides 2010, 7, 237–258. [Google Scholar]
- Zhu, T.T.; Hang, D. Experimental investigation of the shear mechanical behavior of sandstone under unloading normal stress. Int. J. Rock Mech. Min. Sci. 2019, 114, 186–194. [Google Scholar] [CrossRef]
- Lee, K.M.; Manjunath, V.R. Soil-geotextile interface friction by direct shear tests. Can. Geotech. J. 2011, 37, 238–252. [Google Scholar] [CrossRef]
- Zhong, Z.; Hang, D.; Zhang, Y.F.; Liu, Q. Experimental Study on the Effects of Unloading Normal Stress on Shear Mechanical Behaviour of Sandstone Containing a Parallel Fissure Pair. Rock Mech. Rock Eng. 2020, 53, 1647–1663. [Google Scholar] [CrossRef]
- Park, J.W.; Song, J.J. Numerical simulation of a direct shear test on a rock joint using a bonded-particle model. Int. J. Rock Mech. Min. Sci. 2009, 46, 1315–1328. [Google Scholar] [CrossRef]
- Alejano, L.R.; Alonso, E. Considerations of the dilatancy angle in rocks and rock masses. Int. J. Rock Mech. Min. Sci. 2005, 42, 481–507. [Google Scholar] [CrossRef]
- Alonso, E.; Alejano, L.R.; Varas, F.; Fdez-Manin, G.; Carranza-Torres, C. Ground response curves for rock masses exhibiting strain-softening behaviour. Int. J. Numer. Anal. Methods Geomech. 2003, 27, 1153–1185. [Google Scholar] [CrossRef]
- Nguyen, V.M.; Konietzky, H.; Frühwirt, T. New methodology to characterize shear behavior of joints by combination of direct shear box testing and numerical simulations. Geotech. Geol. Eng. 2014, 32, 829–846. [Google Scholar] [CrossRef]
- Beer, A.J.; Stead, D.; Coggan, J.S. Estimation of the Joint Roughness Coefficient (JRC) by visual comparison. Rock Mech. Rock Eng. 2002, 35, 65–74. [Google Scholar] [CrossRef]
- Tatone, B.S.A.; Grasselli, G. A new 2D discontinuity roughness parameter and its correlation with JRC. Int. J. Rock Mech. Min. Sci. 2010, 47, 1391–1400. [Google Scholar] [CrossRef]
- Huang, D.; Guo, Y.Q.; Cen, D.F.; Zhong, Z.; Song, Y.X. Experimental investigation on shear mechanical behavior of sandstone containing a pre-existing flaw under unloading normal stress with constant shear stress. Rock Mech. Rock Eng. 2020, 53, 3379–3792. [Google Scholar] [CrossRef]
- Park, J.-W.; Lee, Y.-K.; Song, J.-J.; Choi, B.-H. A constitutive model for shear behavior of rock joints based on three-dimensional quantification of joint roughness. Rock Mech. Rock Eng. 2013, 46, 1513–1537. [Google Scholar] [CrossRef]
- Asadollahi, P.; Invernizzi, M.C.A.; Addotto, S.; Tonon, F. Experimental validation of modified Barton’s model for rock fractures. Rock Mech. Rock Eng. 2010, 43, 597–613. [Google Scholar] [CrossRef]
- Ghazvinian, A.H.; Azinfar, M.J.; Vaneghi, R.G. Importance of tensile strength on the shear behavior of discontinuities. Rock Mech. Rock Eng. 2012, 45, 349–359. [Google Scholar] [CrossRef]
- Huang, S.B.; Ye, Y.H.; Cui, X.Z.; Cheng, A.P.; Liu, G.F. Theoretical and experimental study of the frost heaving characteristics of the saturated sandstone under low temperature. Cold Reg. Sci. Technol. 2020, 174, 48–54. [Google Scholar] [CrossRef]
- Yavuz, H.; Altindag, R.; Sarac, S.; Ugur, I.; Sengun, N. Estimating the index properties of deteriorated carbonate rocks due to freeze-thaw and thermal shock weathering. Int. J. Rock Mech. Min. Sci. 2006, 43, 767–775. [Google Scholar] [CrossRef]
- Weng, L.; Wu, Z.J.; Liu, Q.S.; Chu, Z.F.; Zhang, S.L. Evolutions of the unfrozen water content of saturated sandstones during freezing process and the freeze-induced damage characteristics. Int. J. Rock Mech. Min. Sci. 2021, 142, 104757. [Google Scholar] [CrossRef]
- Belem, T.; Homand-Etienne, F.; Souley, M. Quantitative Parameters for Rock Joint Surface Roughness. Rock Mech. Rock Eng. 2000, 33, 217–242. [Google Scholar] [CrossRef]
- Boomari, H.; Ostovari, M.; Zarei, A. Recognizing visibility graphs of triangulated irregular networks. Fundam. Inform. 2021, 179, 345–360. [Google Scholar] [CrossRef]
- Winkler, E.M. Frost damage to stone and concrete: Geological considerations. Eng. Geol. 1968, 2, 315–323. [Google Scholar] [CrossRef]
- Huang, S.B.; Liu, Q.S.; Liu, Y.Z.; Ye, Z.Y.; Cheng, A.P. Freezing strain model for estimating the unfrozen water content of saturated rock under low temperature. Int. J. Geomech. 2018, 18, 04017137. [Google Scholar] [CrossRef]


Publisher’s Note: MDPI stays neutral with regard to jurisdictional claims in published maps and institutional affiliations. |
© 2021 by the authors. Licensee MDPI, Basel, Switzerland. This article is an open access article distributed under the terms and conditions of the Creative Commons Attribution (CC BY) license (https://creativecommons.org/licenses/by/4.0/).