Article

IGBT Open-Circuit Fault Diagnosis for MMC Submodules Based on Weighted-Amplitude Permutation Entropy and DS Evidence Fusion Theory

1
College of Logistics Engineering, Shanghai Maritime University, Shanghai 201306, China
2
L@bISEN, ISEN Yncréa Ouest, Brest Campus, 20, Rue Cuirassé Bretagne, 29200 Brest, France
3
Shanghai Electric Power Transmission & Distribution Group Shanghai Electric Group Co., Ltd., Shanghai 200042, China
*
Authors to whom correspondence should be addressed.
Machines 2021, 9(12), 317; https://doi.org/10.3390/machines9120317
Submission received: 12 October 2021 / Revised: 21 November 2021 / Accepted: 23 November 2021 / Published: 26 November 2021
(This article belongs to the Section Electromechanical Energy Conversion Systems)

Abstract

:
Modular multilevel converters (MMCs) have a complex structure and a large number of submodules (SMs). If there is a fault in one of the SMs, it will affect the reliable operation of the system. Therefore, rapid fault diagnosis and accurate fault positioning are crucial to ensuring the continuous operation of the system. However, the IGBT open-circuit faults in different submodules of MMCs have similar fault features, and the traditional fault feature extraction method cannot effectively extract the key features of the fault so as to accurately locate the faulty submodules. In response to this problem, this paper proposes a fault diagnosis method based on weighted-amplitude permutation entropy (WAPE) and DS evidence fusion theory. The simulation results show that WAPE has better feature extraction ability than basic permutation entropy, and the fused multiscale feature decision output has better diagnostic accuracy than the single-scale feature. Compared with traditional fault diagnosis methods, this method achieves the diagnosis of multiple fault types by collecting a single signal, which greatly reduces the number of samples and leads to higher diagnostic accuracy and faster diagnostic speed.

1. Introduction

In recent years, with the rapid development of power electronics technology, as a new type of voltage source converter topology, MMCs have been widely used in various engineering fields [1,2,3], such as high-voltage direct current (HVDC) transmission [4], high-voltage power drive systems [5], renewable energy [6], etc. However, due to exposure to harsh working environments, the safety of power electronic switches is one of the most critical issues in the normal operation of MMCs [7]. If an internal fault in the converter occurs, it may lead to an increase in voltage harmonics, waveform distortion, power quality decline, or even commutation failure [8,9]. MMCs have a large number of submodules (SMs), and because of device aging, overload, and accidental operation, the insulated-gate bipolar transistor (IGBT) in the SMs is most likely to fail [10]. Therefore, the adoption of efficient fault diagnosis technology helps to improve the operational reliability of MMCs and reduce costs [11].
The proposed MMC fault diagnosis methods can be divided into three categories according to their working principles, namely, fault diagnosis methods based on mechanism models, signal processing, and data-driven methods [12].
Mechanism-based fault diagnosis methods mostly use additional sensors. Faults can be detected by comparing the internal characteristics (circulating current, arm current, capacitor voltage, etc. [13]) and external characteristics. This approach is simple and reliable, but increases costs and hardware complexity. In [14], an integral sliding mode observer (ISMO)-based fault diagnosis method for MMCs is proposed; the fault is detected by judging whether the observed state deviates from the measured state, and then the average voltage of all SMs and the error between the capacitor voltage and the threshold of an SM is compared to locate the faulty SM; however, the fault detection and location depend on the observer model, so the time of the fault diagnosis process is still long, and the amount of calculation is relatively large. In [15], a fault diagnosis method based on redundant voltage sensors is proposed; by comparing the output voltage of a group of SMs with two calculated reference voltages, switch and sensor faults can be detected; this method can locate various open-circuit faults, but the computational complexity and cost increase with the increase in the number of SMs.
Fault diagnosis methods based on signal processing use output characteristics rather than internal characteristics to achieve fault diagnosis, by processing voltage or current signals and comparing their characteristics in real time. Data-driven fault diagnosis methods use artificial intelligence algorithms (machine learning, etc.) [16] to obtain the diagnosis through the analysis of data, reflecting the relationships among system faults and between faults and non-faults. Although the algorithms are complex, they do not require very complex hardware, and their costs are relatively low. Compared with the model-based and signal-based fault diagnosis methods, the data-driven diagnosis methods have better classification ability, and are more suitable for various types of faults and complex systems [17]. Because of the similarity of faults, it is difficult to locate the faults directly and accurately via signal-based diagnosis methods. Therefore, the data-driven diagnosis methods are more suitable for MMC fault diagnosis, and the key lies in feature extraction and classification methods. Most feature extraction methods for MMC faults use wavelet transform to preprocess the data. Wavelet transform can analyze and process nonstationary signals in both the time and frequency domains. The combination of wavelet transform and information entropy can extract fault features more effectively and accurately. The authors of [18] proposed a fault diagnosis method based on wavelet analysis and an improved neural network; the wavelet energy spectrum entropy was used to extract the characteristics of the signal after wavelet transform, constituting a statistical analysis of the energy distribution of the signal in each frequency band. The authors of [19] proposed a method using wavelet time entropy to achieve fast and accurate fault detection. The characteristics of wavelet time entropy enable it to quantify the changes in high-frequency transients by reconstructing the high-frequency component of the current signal, in order to analyze the specific frequency band of the fault current and quickly detect faults. Additionally, improved algorithms for entropy are constantly emerging. The authors of [20] propose an index based on weighted residual regression to reduce the sensitivity of kurtosis and entropy to impulse noise, which is more effective for the detection of bearing and gear faults.
The common classification methods for MMC fault diagnosis are mainly concentrated in the field of machine learning. In [21], an optimized support vector machine (SVM) method for fault diagnosis is proposed, and the fault characteristics are extracted by using the average value of three-phase AC current. However, with the development of deep learning technology, classification methods based on deep learning have also achieved good results in MMC fault diagnosis, and have been widely applied. In [22], the authors used a stacked sparse autoencoder to extract fault features from an MMC, and used classifiers based on deep neural networks to detect faults more accurately. Although these methods use artificial intelligence algorithms and even deep learning algorithms to classify faults, they can only locate one arm of the bridge, rather than a specific SM.
In summary, data-driven methods can accurately locate faults without establishing an accurate mathematical model, making them suitable for complex systems. Therefore, data-driven methods are considered for the fault diagnosis of MMCs. To solve the problem of the similarity of faults in MMCs, this paper proposes a fault diagnosis method based on weighted-amplitude permutation entropy and DS evidence fusion theory. In the first part, the time–frequency information of the three-phase output voltage of the MMC is extracted by wavelet packet transform, and the weighted-amplitude permutation entropy of the reconstructed signal at different scales is calculated. The second part uses LSTM to establish the fault diagnosis model, and outputs the probability matrix of this group of data being classified into a certain fault. The third part uses the advantages of incomplete and uncertain information from DS evidence fusion theory [23,24]—the basic probability assignment (BPA) matrix obtained by selecting permutation entropy at different scales as inputs is fused by the DS evidence fusion algorithm to obtain the final classification results. This method is applied to IGBT open-circuit fault diagnosis in a specific SM. The simulation results show that, compared with other algorithms, this method has advantages in both accuracy and diagnosis time.

2. Problem Description

In this section, the problem of the similarity of faults in fault diagnosis for MMCs is described.

2.1. Basic Principle of MMCs

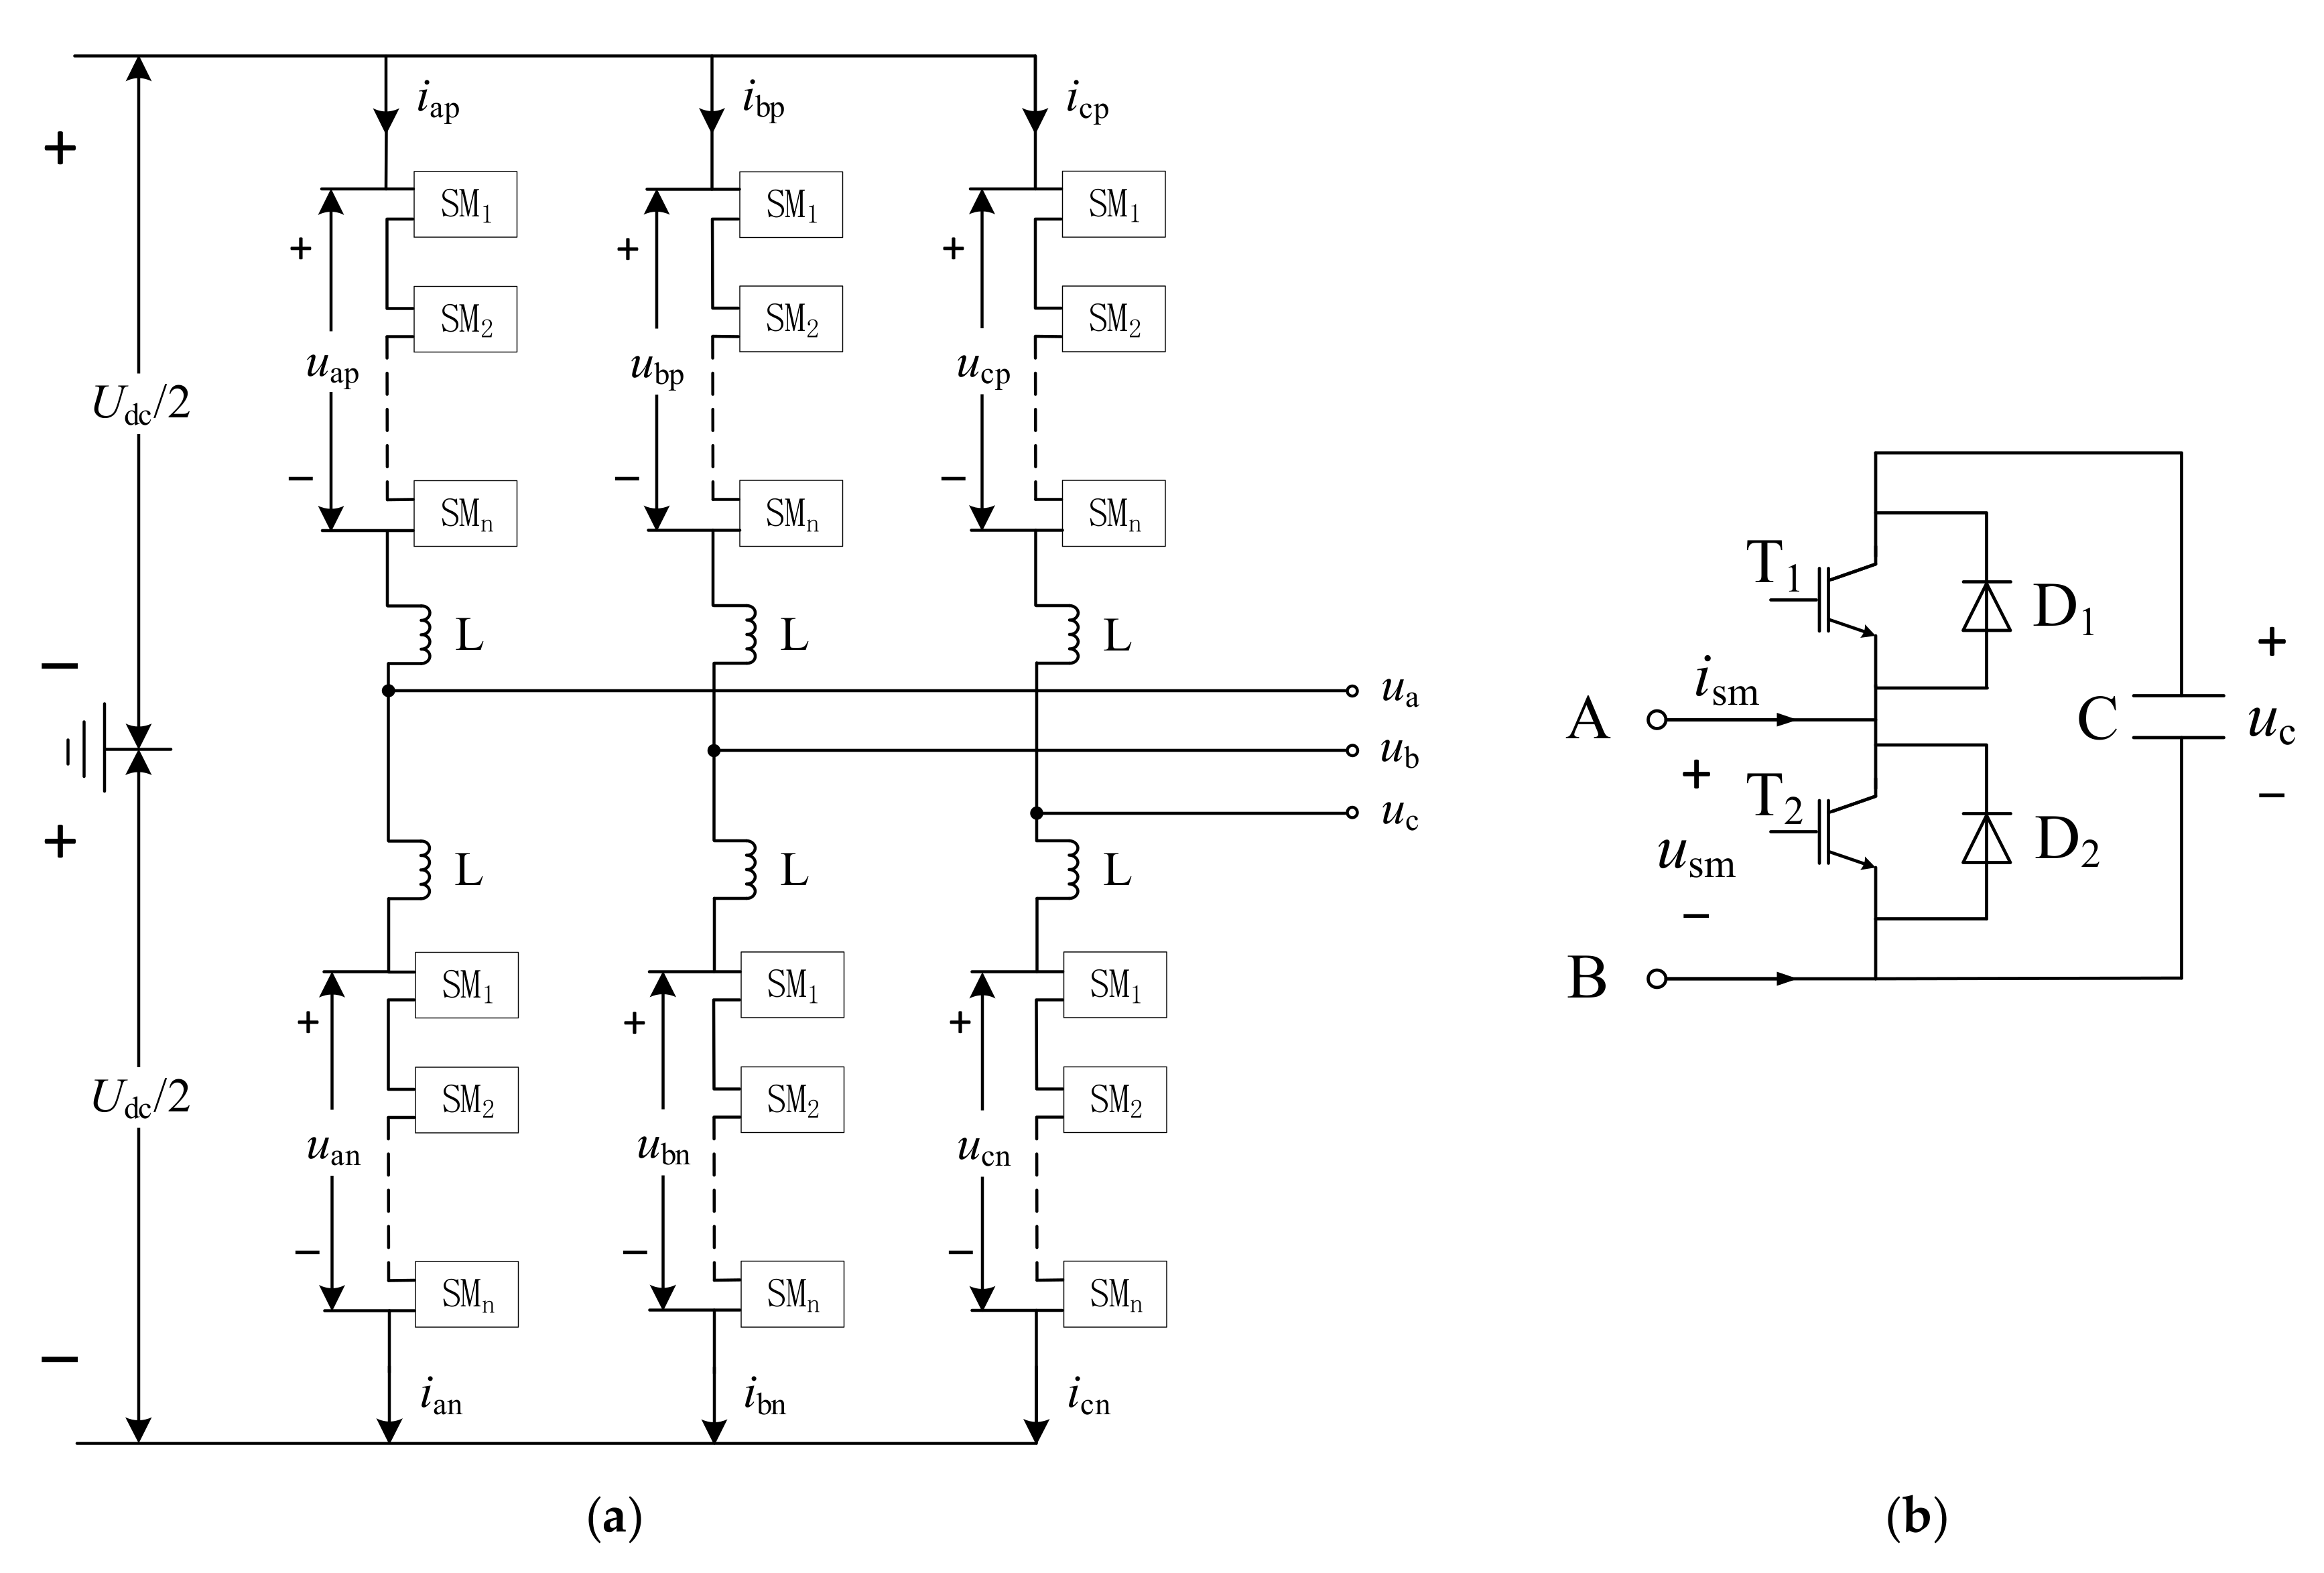
The typical MMC topology is shown in Figure 1a, being composed of three phases and six legs, and each phase is divided into upper and lower arms. Each bridge arm is composed of a reactor L and n SMs, where Ua, Ub, and Uc on the right-hand side represent the phase voltage on the AC side of the MMC, while Ud on the left-hand side is the DC voltage. The structure of the SM is shown in Figure 1b; it consists of two IGBTs (T1 and T2), two diodes (D1 and D2) in reverse parallel, and a capacitor (C), where C is the DC capacitor, Uc is the voltage at both ends of the capacitor, and ism is the current flowing into the SM.
Each SM of the MMC has two IGBTs, which are always in a complementary state at any time during normal operation. The working state of the SMs is shown in Table 1.

2.2. Existing Problem

Once the IGBT open-circuit fault occurs, not only will the output performance of the MMC deteriorate due to the unsatisfactory output voltage of the faulty SM, but the capacitor in the faulty SM will also be dangerous due to overcharging if the faulty SM is not detected and isolated in time, which may eventually lead to the failure of the entire system.
It can be seen from the above MMC SM topology that second working status will not appear in the SM when the first IGBT (T1) fails, and the capacitor discharge process will make the capacitor voltage gradually rise. When the first IGBT (T2) fault occurs, the third working status of the SM will not appear, while at the same time the continued charging process also makes the capacitor voltage rise. The states of different SMs are consistent when faults occur, leading to the similarity of the fault conditions of IGBTs in the same position in different SMs. Figure 2 shows the problem in the difference between the output voltages of a cycle after different faults occur.
It can be seen from Figure 2 that the voltage waveform similarity of IGBT faults at the same position in different SMs is very high, which makes it difficult to distinguish them.
The method of solving similar faults can be improved via feature extraction. However, thus far, there is still much room to improve the open-circuit fault diagnosis performance of MMC SMs. Most data-based methods can only diagnose the faulty bridge arm, and cannot determine which IGBT of which submodule is faulty. In the method of solving similar faults of other inverters, [25] proposes a fast fault location strategy based on path state reconstruction. Additional diagnostic information can be obtained by applying specific current path states to help locate abnormal transistors with similar fault characteristics. Considering similar faults, in [26], a more detailed feature extraction method is selected to distinguish similar faults, with high diagnostic accuracy.
Information entropy has a good ability to deal with signal complexity [27]. Feature extraction based on variable entropy is directly carried out for the three-phase output voltage under different MMC faults, such as the commonly used permutation entropy, fuzzy entropy, and sample entropy. However, it can be seen from Figure 3 that the features extracted based on permutation entropy have low discrimination for all faults. Except for the first normal state (special fault state), the features extracted based on fuzzy entropy have high similarity with IGBT faults in the same position of different submodules. The features extracted based on sample entropy have certain advantages over the other two kinds of entropy, but there are still similar faults.
In addition, most entropy algorithms are limited to single-scale analysis, ignoring the information of other scales. For most signals, single-scale features are not enough to describe the complexity of the signal. Multiscale analysis can fully describe the microstructural complexity and amplitude information of time series, making it more suitable for analyzing various actual signals. As shown in Figure 4, the fault discrimination of WAPE at scale 1 is very poor, and scale 2 shows a certain improvement. Scale 3 further distinguishes similar faults, while scale 4 only distinguishes some similar faults.
Therefore, only using single-scale basic entropy to extract the features of MMC fault signals is not the most suitable method for similar faults, and it is difficult to obtain high classification accuracy. Aiming at this problem, this paper improves the basic entropy algorithm, and combines it with decision fusion to make it more suitable for fault diagnosis of MMCs.

3. Fault Diagnosis Method Based on WAPE and DS Evidence Fusion Theory

In order to solve the problem of entropy in the feature extraction of similar MMC faults, a fault diagnosis method based on weighted-amplitude permutation entropy and DS evidence fusion theory is proposed. This method includes feature extraction based on WAPE, classification based on an LSTM network, and multiscale fusion based on DS evidence fusion theory.

3.1. Signal Preprocessing Based on Wavelet Packet Decomposition

The three-phase output voltage Uout collected from the MMC can be regarded as a one-dimensional time series {X(i), i = 1, 2, …, n}. It is difficult to classify faults by using only one-dimensional signals of fault voltage for feature extraction and fault characteristics of fault voltage in the time and frequency domains. Wavelet analysis is an effective tool to represent the transient signal in the time–frequency domain [28]. In addition to the low-frequency subdivision of the signal, the wavelet packet is also subdivided in the high-frequency band, thereby improving the analysis accuracy in the time–frequency domain [29]. Therefore, the wavelet packet decomposition is used to preprocess the signal, and the n-layer wavelet packet decomposition and reconstruction can obtain a 2n-dimensional signal {Xj(i), j = 1, 2, …, 2n; i = 1, 2, …, n} with the same length as the original data.
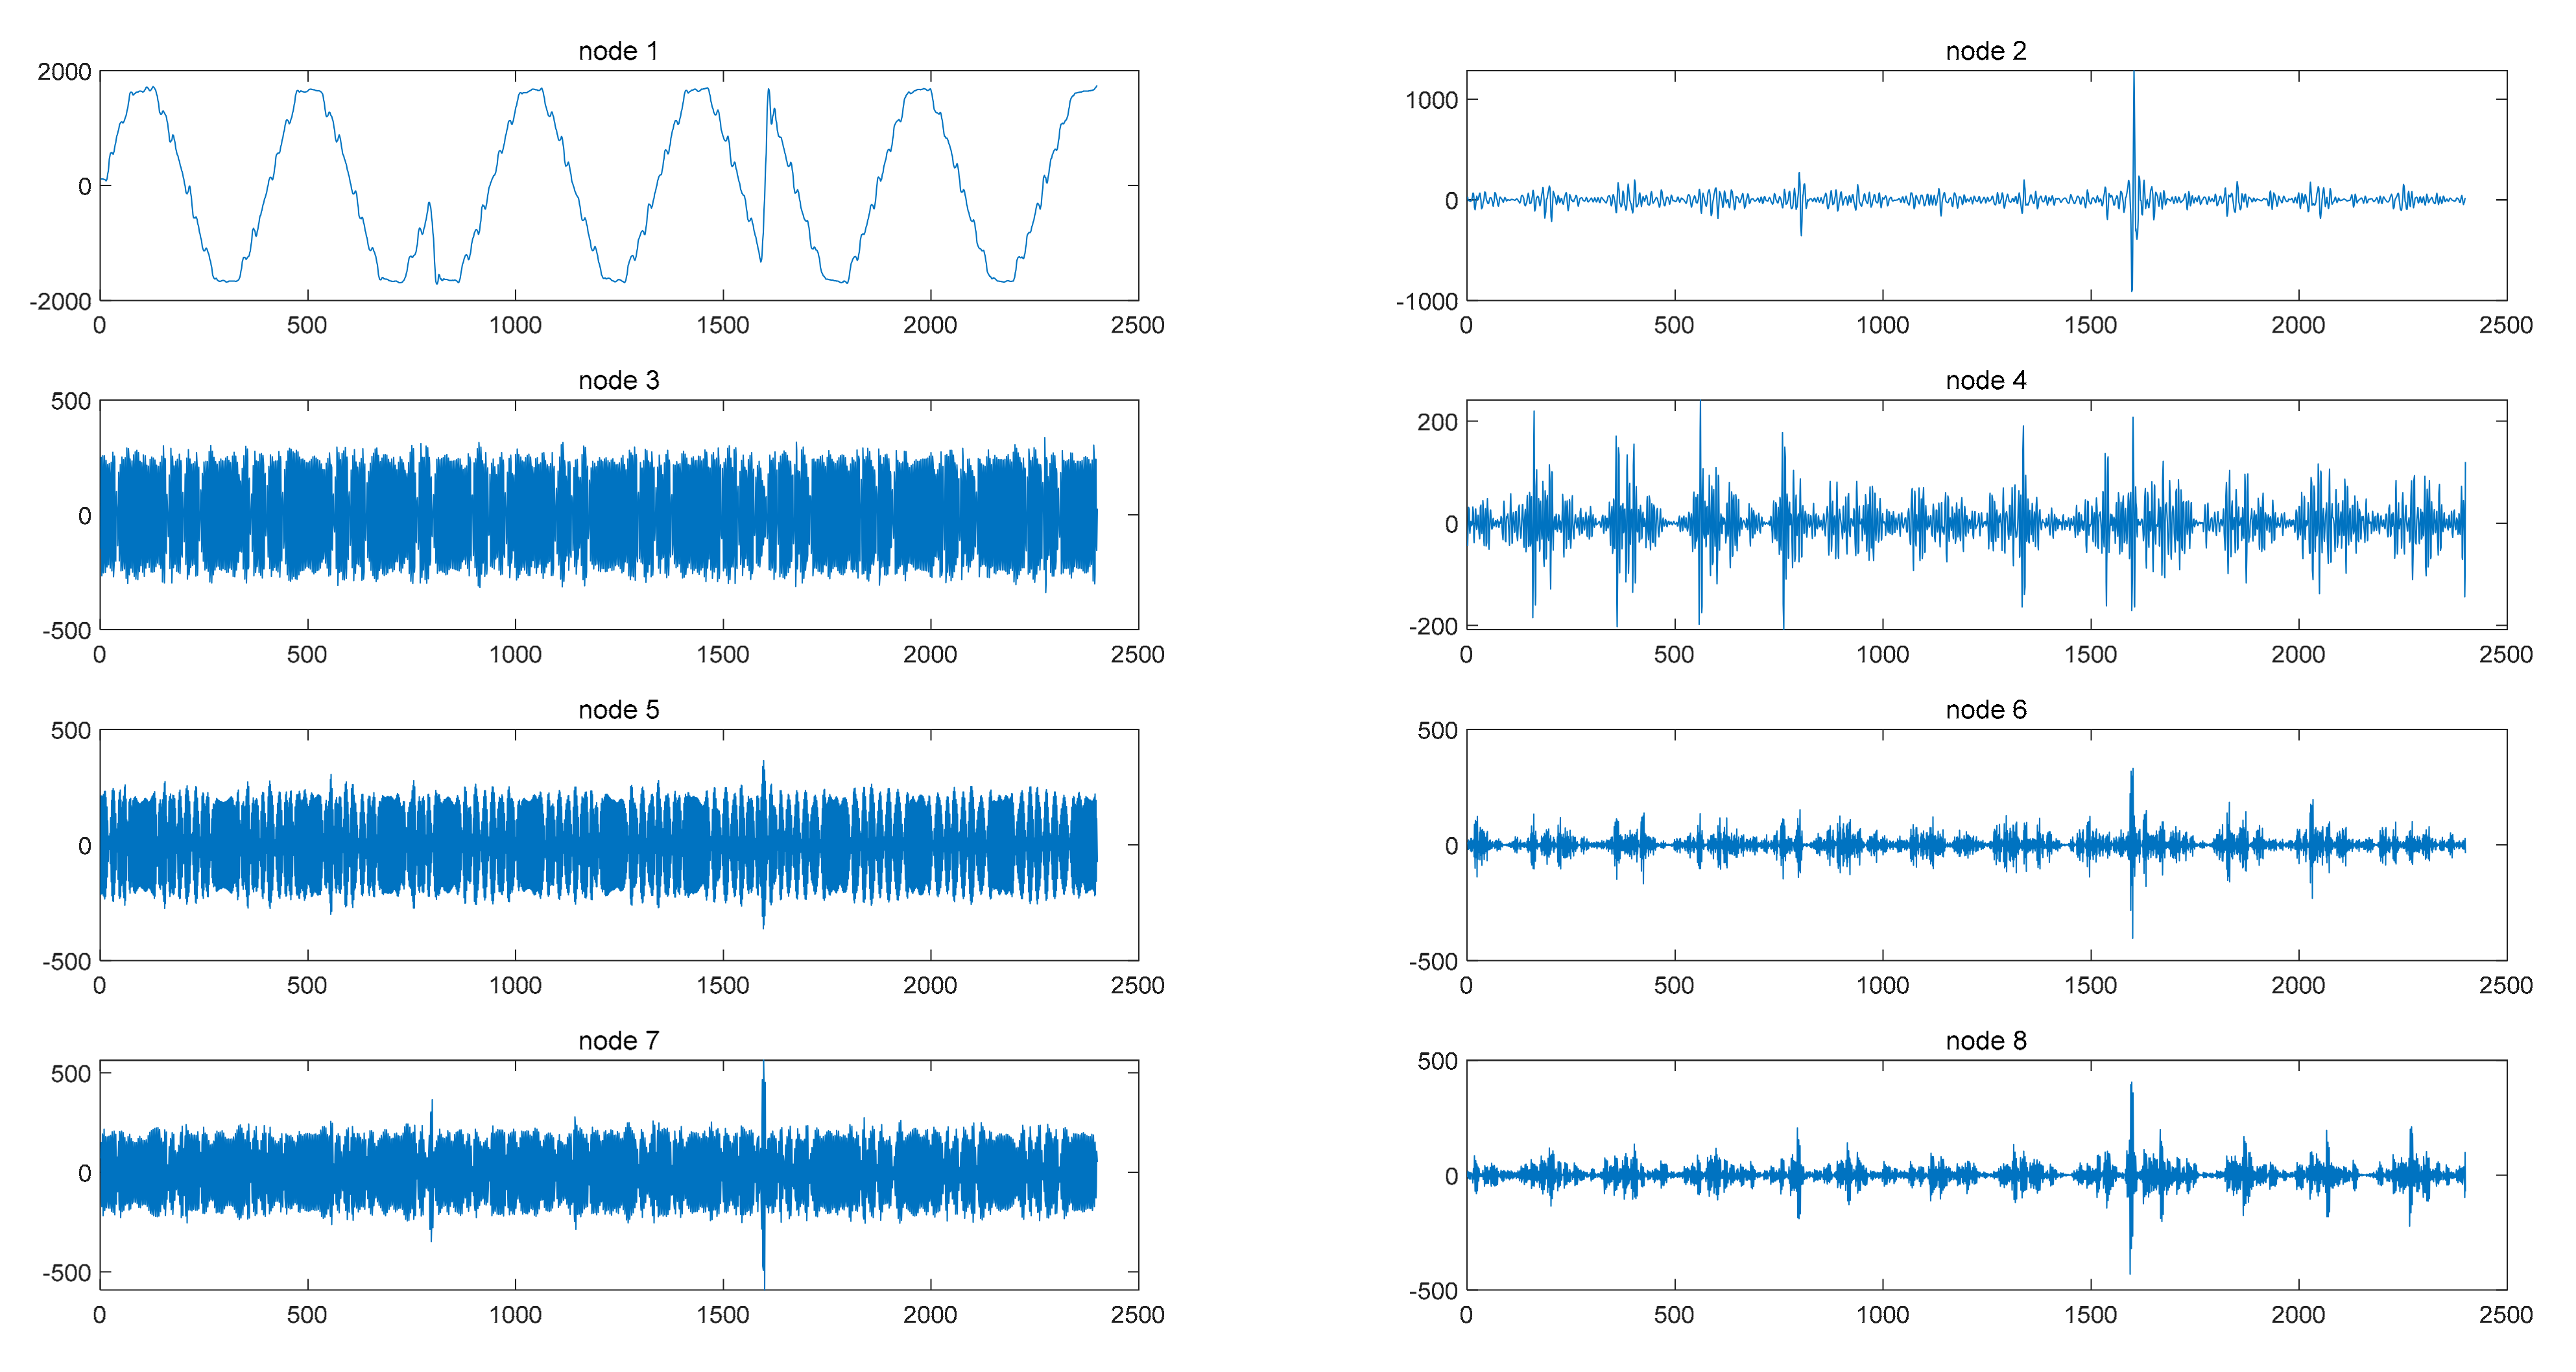
Taking three-layer wavelet packet decomposition as an example, the signal of each reconstructed node after MMC output voltage decomposition is shown in Figure 5. Because the fundamental frequency of the output voltage is 50 Hz, according to the characteristics of wavelet packet decomposition scale division, the reconstructed signals of other nodes show the characteristics of nonlinearity, disorder, and mutation, with the exception of the first node.

3.2. Feature Extraction Based on Weighted-Amplitude Permutation Entropy

After the fault signal is decomposed and reconstructed by wavelet packets, multidimensional signals can be obtained. For network classification, the direct classification of multidimensional signals as feature evidence greatly increases the calculation amount and calculation time. Therefore, the simplification of the feature matrix and extraction of the most obvious features is an important step. By measuring the complexity of the reconstructed signal after wavelet packet decomposition, and solving the information entropy of each one-dimensional component in the matrix component, the matrix component can be simplified and the fault feature change information contained in each component can be accurately extracted, which is beneficial to extracting the subtle differences from the signals with different complex faults. Among the various information entropy algorithms, permutation entropy [30] (PE) is simple in calculation and has strong anti-noise ability, which can be used to measure the complexity of one-dimensional time series. Therefore, the permutation entropy algorithm is used to reflect and amplify the extremely weak feature information in the data. The basic permutation entropy and the proposed weighted-amplitude permutation entropy are introduced below.

3.2.1. Basic Permutation Entropy

For the signal Xj(i) after wavelet packet decomposition and reconstruction, the phase space is reconstructed for each dimension, and different spatial matrices are obtained:
x ( 1 ) x ( 1 + τ ) x ( 1 + ( m 1 ) τ ) x ( 2 ) x ( 2 + τ ) x ( 2 + ( m 1 ) τ ) x ( k ) x ( k + τ ) x ( k + ( m 1 ) τ )
where m and τ denote the dimensions and delay time of the embedding matrix, respectively; k = n − (m − 1) τ. Each row in the space matrix is regarded as a reconstruction component, and the jth component [x(j), x(j + τ), …, x(j + (m − 1) τ)] in the reconstruction matrix is rearranged in ascending order. Any reconstruction component can be mapped to a specific symbol sequence πn = (j1, j2, …, jm), where 1 j k . There are m! different symbol sequences in the m-dimensional phase space matrix. The probability of each symbol sequence can be defined as [30]:
P j ( π n m , τ ) = j = 1 k 1   | when   x j   has   type   π n N λ ( m 1 )

3.2.2. Weighted-Amplitude Permutation Entropy

It can be seen from the new signal after wavelet decomposition that most of the signals in Figure 5 have large fluctuation and high mutation. The difference between similar fault signals is not reflected in the sequence of the signals, but in their amplitude. However, it can be seen that the calculation of PE only retains the order relationship in the time series, ignoring the amplitude information, which usually contains more important and useful time-series information. Taking the reconstruction components (1, 1.01, 1.02), (1, 5, 9), (1, 1, 3) as examples, they are all mapped to the same sequential mode (1 2 3) according to the algorithm. Therefore, PE simply treats the same pattern with different amplitudes as equal, which obviously affects the estimation accuracy of entropy, and also leads to difficulty in distinguishing similar faults.
Therefore, in order to solve this problem, a weighted-amplitude permutation entropy (WAPE) algorithm is proposed in this paper. The purpose is to highlight the amplitude information in the time series on the basis of the weight factor, leading to better extraction of the features of the time series. The improved permutation probability can be defined as:
P j ( π n m , τ ) = j = 1 k max 1 i m ! ( x j G ( i ) ) w j   | when   x j   has   type   π n n = 1 m ! j = 1 k max 1 i m ! (   x j G ( i ) ) w j   | when   x j   has   type   π n
where G(i) is the vector composed of permutation serial numbers under each permutation pattern, and the weight factor wj is the mean square error of component xj, namely:
w j = 1 m k = 1 m [ x j + λ ( k 1 ) x ¯ j ] 2
Then, WAPE can also be obtained according to the definition of information entropy:
H W A P E ( m , τ ) = j = 1 k P j ln P j
WAPE introduces the maximum inner product of the reconstructed component and the permutation vector. The maximum inner product indicates that the reconstructed component has the highest similarity with the permutation pattern. Taking the reconstructed components (1, 2, 3) and (3, 4, 5) as examples, they are mapped to the vector (1, 2, 3) corresponding to the permutation pattern, and then the inner product of the permutation vector and the reconstructed component corresponding to the permutation pattern must be the maximum. However, since their amplitudes are not at the same interval, their maximum values of inner product are also different (14 and 26, respectively). From the comparison of signals after decomposition of similar faults, it can be clearly seen that the amplitude of signal mutation has corresponding changes. Therefore, the difference in the inner product highlights the differences in amplitude information, and also enables similar faults to be better distinguished.

3.3. LSTM Network

Hochreiter [31] proposed to improve the traditional RNN, proposing the LSTM model. By introducing a gating unit to replace memory, this solves the problem of gradient disappearance that can easily occur in traditional recurrent neural networks, and solves the problem that it cannot deal with long-term dependence [32]. LSTM is continuous in the time dimension, and the information at a given moment is affected not only by the input at the present moment, but also by the information retained at the previous moment.
The LSTM schematic is shown in Figure 6.
The LSTM structure includes an input gate, output gate, and forget gate [33]. The forget gate determines the part that current cells need to forget, the input gate determines the part that current cells need to retain, and the output gate determines the output content of current cells. The calculation formula is as follows [31]:
f t = σ ( W f x x t + W f h h t 1 + b f )
i t = σ ( W i x x t + W i h h t 1 + b i )
g t = tanh ( W g x x t + W g h h t 1 + b g )
o t = σ ( W o x x t + W o h h t 1 + b o )
S t = g t i t + S t 1 f t
h t = tanh ( S t ) o t

3.4. Multiscale Fusion Based on DS Evidence Fusion Theory

Aiming at the problem of single-scale entropy in solving similar faults, this paper uses a multiscale fusion method based on DS evidence fusion theory. In addition, the data of the MMC fault diagnosis model are randomly selected during the training process, and the threshold of neural network classification is also random. Therefore, introducing DS evidence fusion theory for the decision fusion of multiscale fault classification results can not only solve the problem of incomplete single-scale feature extraction, but also reduce the uncertainty and randomness of fault diagnosis.
Multiscale analysis [34] makes the original time series undergo a coarse-grained process to obtain a new coarse-grained time series, which can estimate the complexity of time signals at different scales. Coarse-grained time series are obtained by averaging continuous data points in non-overlapping windows at a given scale [35], as shown in the following formula:
y j ( s ) = 1 s i = ( j 1 ) τ + 1 j s x i
where when the scale factor s = 1, the original time series is obtained. The entropy of coarse-grained time series is calculated to obtain the WAPE at this scale.
DS evidence fusion theory aims to explore the main reason (hypothesis) for the occurrence of events according to the results (evidence) of those events. When dealing with uncertainty problems, DS evidence fusion theory is an effective means of fusing uncertainty information. In the DS evidence theory, the identification framework is represented by a finite non-empty set [36,37]:
Θ = θ 1 , θ 2 , , θ n
where θi (i = 1, 2, …, n) represents the ith hypothesis and reflects the ith possible recognition results, while n represents the number of assumptions. Based on the recognition framework, the set of all subsets of Θ is a power set, which can be expressed as:
2 Θ = , θ 1 , θ 2 , , θ n , θ 1 , θ 2 , , θ 1 , θ n , , θ 1 , θ 2 , , θ n
where θi ∊ Θ, θ ⊆ 2Θ. Then, the BPA is defined to describe the support for the hypothesis, as follows:
m ( ) = 0 A Θ m ( A ) = 1
where A is the proposition in 2Θ, containing one or more assumptions; m(A) represents the basic support of evidence for proposition A.
Finally, for the assumption that there is n evidence m1, m2, …, mn, the DS evidence fusion results in the recognition framework are:
m ( A ) = 1 1 K A 1 A 1 A n = A m 1 ( A 1 ) m 2 ( A 2 ) m n ( A n ) m ( ) = 0
where k is the conflict coefficient, reflecting the degree of conflict among the evidence.
K = A 1 A 1 A n = m 1 ( A 1 ) m 2 ( A 2 ) m n ( A n ) = 1 A 1 A 1 A n m 1 ( A 1 ) m 2 ( A 2 ) m n ( A n )
The overall flow chart of fault diagnosis is depicted in Figure 7:

4. Simulation Validation and Results Discussion

In order to verify the feasibility of the proposed fault diagnosis method, a three-phase five-level MMC simulation model was built on MATLAB/Simulink, the simulation parameters of which are shown in Table 2. In the simulation, the voltage balancing control strategy based on a carrier phase-shift modulation strategy was adopted. The simulation was mainly aimed at the state of an MMC when it works as an inverter.
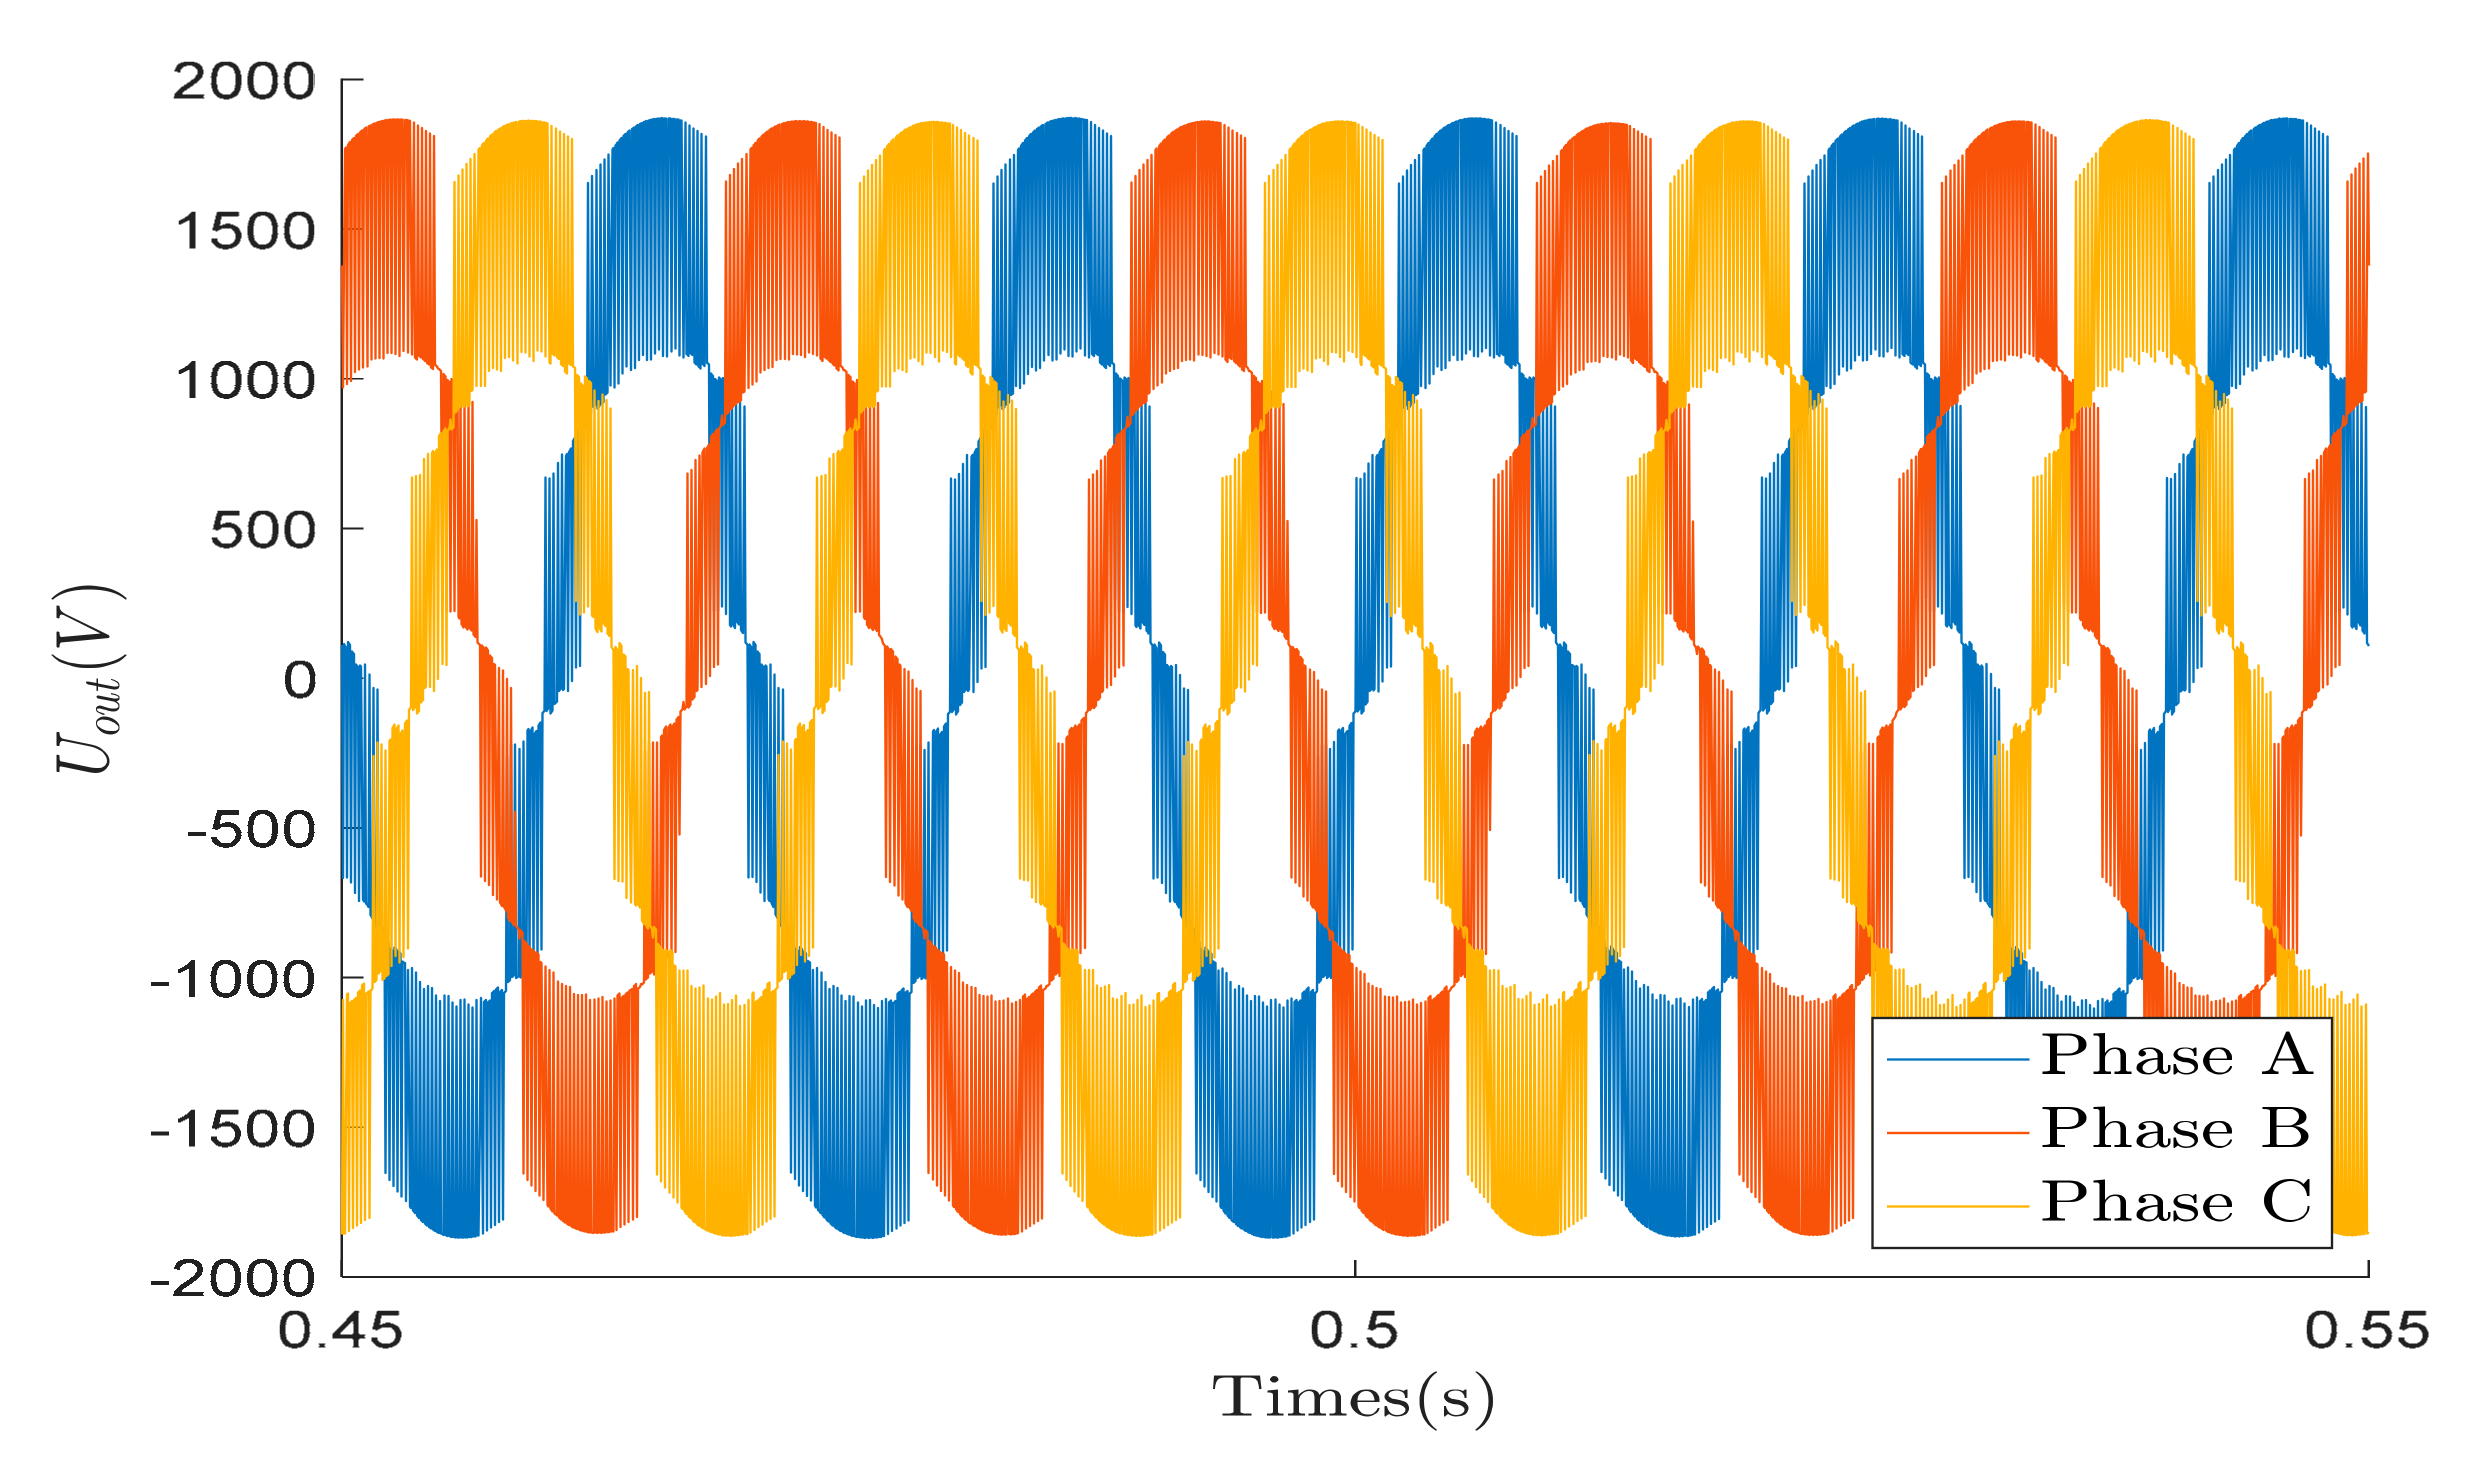
The three-phase output voltage of the simulation under normal operation is shown in Figure 8.
Under these conditions, the five-level MMC contains a total of 24 SMs and 48 IGBTs. Therefore, the dataset includes the output voltages of the normal state and 48 IGBT open-circuit fault states. Each voltage time series consists of 2 basic periods with 400 sample points in each period after the fault occurs. The normal state is regarded as a special fault state, and each fault type is given an output label with a value of 0–48. Each fault type generates 100 data by adding Gaussian white noise to the signal in order to improve the generalization performance of the network. Finally, the training set and test set are randomly assigned from 100 data to train and test the model.
In the fault diagnosis for the simulation of a five-level MMC, in order to analyze whether WAPE has better ability of feature extraction and fault diagnosis than other entropy algorithms, and to analyze the influence of wavelet packet decomposition with different layers on the diagnosis accuracy, a broken line diagram of the accuracy obtained by using different forms of permutation entropy under wavelet packet decomposition with different layers was drawn, as shown in Figure 9.
As illustrated in Figure 9, WAPE shows a great improvement in diagnostic accuracy compared with other forms of entropy. In addition, with the increase in the number of decomposition layers, the diagnostic accuracy also increases. Considering that with the increase in the number of wavelet packet decomposition layers, the computation time and algorithm complexity are multiplied, we only used four-layer wavelet packet decomposition to obtain 16-dimensional decomposed signals.
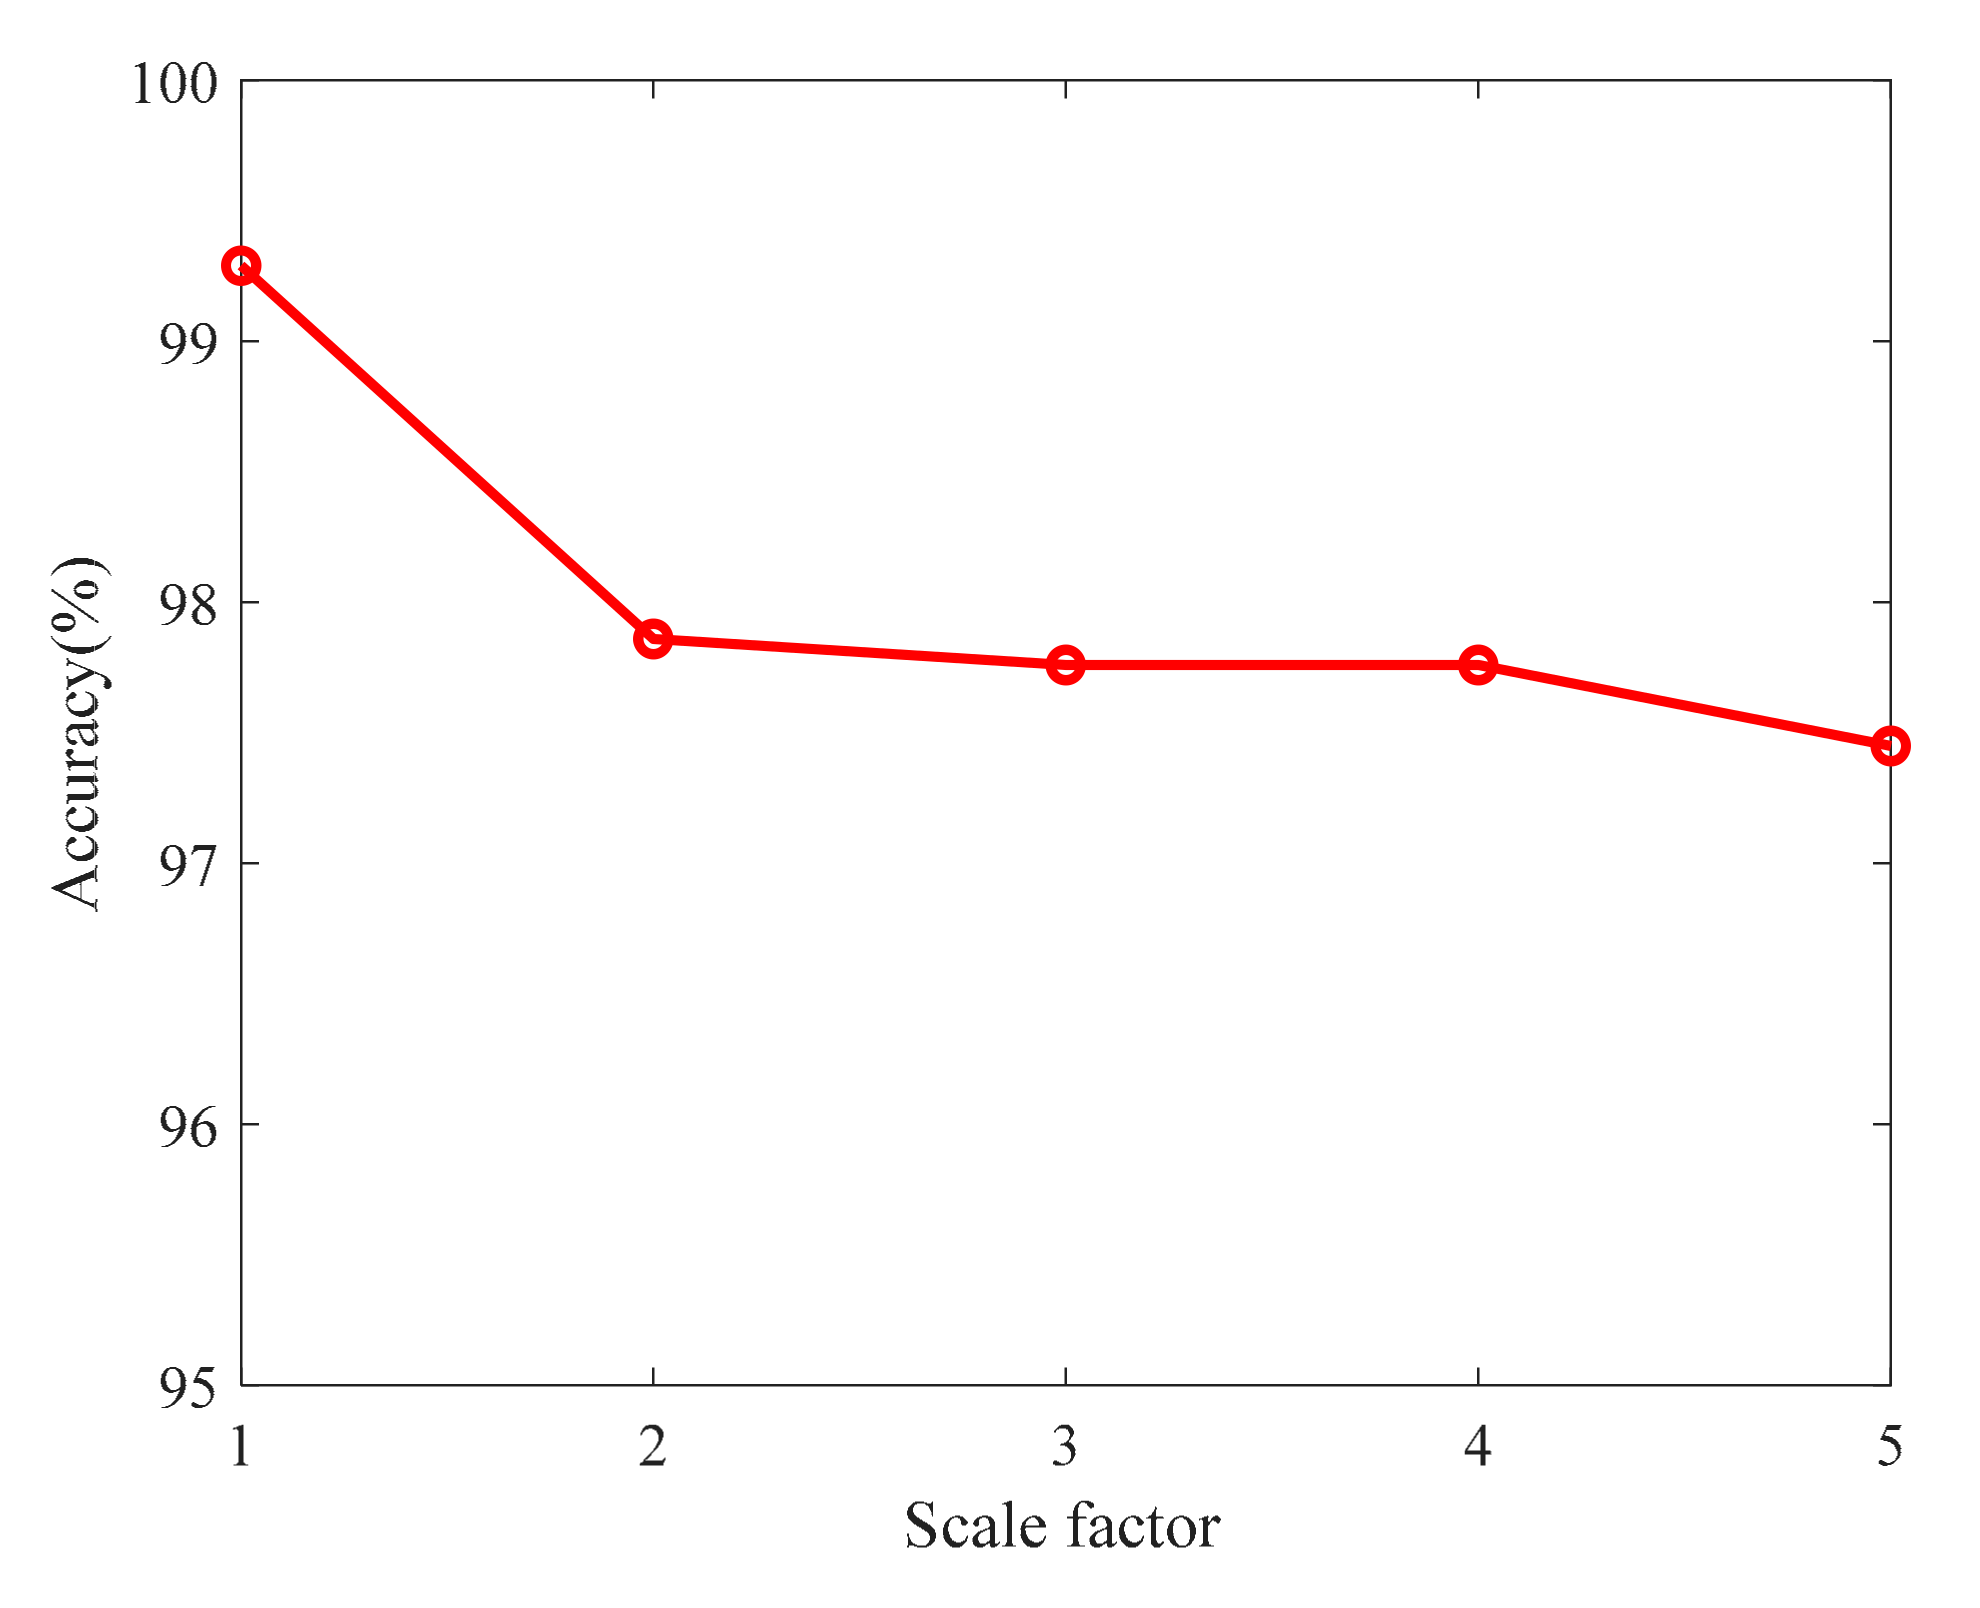
After the data preprocessing of wavelet packet decomposition, the decomposed signals were analyzed by multiscale analysis, and the BPA matrix was obtained by using the LSTM network for fault classification. The diagnostic results of WAPE at different scales are shown in Figure 10.
It can be seen from Figure 10 that the diagnostic accuracy of WAPE at different scales is above 97%, and the maximum can reach 99.29%. As the scale increases, the accuracy decreases. The classification BPA of WAPE at different scales is used as the evidence body for DS evidence fusion. Assuming that the fuzzy uncertainty satisfies zero, the evidence is fused according to the formula. From scale 1 to scale 5, the two pairs are fused, and the classification accuracy after fusion is shown in Table 3.
It can be seen that the classification accuracy of any scale of fusion was improved by more than 99.5%, up to 100%. In order to better display the fusion process of DS evidence fusion theory, two misclassified data in scale 3 and scale 4 are listed below. If the confidence of the actual label is less than that of the predicted label, it means that the data are misclassified, and vice versa. In Table 4, Table 5 and Table 6, the datum NO. 1 is misclassified at s = 3, the datum NO. 2 is misclassified at s = 4, and the datum NO. 3 is misclassified at both scales.
After DS evidence fusion, the misclassified data are classified to the correct label, and the diagnostic accuracy is up to 100%. Therefore, the results show that DS evidence fusion makes use of fault information at different scales, and multiscale WAPE is more effective in feature extraction of fault signals than single-scale WAPE. Finally, the accuracy of fault classification is improved, and the deficiency of random initialization and training randomness in neural network algorithms is also compensated.
Feature extraction and classifiers are two key points of traditional fault diagnosis methods, and have great influence on the final diagnosis results. In order to further verify the performance of the proposed fault diagnosis method, the feature extraction methods used for comparison were fast Fourier transform (FFT), wavelet packet decomposition (WPD), and principal component analysis (PCA). The classifiers used for comparison included a BP neural network, support vector machine (SVM), and extreme learning machine (ELM). The comparison results are shown in Table 7.
The results show that the proposed method has higher accuracy and faster time than other comparison methods.
In addition, in order to verify the effectiveness of the proposed method under certain double-IGBT open-circuit faults and single-IGBT short-circuit faults in SMs, the fault types studied are shown in Table 8.
According to the above table, the voltage signals of the MMC under the same SM double-IGBT open-circuit fault and SM single-IGBT short-circuit fault are collected. The expanded dataset includes the output voltages of 24 double-IGBT open-circuit faults and 16 single-IGBT short-circuit faults. The composition of each voltage time series is the same as that of the single-IGBT open-circuit faults, and it is randomly assigned to the training set and test set for model training and testing. According to the results of the above discussion, the proposed method is used to diagnose these cases, and the accuracy of both cases can still reach 100% after decision fusion.
Similarly, for double-IGBT open-circuit faults and single-IGBT short-circuit faults, the proposed method was compared with other methods, and the results are shown in Table 9 and Table 10, respectively.
It can be seen from the above two tables that the proposed method outperforms the other two methods in both diagnostic accuracy and time on both double-IGBT open-circuit faults and single-IGBT short-circuit faults, except that the diagnostic time for short-circuit faults in Table 10 is slightly longer than that of the second method.
Finally, the anti-noise performance of the proposed method was further studied, and noise with different signal-to-noise ratios (SNRs) was added to the signal; the accuracy is shown in Table 11.
The verification results show that the method still has a certain anti-noise performance for different sizes of noise.
5. Conclusions

In this paper, a fault diagnosis method based on weighted-amplitude permutation entropy and DS evidence fusion theory was proposed to solve the problem that the IGBT open-circuit faults of different MMC SMs have similar characteristics. The correctness and feasibility of the fault diagnosis method were verified by simulation. The contributions of this article can be summarized as follows:
(1)
Traditional entropy algorithms struggle to distinguish similar faults in MMCs. In this paper, the weighted-amplitude permutation entropy (WAPE) was proposed, combining the advantages of wavelet packet transform and information entropy, in order to highlight the amplitude information in the signal and solve the disadvantages, so that it can better extract the features of the similar fault signals;
(2)
Single-scale entropy does not fully distinguish similar faults at different locations. Based on the multiscale analysis and DS evidence fusion theory, the LSTM output was used for evidence fusion after a comprehensive multiscale analysis of the time series, making the fault feature extraction more comprehensive. This enables a more comprehensive distinction between similar faults in different locations, and reduces the uncertainty and randomness of fault diagnosis results, so as to further improve the accuracy of MMC fault diagnosis;
(3)
In addition, compared with the traditional fault diagnosis algorithm, the three-phase output voltage of the MMC was selected instead of the capacitor voltage of each SM. This greatly reduces the complexity of sampling, while reducing the amount of data for subsequent data processing and classification. When using LSTM to train and predict, compared with other networks, fault classification accuracy is greatly improved, and the diagnostic speed is faster.
Finally, since this paper only studied single-IGBT open-circuit faults in a low-level MMC, and verified the effectiveness of the proposed method in the case of partial multiple faults and other fault types of SMs, our method has certain limitations. In the future, we will increase the number of MMC levels and introduce more fault types for comprehensive fault diagnosis, which will be more beneficial for MMC research.

Author Contributions

Data curation, Y.S. and T.W.; Formal analysis, Y.S., T.W. and Y.A.; Investigation, Y.S., T.W. and Y.A.; Software, Y.S. and G.C.; Methodology, T.W. and Y.A.; Project administration, T.W. and Y.A.; Validation, Y.S., T.W., Y.A. and G.C.; Visualization, Y.S., T.W., Y.A. and G.C.; Writing original draft, Y.S. and T.W.; Writing-review & editing, Y.S., T.W., Y.A. and G.C. All authors have read and agreed to the published version of the manuscript.

Funding

The research was funded by National Natural Science Foundation of China (No. 61673260).

Institutional Review Board Statement

Not applicable.

Informed Consent Statement

Not applicable.

Data Availability Statement

Not applicable.

Conflicts of Interest

The authors declare no conflict of interest.

References

  1. Hu, P.; Jiang, D.; Zhou, Y.; Liang, Y.; Guo, J.; Lin, Z. Energy-balancing control strategy for modular multilevel converters under SM fault conditions. IEEE Trans. Power Electron. 2014, 29, 5021–5030. [Google Scholar] [CrossRef]
  2. Yang, S.; Tang, Y.; Wang, P. Open-circuit fault diagnosis of switching devices in a modular multilevel converter with distributed control. In Proceedings of the IEEE Energy Conversion Congress and Exposition (ECCE), Cincinnati, OH, USA, 1–5 November 2017; pp. 4208–4214. [Google Scholar] [CrossRef]
  3. Perez, M.A.; Bernet, S.; Rodriguez, J.; Kouro, S.; Lizana, R. Circuit topologies, modeling, control schemes, and applications of modular multilevel converters. IEEE Trans. Power Electron. 2015, 30, 4–17. [Google Scholar] [CrossRef]
  4. Nami, A.; Liang, J.; Dijkhuizen, F.; Demetriades, G.D. Modular multilevel converters for HVDC applications: Review on converter cells and functionalities. IEEE Trans. Power Electron. 2015, 30, 18–36. [Google Scholar] [CrossRef]
  5. Li, B.; Zhou, S.; Xu, D.; Yang, R.; Xu, D.; Buccella, C.; Cecati, C. An improved circulating current injection method for modular multilevel converters in variable-speed drives. IEEE Trans. Ind. Electron. 2016, 63, 7215–7225. [Google Scholar] [CrossRef]
  6. Rong, F.; Gong, X.; Huang, S. A Novel Grid-Connected PV System Based on MMC to Get the Maximum Power Under Partial Shading Conditions. IEEE Trans. Power Electron. 2017, 32, 4320–4333. [Google Scholar] [CrossRef]
  7. Yang, S.; Bryant, A.; Mawby, P.; Xiang, D.; Ran, L.; Tavner, P. An industry-based survey of reliability in power electronic converters. IEEE Trans. Ind. Appl. 2011, 47, 1441–1451. [Google Scholar] [CrossRef]
  8. Li, B.; Shi, S.; Wang, B.; Wang, G.; Wang, W.; Xu, D. Fault Diagnosis and Tolerant Control of Single IGBT Open-Circuit Failure in Modular Multilevel Converters. IEEE Trans. Power Electron. 2016, 31, 3165–3176. [Google Scholar] [CrossRef]
  9. Song, B.; Qi, G.; Xu, L. A new approach to open-circuit fault diagnosis of MMC SM. Syst. Sci. Control. Eng. 2020, 8, 119–127. [Google Scholar] [CrossRef] [Green Version]
  10. Song, Q.; Liu, W.; Li, X.; Rao, H.; Xu, S.; Li, L. A Steady-state analysis method for a modular multilevel converter. IEEE Trans. Power Electron. 2013, 28, 3702–3713. [Google Scholar] [CrossRef]
  11. Haghnazari, S.; Khodabandeh, M.; Zolghadri, M.R. Fast fault detection method for modular multilevel converter semiconductor power switches. IET Power Electron. 2016, 9, 165–174. [Google Scholar] [CrossRef]
  12. Wang, C.; Zhou, L.; Li, Z. Survey of switch fault diagnosis for modular multilevel converter. IET Circuits Devices Syst. 2019, 13, 117–124. [Google Scholar] [CrossRef]
  13. Ghazanfari, A.; Mohamed, Y.A.-R.I. A resilient framework for fault-tolerant operation of modular multilevel converters. IEEE Trans. Ind. Electron. 2016, 63, 2669–2678. [Google Scholar] [CrossRef]
  14. Faraz, G.; Majid, A.; Khan, B.; Saleem, J.; Rehman, N.U. An Integral Sliding Mode Observer Based Fault Diagnosis Approach for Modular Multilevel Converter. In Proceedings of the 2019 International Conference on Electrical, Communication, and Computer Engineering (ICECCE), Swat, Pakistan, 24–25 July 2019; pp. 1–6. [Google Scholar] [CrossRef]
  15. Picas, R.; Zaragoza, J.; Pou, J.; Ceballos, S. Reliable modular multilevel converter fault detection with redundant voltage sensor. IEEE Trans. Power Electron. 2017, 32, 39–51. [Google Scholar] [CrossRef] [Green Version]
  16. Li, Y.P.; Cao, W.H.; Hu, W.K. Diagnosis of downhole incidents for geological drilling processes using multi -time scale feature extraction and probabilistic neural networks. Process Saf. Environ. Prot. 2020, 137, 106–115. [Google Scholar] [CrossRef]
  17. Kou, L.; Liu, C.; Cai, G.; Zhou, J.; Yuan, Q.; Pang, S. Fault diagnosis for open-circuit faults in NPC inverter based on knowledge-driven and data-driven approaches. IET Power Electron. 2020, 13, 1236–1245. [Google Scholar] [CrossRef]
  18. Geng, Z.; Wang, Q.; Han, Y.; Chen, K.; Xie, F.; Wang, Y. Fault Diagnosis of Modular Multilevel Converter Based on RNN and Wavelet Analysis. In Proceedings of the 2020 Chinese Automation Congress, Shanghai, China, 6–8 November 2020; pp. 1097–1101. [Google Scholar] [CrossRef]
  19. Wang, S.; Bi, T.; Jia, K. Wavelet entropy based single pole grounding fault detection approach for MMC-HVDC overhead lines. Power Syst. Technol. 2016, 40, 2179–2185. [Google Scholar] [CrossRef]
  20. Zhong, J.; Wang, D.; Guo, J.E.; Cabrera, D.; Li, C. Theoretical Investigations on Kurtosis and Entropy and Their Improvements for System Health Monitoring. IEEE Trans. Instrum. Meas. 2020, 70, 1–10. [Google Scholar] [CrossRef]
  21. Ke, L.; Liu, Z.; Zhang, Y. Fault Diagnosis of Modular Multilevel Converter Based on Optimized Support Vector Machine. In Proceedings of the 2020 39th Chinese Control Conference (CCC), Shenyang, China, 27–29 July 2020; pp. 4204–4209. [Google Scholar] [CrossRef]
  22. Yin, Q.; Duan, B.; Shen, M.; Qu, X. Intelligent diagnosis method for open-circuit fault of SMs in modular five-level inverter. Autom. Electr. Power Syst. 2018, 42, 127–133. [Google Scholar] [CrossRef]
  23. Ye, F.; Chen, J.; Li, Y.; Garrido, A. Improvement of DS Evidence Theory for Multi-Sensor Conflicting Information. Symmetry 2017, 9, 69. [Google Scholar] [CrossRef] [Green Version]
  24. Xing, C.; Tai, K.; Wang, Y.; Liu, M. Fault Diagnosis for HVDC System Based on Wavelet Entropy Clustering and DS Evidence Fusion Theory. In Proceedings of the 2019 IEEE PES Innovative Smart Grid Technologies Asia, Chengdu, China, 21–24 May 2019; pp. 344–348. [Google Scholar] [CrossRef]
  25. Wang, B.; Li, Z.; Bai, Z.; Krein, P.T.; Ma, H. A Voltage Vector Residual Estimation Method Based on Current Path Tracking for T-Type Inverter Open-Circuit Fault Diagnosis. IEEE Trans. Power Electron. 2021, 36, 13460–13477. [Google Scholar] [CrossRef]
  26. Prasad, K.; Nagendra, V.; He, Y.; Ali, M. Probabilistic PCA-Support Vector Machine Based Fault Diagnosis of Single Phase 5-Level Cascaded H-Bridge MLI. In Proceedings of the 2018 International Power Electronics Conference, Niigata, Japan, 20–24 May 2018; pp. 2317–2323. [Google Scholar] [CrossRef]
  27. Blanco, S.; Figliosa, A.; Quiroga, Q.R.; Rosso, O.A.; Serrano, E. Time-frequency analysis of electroencephalogram series (III): Information transfer function and wavelets packets. Phys. Rev. E 1998, 57, 932–940. [Google Scholar] [CrossRef]
  28. Rosso, O.A.; Blanco, S.; Yordanova, J.; Kolev, V.; Figliola, A.; Schurmann, M.; Basar, E. Wavelet entropy: A new tool for analysis of short duration brain electrical signals. Neurosci. Meth. 2001, 105, 65–75. [Google Scholar] [CrossRef]
  29. Xu, Y.; Xiu, S. A New and Effective Method of Bearing Fault Diagnosis Using Wavelet Packet Transform Combined with Support Vector Machine. Computers 2011, 6, 2502–2509. [Google Scholar] [CrossRef]
  30. Bandt, C.; Pompe, B. Permutation entropy: A natural complexity measure for time series. Phys. Rev. Lett. 2002, 88, 21–24. [Google Scholar] [CrossRef]
  31. Hochreiter, S.; Schmidhuder, J. Long short-term memory. Neural Comput. 1997, 9, 1735–1780. [Google Scholar] [CrossRef]
  32. Han, Y.; Qi, W.; Ding, N.; Geng, Z. Short-Time Wavelet Entropy Integrating Improved LSTM for Fault Diagnosis of Modular Multilevel Converter. IEEE Trans. Cybern. 2021, 1–9. [Google Scholar] [CrossRef]
  33. Graves, A.; Mohamed, A.; Hinton, G. Speech recognition with deep recurrent neural networks. In Proceedings of the 2013 IEEE International Conference on Acoustics, Speech and Signal Processing, Vancouver, BC, Canada, 26–31 May 2013; pp. 6645–6649. [Google Scholar] [CrossRef] [Green Version]
  34. Yin, Y.; Shang, P. Weighted multiscale permutation entropy of financial time series. Nonlinear Dyn. 2014, 78, 2921–2939. [Google Scholar] [CrossRef]
  35. Costa, M.; Goldberger, A.L.; Peng, C.K. Multiscale entropy analysis of complex physiologic time series. Phys. Rev. Lett. 2002, 89, 068102/1–068102/4. [Google Scholar] [CrossRef] [Green Version]
  36. Grossmann, P. Multisensor data fusion. GEC J. Technol. 1998, 15, 27–37. [Google Scholar]
  37. Ren, C.; Michael, G.K. Multisensor Integration and Fusion for Intelligent Machines and Systems; Ablex Publishing Corporation: Norwood, NJ, USA, 1995; ISBN 978-0-89391-863-7. [Google Scholar]
Figure 1. Topology of three-phase MMC and submodule: (a) topology of three-phase MMC; (b) topology of submodule.
Machines 09 00317 g001
Figure 2. Single-phase output voltage waveforms (fault at 0.5 s).
Machines 09 00317 g002
Figure 3. Different entropy of different fault signals: (a) permutation entropy; (b) fuzzy entropy; (c) sample entropy.
Machines 09 00317 g003
Figure 4. WAPE at different scales: (a) WAPE at scale 1; (b) WAPE at scale 2; (c) WAPE at scale 3; (d) WAPE at scale 4.
Machines 09 00317 g004
Figure 5. Reconstruction signals after three-layer wavelet packet decomposition.
Machines 09 00317 g005
Figure 6. LSTM structure.
Machines 09 00317 g006
Figure 7. Flow chart of the proposed diagnostic method.
Machines 09 00317 g007
Figure 8. Three-phase output voltage in normal state.
Machines 09 00317 g008
Figure 9. Comparison of different forms of permutation entropy under wavelet packet decomposition with different layers.
Machines 09 00317 g009
Figure 10. Maximum diagnostic accuracy at different scales.
Machines 09 00317 g010
Table 1. Working status of the submodule.
ModelSM StateT1T2D1D2Current DirectionUsmCapacitor State
1On1010A→BUcCharge
2On1000B→AUcDischarge
3Off0100A→B0Bypass
4Off0101B→A0Bypass
5Close0010A→BUcCharge
6Close0001B→A0Bypass
Table 2. MMC parameters.
ParametersValue
Number of SMs per arm4
Carrier switching frequency1250 Hz
DC link voltage4 kV
Arm inductance5 mH
SM capacitance4.7 mF
Load5 Ω
Table 3. Fusion results of different scales.
Multiscale FusionAccuracy/%Multiscale FusionAccuracy/%
1 + 299.90%2 + 499.69%
1 + 3100%2 + 599.80%
1 + 4100%3 + 4100%
1 + 5100%3 + 5100%
2 + 399.80%4 + 5100%
Table 4. Fusion results of misclassified data in scale s = 3.
DataEvidenceConfidence of Type11Confidence of Type13Result
NO. 1 (Type13)s = 30.52820.4624Type11
s = 41.7726 × 10−70.9981Type13
Fusion0.00001.0000Type13
Table 5. Fusion results of misclassified data in scale s = 4.
DataEvidenceConfidence of Type39Confidence of Type43Result
NO. 2 (Type43)s = 31.6367 × 10−50.9954Type43
s = 40.60500.3510Type39
Fusion2.834 × 10−50.9999Type43
Table 6. Fusion results of misclassification data at two scales.
DataEvidenceConfidence of Type26Confidence of Type30Confidence of Type32Result
NO. 3 (Type32)s = 39.2716 × 10−40.58250.4162Type30
s = 40.65465.3699 × 10−50.2700Type26
Fusion0.00542.7675 × 10−40.9943Type32
Table 7. Comparison of different methods.
MethodAccuracy/%Time/s
WPD + WAPE + LSTM99.29%0.0389 s
FFT + PCA + SVM68.98%0.1898 s
FFT + PCA + ELM65.61%1.9851 s
WPD + BP77.96%0.0835 s
WPD + SVM92.04%0.5096 s
WPD + ELM97.55%2.4674 s
Table 8. Fault types.
Fault TypeNumber
A-phase double-IGBT open-circuit fault of the same SM8
B-phase double-IGBT open-circuit fault of the same SM8
C-phase double-IGBT open-circuit fault of the same SM8
A-phase single-IGBT short-circuit fault16
Table 9. Comparison of different methods for double-IGBT open-circuit faults.
MethodAccuracy/%Time/s
WPD + WAPE + LSTM98.33%0.0225 s
FFT + PCA + SVM63.33%0.0287 s
WPD + PE + SVM76.04%0.0390 s
Table 10. Comparison of different methods for single-IGBT short-circuit faults.
MethodAccuracy/%Time/s
WPD + WAPE + LSTM99.06%0.0191 s
FFT + PCA + SVM96.88%0.0044 s
WPD + PE + SVM75.94%0.0228 s
Table 11. Accuracy under different noise.
SNRAccuracy/%
30 db100%
25 db91.02%
20 db86.73%
15 db79.59%
Publisher’s Note: MDPI stays neutral with regard to jurisdictional claims in published maps and institutional affiliations.