Article

A Comparison of the Probes with a Cantilever Beam and a Double-Sided Beam in the Tool Edge Profiler for On-Machine Measurement of a Precision Cutting Tool

1
Department of Finemechanics, Tohoku University, Sendai 980-8579, Japan
2
Division of Mechanical and Space Engineering, Graduate School of Engineering, Hokkaido University, Sapporo 060-8628, Japan
3
Department of Production Engineering, KTH Royal Institute of Technology, 10044 Stockholm, Sweden
*
Author to whom correspondence should be addressed.
Machines 2021, 9(11), 271; https://doi.org/10.3390/machines9110271
Submission received: 7 October 2021 / Revised: 4 November 2021 / Accepted: 4 November 2021 / Published: 6 November 2021
(This article belongs to the Special Issue Precision Measurement and Machines)

Abstract

:
This paper describes a comparison of the mechanical structures (a double-sided beam and a cantilever beam) of a probe in a tool edge profiler for the measurement of a micro-cutting tool. The tool edge profiler consists of a positioning unit having a pair of one-axis DC servo motor stages and a probe unit having a laser displacement sensor and a probe composed of a stylus and a mechanical beam; on-machine measurement of a tool cutting edge can be conducted with a low contact force through measuring the deformation of the probe by the laser displacement sensor while monitoring the tool position. Meanwhile, the mechanical structure of the probe could affect the performance of measurement of the edge profile of a precision cutting tool. In this paper, the measurement principle of the tool edge profile is firstly introduced; after that, slopes and a top-flat of a cutting tool sample are measured by using a cantilever-type probe and a double-sided beam-type probe, respectively. The measurement performances of the two probes are compared through experiments and theoretical measurement uncertainty analysis.

1. Introduction

The importance of precision cutting tools having a micro-cutting edge tends to be more significant in many industrial fields, such as the semiconductor industry and energy engineering, with the increase in the demand for higher cutting quality and lower manufacturing costs in mass production [1,2]. Since the geometric features of a cutting edge could strongly affect the cutting performance of a precision cutting tool, the assurance of the machining accuracy of a cutting tool is one of the essential tasks for the guarantee of the superior cutting ability and tool life [3,4,5]. Precision cutting tools are usually fabricated through a precision grinding process. However, it is challenging to avoid the high rate of wear on the grinding tools, since most of the precision cutting tools are made of hard-to-cut materials, such as cemented carbide [6,7]. In order to control the machining accuracy in the grinding process, compensation machining is required [8]. Most of the commercial measuring instruments are designed to carry out off-machine measurement [4,9]. Compensation machining through an iterative process with the demounting of the workpiece, off-machine measurement and the remounting of the workpiece can improve the machining accuracy. However, the misalignment due to the repeated mounting and demounting of the workpiece could inherently affect the machining accuracy and efficiency [4,8,9,10,11]. Therefore, on-machine measurement of a cutting edge is desired to be realized to improve the machining accuracy and efficiency [8].
For on-machine measurement, two kinds of methods are generally employed; non-contact methods and contact methods. Non-contact measurement based on the principle of interferometry, optical sensors, optical microscopy, or three-dimensional imagining technology can realize a fast evaluation without any damage to workpiece surfaces [10,12,13,14,15,16,17]. Nevertheless, most of them have high requirements on the measuring environment, such as temperature, vibration, and humidity [18,19]. Moreover, the tiny structure of a tool cutting edge makes optic-based non-contact measurement system not suitable for measurement of precision cutting tools [8,20]. On the other hand, with the assistance of a precision positioning system, probe-based contact measuring instruments can be applied to precisely measure the topography of a workpiece that is difficult to be measured by non-contact methods [21,22]. Some of the traditional probe-based measuring instruments, such as a roughness tester, are designed to have a low contact force to avoid damage to a workpiece surface in the measurement process. However, such a low contact force could still cause damage to a cutting edge having an edge radius of several tens nm [23]. An atomic force microscope (AFM) is a popular contact measuring instrument with a high measurement resolution while realizing extremely low measuring force [24,25]. Due to this, sometimes AFM is treated as a non-contact measuring instrument depending on its operating mode. Nevertheless, for the profile measurement of the cutting tool edge, the AFM-based measurement system still requires additional measuring range and complex configuration [26,27], which is not friendly to the on-machine surface profile measurement of a precision cutting tool. Although some technologies, such as force sensor integrated fast tool servo (FS-FTS) [28,29] and edge reversal methods [30], are employed for the cutting tool edge measurement, the application of these methods is quite limited. Furthermore, they are not suitable for the on-machine measurement regarding the compensation machining of a precision cutting tool.
To meet the requirements for on-machine measurement of the edge profile of a precision cutting tool, the authors have developed a tool edge profiler composed of a probe unit and a positioning system [31,32,33]. In the probe unit, a probe consisting of a stylus and a beam is attached to a displacement sensor based on the laser triangulation [21] so that the deflection of the probe beam due to the contact with a target surface can be detected. For tool edge profile measurement, the probe unit is mounted on the positioning system so that the probe unit can be moved in the vertical and horizontal direction with respect to the stylus axis. Measurement of the edge profile of a cutting tool can be carried out by combining the information of the probe position and the deflection of the probe beam [32]. With the help of the large stroke of the positioning system and the low beam stiffness, the developed tool edge profiler can realize the measurement of the edge profile of a precision cutting tool over a wide measuring range with a low measuring force while maintaining fair stability. Meanwhile, when a cantilever-type probe is employed to measure the steep slope of a cutting tool, the deflection of the cantilever could become unstable and unpredictable due to the asymmetrical mechanical structure of the probe, as can be seen in Figure 1a. On the other hand, as shown in Figure 1b, the deflection of the double-sided beam-type probe is expected to be more stable when measuring the steep slope of a tool edge.
In this paper, the two types of beam-based probes in the developed tool edge profiler are compared in aspects of measurement principle, profiler construction, and measurement capability. After introducing the measurement principle and experimental setup, a series of experiments are carried out to evaluate the measurement capability of the two beam-based probes. Measurement uncertainty analysis is also conducted based on the GUM [33] to theoretically compare the two probes for on-machine measurement of a micro-cutting edge.

2. Comparison of Two Profilers

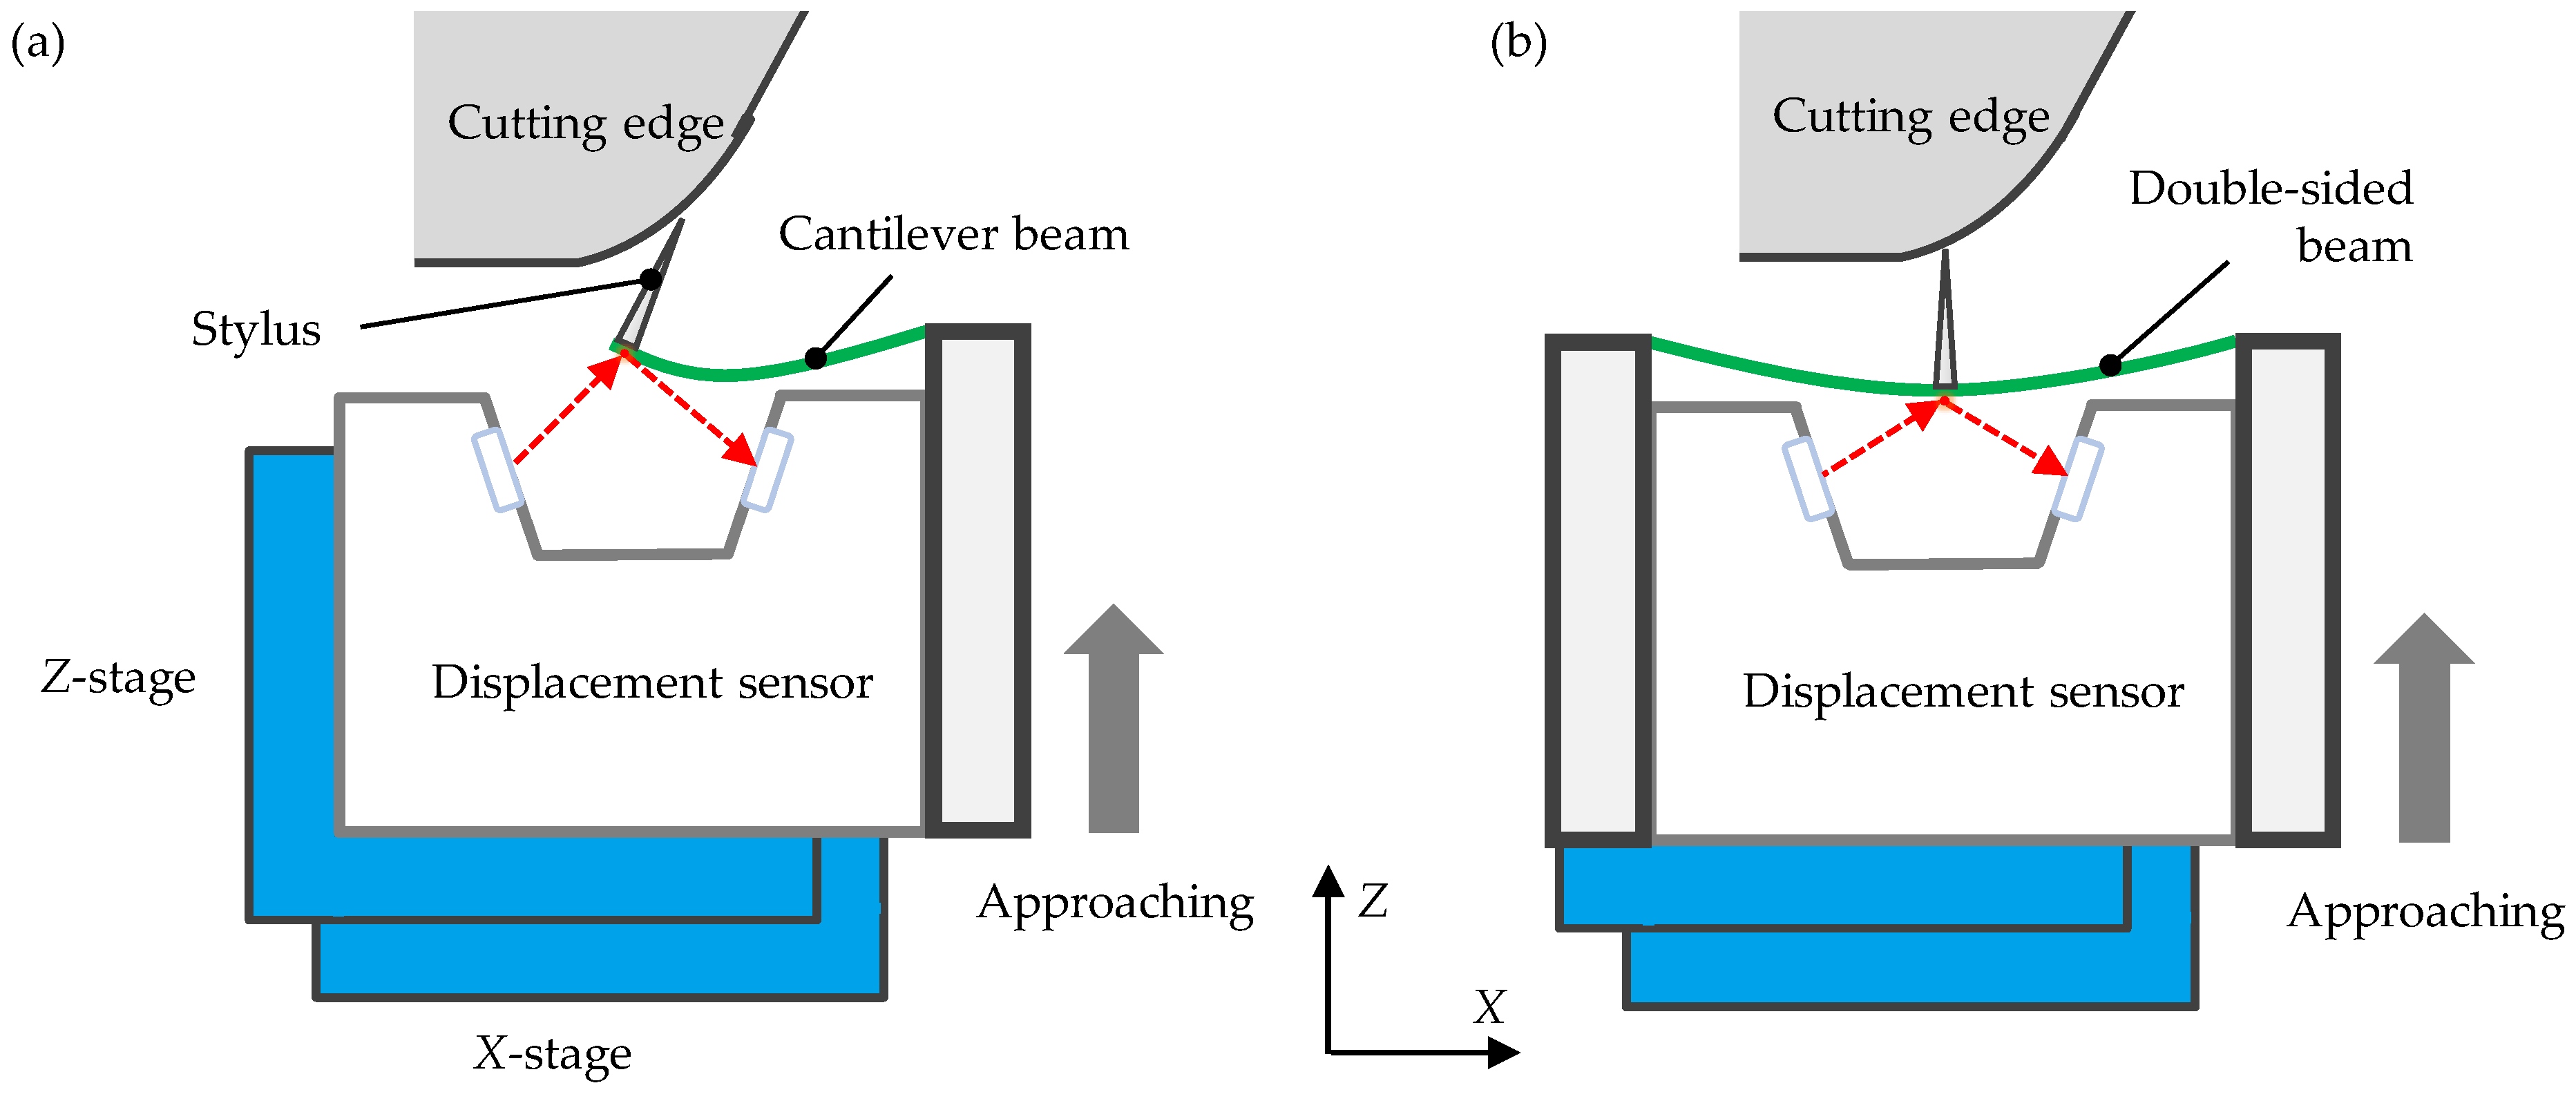
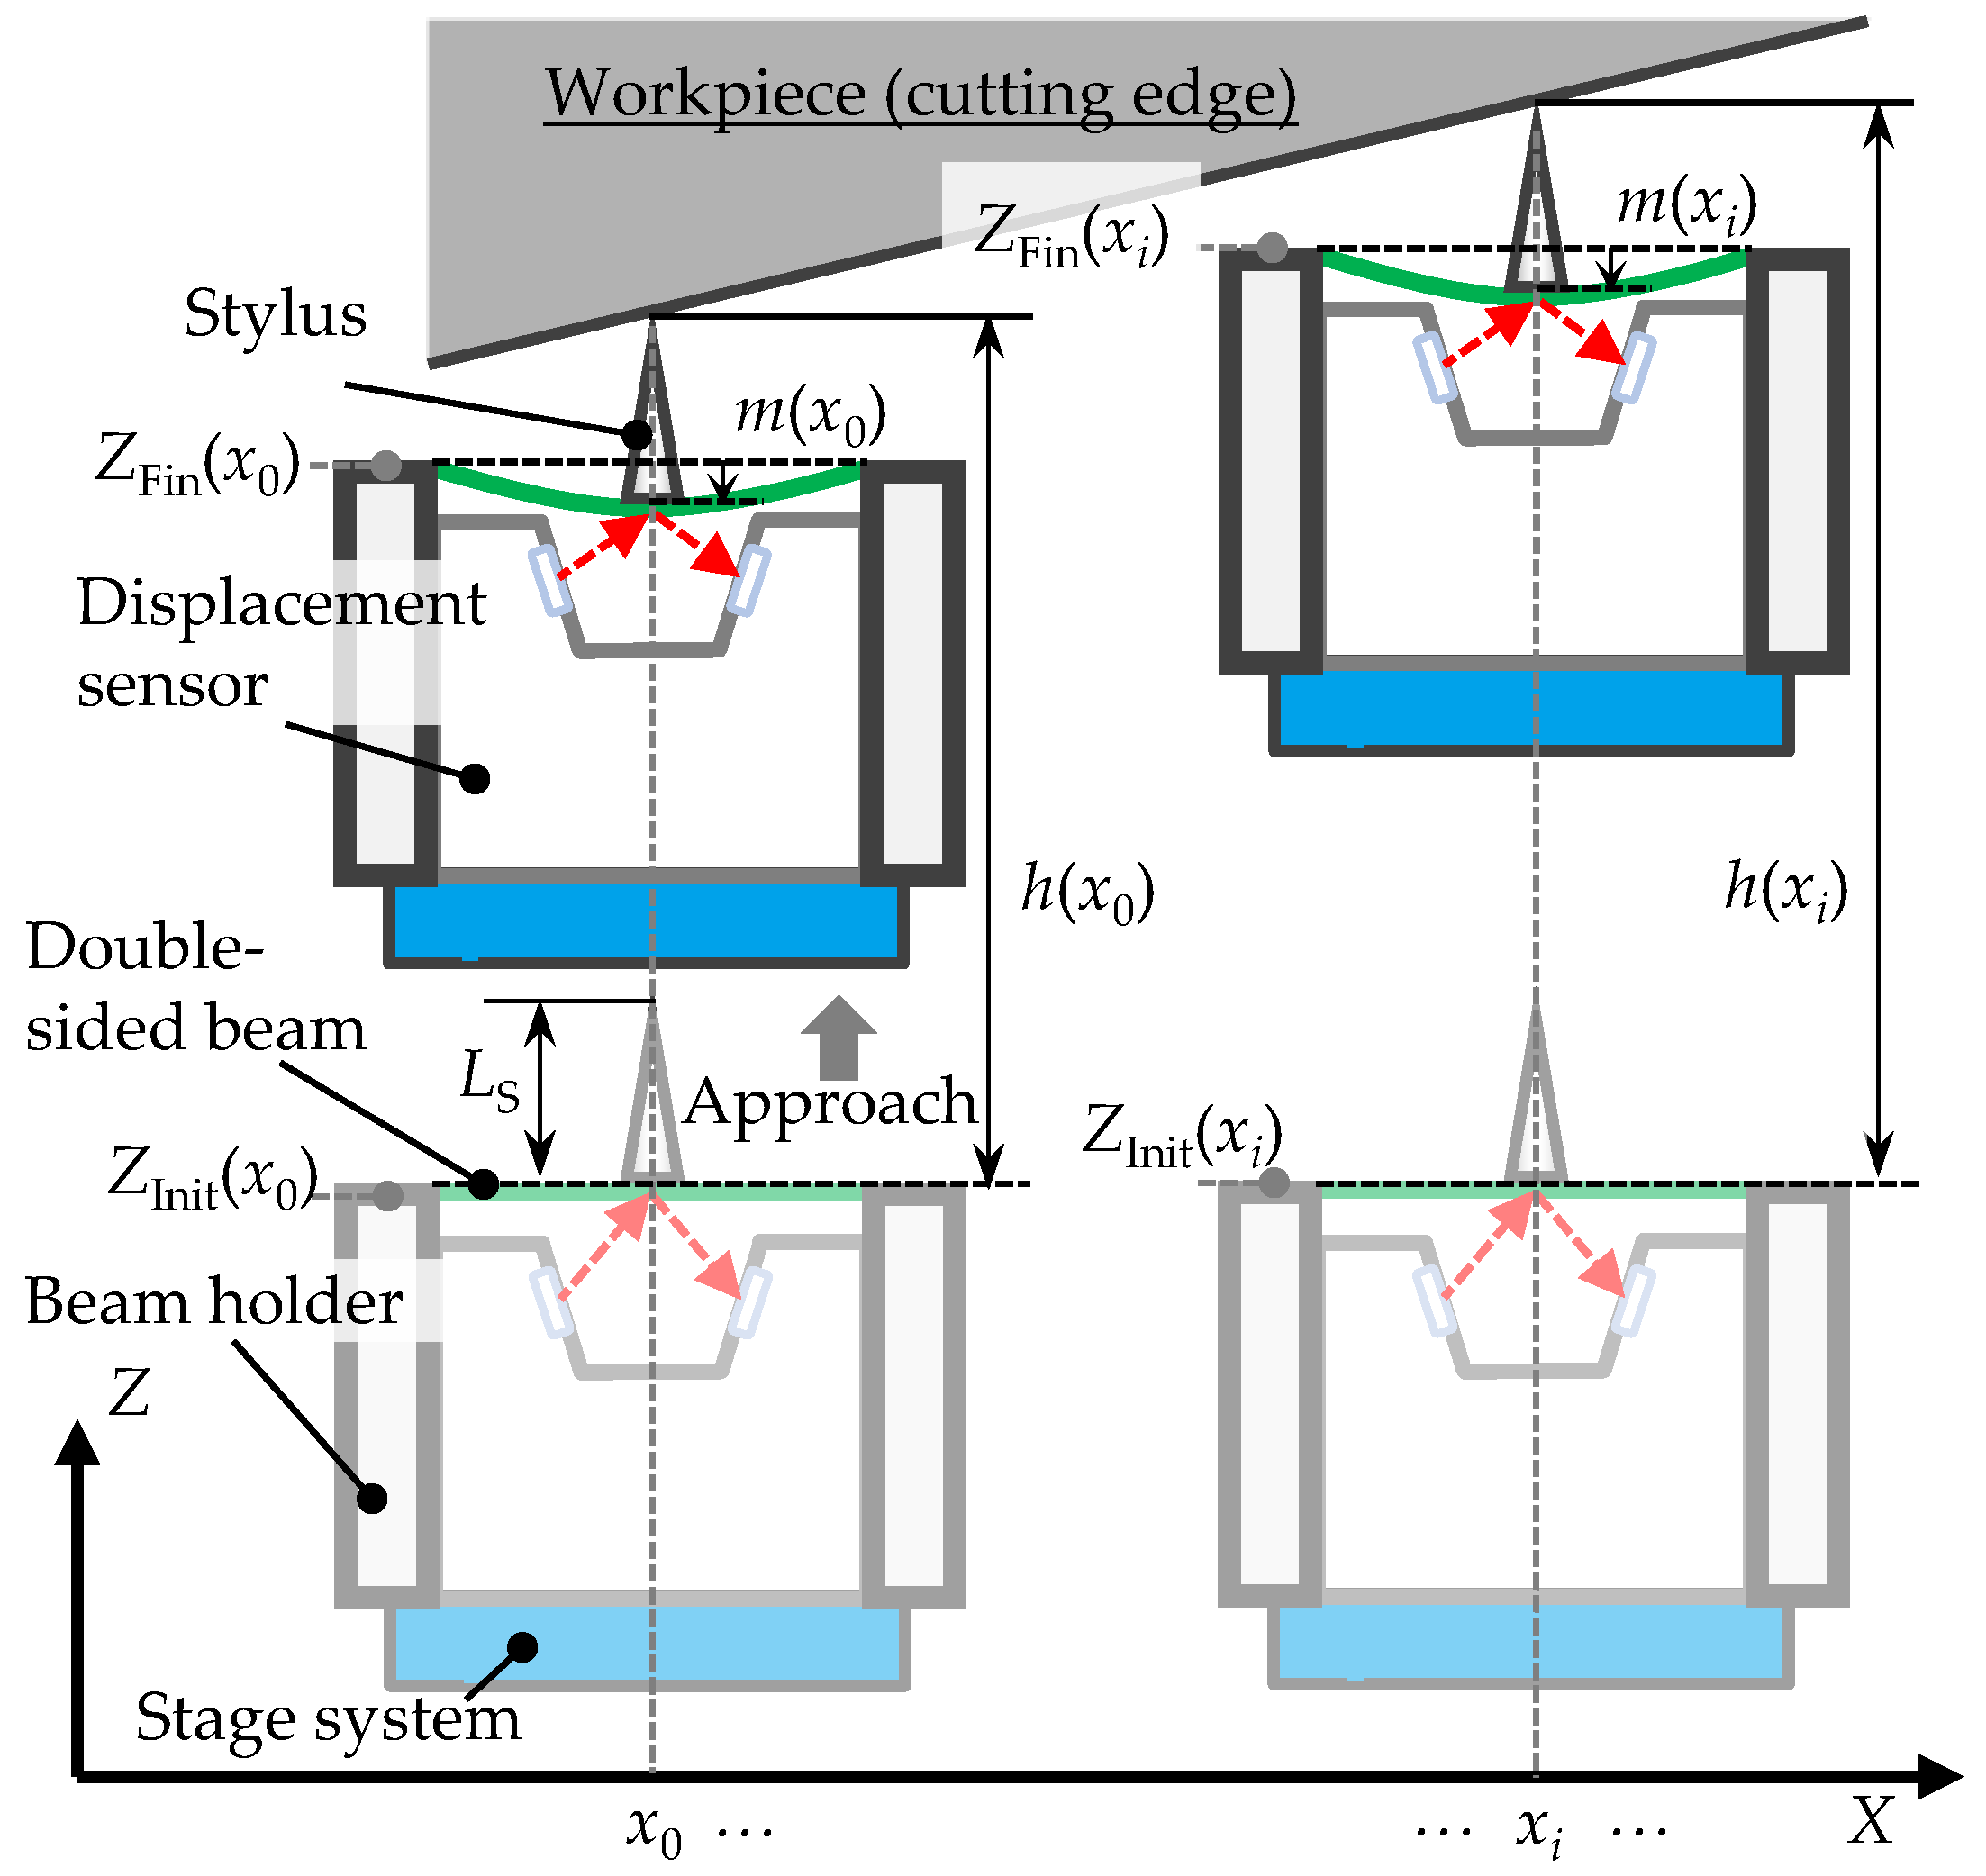
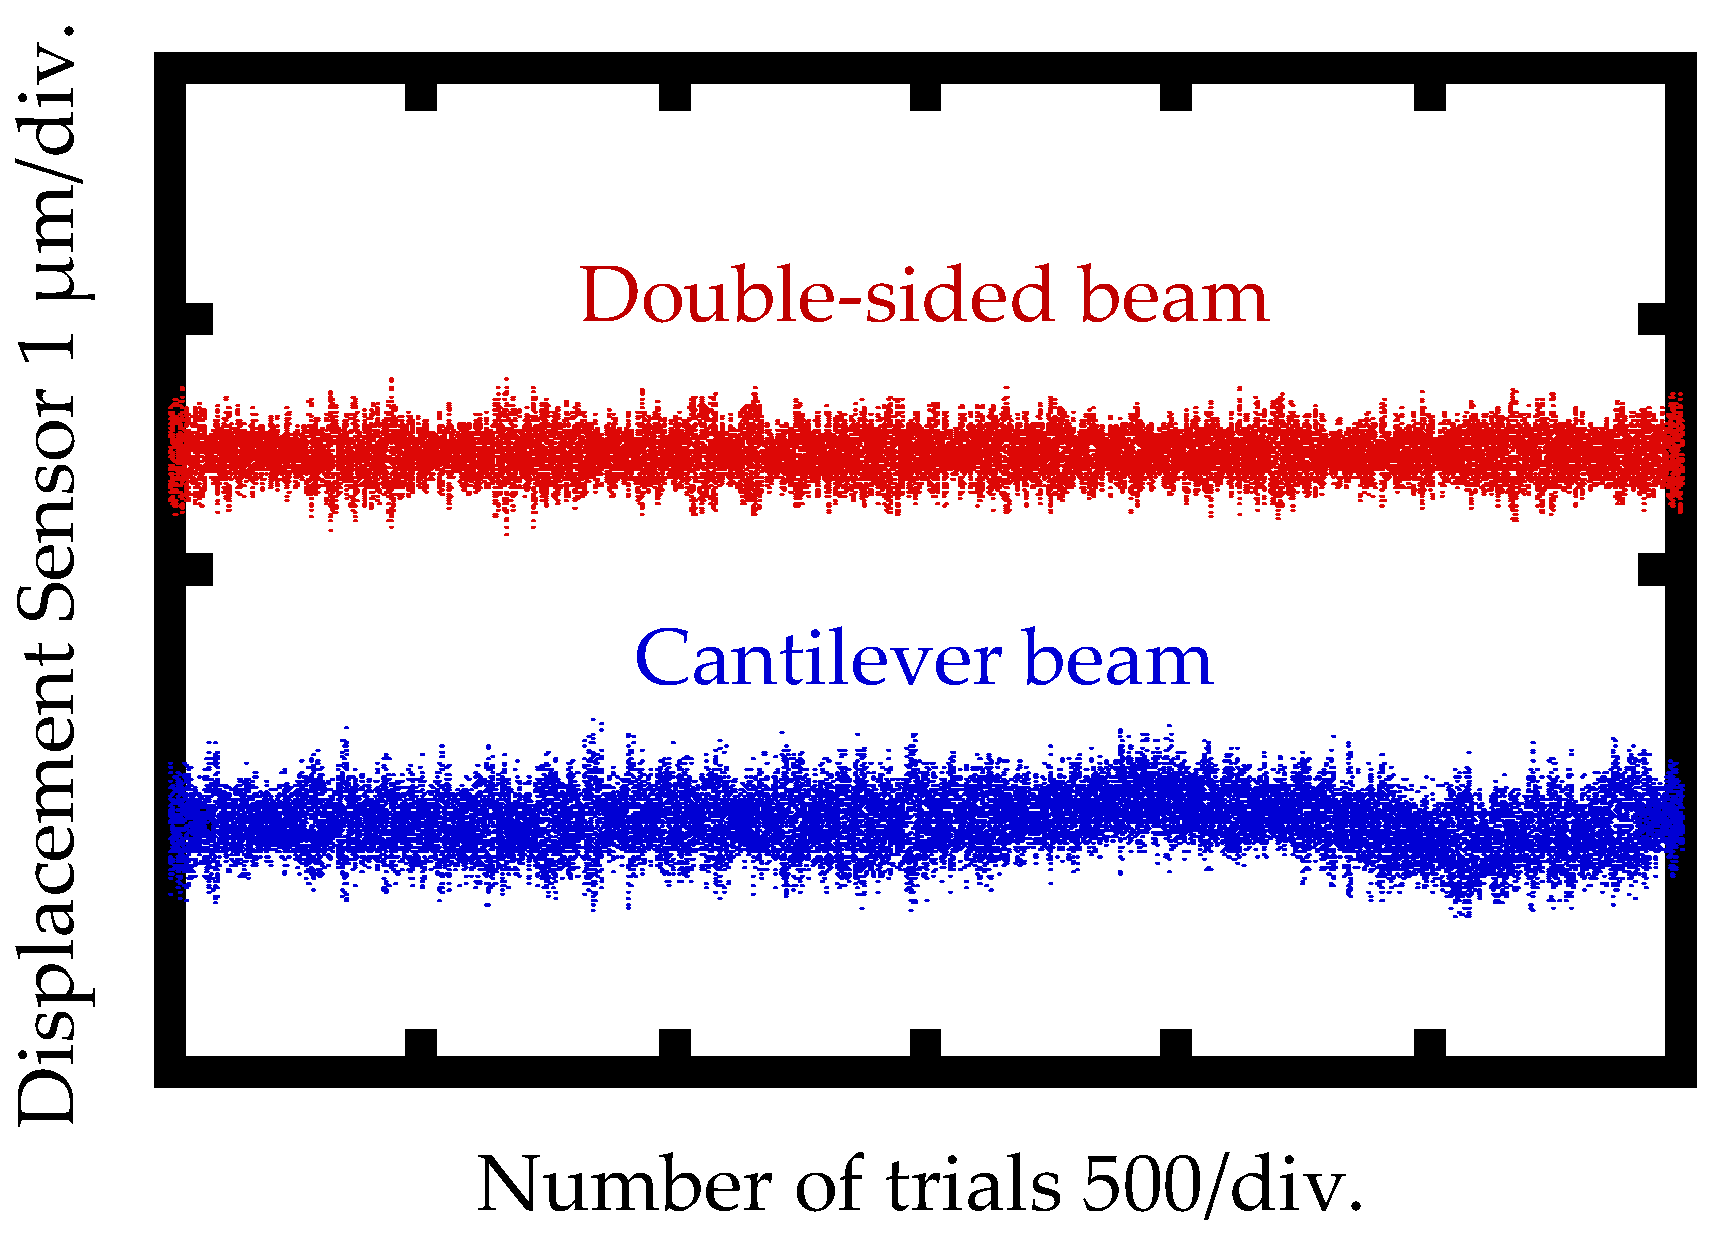
2.1. Principle of the Beam-Based Profilers

A schematic of the beam-based tool edge profiler is illustrated in Figure 2. A double-sided beam probe is employed in the figure to explain the measurement principle. As can be seen in Figure 2, the probe unit is composed of the displacement sensor and the probe unit. A probe holder is also employed in the probe unit to mount the probe onto the displacement sensor in such a way that the beam deflection along the direction of the axis of the stylus can be measured by the displacement sensor. The whole probe unit is mounted on a precision positioning system capable of traveling along the X and Z directions. It should be noted that the axes of the positioning system are aligned to the measuring coordinate system. The probe displacements along the X and Z directions can be detected by the encoders integrated into the positioning system.
Although conventional stylus-based scanning measuring instruments are effective solutions for surface profile measurement, the scanning procedure could give damage to the surface under measurement when the measuring force is not small enough. In addition, the Z-directional measurement range of most of the conventional stylus-based surface profiler is limited [31], and an additional feedback control system is required to extend the limited Z-directional measurement range. The tool edge profiler developed in this paper is expected to address the above issues by employing a positioning system with a large stroke, as well as the beam-based probe with low beam stiffness. Furthermore, an intermittent measuring method is employed; in this method, the probe unit is employed as a touch-trigger probe to carry out the cutting tool edge measurement. As can be seen in Figure 2, the probe unit is set at a certain X-position (x0); the probe unit is driven to keep approaching the sample surface by the positioning system until the reading of the displacement sensor activates the trigger value mtrig. Here, we denote the initial and final Z-positions of the probe unit as ZInit and ZFin, respectively. Thus, the distance between the original Z-position and the sample surface h(x0) can be obtained by the following equation:
h ( x 0 ) = Z Fin ( x 0 ) Z Init ( x 0 ) m i d e a l ( x 0 ) + L s ,
where mideal(x0) is the reading of the displacement sensor at the final Z-position, and Ls is the length of the stylus.
Then, by moving the probe unit along the X-direction step by step, the probing procedure described above can be repeated at different X-positions. h(xi), the Z-directional distance between the original Z-position and the sample surface at X-position xi, can be expressed as follows:
h ( x i ) = Z Fin ( x i ) Z Init ( x i ) m i d e a l ( x i ) + L s .
Thus, the surface profile f(x) can be obtained by the variation of h(x). From Equations (1) and (2), f(xi) can be written as follows:
f ( x i ) = h ( x i ) h ( x 0 ) = [ Z Fin ( x i ) Z Init ( x i ) m i d e a l ( x i ) ] [ Z Fin ( x 0 ) Z Init ( x 0 ) m i d e a l ( x 0 ) ]
In the ideal measurement situation, the readings of the displacement sensor, mideal(x), at the measurement points should be equal to the trigger value mtrig. Moreover, the original Z-position of every measurement point is set to be the same in the measuring coordinate system, as shown in Figure 2, and ZInit(x) is also a constant value. Thus, Equation (3) can be modified as follows:
f ( x i ) = Z Fin ( x i ) Z Fin ( x 0 ) .
It should be noted that Equation (4) comes from a condition when assuming the readings of the laser displacement sensor m(xi) is a constant value. However, in the practical case, some factors, such as mechanical vibration and control system delay, make m(xi) variable. Significantly, when a point on a slope is detected, the slip of the stylus on the measuring surface could affect m(xi). Therefore, to improve the measurement accuracy, the readings of the laser displacement sensor are introduced into Equation (4) as a compensation item. The surface profile f(x) can then be rewritten as follows:
f ( x i ) = Z Fin ( x i ) Z Fin ( x 0 ) m ( x i ) + m ( x 0 ) .
According to Equation (5), surface profile f(x) can be evaluated by the Z-directional displacement of the probe given by the positioning system.

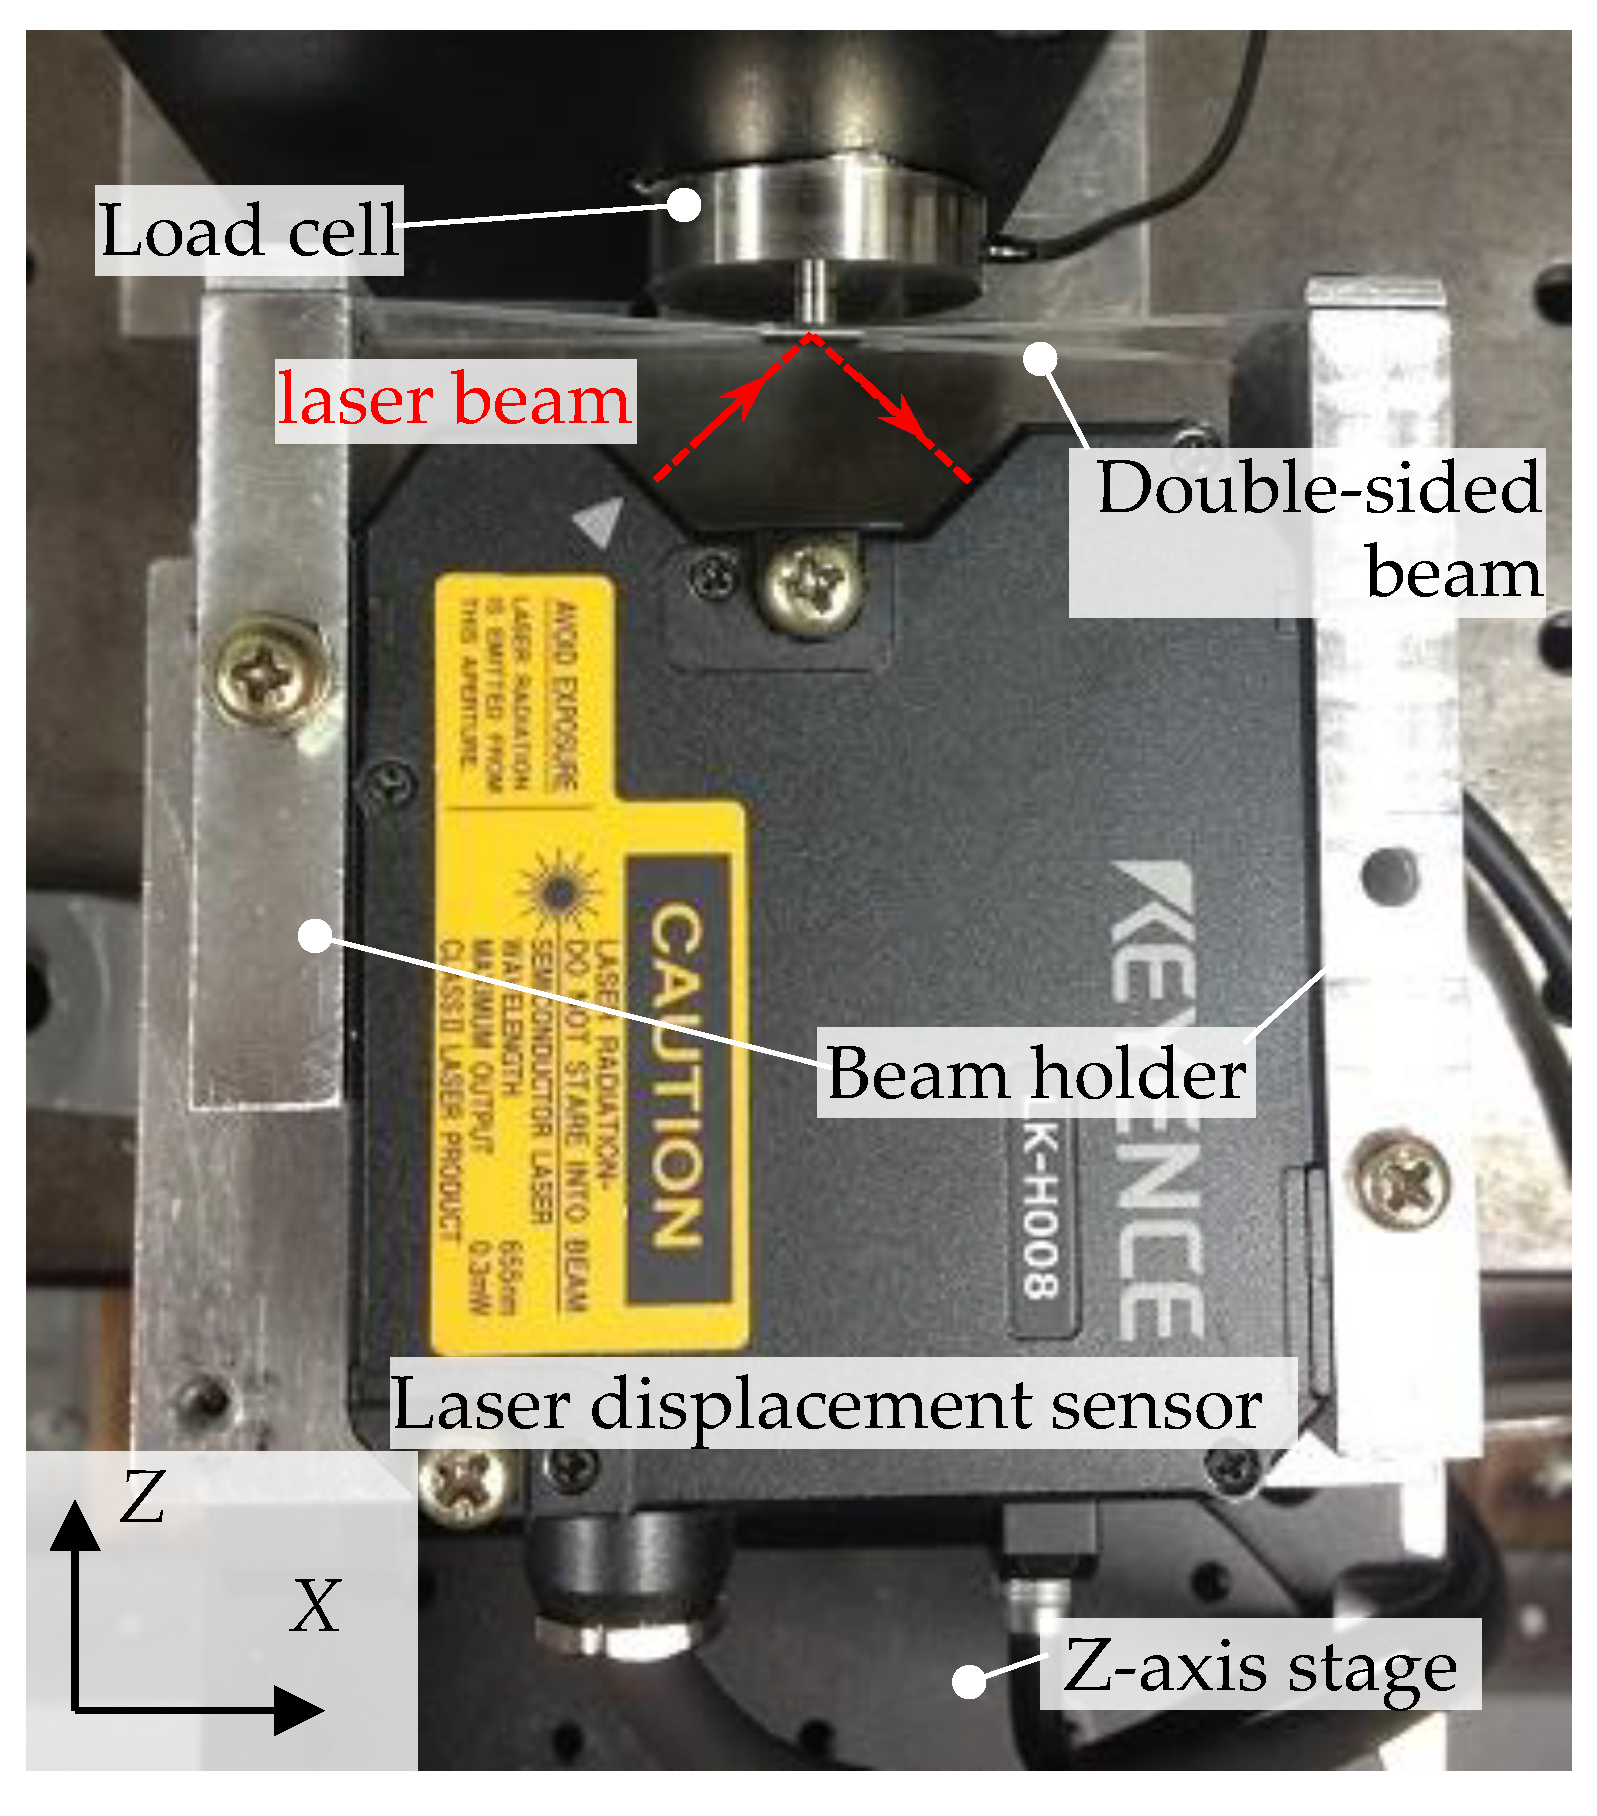
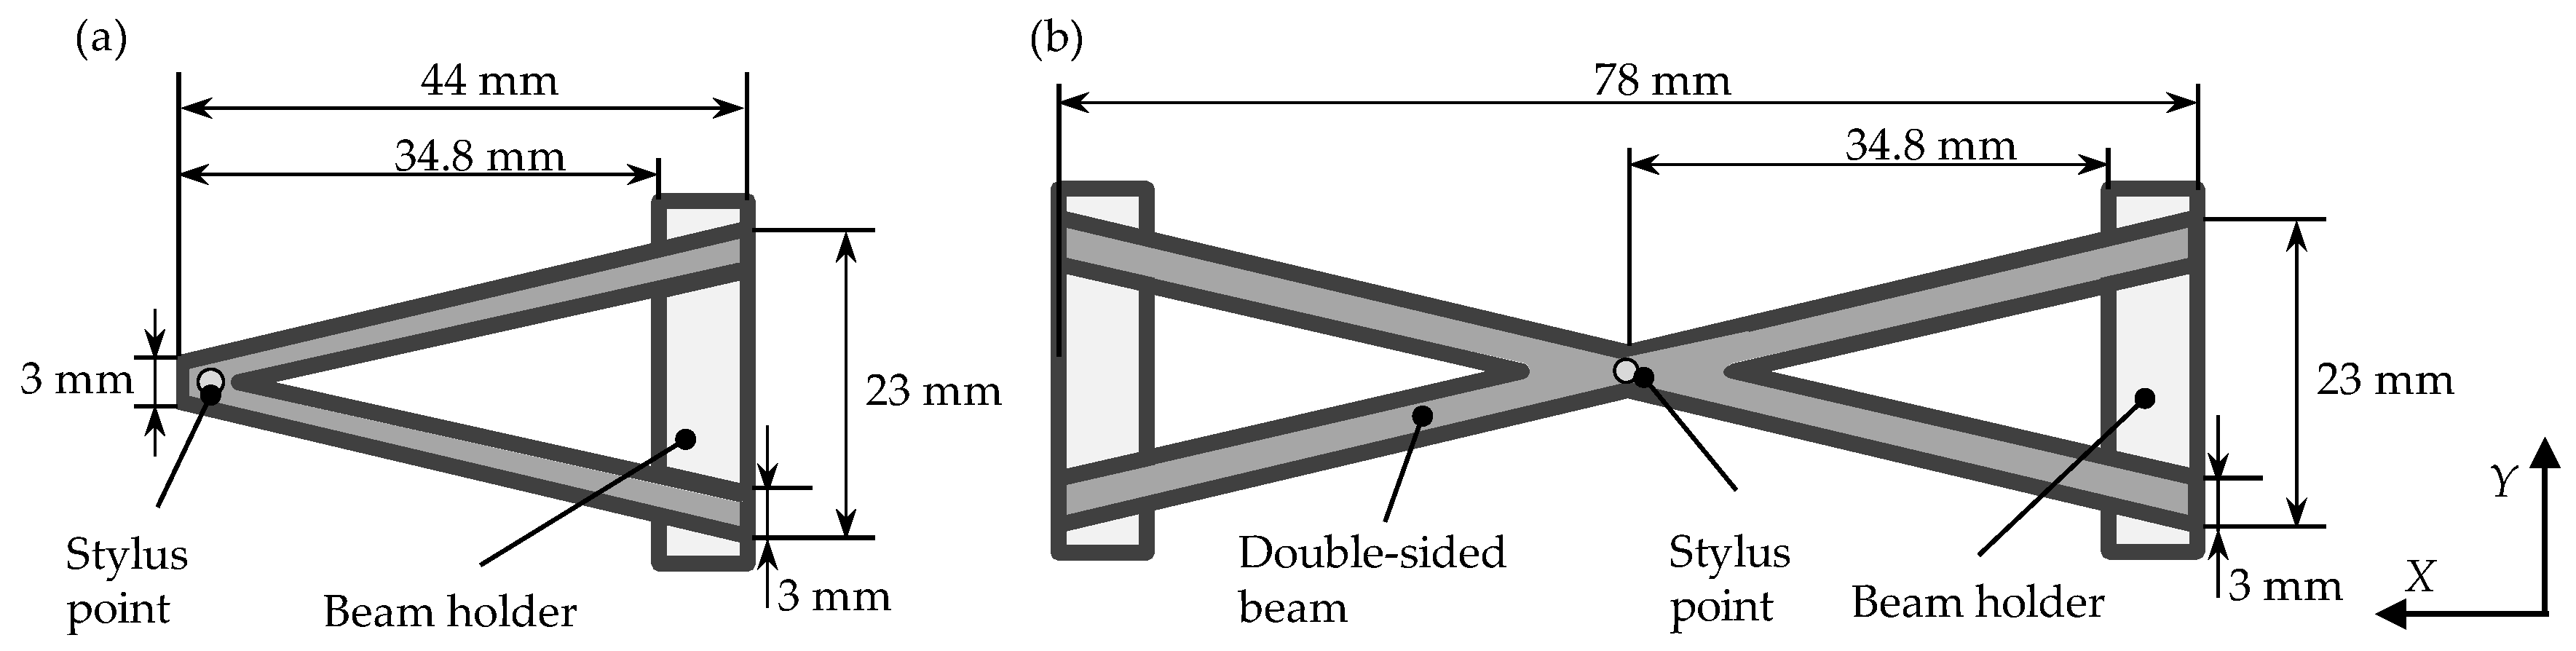
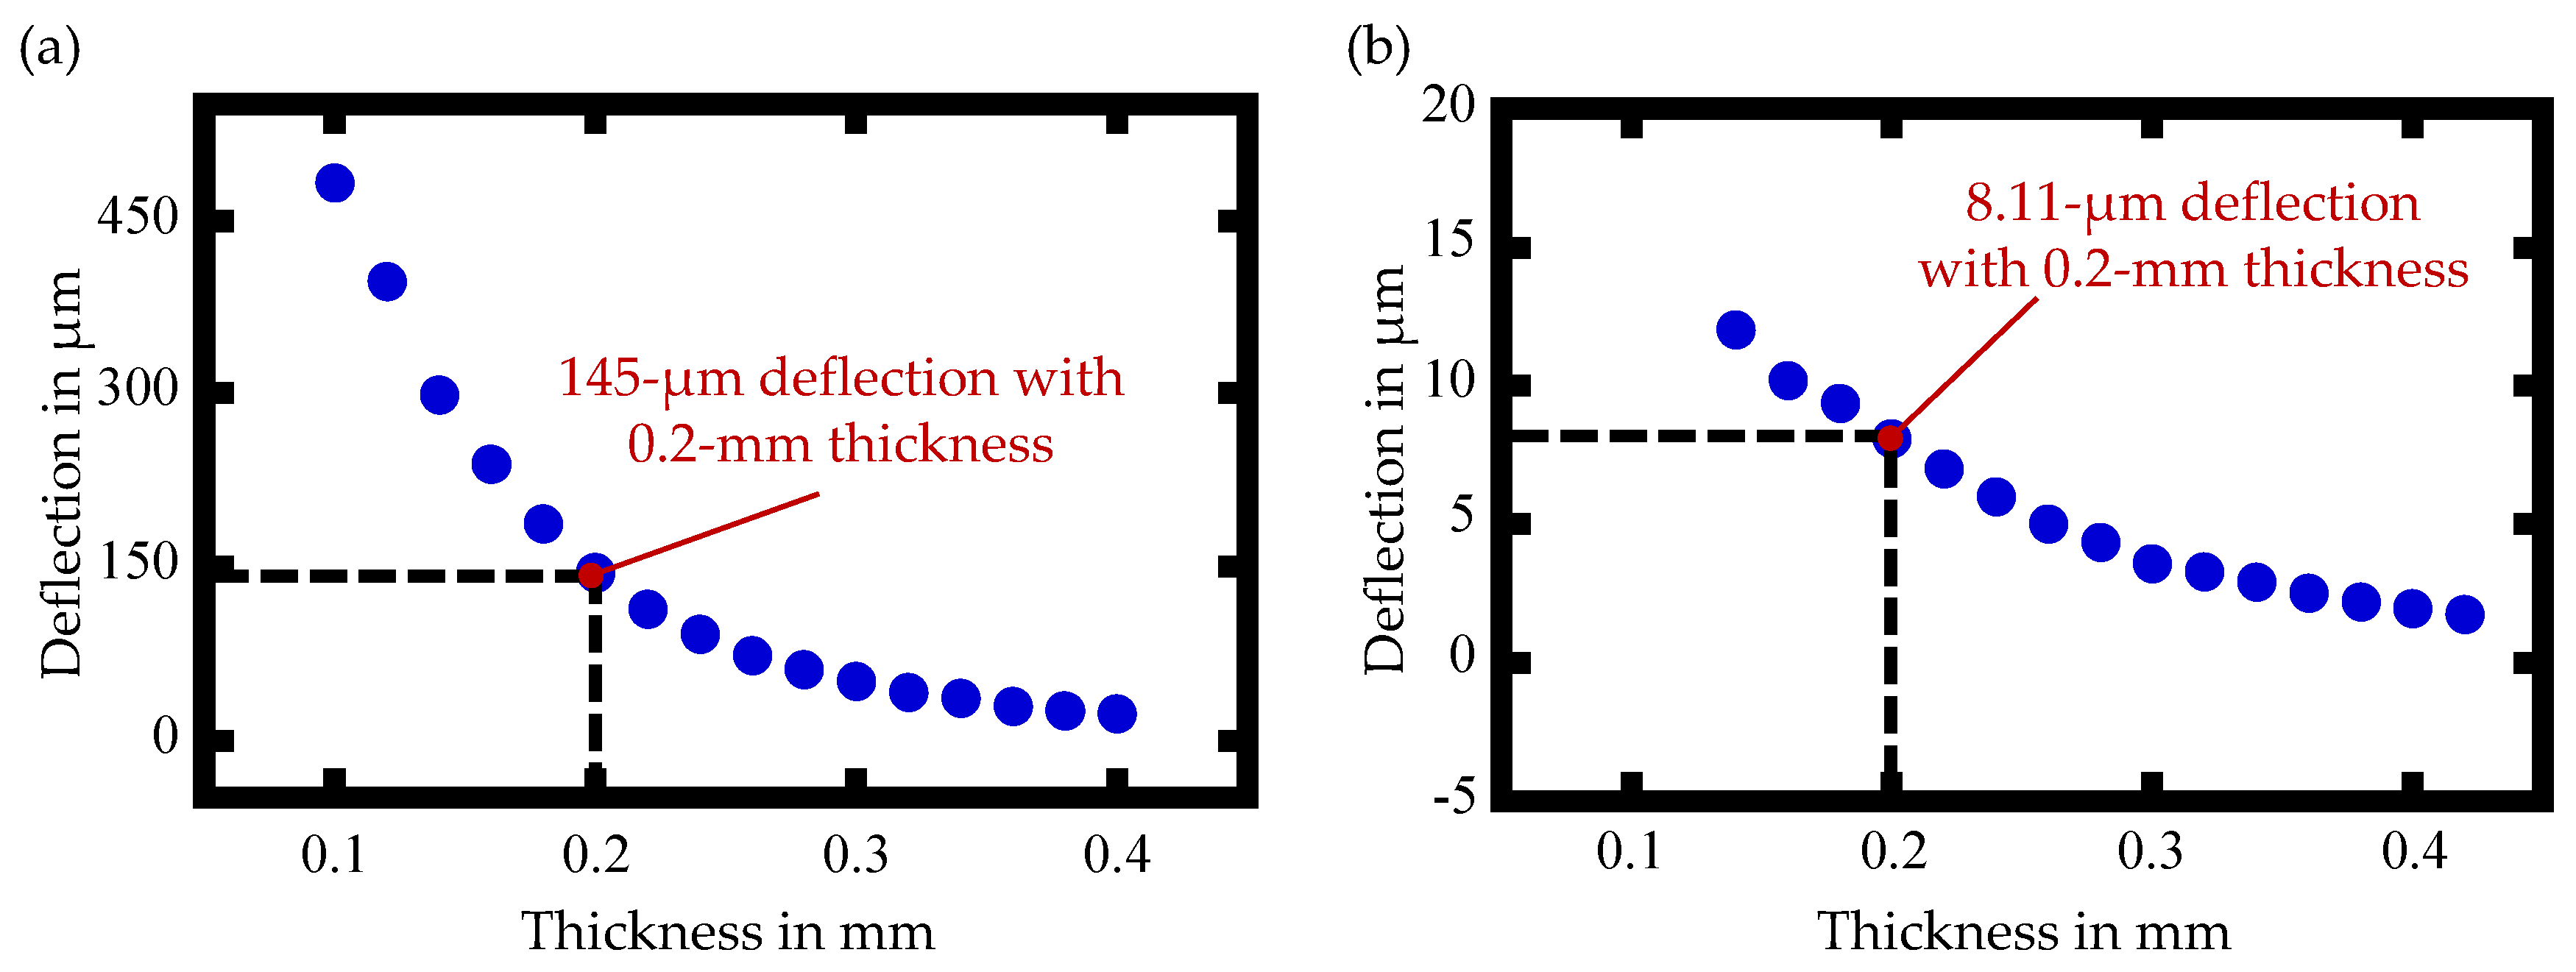
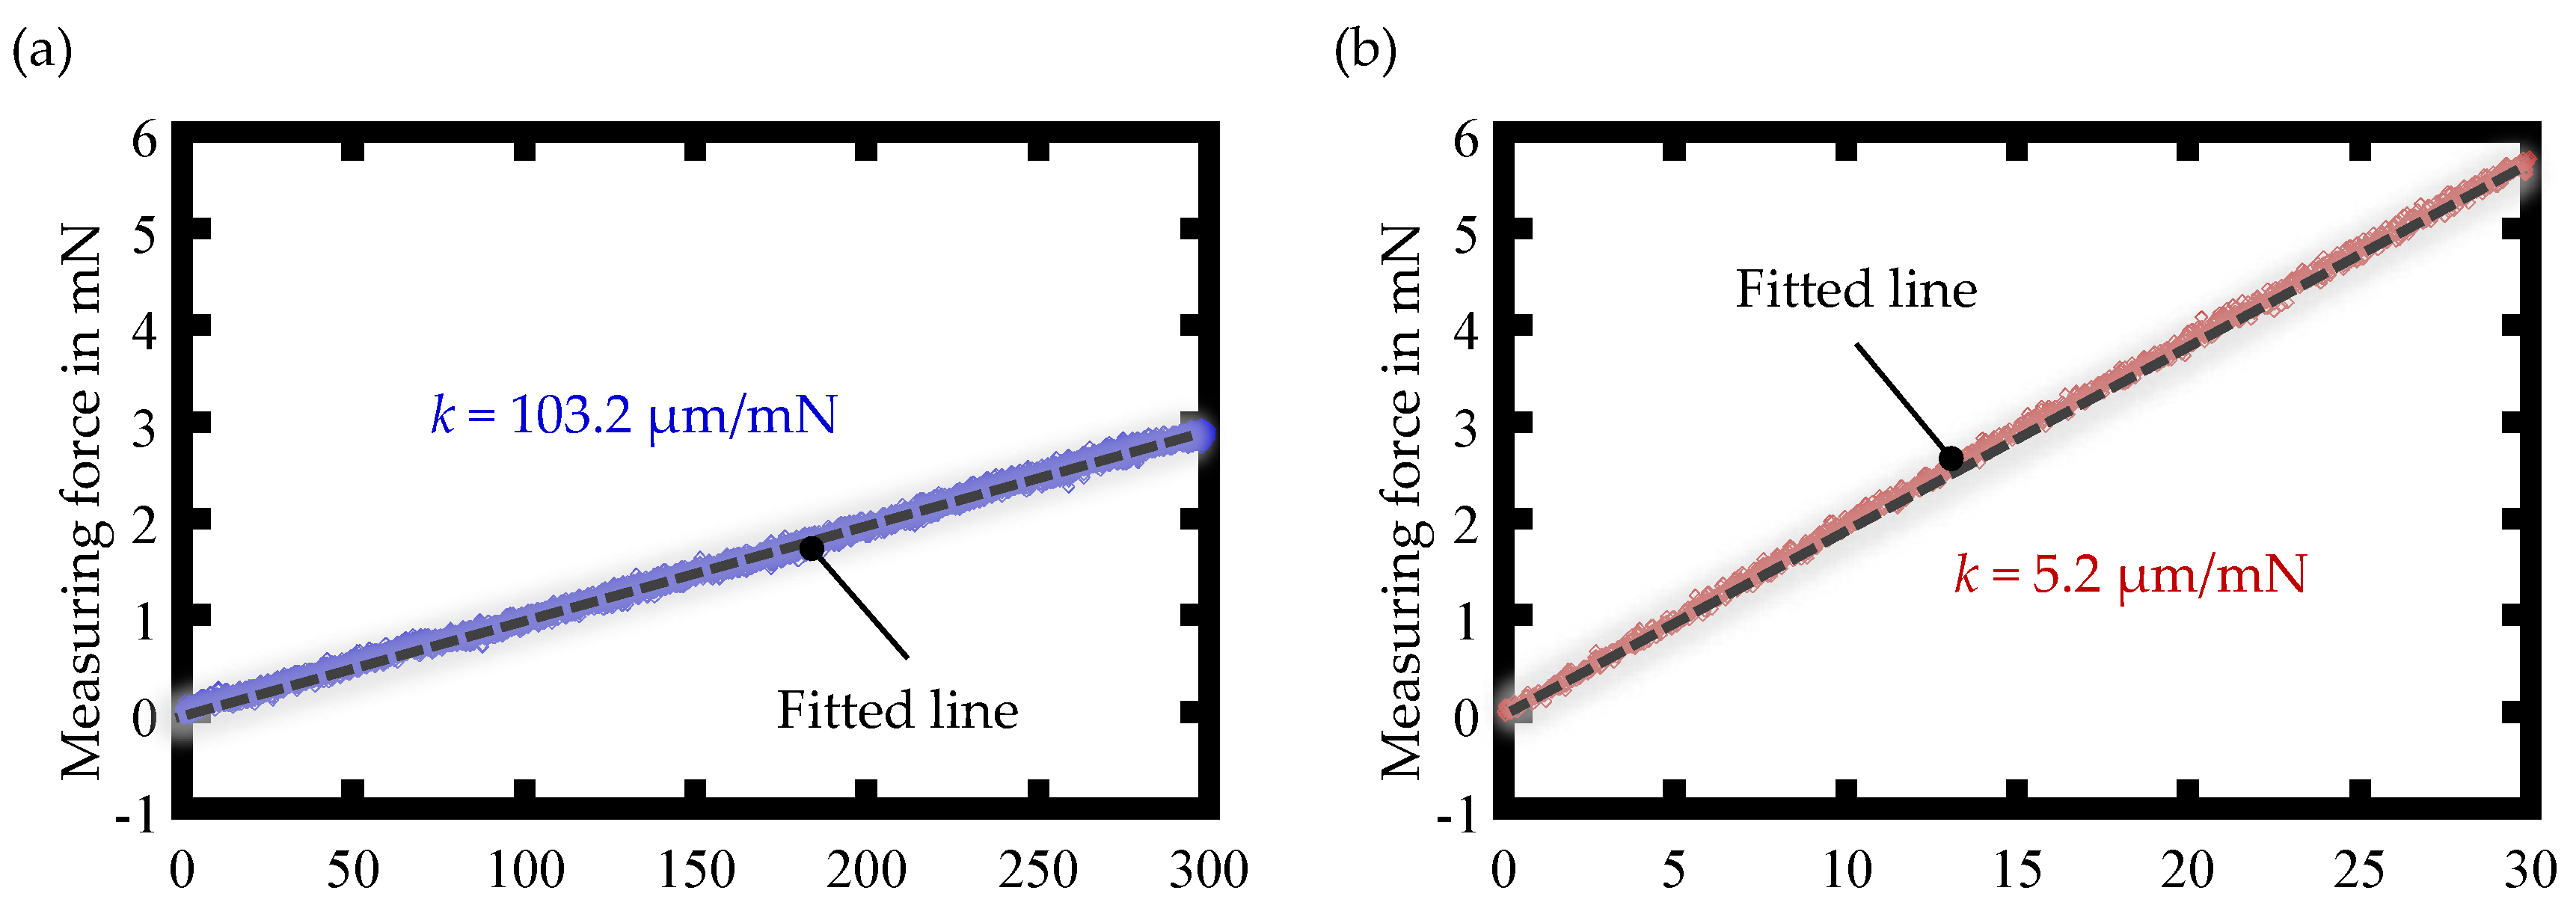
2.2. Construction of the Profilers

The geometric design of the cantilever beam and double-sided beam (referred to as V-beam and X-beam, respectively, in the following) are illustrated in Figure 3. As can be seen in the figure, both beams are the same size in the Y-direction, while the X-beam is twice the size of the V-beam in the X-direction. In addition, the positions of the styli with respect to the probe holder are designed to be the same. This similar dimensional characteristic is to ensure that the measurement point of the displacement sensor falls exactly at the fixed point of the stylus. It should be noted that the size of both profilers’ beams in this paper is determined by the size of the displacement sensor employed to measure the deformation of the beam.
Moreover, to avoid the slip of the stylus tip in the measurement process, the lateral force to be applied to the stylus should be less than the maximum static friction force. Denoting the maximum static friction force as F and the measuring force as N, the following relationship should be satisfied:
N cos ( θ ) < F ,
where θ is the angle of the probe with respect to the normal of the measuring surface. To suppress the tip slip and reduce the damage to the measuring surface as much as possible, the measuring force N was determined to be 0.1 mN in this paper. It should be noted that the asymmetric beam deformation when measuring a surface with a slope angle could affect the reading of the displacement sensor in the probe unit and could affect the measurement repeatability; however, this could be suppressed by reducing the beam deformation through reducing the measuring force.
Assuming that a load of 0.1 mN is applied to the stylus tip, by changing the thickness of the beams, the amount of the deflection can be simulated based on the finite element method (FEM). Figure 4a,b show the fitted curves that reflect the relationship between the beam thickness and the deflections under 0.1 mN load. Obviously, when the same load is applied to the V- and X-beams with the same thickness, the deformation of the V-beam is much larger than that of the X-beam; this means that the profiler with the cantilever beam can achieve a larger measurement range in the Z-direction in practical measurement. For instance, when the thickness of both beams is set to be 0.2 mm and the measurement force is below 0.1 mN, the Z-direction measurement range of the profiler with the V-beam can reach 145 µm, while that of the profiler with the X-beam reaches only 8.1 µm.
In addition, the spring constant of the two kinds of flexible beams was also evaluated experimentally by employing the experimental setup shown in Figure 5. In the figure, only the setup with a 0.2-mm-thick X-beam is indicated, for the sake of simplicity. For edge radius measurement, a tungsten stylus with a spherical tip having a radius of 2 μm will be mounted on the beam; however, it was detached from the beam temporarily in the evaluation experiments of the beam spring constant to protect the load cell. A laser displacement sensor (LK-H008, Keyence, Osaka, Japan) based on laser triangulation was employed to measure the deflection of the beam. It should be noted that the laser spot of the displacement sensor on the beam was aligned to be behind the stylus so that the Z-directional displacement of the stylus could be measured. The beam holders and the laser displacement sensor were mounted on the probe base to construct the probe unit. The probe unit was mounted on the two-axis positioning unit composed of two single-axis DC servo motor stages (M-112.1DG, Physik Instrumente GmbH, Karlsruhe, Germany) aligned orthogonally to each other. The rotary-encoder-based displacement sensors embedded in the stages can measure the X- and Z-directional displacements of the stage system, and the encoder readings were employed to monitor the position of the probe unit.
To evaluate the spring constant of the flexible beams, the probe unit was moved along the Z-direction by the positioning system to push a load cell, which is employed to detect the applied load; and the laser displacement sensor was used to measure the deflection of the beam. Figure 6a,b show the experimental results of the cantilever beam and the double-sided beam, respectively. In the figure, fitted lines obtained based on the least-squares method were also plotted. According to the experimental results, the spring constants of the V-beam and the X-beam were evaluated to be 103.2 μm/mN and 5.2 μm/mN, respectively; these results well agreed with the simulation results obtained by FEM.
Regarding the results of FEM simulation and experiments, it can be concluded that the V-beam has a larger measurement range in the Z-direction and is more sensitive to the forces than the X-beam. However, in practical surface profile measurement, we should consider not only the measurement range and sensitivity of the measurement system but also the system’s robustness against environmental factors, such as temperature, vibration, and so on.
After the evaluation of the spring constants of two kinds of flexible beams, the stability of the profiler was also evaluated. Since the Z-position of the measurement point is obtained in the state when the stylus is in contact with the measuring surface and the contact force is 0.1 mN, the stability evaluation experiments were also conducted under a load of 0.1 mN to the probe. A measurement duration was set to be 30 s, while the sampling frequency was set to be 1 kHz. Figure 7 shows the variations of the reading of the laser displacement sensor in the probe units when employing the two types of beams. Peak-to-peak values are employed to evaluate the stability of the profiler with the cantilever beam and the double-sided beam were evaluated to be 0.82 μm, and 0.72 μm, respectively. These results demonstrated that the profiler could achieve better stability with the double-sided beam in the profile measurement.

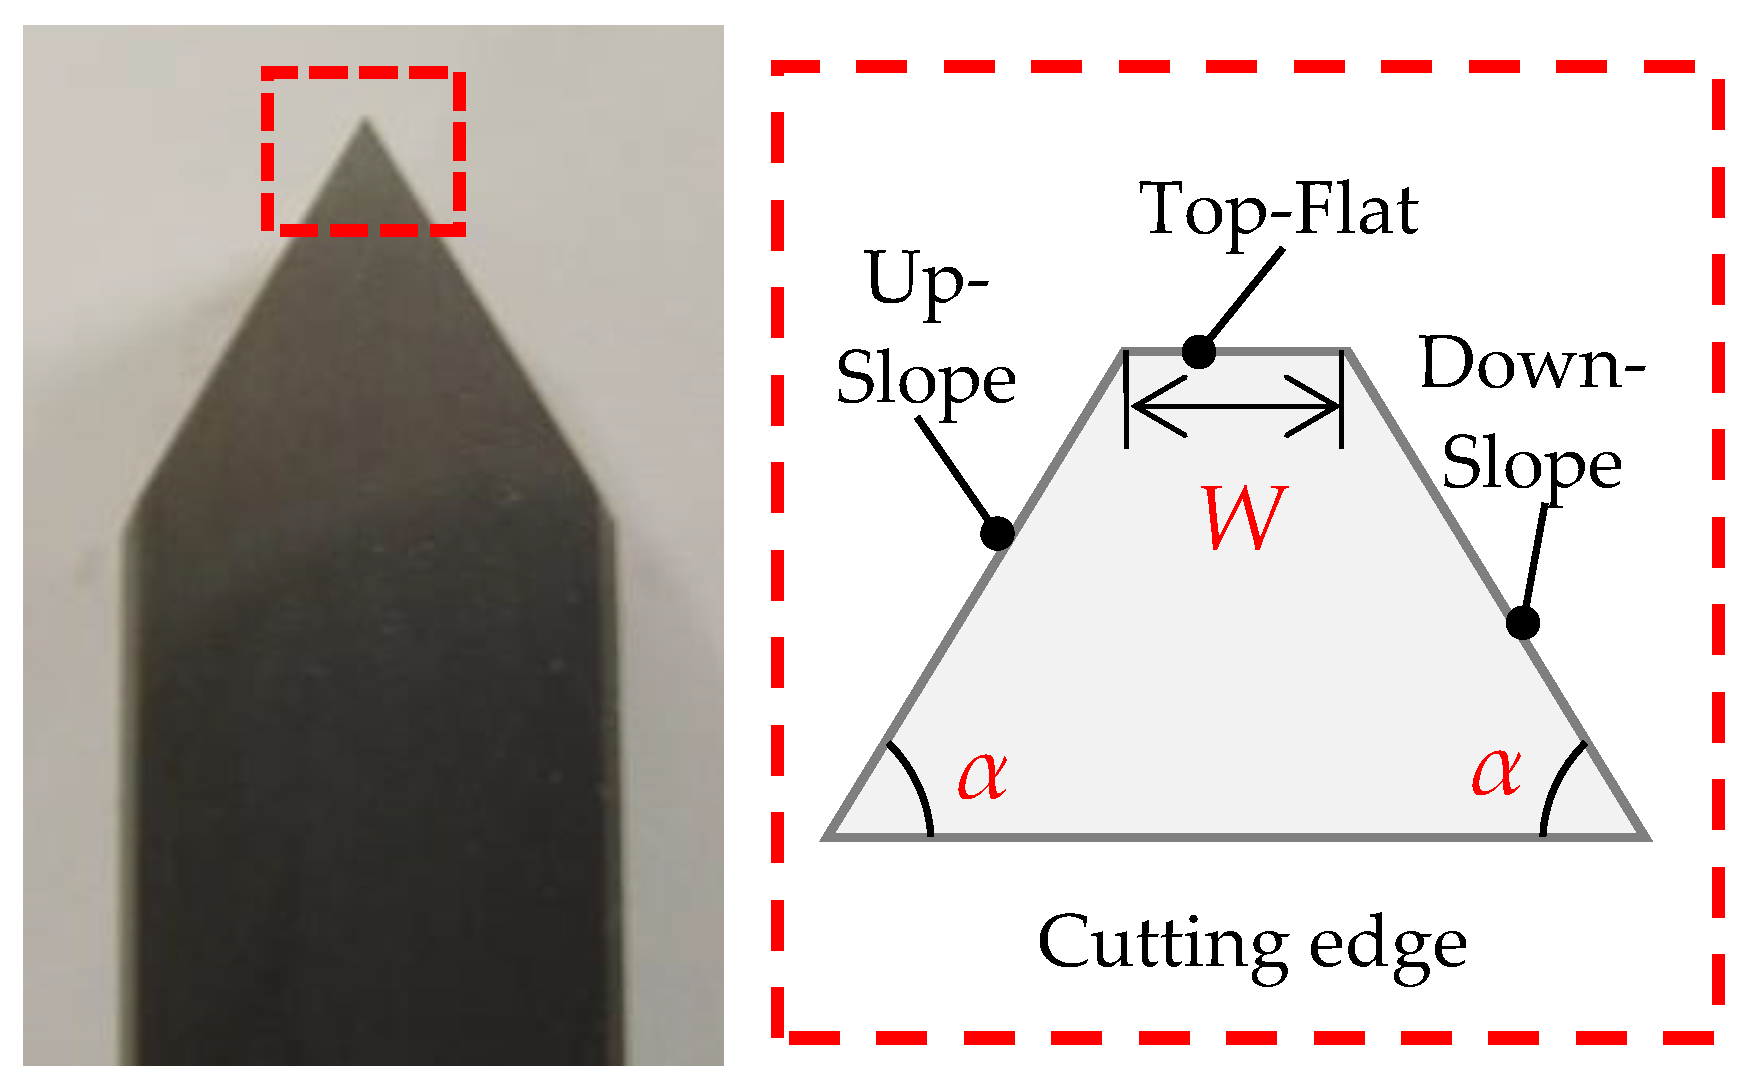
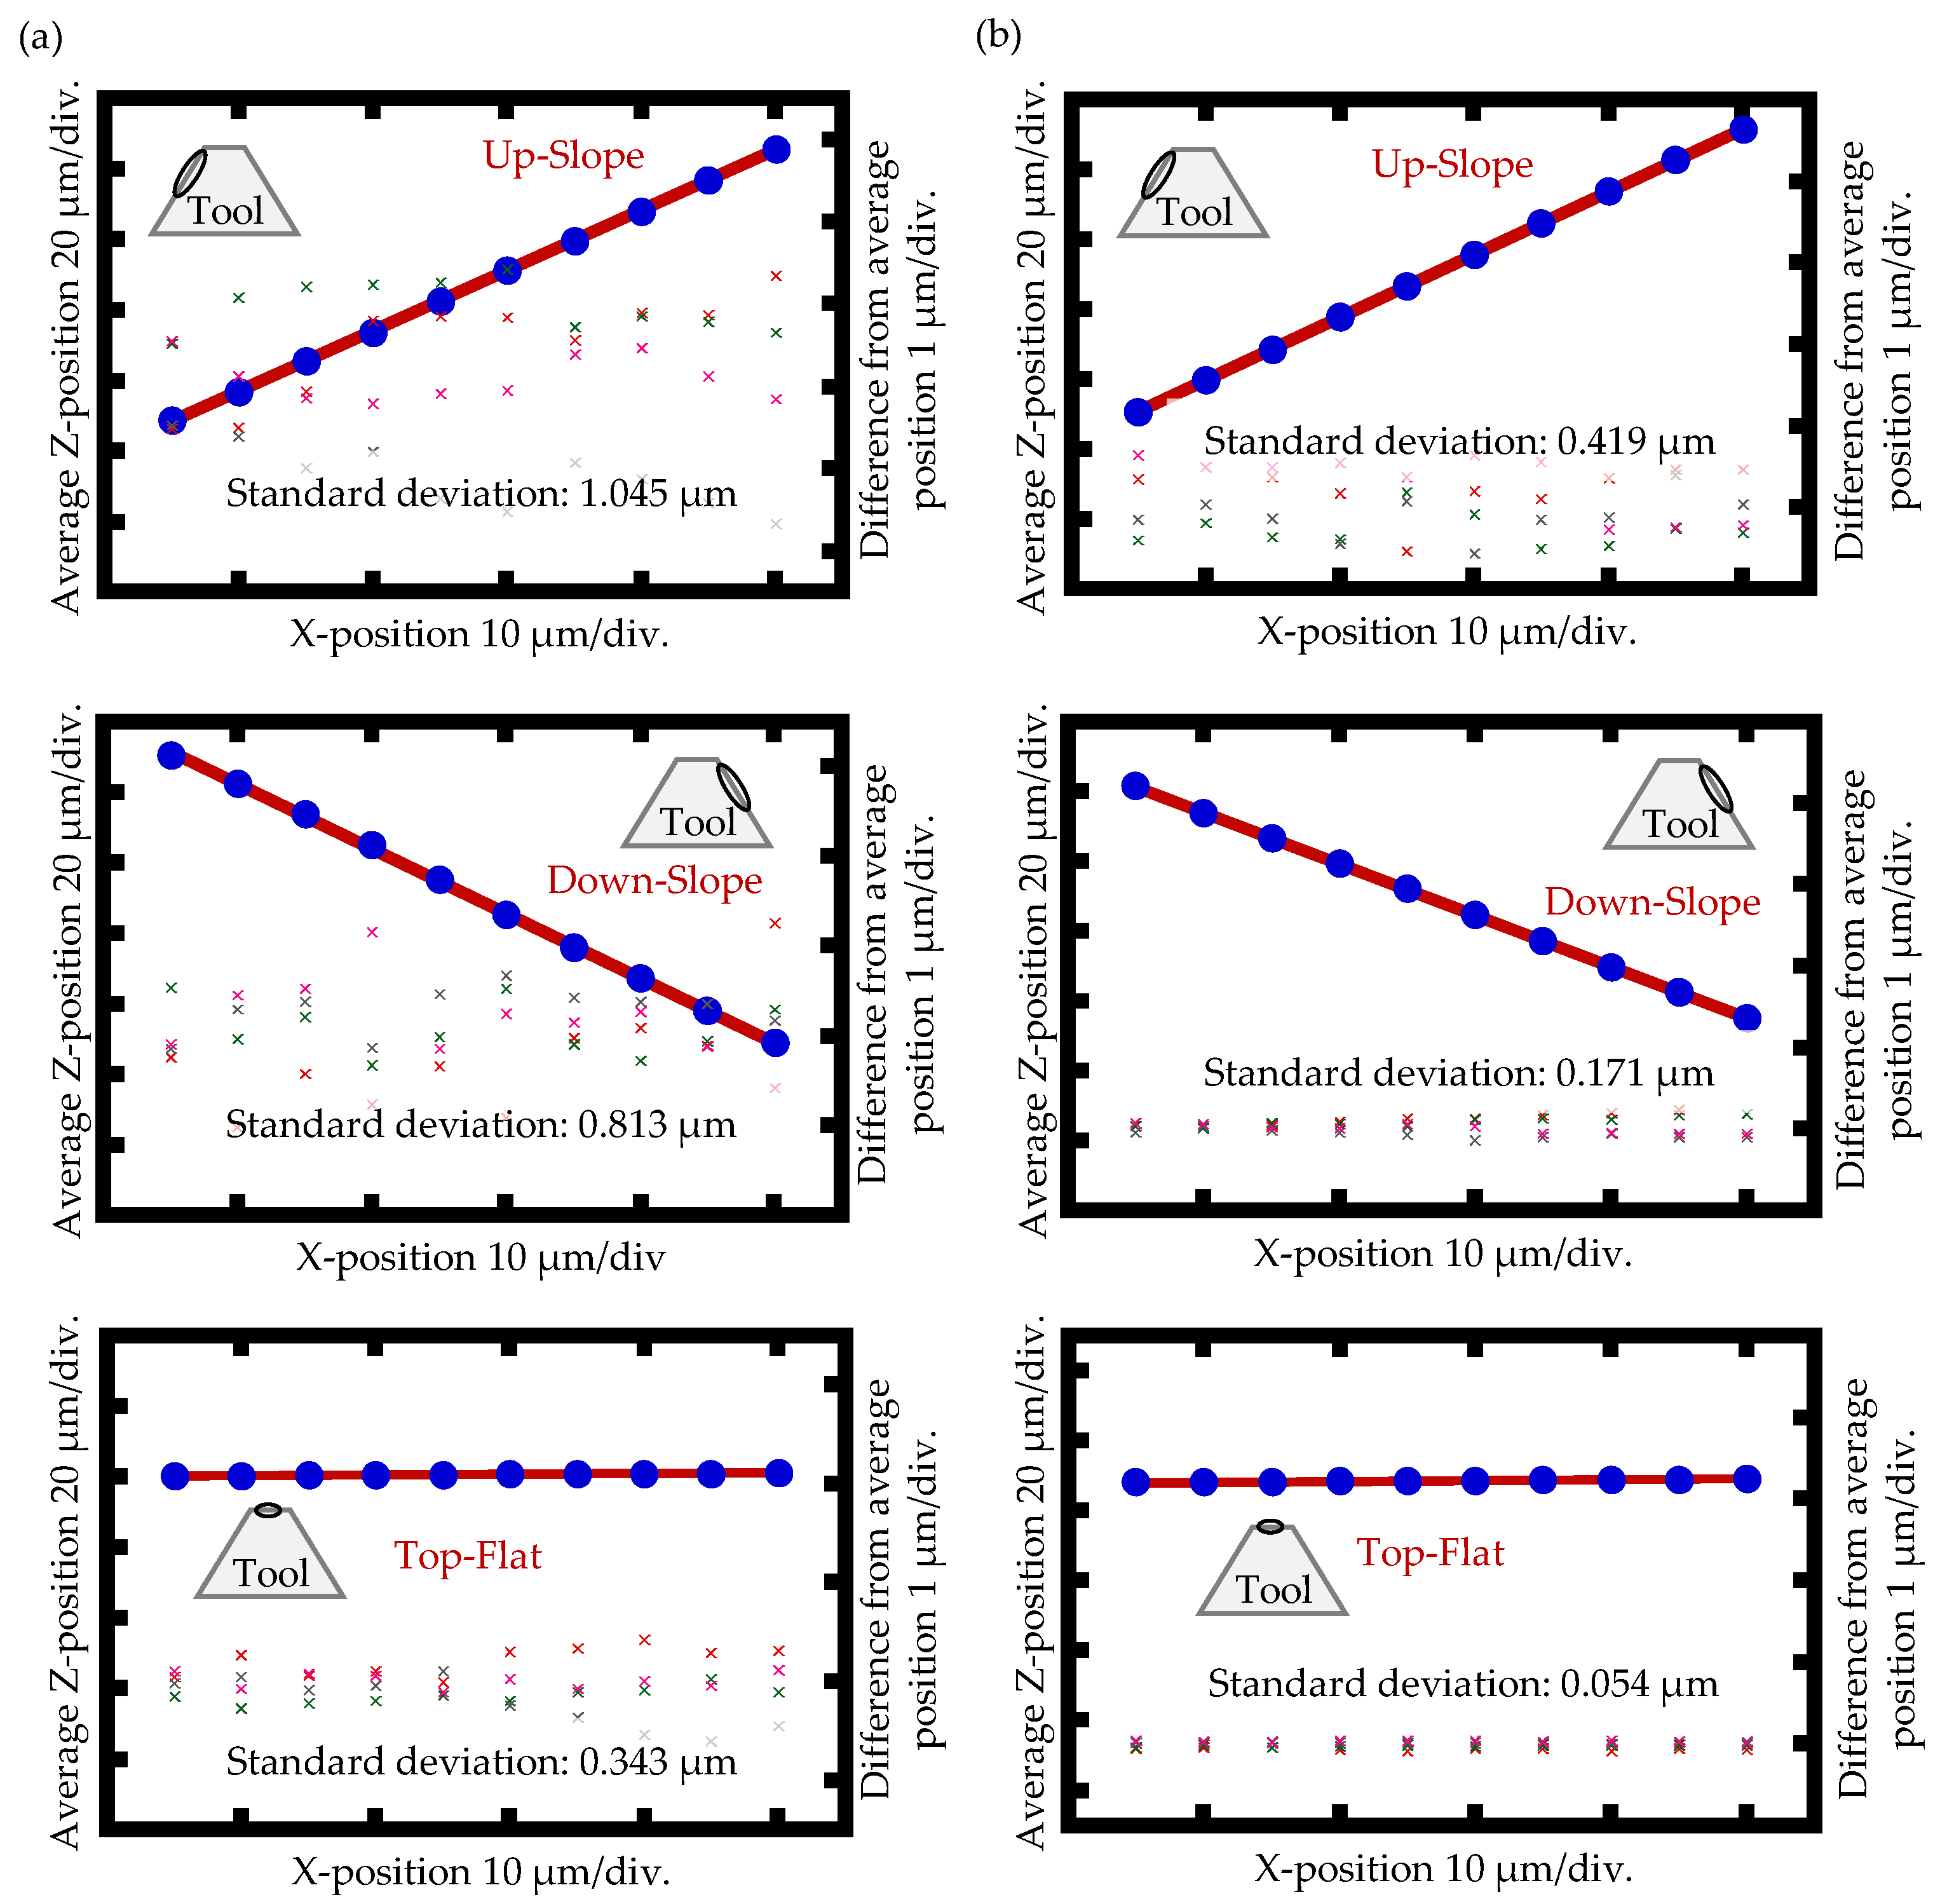
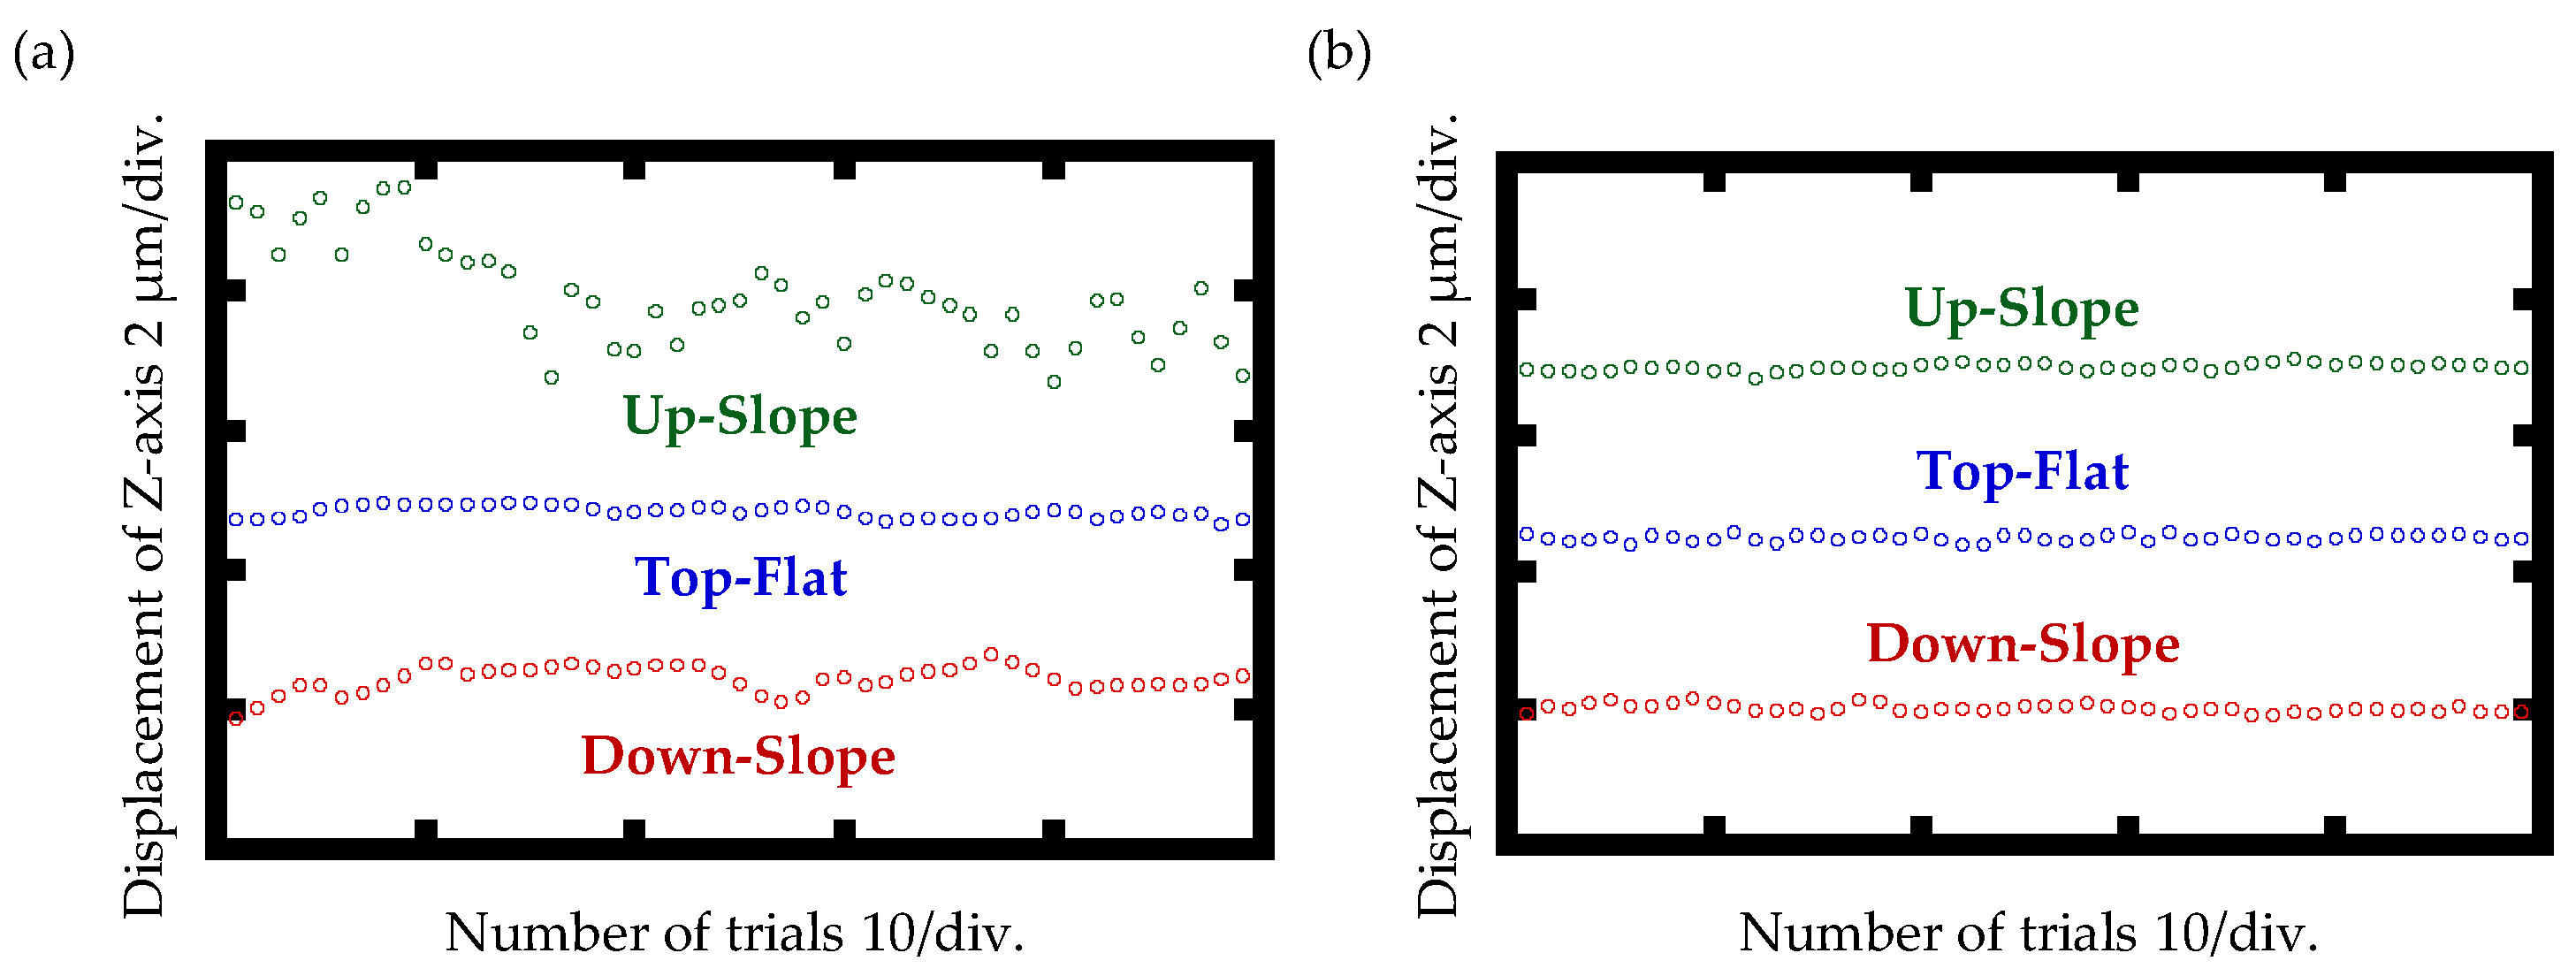
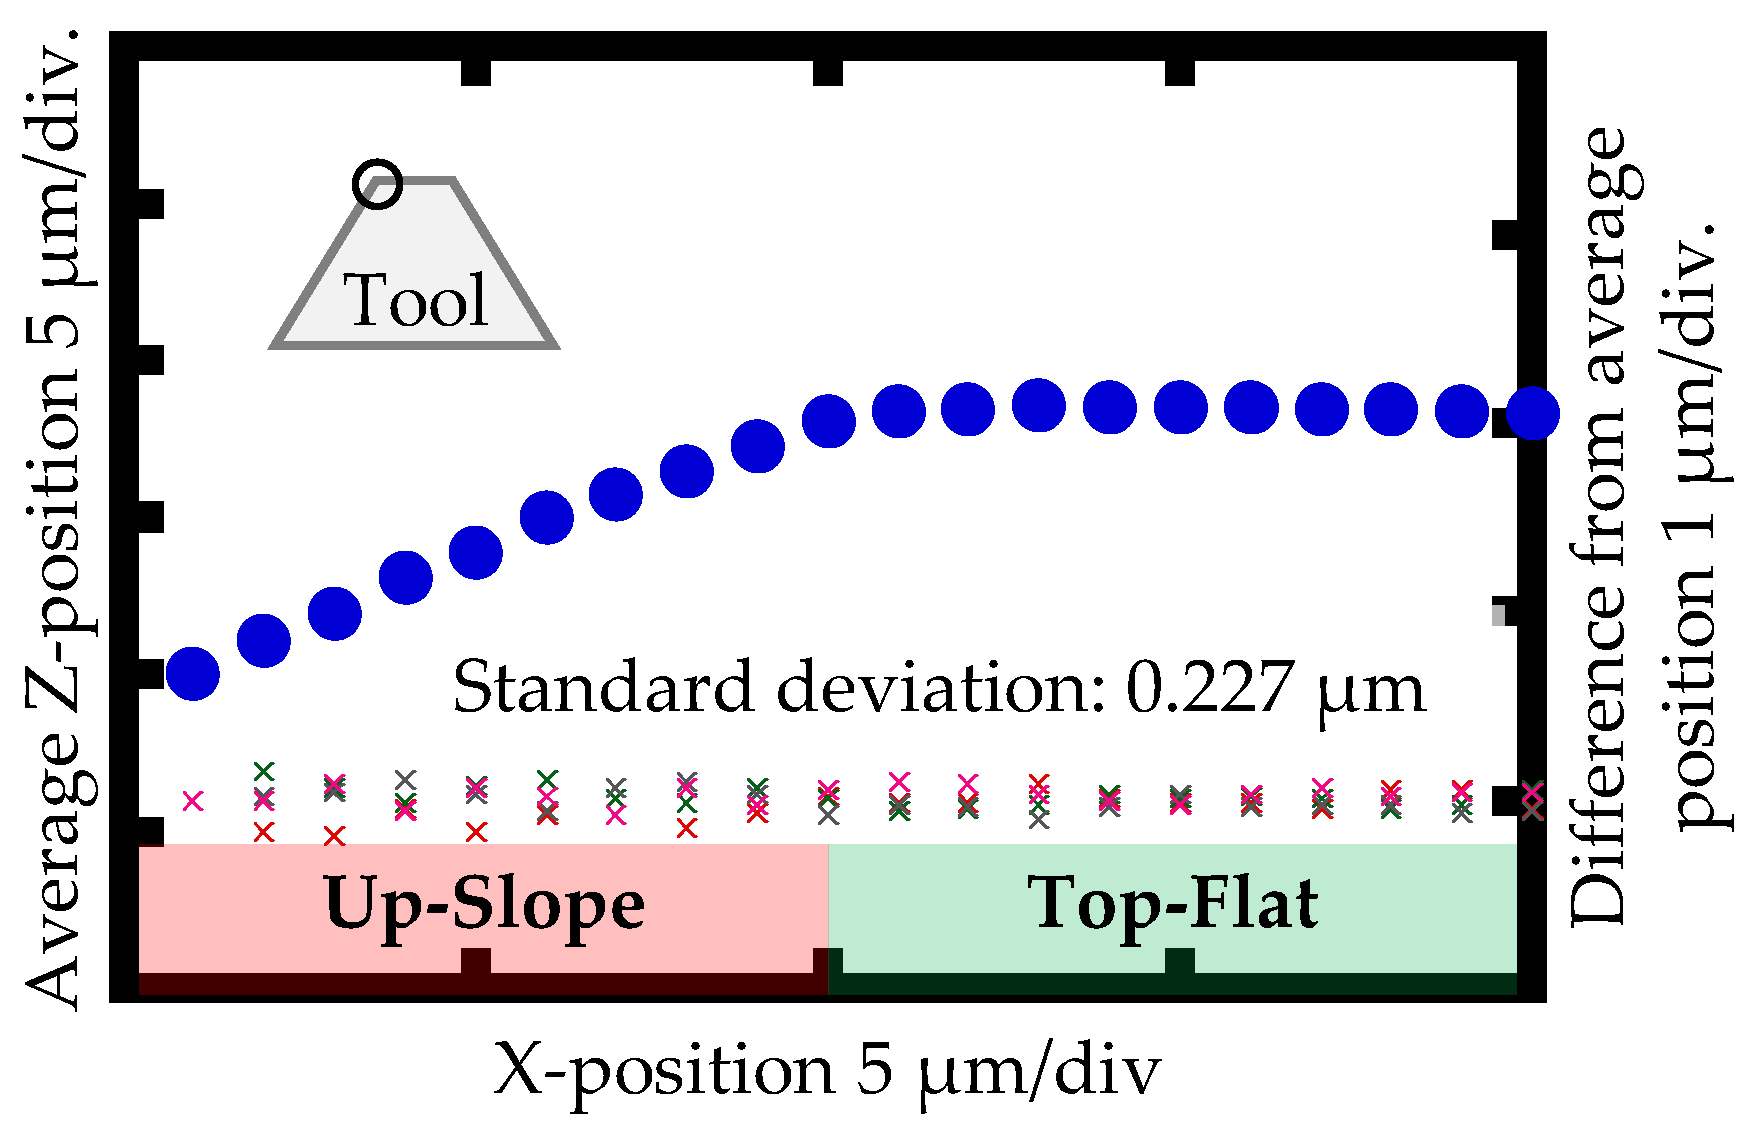
3. Measurement of the Micro Edge Profile of a Cutting Tool

In this section, a series of experiments were carried out to verify the measurement capability of two kinds of probes. Figure 8 shows a schematic of the cutting tool, where W is the edge width that determines the cutting performance of the cutting tool, and α is the slope angle. It can be observed that a cutting edge can be divided to be three portions: Up-slope, Down-slope, and Top-Flat. Therefore, it is necessary to evaluate the measurement performance of the profilers at the different portions. In order to achieve sufficient measurement repeatability for precision measurement of the micro tool edge, the thickness of the single-end-supported beam was designed to be 0.5 mm since the thicker flexible beam has better stability. Meanwhile, taking the sensitivity into consideration, the thickness of the double-sided beam was designed to be 0.2 mm.
Before using the developed system for tool sample measurement, the measurement repeatability of the profiler with the two types of probes was evaluated. Figure 9 shows the results of the repeated measurements at three different points on the tool surfaces (referred to as Up-slope, Down-slope and Top-Flat, respectively). Standard deviations of the measurement repeatability with the cantilever beam, at the Up-slope, Down-slope, and Top-Flat, were evaluated to be 0.731 μm, 0.187 μm, and 0.089 μm, respectively, while those with the double-sided beam at the Up-slope, Down-slope, and Top-Flat were evaluated to be 0.056 μm, 0.047 μm, and 0.058 μm, respectively. It can be clearly seen that the measurement repeatability with the double-sided beam is much better than those with the cantilever beam. Even on the Up-slope, the measurement repeatability of the cantilever beam was approximately ten times worse than those with the double-sided beam. The reason is that the cantilever beam is more susceptible to vibrations caused by the motion of the positioning system during the measurement process, which deteriorates the measurement repeatability. Therefore, compared to the cantilever beam, the double-sided beam is more robust against environmental disturbances.
Intermittent measurement was conducted afterward by using two types of probes to investigate the measurement repeatability at Up-slope, Down-slope, and Top-Flat. The measurement interval was set to be 5 μm, and ten points were measured. Five repetitive trials were carried out at each X-position to evaluate the repeatability of the intermittent measurement; the measurement results with the cantilever beam and the double-sided beam are shown in Figure 10a,b, respectively. For each profile measurement result, a mean value (blue plots in the figures) was calculated based on the five sets of experimental data, and the difference of each of the profiles from the mean value of five trials is also plotted as the scatters plot. It can be seen that the plots obtained by the cantilever beam at the Up-slope, Down-slope, and Top-Flat distribute in ranges of 3.09 μm, 2.39 μm, and 1.03 μm, respectively. On the other hand, the plots obtained by the double-ended beam profiler at the Up-slope, Down-slope, and Top-Flat were found to distribute in ranges of 1.20 μm, 0.46 μm, and 0.16 μm, respectively. Moreover, the standard deviation at every measuring point was calculated, as well. The maximum of those obtained by the cantilever beam on each surface (Up-slope, Down-slope, and Top-Flat) was evaluated to be 1.045 μm, 0.813 μm, and 0.343 μm, respectively. Meanwhile, the maximum standard deviation measured by the double-ended beam profiler on each surface (Up-slope, Down-slope, and Top-Flat) was evaluated to be 0.419 μm, 0.171 μm, and 0.054 μm, respectively. Through the experimental comparison between the two different probes, we can clearly observe that higher measurement accuracy and repeatability can be achieved in the profile measurement by using a measurement system with the double-sided beam, even though the sensitivity of beam deflection against the applied load becomes much lower than that of the cantilever probe.
Figure 11 shows an example of the profile of the left edge (including Up-slope and Top-Flat) of a cutting tool with a slope angle of 45° measured by the double-sided probe. The tool edge was measured four times, and the results are plotted in the figure. Similar to Figure 10, the blue plots in Figure 11 indicate mean values at every measuring point, and the differences from the mean values are plotted as scatter plots. As can be seen in the figure, the distribution range of the plots at the slope part is much broader than that at the flat part; these results well agree with the results in Figure 10.

4. Measurement Uncertainty Analysis

For the theoretical comparison of the measurement capability of the two types of probes, measurement uncertainty analysis is carried out based on GUM [34]. As can be seen in Equation (5), the surface profile can be evaluated by the Z-directional displacement of the positioning system Z(x) detected by the embedded encoder, and the deflection of the flexible beam m(x) measured by the laser displacement sensor in the probe unit. Taking into account the measurement principle and the constructions of two kinds of profilers in this paper, uncertainty sources come from the X- and Z-axis moving stages, as well as from the probe unit. The contributions of the moving stages include the resolution of the positioning system (uZ_Resolution), the linear motion error (uX_Linear and uZ_Linear, respectively), the calibration error (uX_Calibration and uZ_Calibration), the squareness error between two moving axes (uX_Squareness and uZ_Squareness), and the angular motion error (uX_angle and uZ_angle). On the other hand, the contribution of the probe unit contains the repeatability of the probing (uZ_Probing) (including the sources of the stability of the laser displacement sensor and the thermal deformation of the probe unit), the resolution, and misalignment of the laser displacement sensor (um_Resolution and um_Alignment, respectively). It should be noted that the contributions from the undesired deformation of the flexible beam and the stylus slip are also included in the repeatability of the probing, which is evaluated by the experiments. Resolutions of the positioning system and the displacement sensor obtained from the datasheets were 1 nm and 6.9 nm, respectively. Assuming the rectangular probability distribution, contributions by the resolutions were then calculated to be 1 / 2 3 (=0.289) nm and 6.9 / 2 3 (=1.992) nm, respectively. According to the specification of the positioning stages employed in this paper, the uncertainty of the stage calibration along its driving axis was 0.10 μm. Therefore, the contribution of the calibration of the Z-stage was evaluated to be 0.10 / 3 = 0.0577 μm, while that of the X-stage was evaluated to be ( 0.10 tan 60 ° ) / 3 = 0.10 μm by considering the case of measuring the Up-slope or Down-slope with the angle α of 60 degrees. The influences of the linearity of the stage motions should also be taken into consideration. According to reference [32], the linearity error of the stage in a limited travel range was approximately 1.0 μm. The contributions of the linearity of the Z- and X-stages, uZ_Linear and uX_Linear, respectively, were, thus, evaluated to be 1.0 / 3 = 0.577 μm and ( 1.0 tan 60 ° ) / 3 = 1.0 μm. Furthermore, the angular error motions of the stage systems were experimentally evaluated. Since the maximum angular error was evaluated to be 0.014° over the measurement range of 150 μm, and the distance between the rotational center and the measurement point is 100 μm, the uncertainty caused by the angular error motion can be calculated by the following equation:
u X _ A n g l e = u Z _ A n g l e = 100 × ( 1 cos 0.014 ° ) 2 3 = 0.862 × 10 6 μ m .
Misalignment of the laser displacement sensor was within 0.1°; the contribution of this misalignment was then calculated to be:
u m _ A l i g n m e n t = 100 × ( 1 cos 0.1 ° ) 2 3 = 0.044 × 10 3 μ m .
In this paper, a right-angle prism was employed to align the axes of two linear stages aligned to be perpendicular to each other. According to the datasheet, the angle tolerance of the prism was 0.033°. Therefore, the contributions by the squareness errors were evaluated as follows:
u X _ S q u a r e n e s s = 150 × sin 0.033 ° 2 3 = 0.025 μ m ,
u Z _ S q u a r e n e s s = 150 × ( 1 / cos 0.033 ° ) 1 2 3 = 7.182 × 10 6 μ m .
Table 1 shows the uncertainty budget and the combined uncertainty uc of two profilers evaluated based on the following equation:
u c = u Z _ P r o b i n g 2 + u Z _ R e s o l u t i o n 2 + u m _ R e s o l u t i o n 2 + u m _ A l i g n m e n t 2 + u X _ A n g l e 2 + u Z _ A n g l e 2 + u X _ S q u a r e n e s s 2 + u Z _ S q u a r e n e s s 2 .
As can be seen in the table, the uncertainty of the profiler with the cantilever beam was larger than that with the double-sided beam; this is mainly due to the quite low repeatability of the probing with the cantilever beam. The expanded uncertainties U with a coverage factor of k = 2 (95% confidence) for measurement of the profile with the cantilever beam and the double-sided beam were evaluated to be 2.74 μm and 2.32 μm, respectively. The result of theoretical analysis also verified that higher measurement accuracy can be achieved by the profiler with the double-sided beam.

5. Conclusions

In this paper, two types of probes with a cantilever beam and a double-sided beam designed for a tool edge profiler for on-machine measurement of a precision cutting tool have been presented and compared in aspects of measurement principle, construction, and measurement capability. Some experiments and FEM simulations have been carried out, and the obtained results have demonstrated that the profiler with the cantilever beam has a higher sensitivity and wider Z-directional measurement range, while that with the double-sided beam can achieve better stability. Measurement repeatability and accuracy of the profiler with the two types of probes have also been evaluated, and the cutting tool samples measured afterward. The experimental results have shown that the profiler with the double-sided beam has achieved better measurement repeatability (0.058 μm) compared to the one with the cantilever beam (0.731 μm). These results have also been verified by the theoretical evaluation through measurement uncertainty analysis. The experimental and theoretical evaluations have demonstrated that the beam profiler employing the double-sided beam can realize the more precise measurement of the tool cutting edge profile and is more robust and less demanding on measurement environment, which makes it more suitable for on-machine measurement of the precision cutting tools in a practical case.

Author Contributions

Conceptualization, W.G. and Y.S.; methodology, S.S., S.O., B.W. and W.G.; software, S.S. and S.O.; validation, Y.S., W.G., A.A. and H.M.; formal analysis, S.S., B.W., Y.S. and W.G.; investigation, S.S., B.W. and Y.S.; resources, Y.S. and W.G.; data curation, S.S., Y.S., B.W. and W.G; writing—original draft preparation, B.W. and Y.S.; writing—review and editing, W.G., Y.S. and A.A.; visualization, W.G. and Y.S.; supervision, W.G.; project administration, W.G. All authors have read and agreed to the published version of the manuscript.

Funding

This research was funded by the Japan Society for the Promotion of Science (JSPS) 20H00211.

Data Availability Statement

Not applicable.

Conflicts of Interest

The authors declare no conflict of interest.

References

  1. Krebs, F.C.; Fyenbo, J.; Jorgensen, M. Product integration of compact roll-to-roll processed polymer solar cell modules: Methods and manufacture using flexographic printing, slot-die coating and rotary screen printing. J. Mater. Chem. 2010, 20, 8994–9001. [Google Scholar] [CrossRef]
  2. Chen, J.; Liu, H.; Huang, Y.; Yin, Z. High-rate roll-to-roll stack and lamination of multilayer structured membrane electrode assembly. J. Manuf. Process. 2016, 23, 175–182. [Google Scholar] [CrossRef]
  3. Masuzawa, T. State of the art of micromachining. CIRP Ann. Manuf. Technol. 2000, 49, 473–488. [Google Scholar] [CrossRef]
  4. Fang, F.Z.; Zhang, X.D.; Weckenmann, A.; Zhang, G.X.; Evans, C. Manufacturing and measurement of freeform optics. CIRP Ann. Manuf. Technol. 2013, 62, 823–846. [Google Scholar] [CrossRef]
  5. Fang, F.Z.; Zhang, X.D.; Gao, W.; Guo, Y.B.; Byrne, G.; Hansen, H.N. Nanomanufacturing-Perspective and applications. CIRP Ann. Manuf. Technol. 2017, 66, 683–705. [Google Scholar] [CrossRef] [Green Version]
  6. Yin, S.; Ohmori, H.; Dai, Y.; Uehara, Y.; Chen, F.; Tang, H. ELID grinding characteristics of glass-ceramic materials. Int. J. Mach. Tools Manuf. 2009, 49, 333–338. [Google Scholar] [CrossRef]
  7. Kim, S.W.; Lee, D.W.; Kang, M.C.; Kim, J.S. Evaluation of machinability by cutting environments in high-speed milling of difficult-to-cut materials. J. Mater. Process. Technol. 2001, 111, 256–260. [Google Scholar] [CrossRef]
  8. Gao, W.; Haitjema, H.; Fang, F.Z.; Leach, R.K.; Cheung, C.F.; Savio, E.; Linares, J.M. On-machine and in-process surface metrology for precision manufacturing. CIRP Ann. Manuf. Technol. 2019, 68, 843–866. [Google Scholar] [CrossRef] [Green Version]
  9. Savio, E.; De Chiffre, L.; Schmitt, R. Metrology of freeform shaped parts. CIRP Ann. Manuf. Technol. 2007, 56, 810–835. [Google Scholar] [CrossRef]
  10. Gao, W.; Tano, M.; Sato, S.; Kiyono, S. On-machine measurement of a cylindrical surface with sinusoidal micro-structures by an optical slope sensor. Precis. Eng. 2006, 30, 274–279. [Google Scholar] [CrossRef]
  11. Gao, W.; Araki, T.; Kiyono, S.; Okazaki, Y.; Yamanaka, M. Precision nano-fabrication and evaluation of a large area sinusoidal grid surface for a surface encoder. Precis. Eng. 2003, 27, 289–298. [Google Scholar] [CrossRef]
  12. Santoso, T.; Syam, W.P.; Darukumalli, S.; Cai, Y.; Helmli, F.; Luo, X.; Leach, R. On-machine focus variation measurement for micro-scale hybrid surface texture machining. Int. J. Adv. Manuf. Technol. 2020, 109, 2353–2364. [Google Scholar] [CrossRef]
  13. Nishikawa, S.; Ohno, K.; Mori, M.; Fujishima, M. Non-contact type on-machine measurement system for turbine blade. Procedia Cirp. 2014, 24, 1–6. [Google Scholar] [CrossRef] [Green Version]
  14. Li, D.; Jiang, X.; Tong, Z.; Blunt, L. Development and application of interferometric on-machine surface measurement for ultraprecision turning process. J. Manuf. Sci. Eng. 2019, 141, 014502. [Google Scholar] [CrossRef] [Green Version]
  15. Quinsat, Y.; Tournier, C. In situ non-contact measurements of surface roughness. Precis. Eng. 2012, 36, 97–103. [Google Scholar] [CrossRef] [Green Version]
  16. Zou, X.; Zhao, X.; Li, G.; Li, Z.; Sun, T. Non-contact on-machine measurement using a chromatic confocal probe for an ultra-precision turning machine. Int. J. Adv. Manuf. Technol. 2017, 90, 2163–2172. [Google Scholar] [CrossRef]
  17. Li, D.; Cheung, C.F.; Ren, M.; Whitehouse, D.; Zhao, X. Disparity pattern-based autostereoscopic 3D metrology system for in situ measurement of microstructured surfaces. Opt. Lett. 2015, 40, 5271–5274. [Google Scholar] [CrossRef]
  18. Zhu, Y.; Na, J.; Pan, W.; Zhi, Y. Discussions on on-machine measurement of aspheric lens-mold surface. Optik 2013, 124, 4406–4411. [Google Scholar] [CrossRef]
  19. Gao, Y.; Huang, X.; Zhang, Y. An in-process form error measurement system for precision machining. Meas. Sci. Technol. 2010, 21, 054001. [Google Scholar] [CrossRef]
  20. Hocken, R.J.; Chakraborty, N.; Brown, C. Optical metrology of surfaces. CIRP Ann. Manuf. Technol. 2005, 54, 169–183. [Google Scholar] [CrossRef]
  21. Gao, W.; Kim, S.W.; Bosse, H.; Haitjema, H.; Chen, Y.L.; Lu, X.D.; Knapp, W.; Weckenmann, A.; Estler, W.T.; Kunzmann, H. Measurement technologies for precision positioning. CIRP Ann. Manuf. Technol. 2015, 64, 773–796. [Google Scholar] [CrossRef]
  22. Dong, Z.; Cheng, H.; Ye, X.; Tam, H.Y. Developing on-machine 3D profile measurement for deterministic fabrication of aspheric mirrors. Appl. Opt. 2014, 53, 4997–5007. [Google Scholar] [CrossRef] [PubMed]
  23. Poon, C.Y.; Bhushan, B. Comparison of surface roughness measurements by stylus profiler, AFM and non-contact optical profiler. Wear 1995, 190, 76–88. [Google Scholar] [CrossRef]
  24. Gao, W.; Aoki, J.; Ju, B.F.; Kiyono, S. Surface profile measurement of a sinusoidal grid using an atomic force microscope on a diamond turning machine. Precis. Eng. 2007, 31, 304–309. [Google Scholar] [CrossRef]
  25. Malshe, A.P.; Rajurkar, K.P.; Virwani, K.R.; Taylor, C.R.; Bourell, D.L.; Levy, G.; Sundaram, M.M.; McGeough, J.A.; Kalyanasundaram, V.; Samant, A.N. Tip-based nanomanufacturing by electrical, chemical, mechanical and thermal processes. CIRP Ann. Manuf. Technol. 2010, 59, 628–651. [Google Scholar] [CrossRef]
  26. Gao, W.; Motoki, T.; Kiyono, S. Nanometer edge profile measurement of diamond cutting tools by atomic force microscope with optical alignment sensor. Precis. Eng. 2006, 30, 396–405. [Google Scholar] [CrossRef]
  27. Gao, W.; Asai, T.; Arai, Y. Precision and fast measurement of 3D cutting edge profiles of single point diamond micro-tools. CIRP Ann. Manuf. Technol. 2009, 58, 451–454. [Google Scholar] [CrossRef]
  28. Chen, Y.L.; Cai, Y.; Shimizu, Y.; Ito, S.; Gao, W.; Ju, B.F. On-machine measurement of microtool wear and cutting edge chipping by using a diamond edge artifact. Precis. Eng. 2016, 43, 462–467. [Google Scholar] [CrossRef]
  29. Chen, Y.L.; Shimizu, Y.; Cai, Y.; Wang, S.; Ito, S.; Ju, B.F.; Gao, W. Self-evaluation of the cutting edge contour of a microdiamond tool with a force sensor integrated fast tool servo on an ultra-precision lathe. Int. J. Adv. Manuf. Technol. 2015, 77, 2257–2267. [Google Scholar] [CrossRef]
  30. Chen, Y.L.; Cai, Y.; Xu, M.; Shimizu, Y.; Ito, S.; Gao, W. An edge reversal method for precision measurement of cutting edge radius of single point diamond tools. Precis. Eng. 2017, 50, 380–387. [Google Scholar] [CrossRef]
  31. Matsukuma, H.; Wen, B.; Osawa, S.; Sekine, S.; Shimizu, Y.; Gao, W. Design and construction of a low-force stylus probe for on-machine tool cutting edge measurement. Nanomanufacturing Metrol. 2020, 3, 282–291. [Google Scholar] [CrossRef]
  32. Wen, B.; Shimizu, Y.; Watanabe, Y.; Matsukuma, H.; Gao, W. On-machine profile measurement of a micro cutting edge by using a contact-type compact probe unit. Precis. Eng. 2020, 65, 230–239. [Google Scholar] [CrossRef]
  33. Gao, W. Surface Metrology for Micro- and Nanofabrication; Elsevier: Amsterdam, The Netherlands, 2020; ISBN 9780128178508. [Google Scholar]
  34. Joint Committee for Guides in Metrology. Evaluation of Measurement Data—Guide to the Expression of Uncertainty in Measurement; ISO: Geneva, Switzerland, 2008. [Google Scholar]
Figure 1. Measurement error caused by undesired deflection: (a) Undesired deformation; (b) desired deformation.
Machines 09 00271 g001
Figure 2. The measurement principle of the tool edge profiler.
Machines 09 00271 g002
Figure 3. Schematic of the flexible beam: (a) cantilever beam; (b) double-sided beam.
Machines 09 00271 g003
Figure 4. The simulation results obtained by FEM: (a) V-beam; (b) X-beam.
Machines 09 00271 g004
Figure 5. Experimental setup for evaluation of the spring constant.
Machines 09 00271 g005
Figure 6. Evaluation results of the spring constant: (a) V-beam; (b) X-beam.
Machines 09 00271 g006
Figure 7. Stability of two kinds of profilers.
Machines 09 00271 g007
Figure 8. Schematic of a cutting tool.
Machines 09 00271 g008
Figure 9. Measurement repeatability: (a) With cantilever beam; (b) with double-sided beam.
Machines 09 00271 g009
Figure 10. Cutting edge measurement results: (a) Measured by the cantilever beam profiler; (b) measured by the double-sided beam profiler.
Machines 09 00271 g010
Figure 11. The left edge (including Up-slope and Top-Flat) of a cutting tool with a slope angle of 45° measured by the double-sided beam probe.
Machines 09 00271 g011
Table 1. Uncertainty budget.
Source of UncertaintySymbolTypeStandard Uncertainty μm
Cantilever BeamDouble-Sided Beam
Repeatability of the probinguZ_ProbingA0.73070.0579
Resolution of the Z-directional positioninguZ_ResolutionB1.992 × 10−31.992 × 10⁻³
Calibration error of the X-axisuCalibration_XA0.1000.100
Calibration error of the Z-axisuCalibration_ZA0.05770.0577
Linear error motion of the positioning system about the X-axisuX_LinearA1.0001.000
Linear error motion of the positioning system about the Z-axisuZ_LinearA0.5770.577
Resolution of the laser displacement sensorum_ResolutionB0.289 × 10−30.289 × 10⁻³
Misalignment of the laser displacement sensorum_AlignmentB0.044 × 10−30.044 × 10⁻³
Angular error motion of the positioning system about the X-axisuX_AngleA0.862 × 10−60.862 × 10⁻⁶
Angular error motion of the positioning system about the Z-axisuZ_AngleA0.862 × 10−60.862 × 10⁻⁶
Squareness error of the positioning system about the X-axisuX_SquarenessB0.0250.025
Squareness error of the positioning system about the Z-axisuZ_SquarenessB7.182 × 10−67.182 × 10⁻⁶
Combined uncertaintyuc1.3711.162
Expanded uncertaintyU = kuck = 22.742.32
Publisher’s Note: MDPI stays neutral with regard to jurisdictional claims in published maps and institutional affiliations.

