Author Contributions
Conceptualization, W.G. and P.X.; methodology, W.G, P.X. and C.Y.; software, W.G.; investigation, W.G.; resources, W.G.; experiment, W.G., J.X., H.Z. and Z.Y.; data curation, W.G. and C.Y.; writing—original draft preparation, W.G.; writing—review and editing, W.G. and C.Y.; project administration, P.X.; funding acquisition, P.X. and C.Y. All authors have read and agreed to the published version of the manuscript.
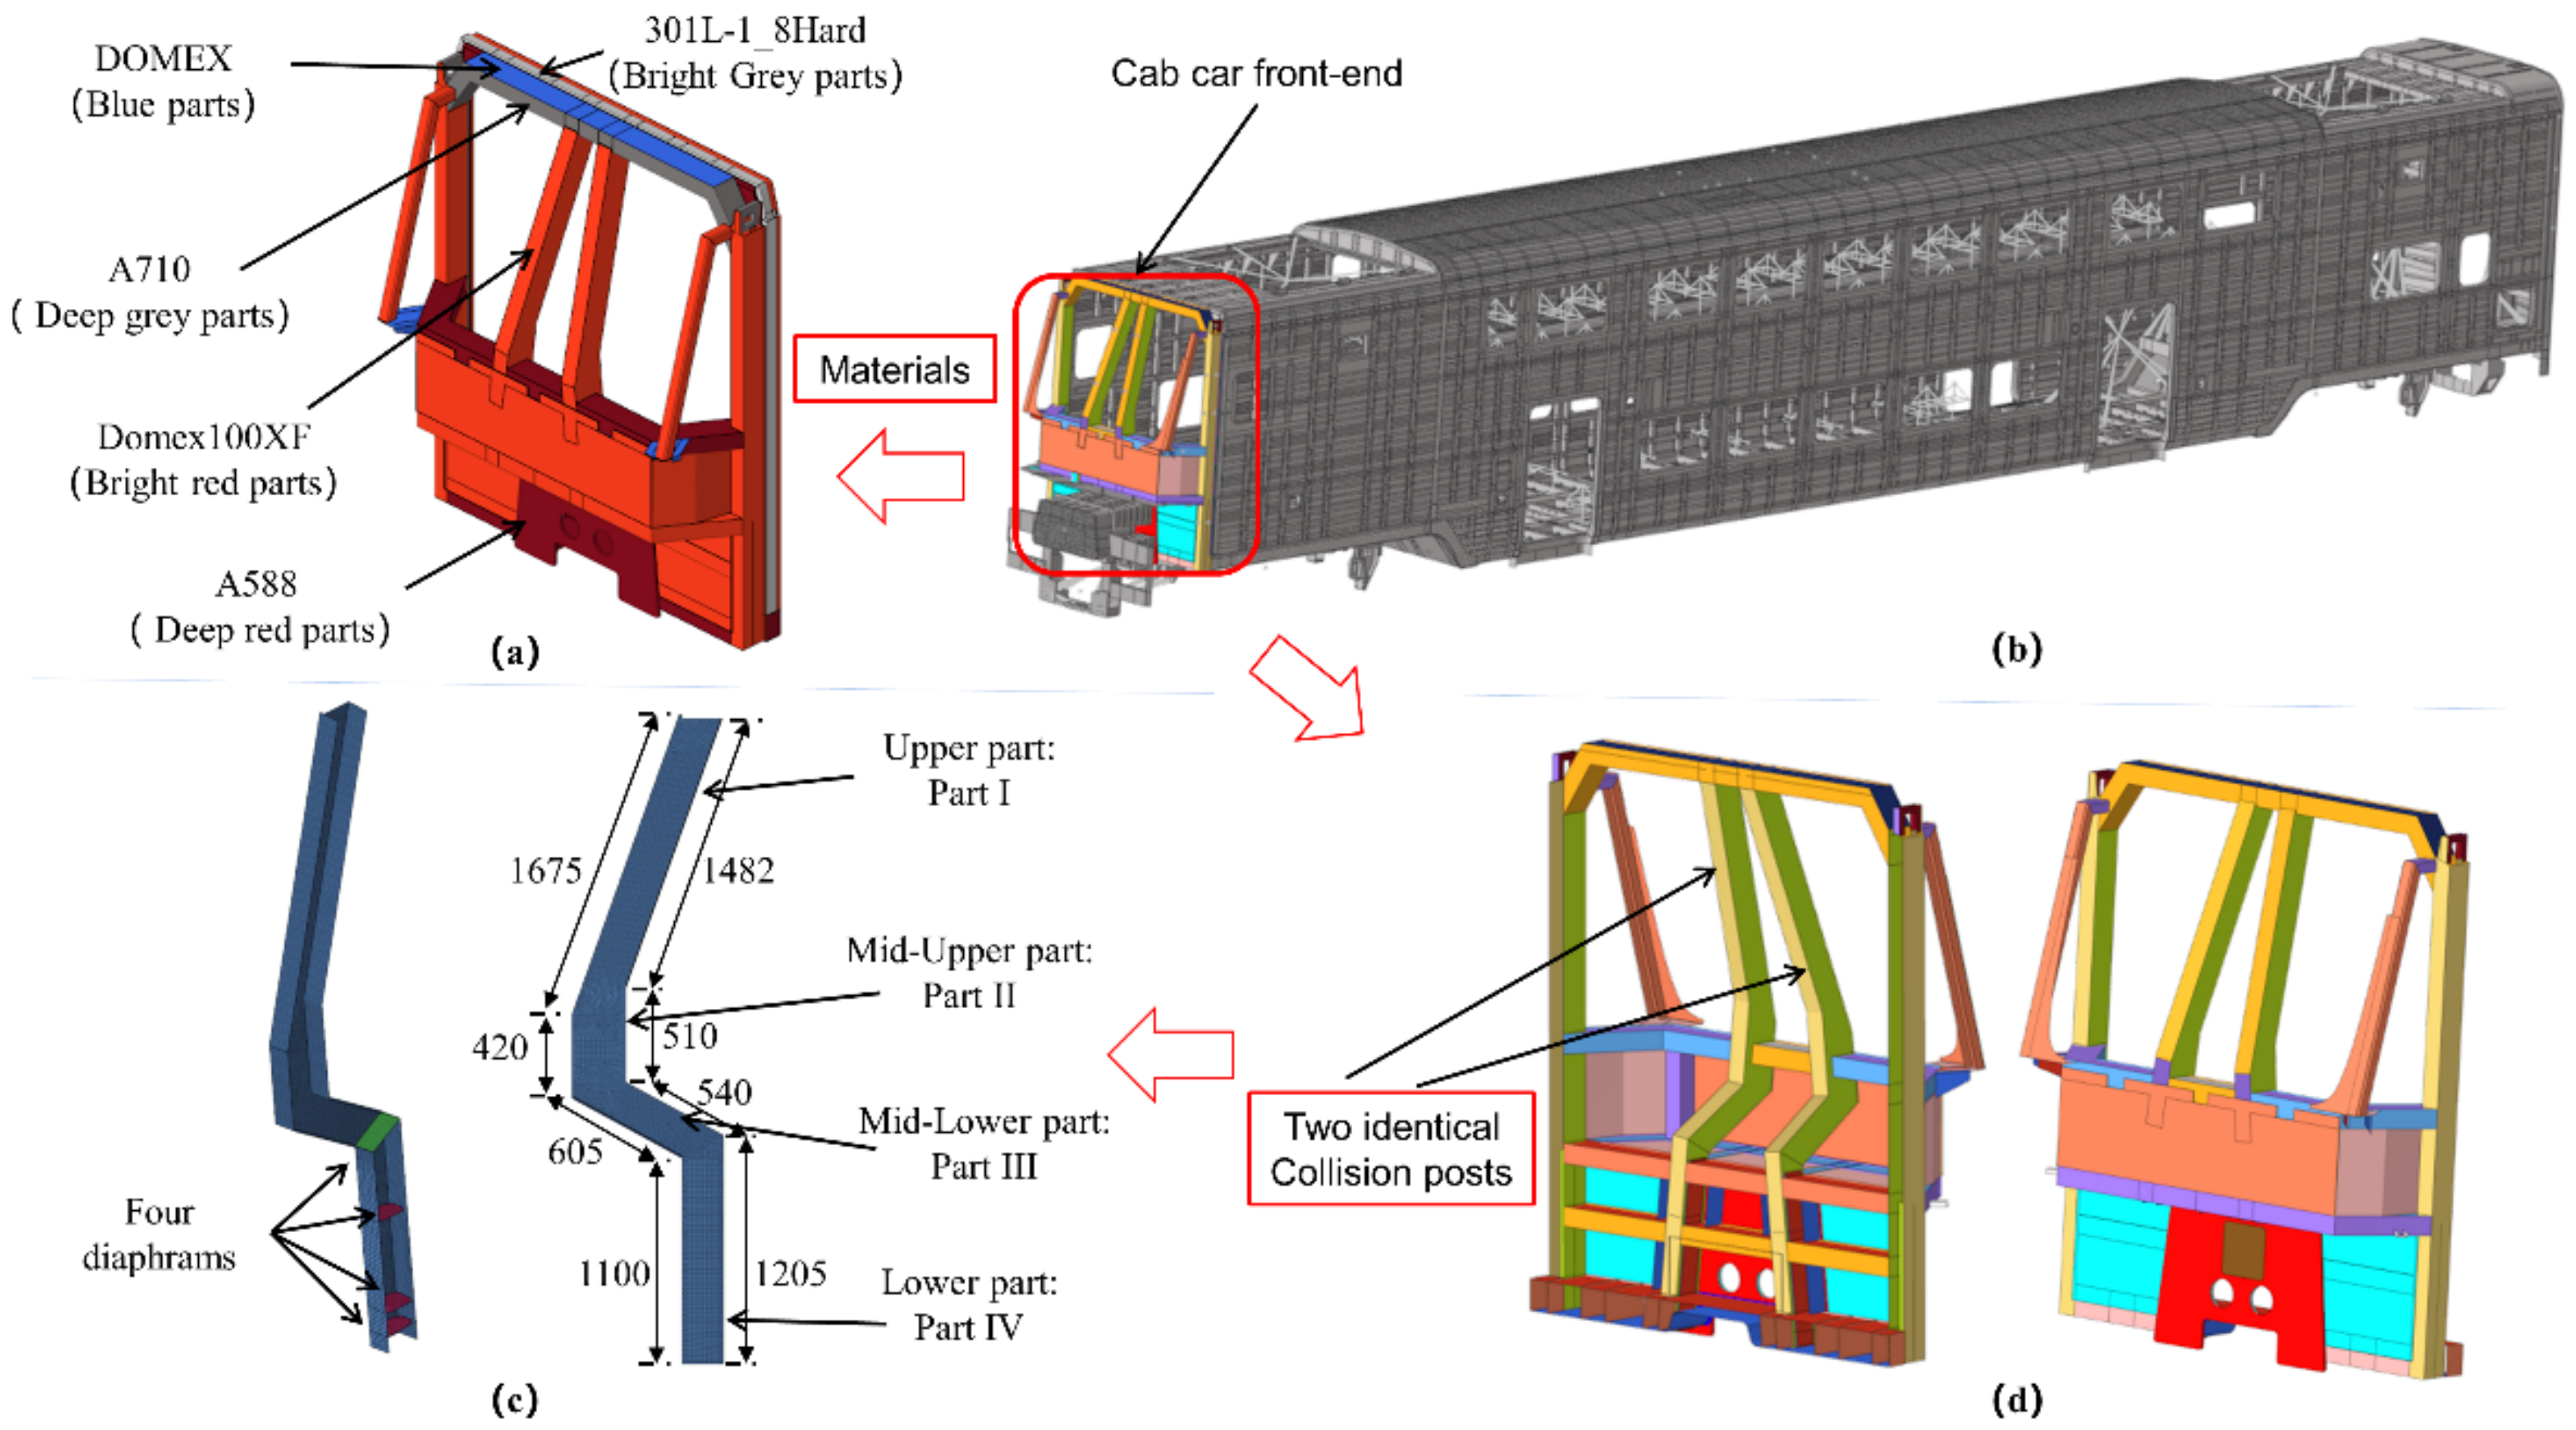
Figure 1.
Details for cab car front-end and USCP: (a) materials of the cab car front-end; (b) bilevel subway car; (c) details of USCP; (d) cab car front-end of a bilevel subway car.
Figure 1.
Details for cab car front-end and USCP: (a) materials of the cab car front-end; (b) bilevel subway car; (c) details of USCP; (d) cab car front-end of a bilevel subway car.
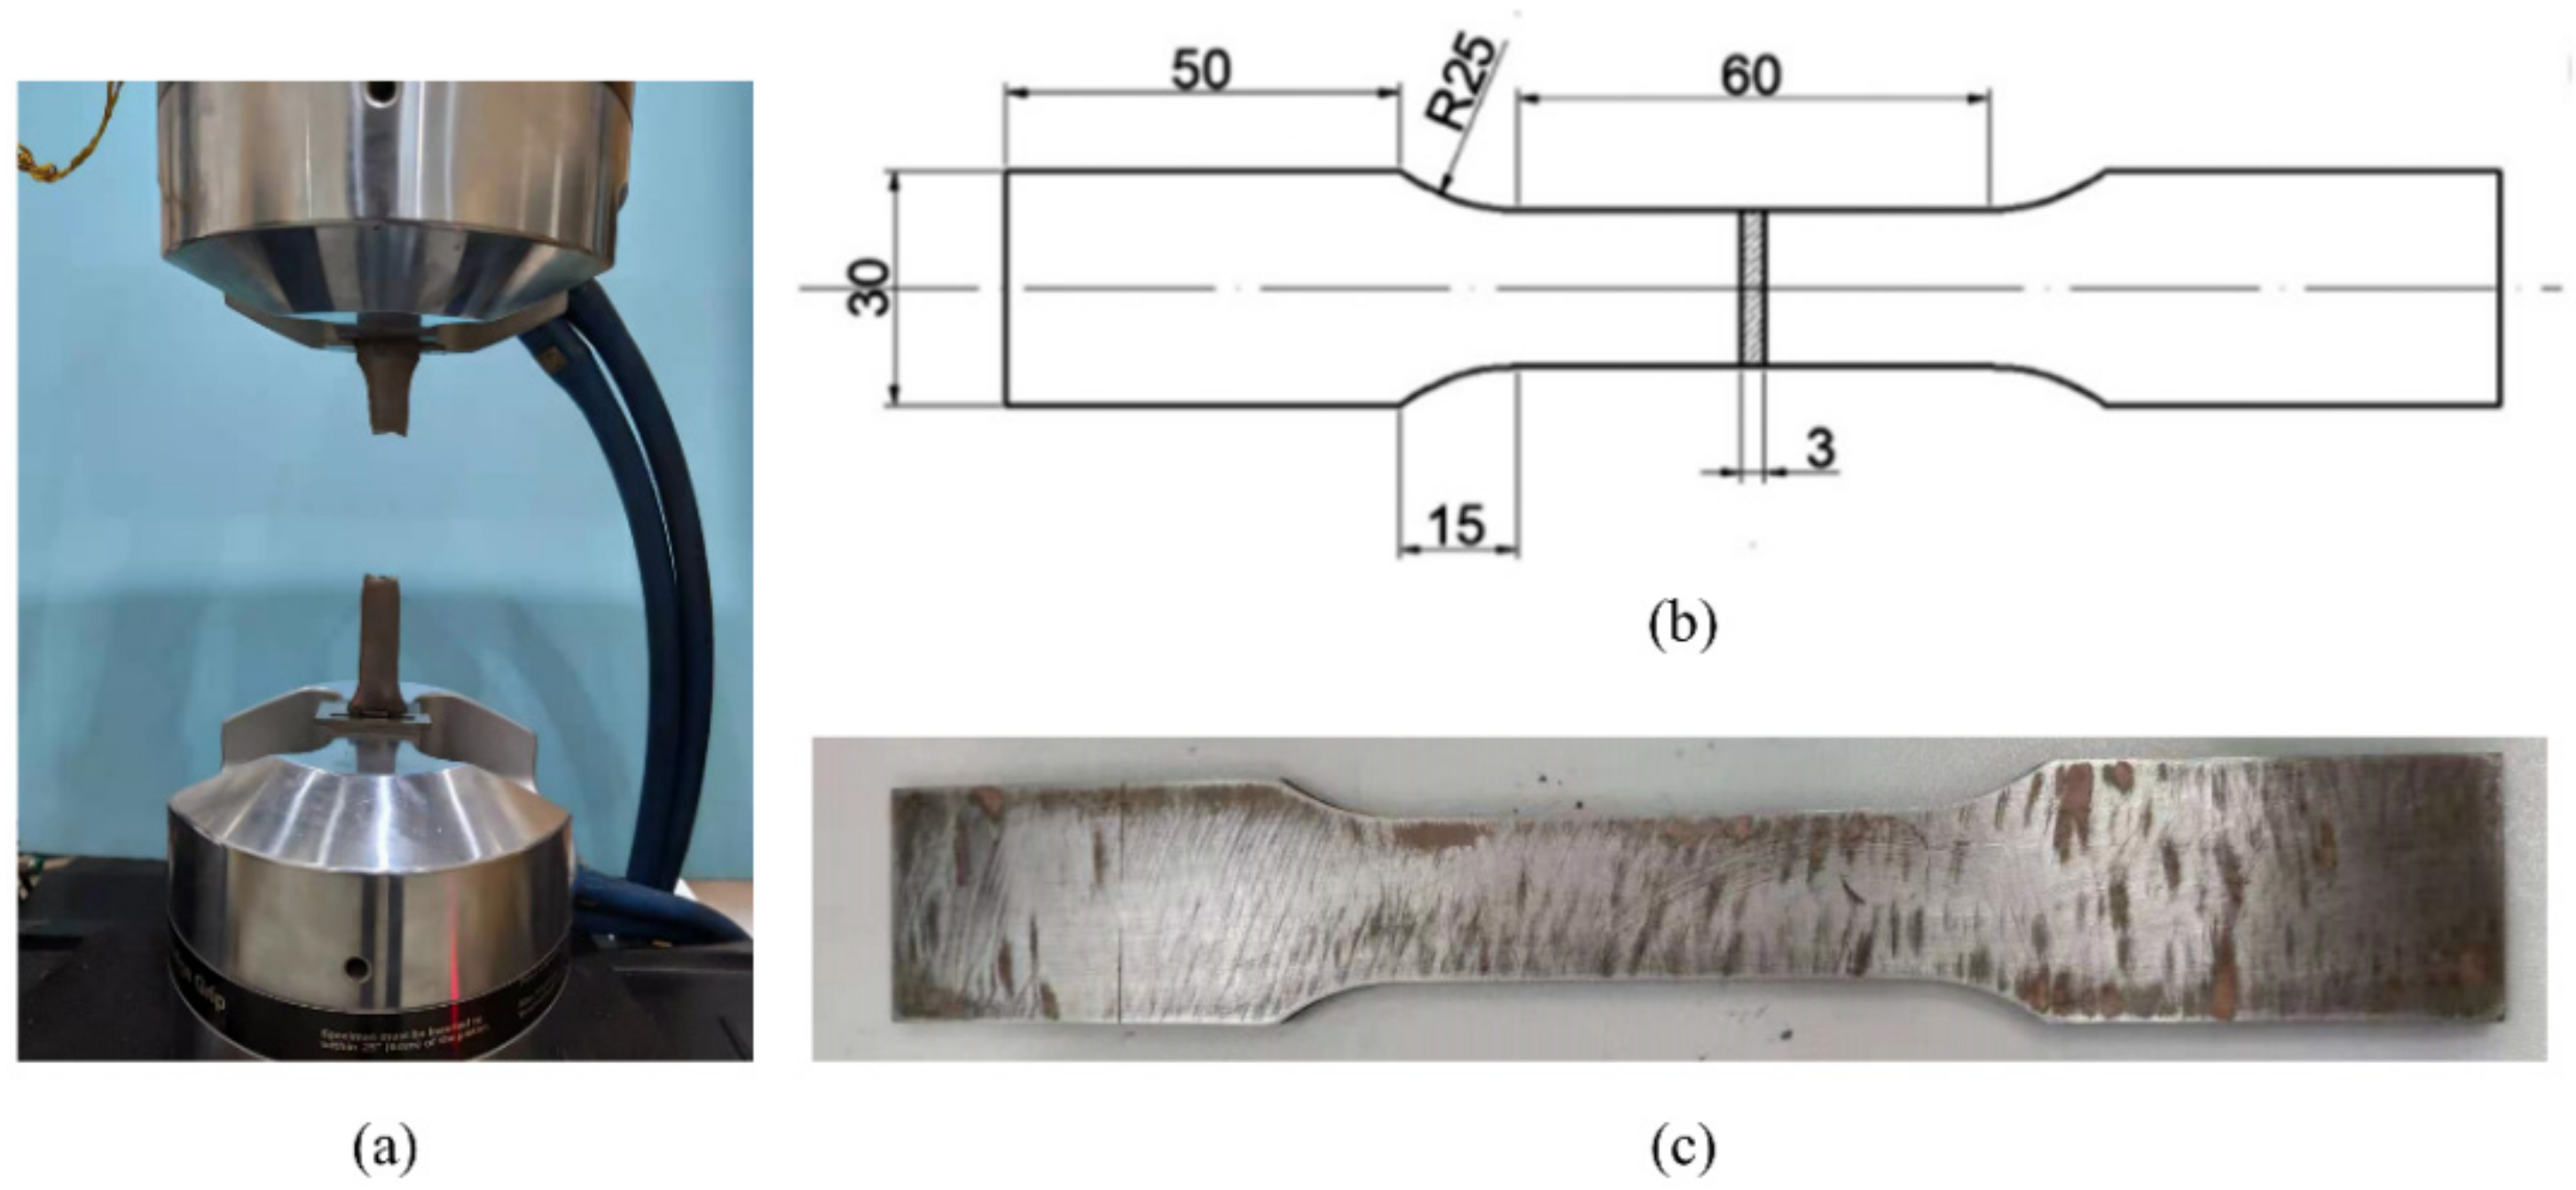
Figure 2.
Tensile test machine and the specimen: (a) MTS 647 hydraulic tensile test machine; (b) dimensions of specimen; (c) physical specimen.
Figure 2.
Tensile test machine and the specimen: (a) MTS 647 hydraulic tensile test machine; (b) dimensions of specimen; (c) physical specimen.
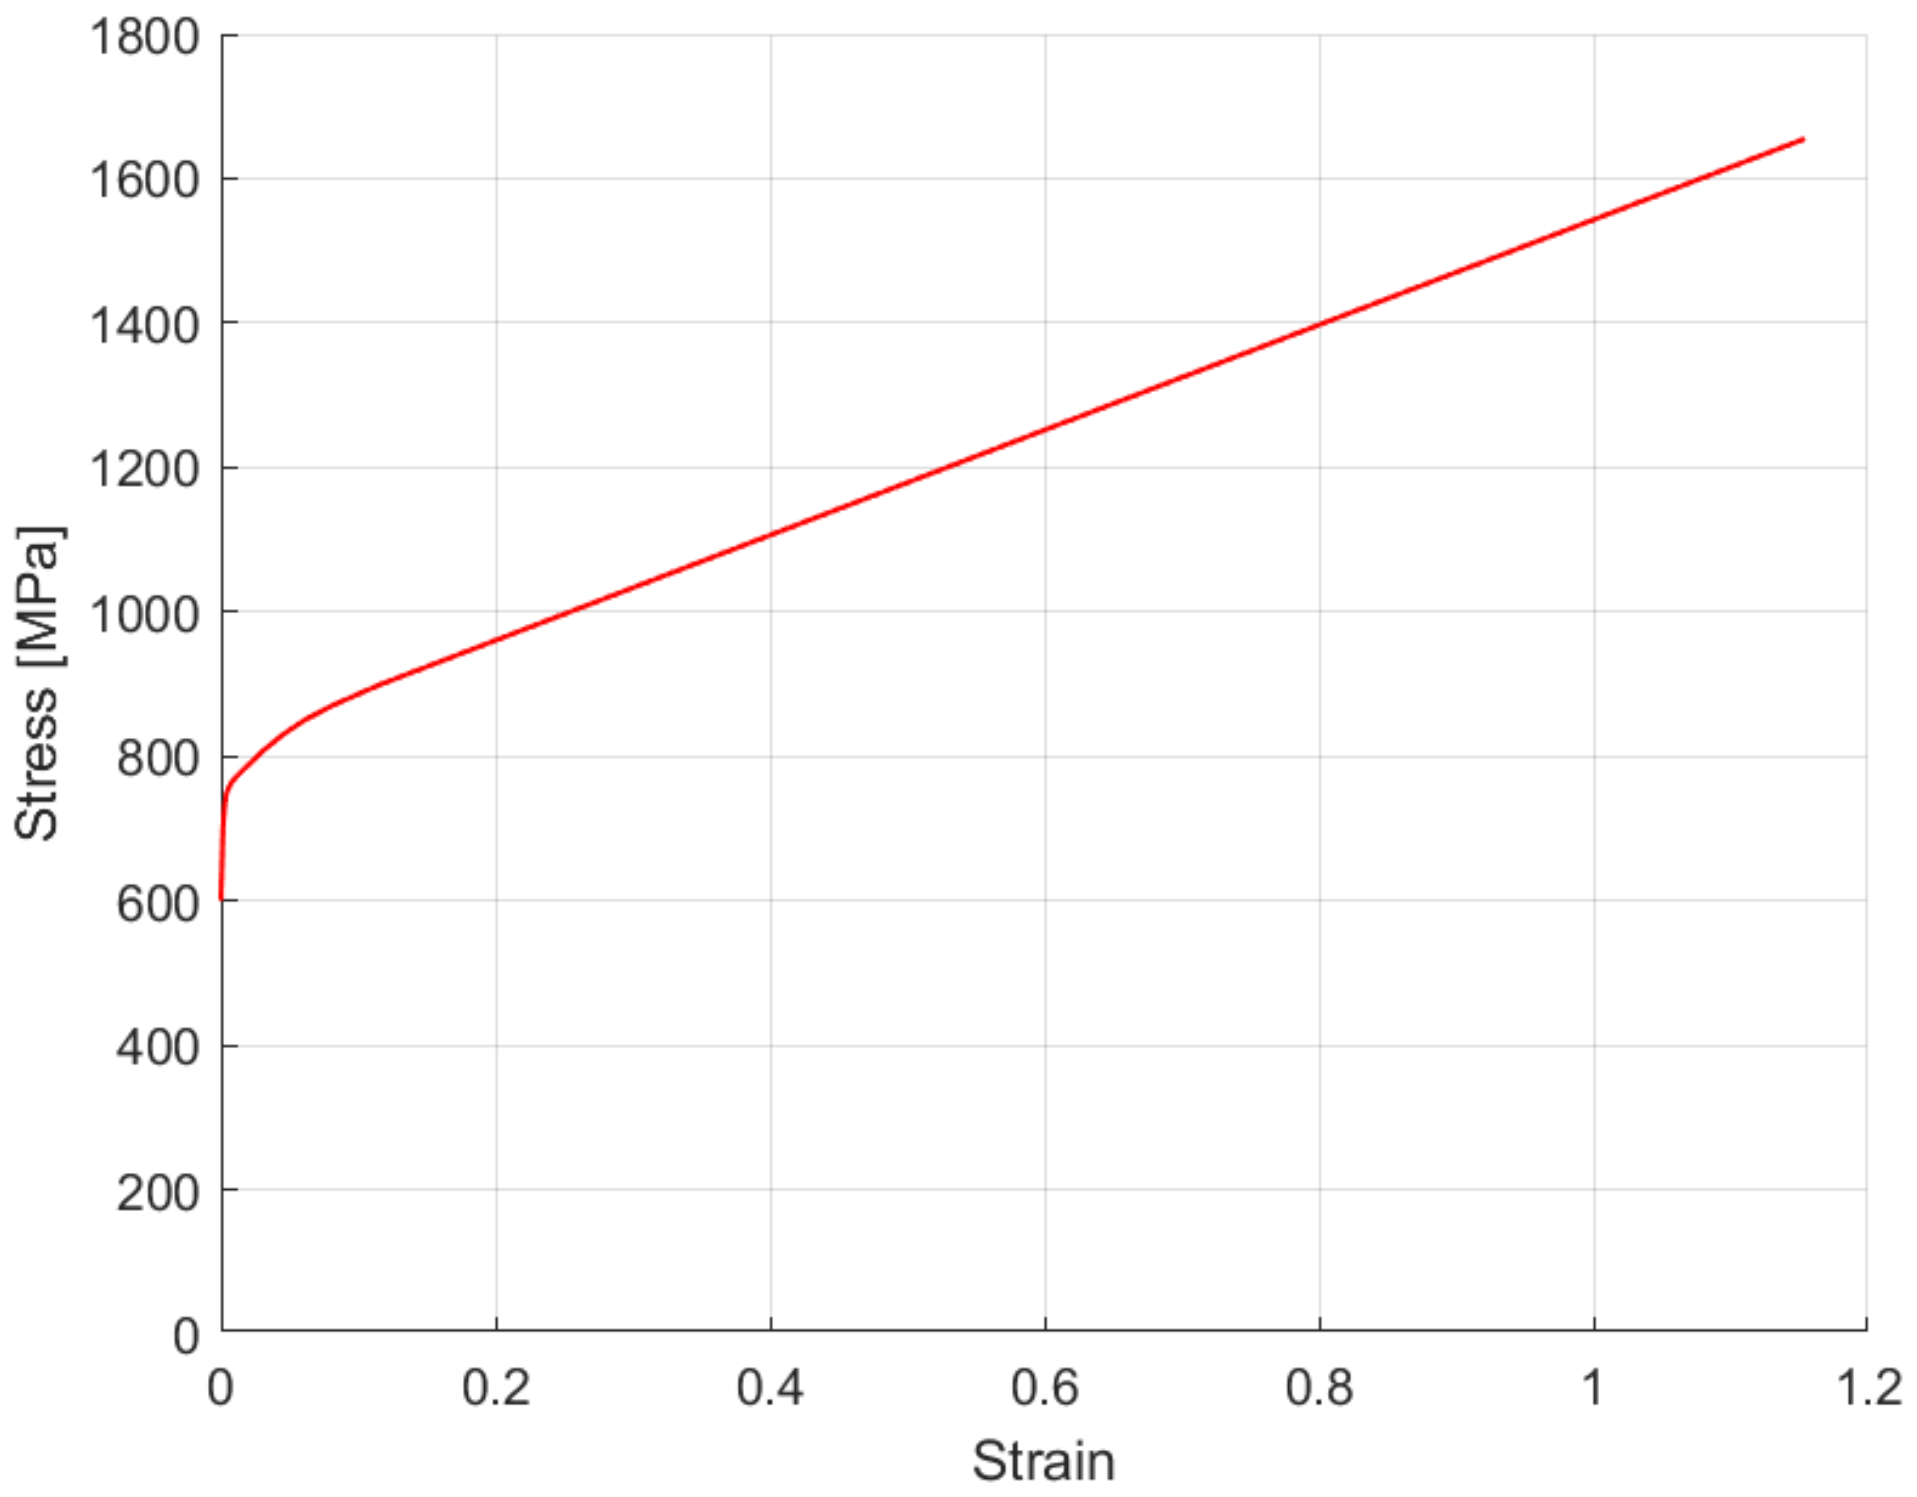
Figure 3.
Stress–plastic strain curve.
Figure 3.
Stress–plastic strain curve.
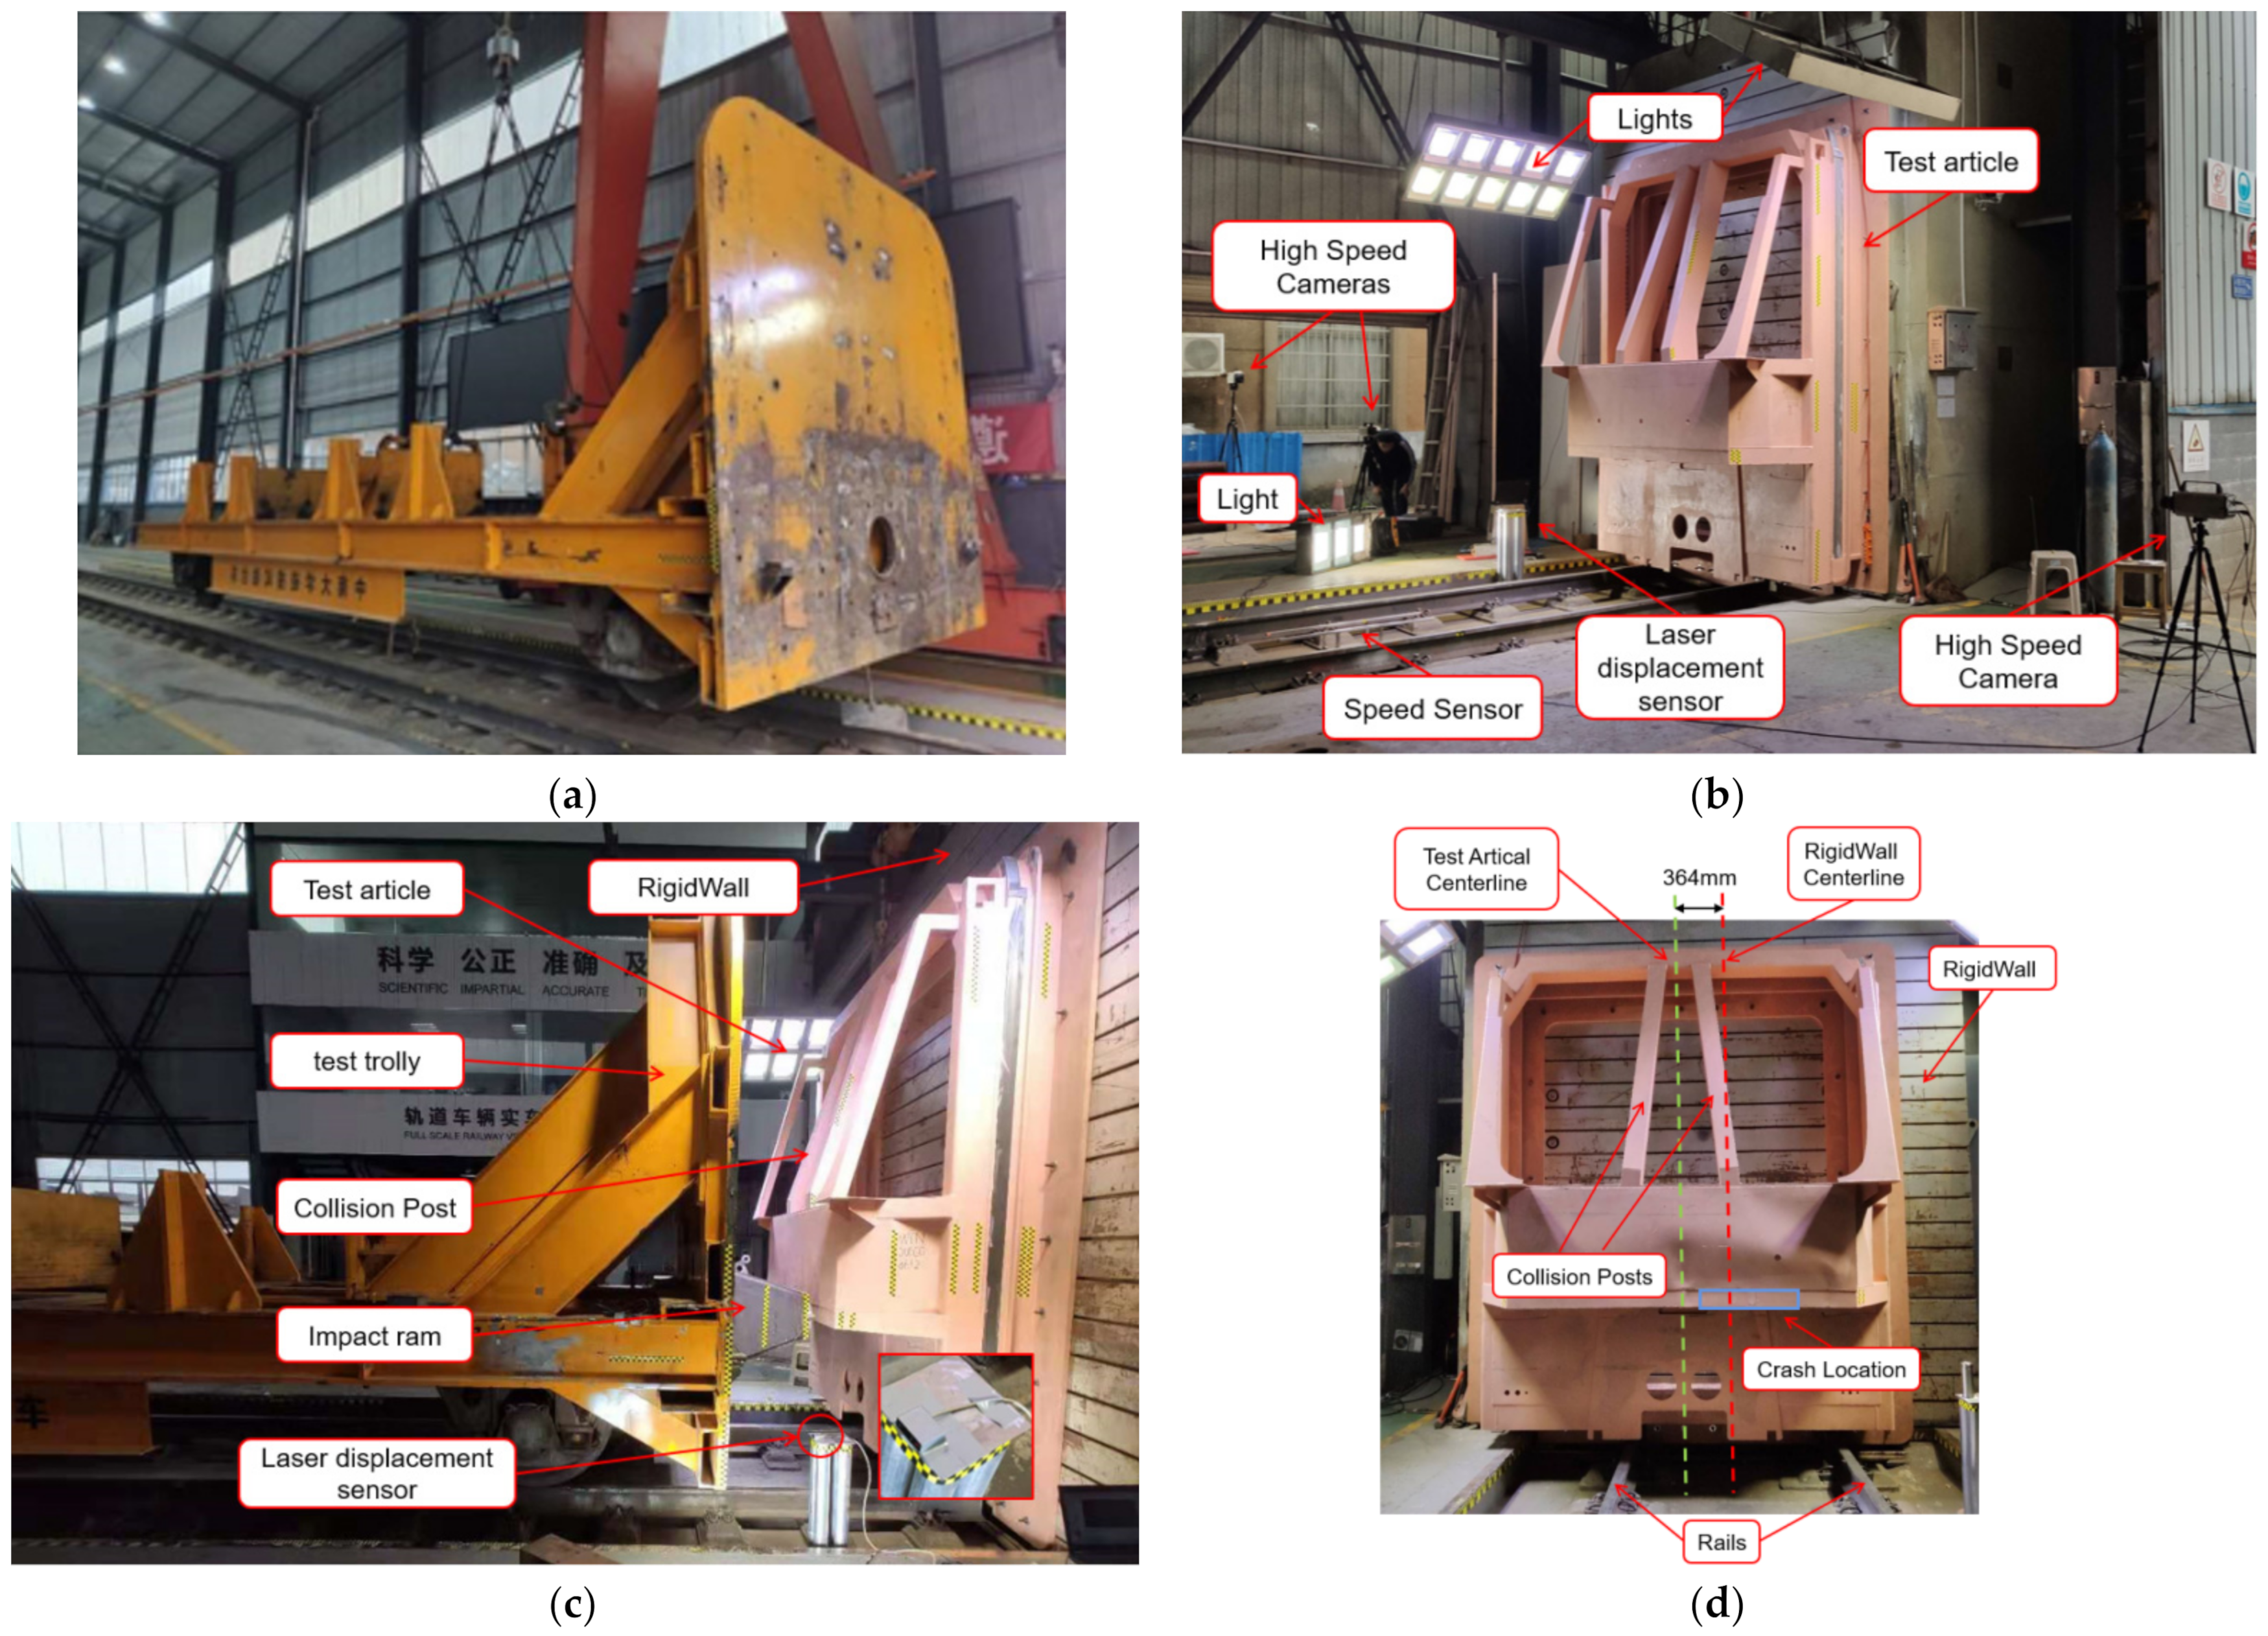
Figure 4.
Experimental setup: (a) test trolley; (b) measurement devices; (c) crash location; (d) test article location.
Figure 4.
Experimental setup: (a) test trolley; (b) measurement devices; (c) crash location; (d) test article location.
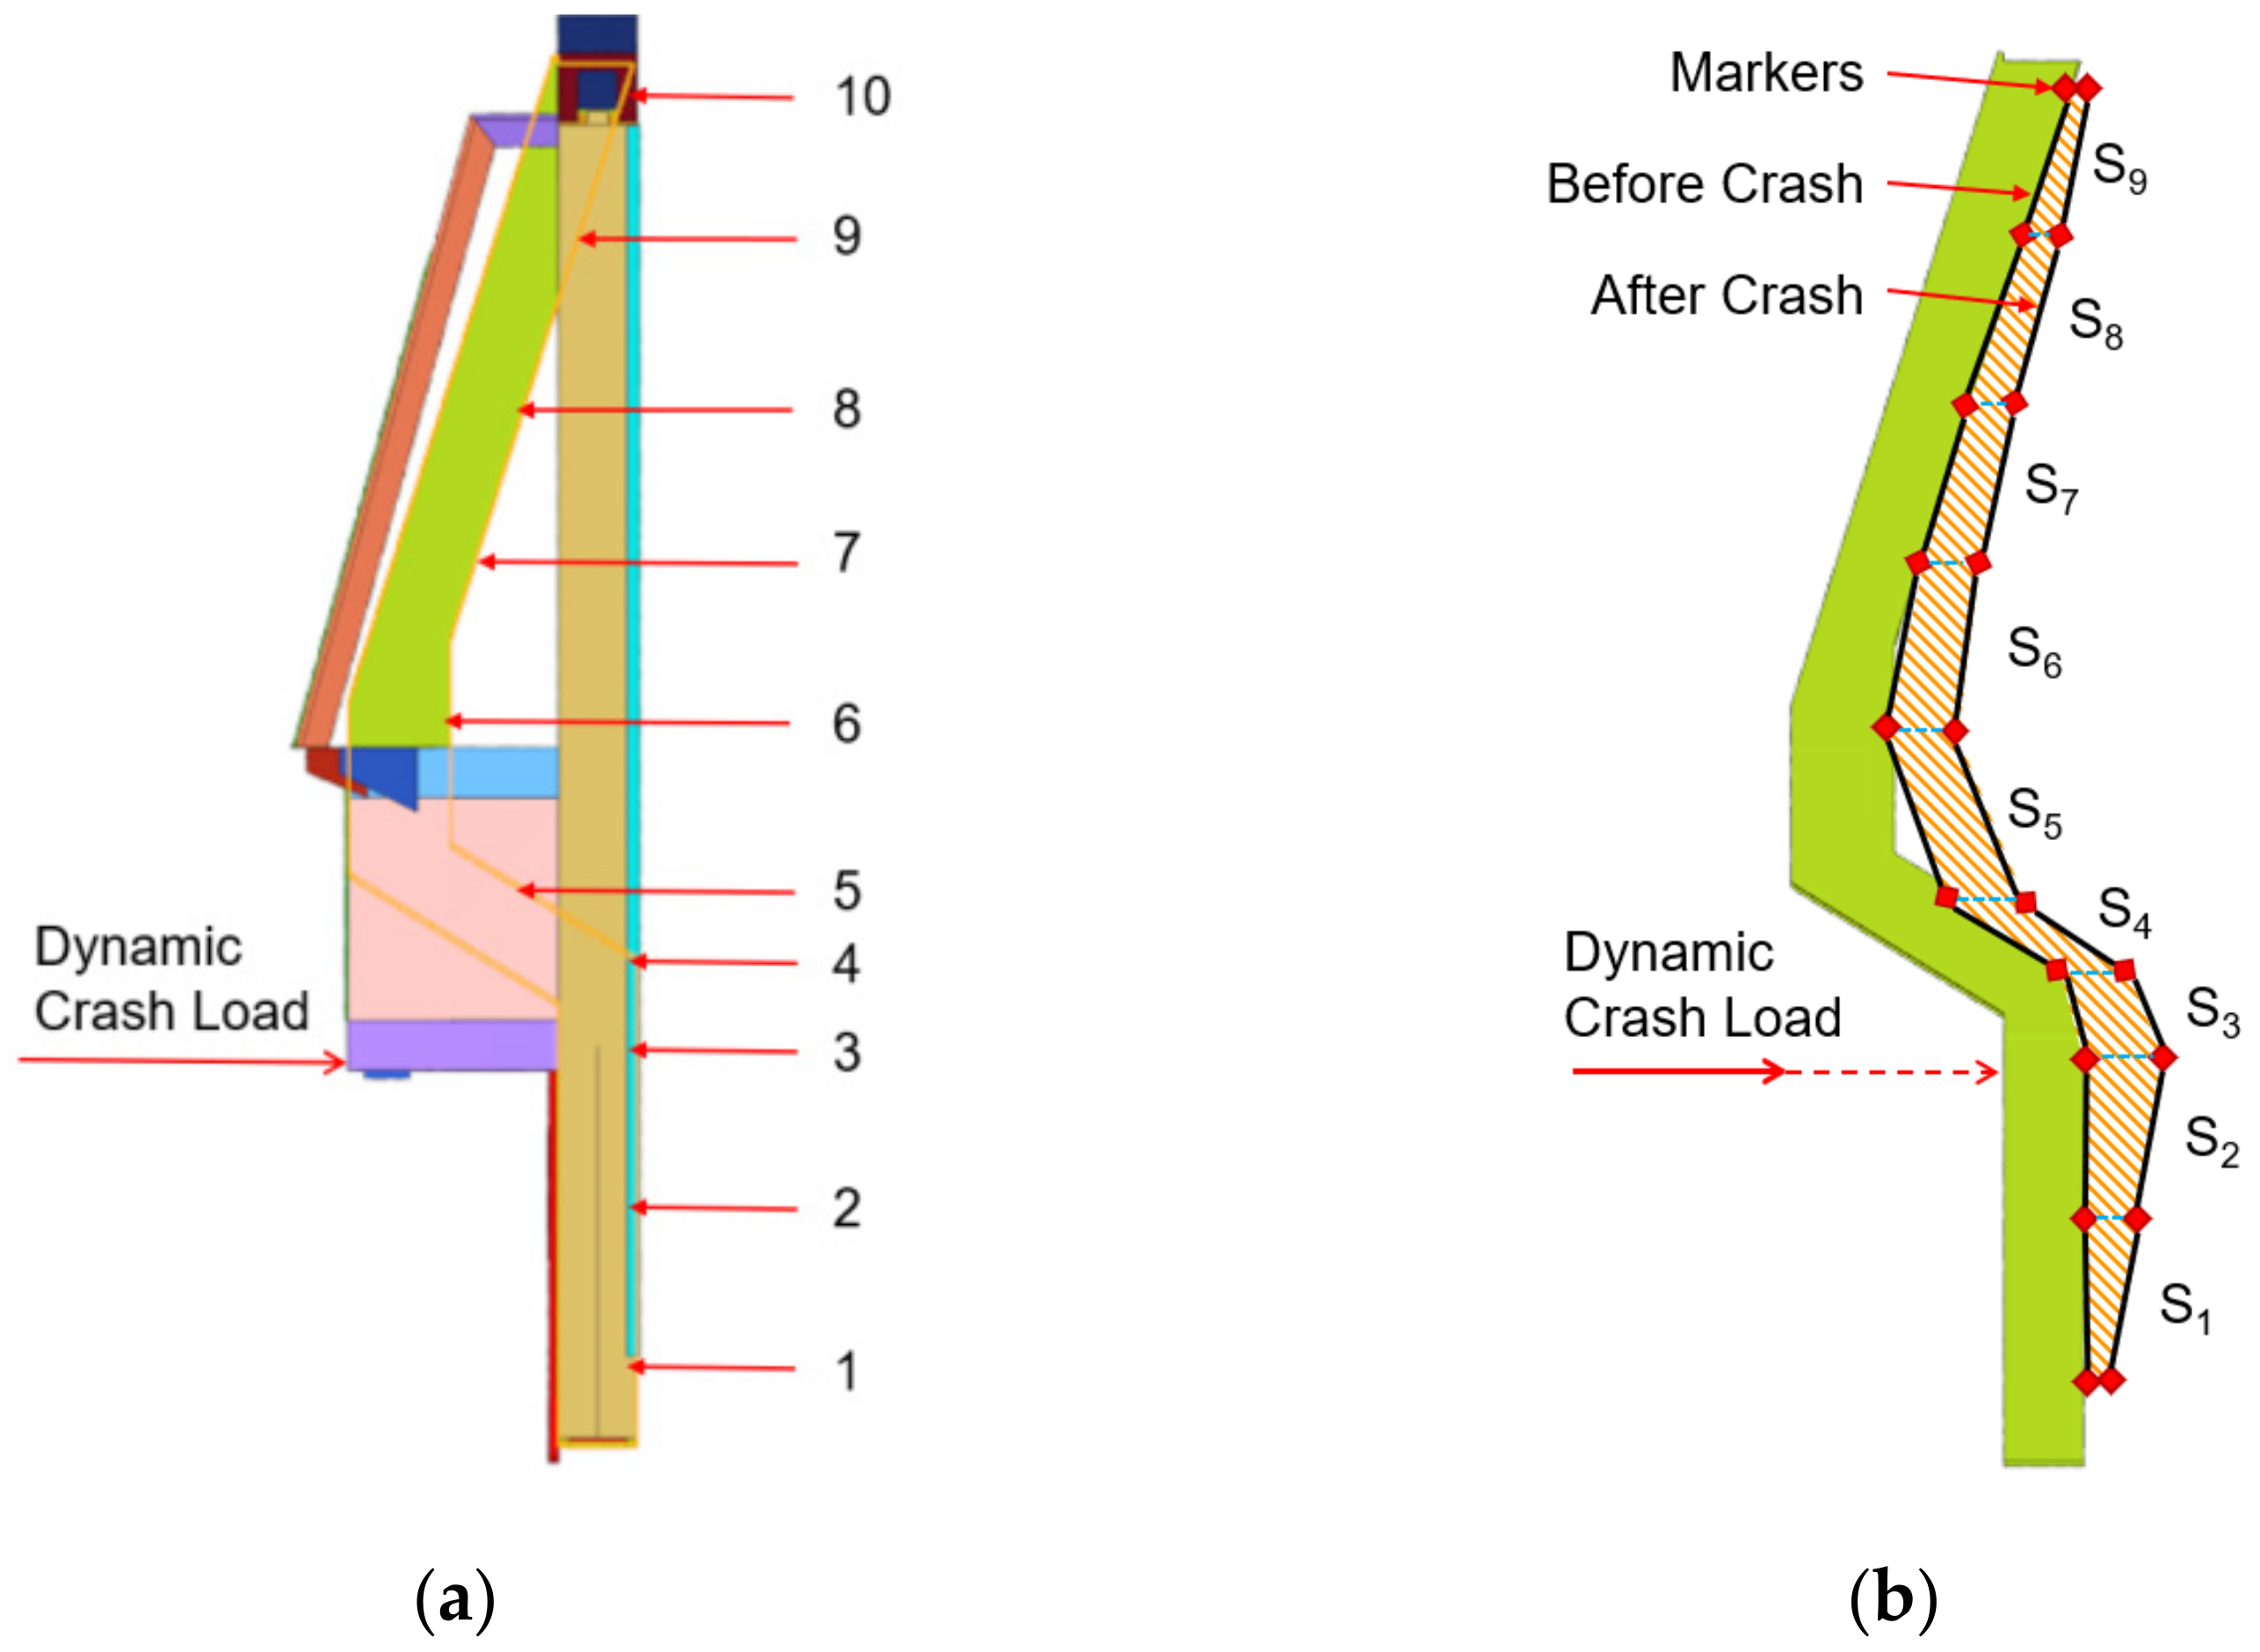
Figure 5.
Longitudinal deformation details: (a) location of markers; (b) S_In sketch.
Figure 5.
Longitudinal deformation details: (a) location of markers; (b) S_In sketch.
Figure 6.
Finite element model: (a) isometric view; (b) Left view.
Figure 6.
Finite element model: (a) isometric view; (b) Left view.
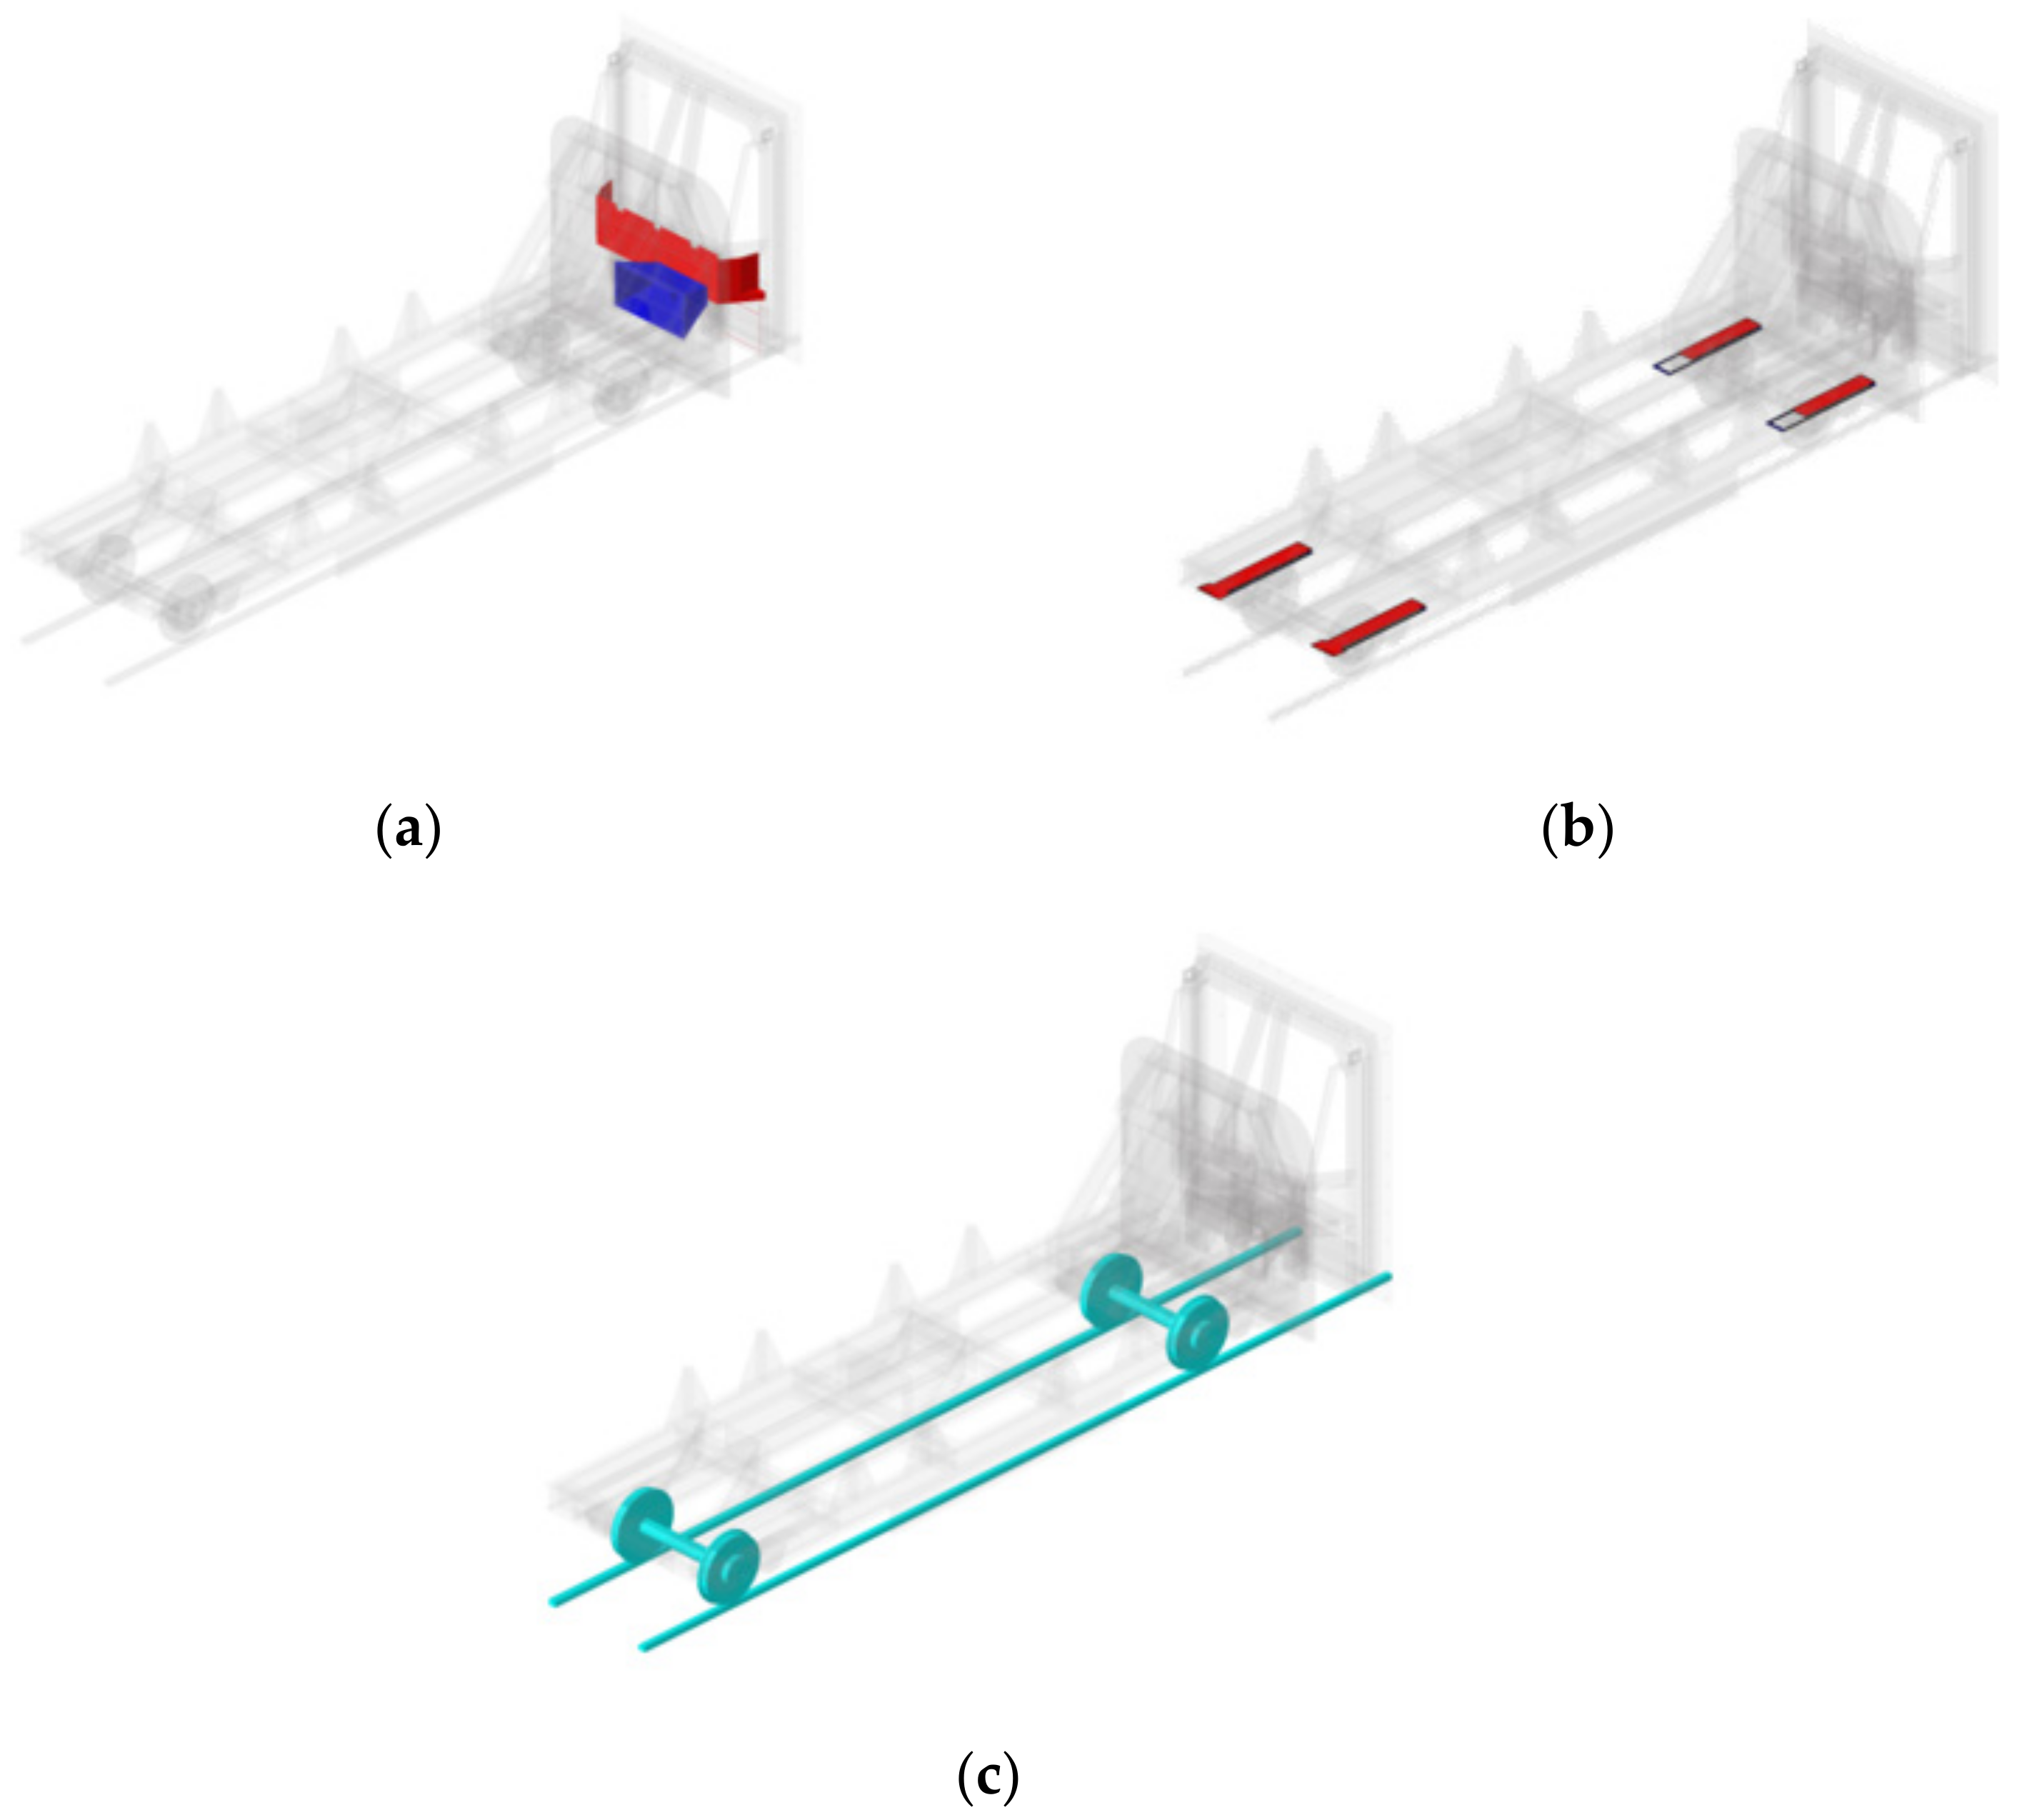
Figure 7.
Surface-to-surface contact algorithm: (a) impact ram and cab car front-end; (b) wheel and test trolley; (c) wheel and rail.
Figure 7.
Surface-to-surface contact algorithm: (a) impact ram and cab car front-end; (b) wheel and test trolley; (c) wheel and rail.
Figure 8.
Deformation comparison between the simulation and experiment: (a) t = 0, simulation: 0, experiment: 0; (b) t = 16 ms, simulation: 47.8 mm, experiment: 49.142 mm; (c) t = 25 ms, simulation: 55.1 mm, experiment: 59.317 mm; (d) t = 33 ms, simulation: 48 mm, experiment: 50.488 mm; (e) t = 49 ms, simulation: 33.6 mm, experiment: 31.577 mm.
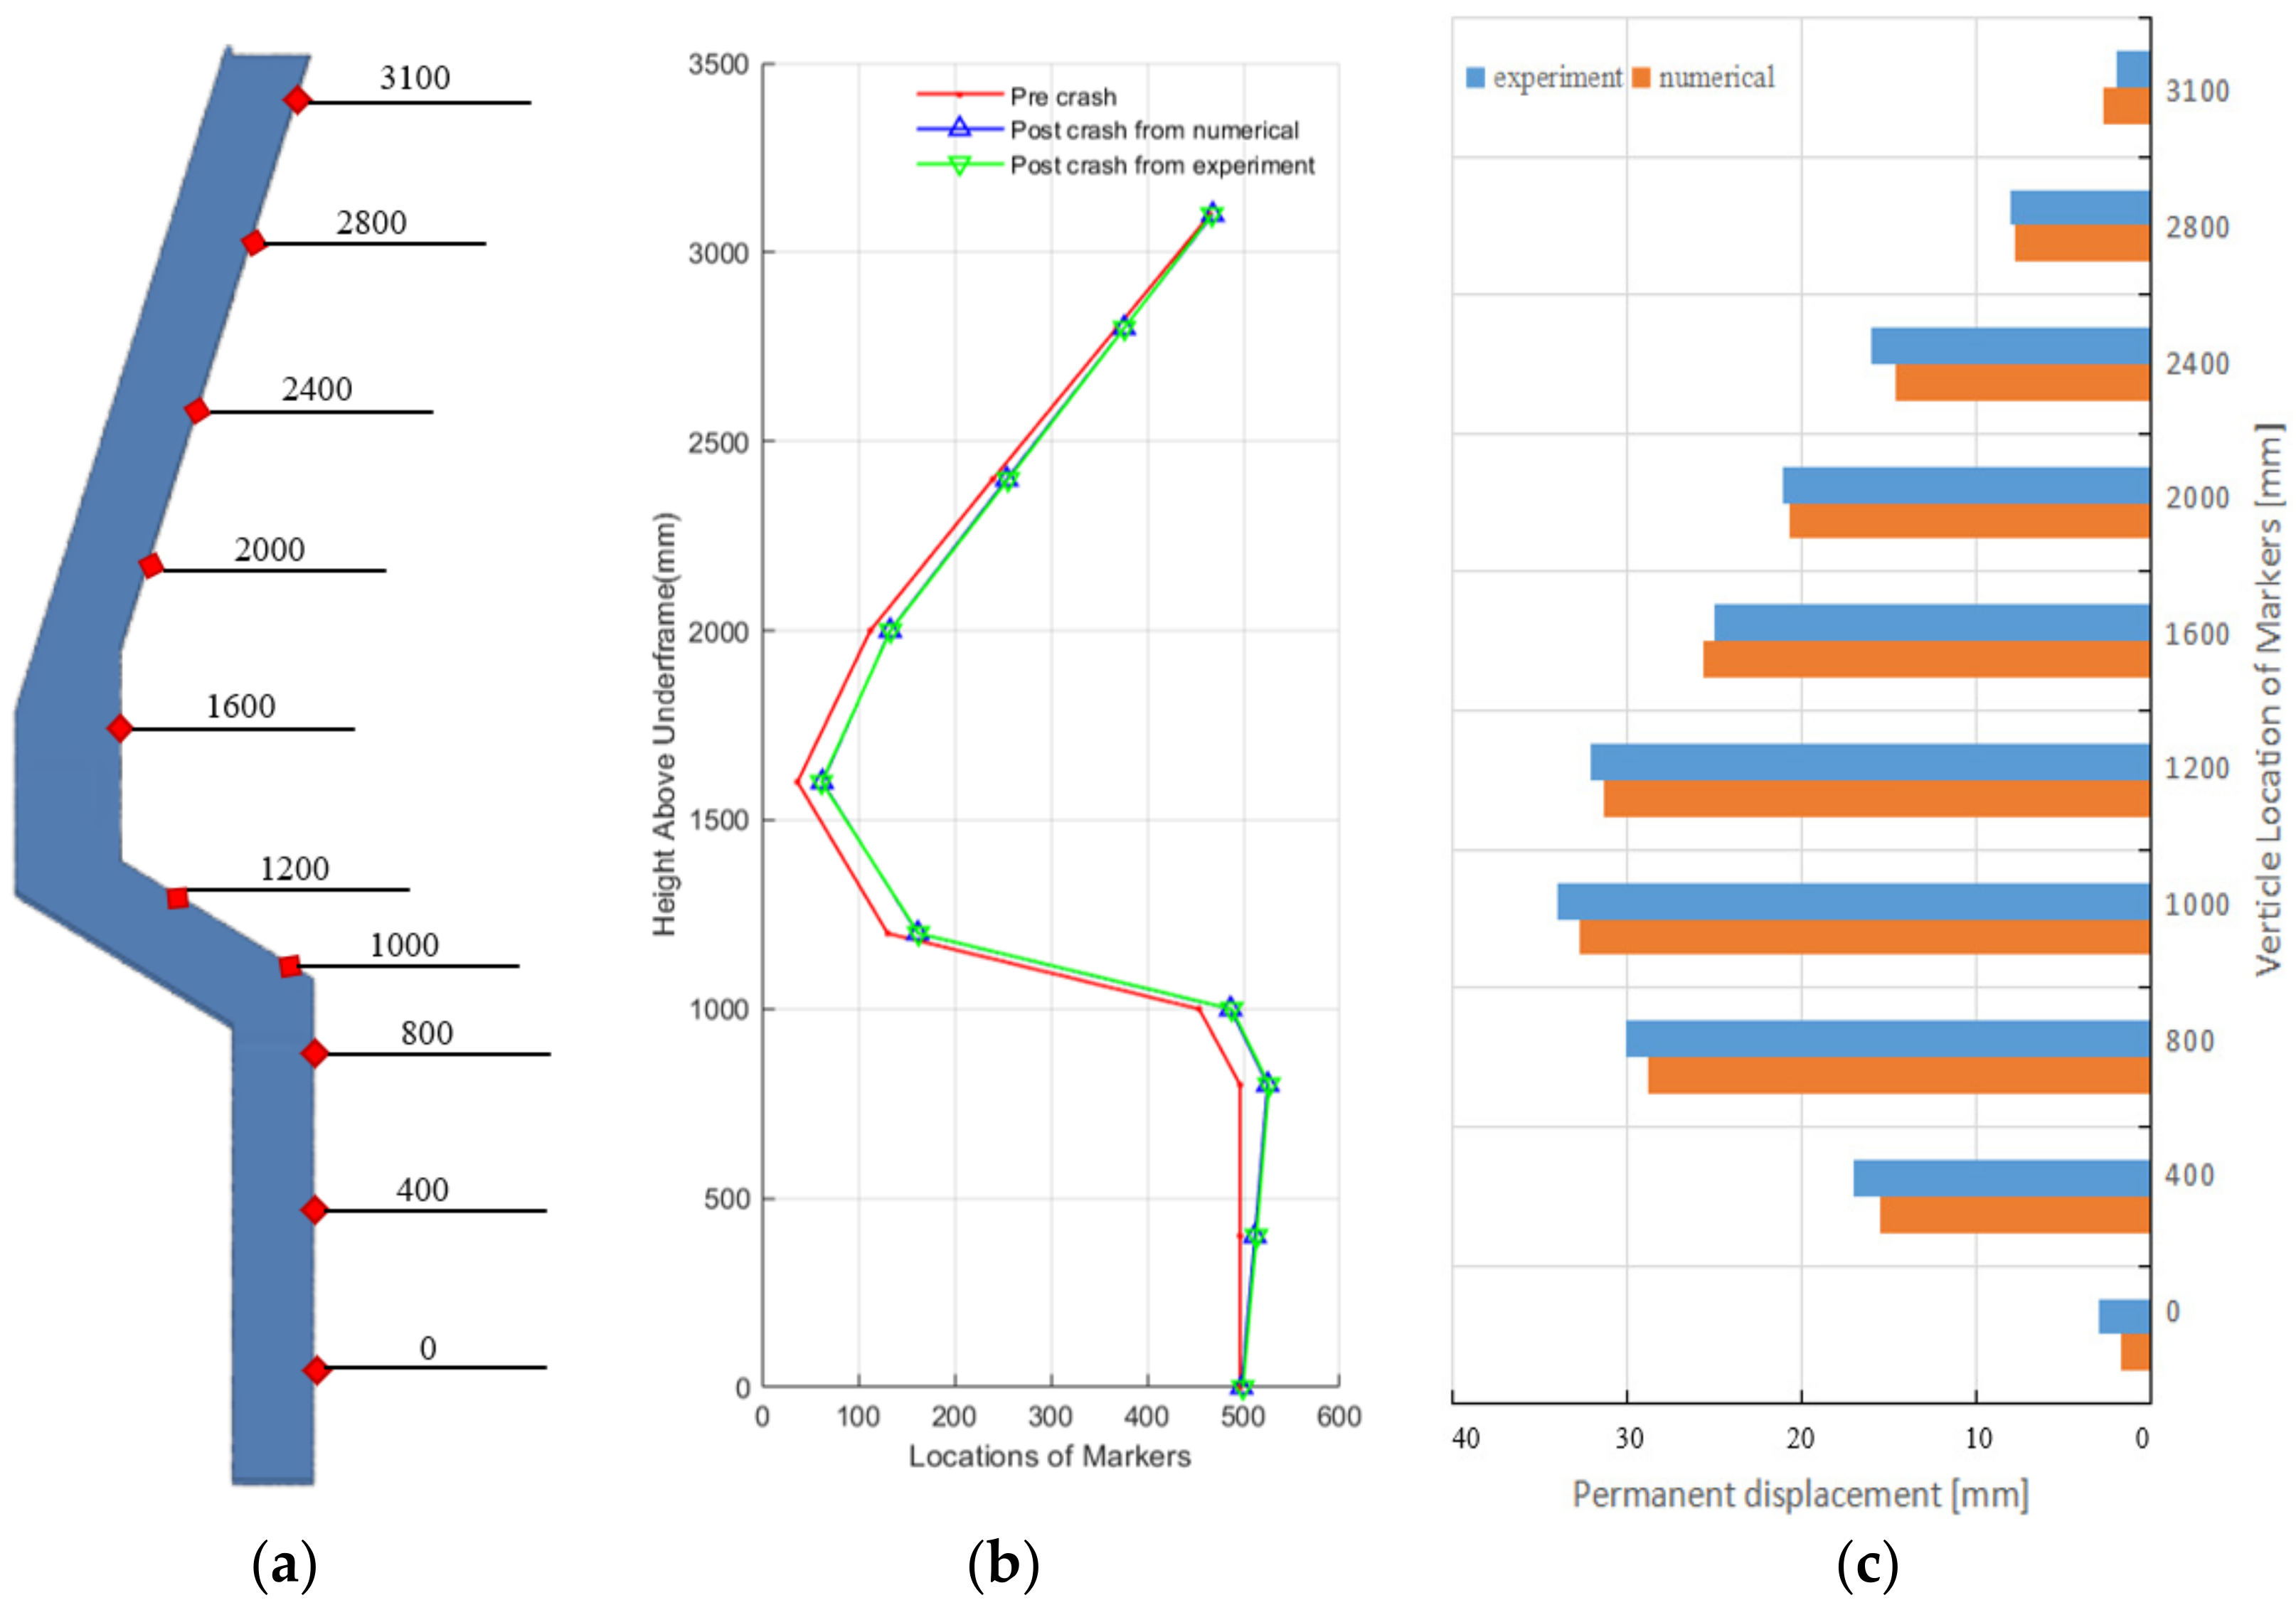
Figure 9.
Longitudinal displacement comparison between the experiment and simulation: (a) permanent displacement along the collision post vertically; (b) permanent longitudinal displacement at the location of 10 markers. (c) detailed displacement comparison for every marker before and after crash.
Figure 9.
Longitudinal displacement comparison between the experiment and simulation: (a) permanent displacement along the collision post vertically; (b) permanent longitudinal displacement at the location of 10 markers. (c) detailed displacement comparison for every marker before and after crash.
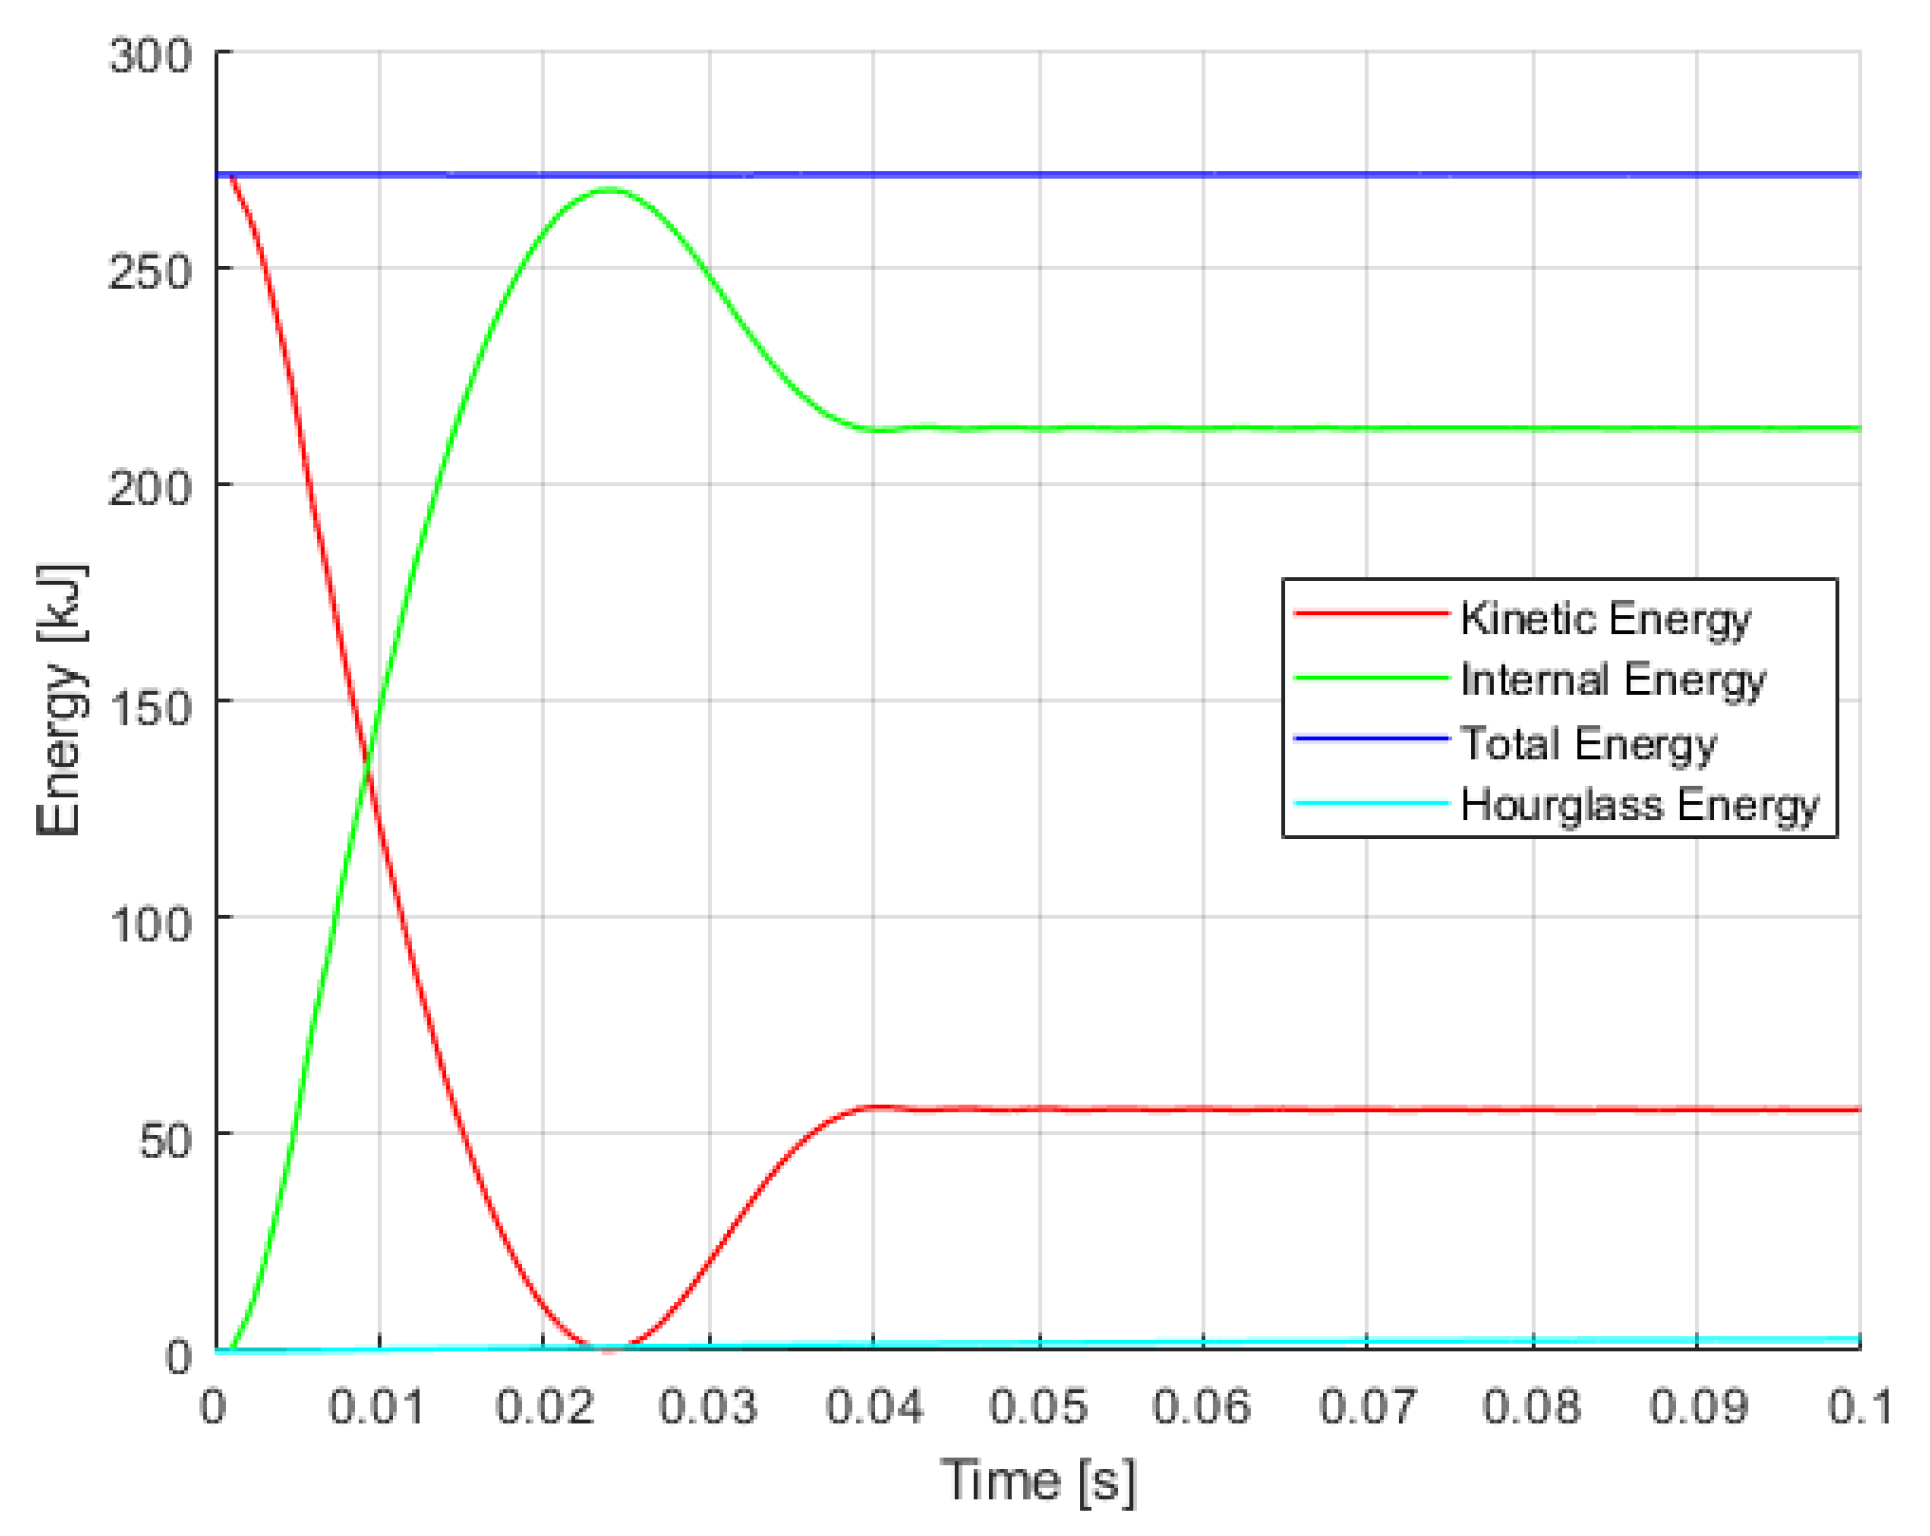
Figure 10.
Energy curves.
Figure 10.
Energy curves.
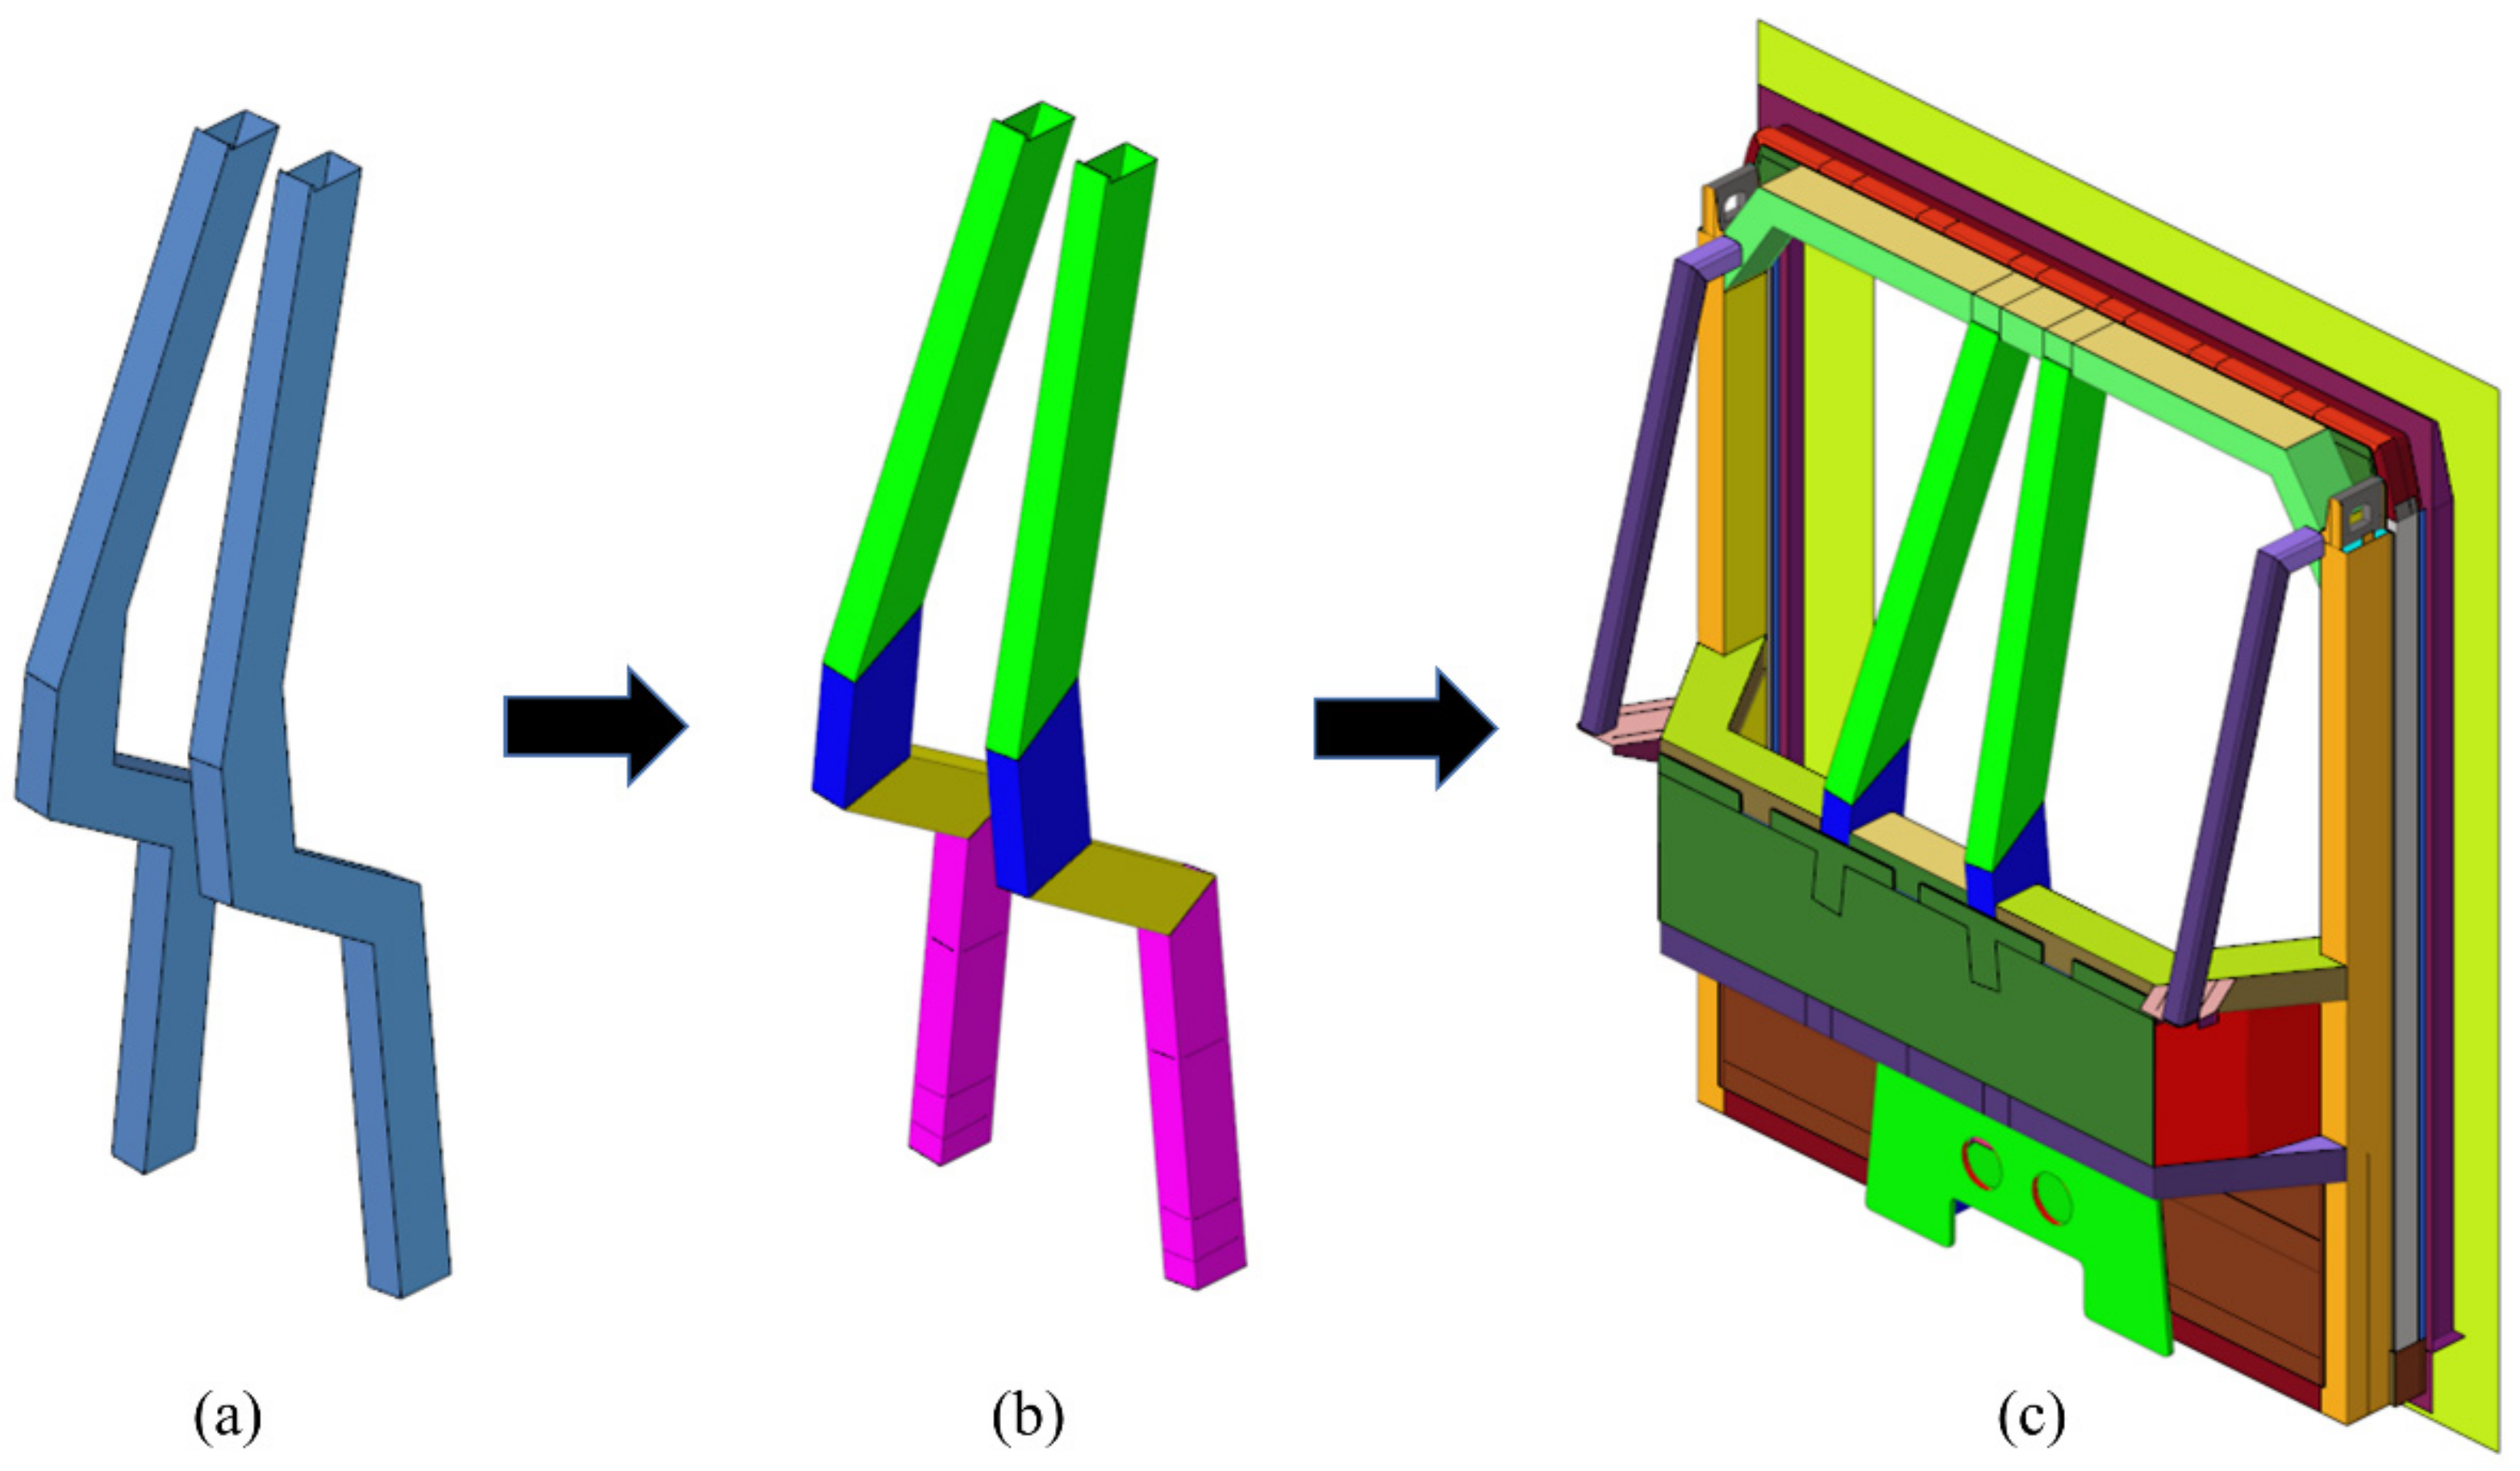
Figure 11.
Finite element model for VSCP: (a) USCP; (b) VSCP; (c) cab car front-end with VSCP.
Figure 11.
Finite element model for VSCP: (a) USCP; (b) VSCP; (c) cab car front-end with VSCP.
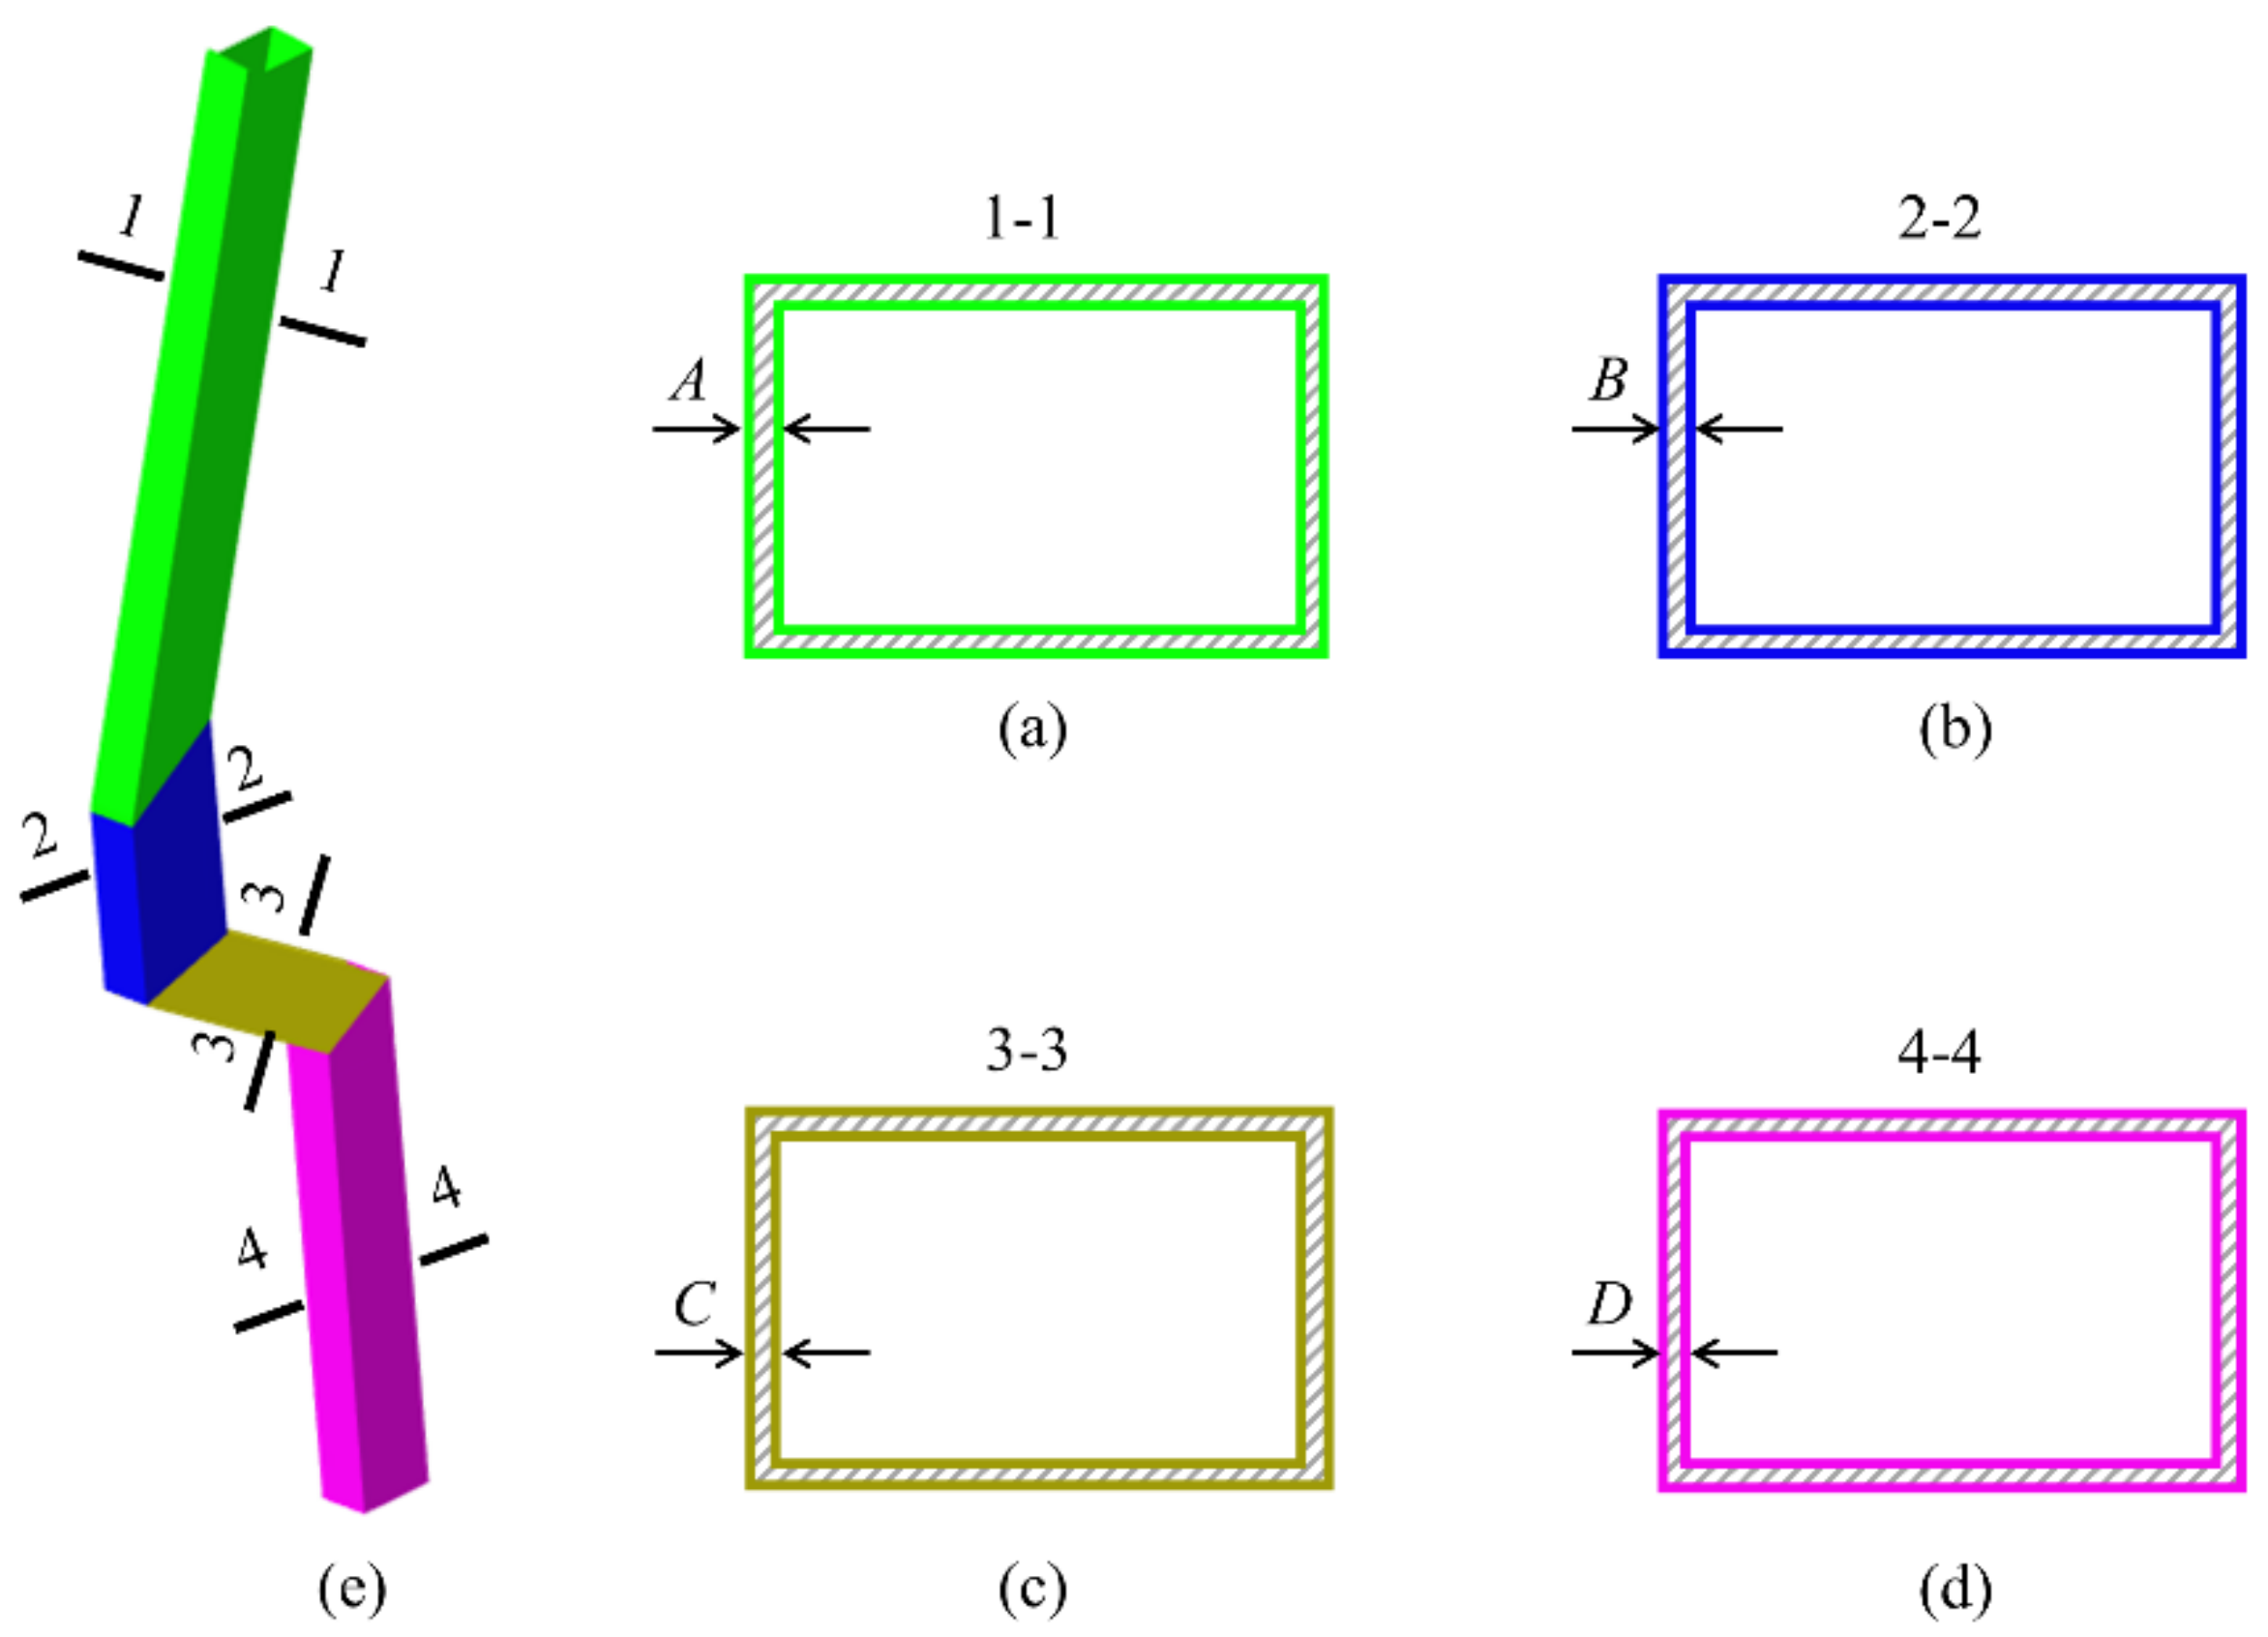
Figure 12.
Parameters of thickness for VSCP: (a) thickness of Part I and parameter A; (b) thickness of Part II and parameter B; (c) thickness of Part III and parameter C; (d) thickness of Part IV and parameter D; (e) VSCP model.
Figure 12.
Parameters of thickness for VSCP: (a) thickness of Part I and parameter A; (b) thickness of Part II and parameter B; (c) thickness of Part III and parameter C; (d) thickness of Part IV and parameter D; (e) VSCP model.
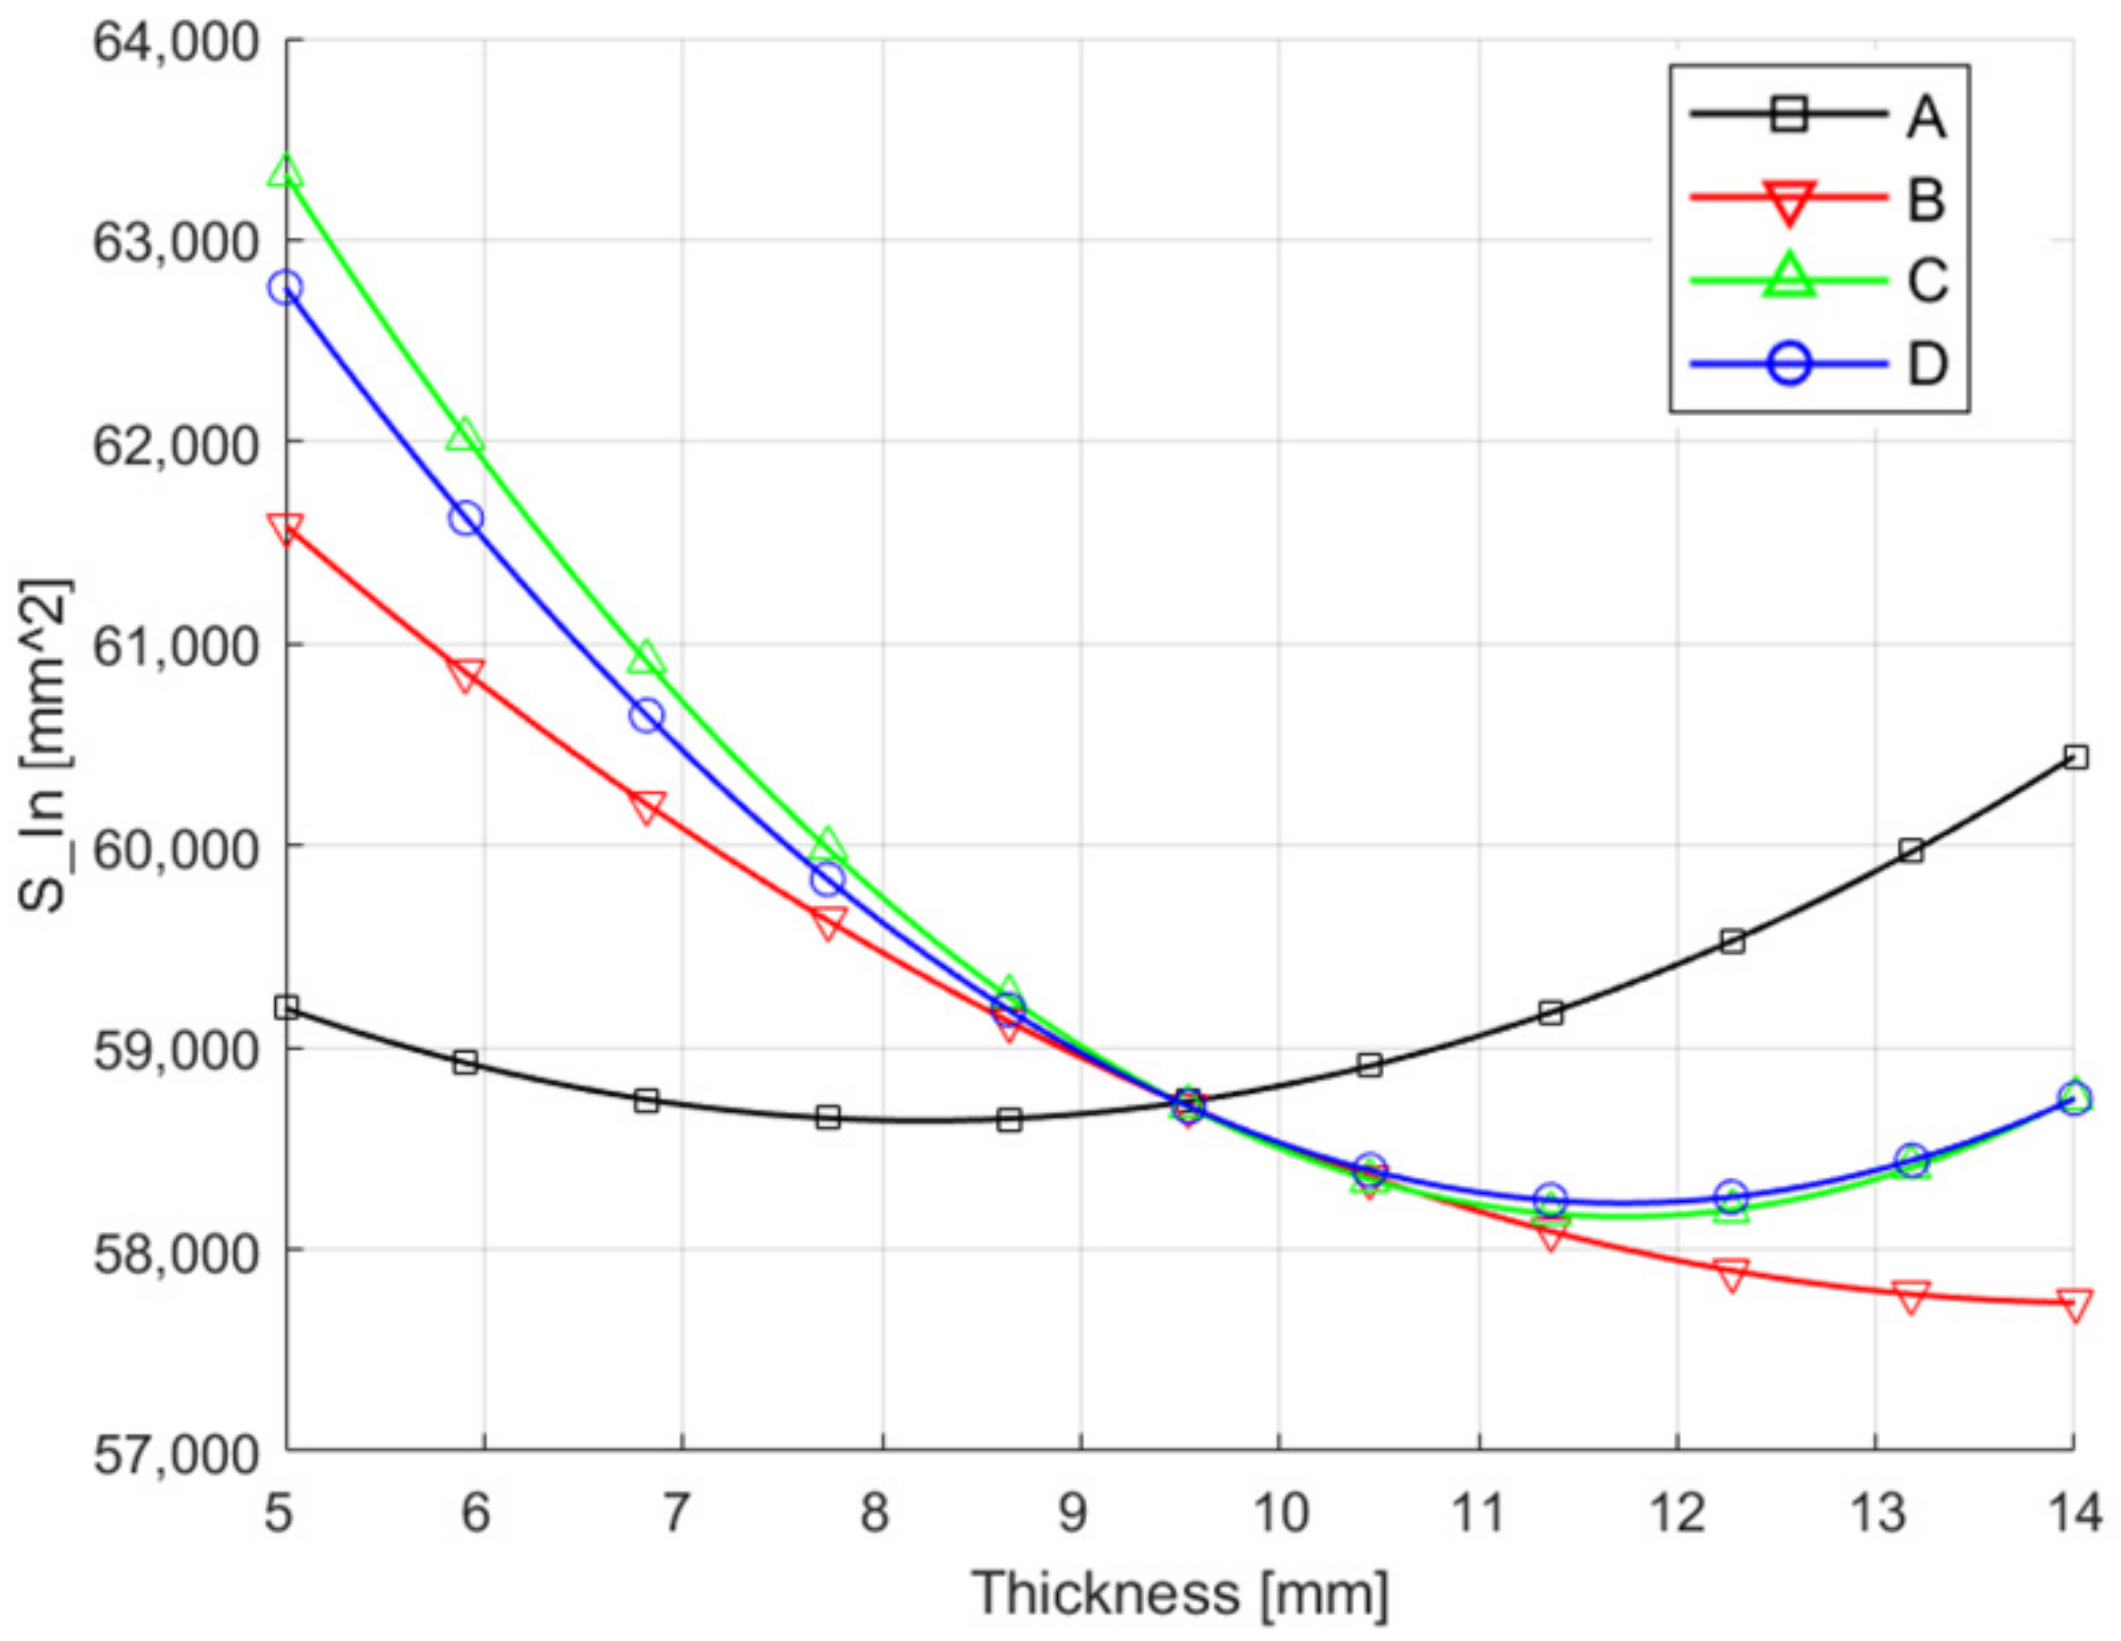
Figure 13.
Effect of thickness on S_In response.
Figure 13.
Effect of thickness on S_In response.
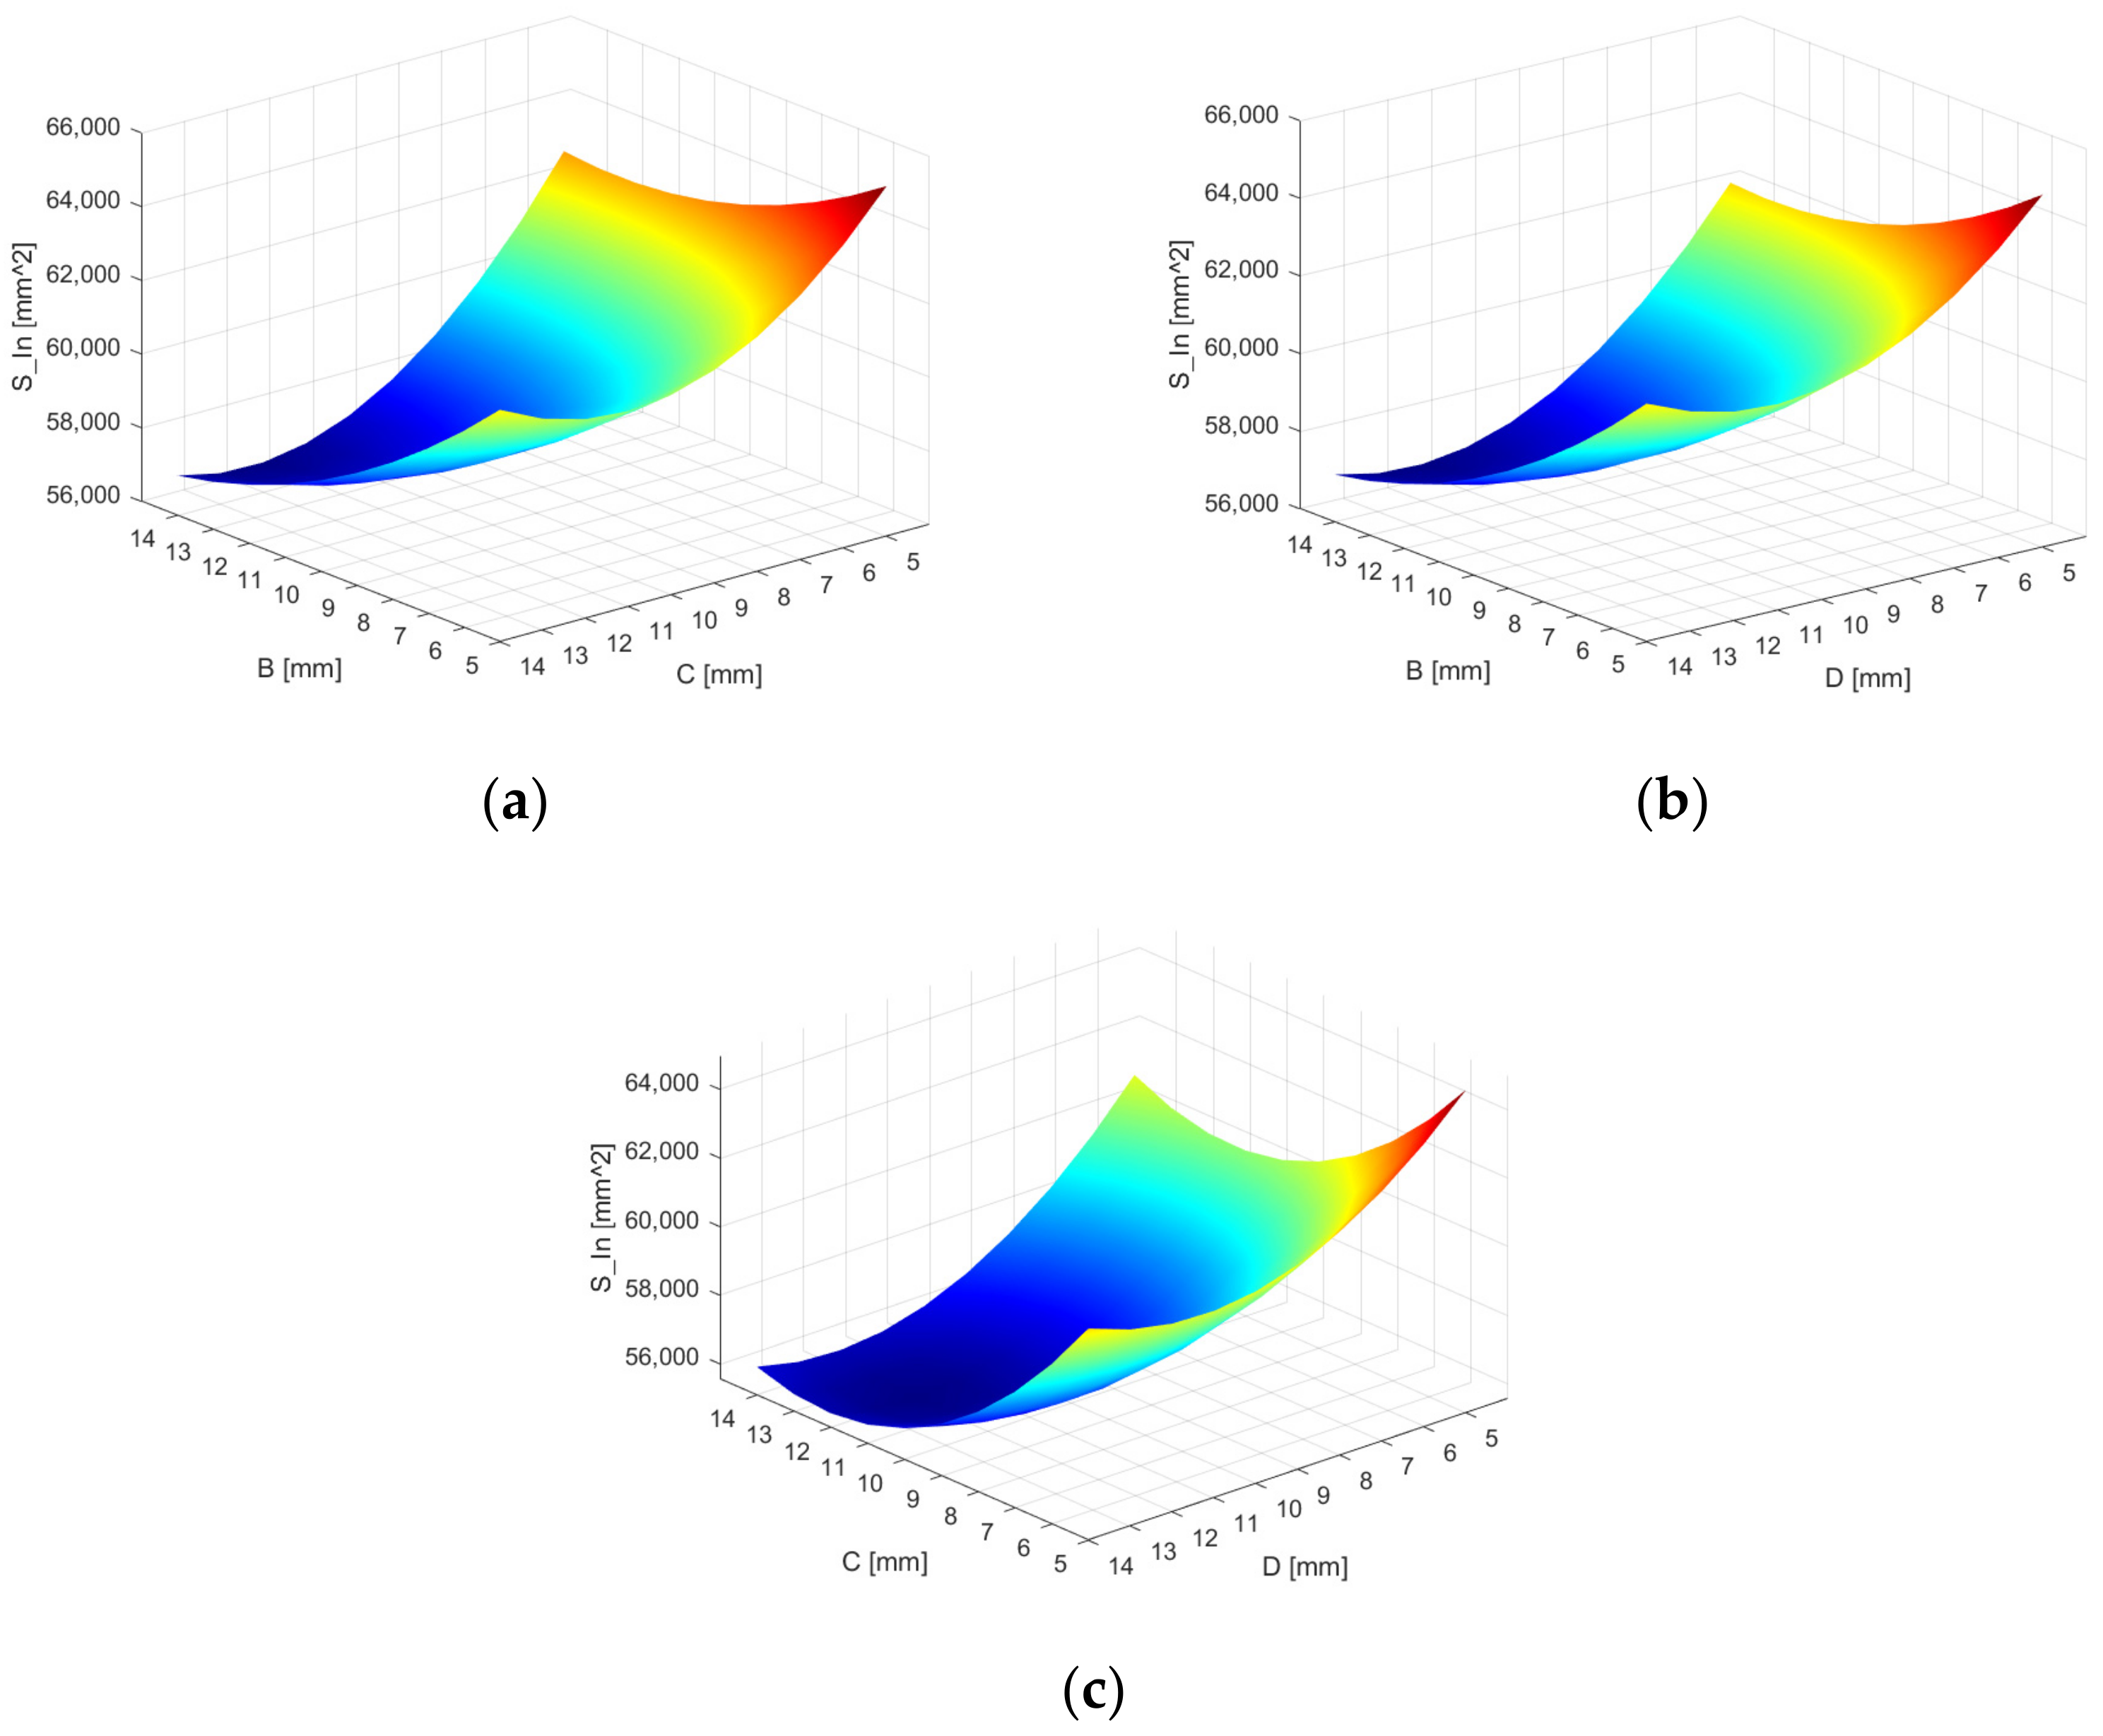
Figure 14.
Response surfaces of S_In: (a) effect of thickness of parameters B and C on S_In; (b) effect of thickness of parameters B and D IV on S_In; (c) effect of thickness of parameters C and D on S_In.
Figure 14.
Response surfaces of S_In: (a) effect of thickness of parameters B and C on S_In; (b) effect of thickness of parameters B and D IV on S_In; (c) effect of thickness of parameters C and D on S_In.
Figure 15.
Effect curves of thickness: (a) Effect of parameters on EA_VSCP; (b) Effect of parameters on M_VSCP.
Figure 15.
Effect curves of thickness: (a) Effect of parameters on EA_VSCP; (b) Effect of parameters on M_VSCP.
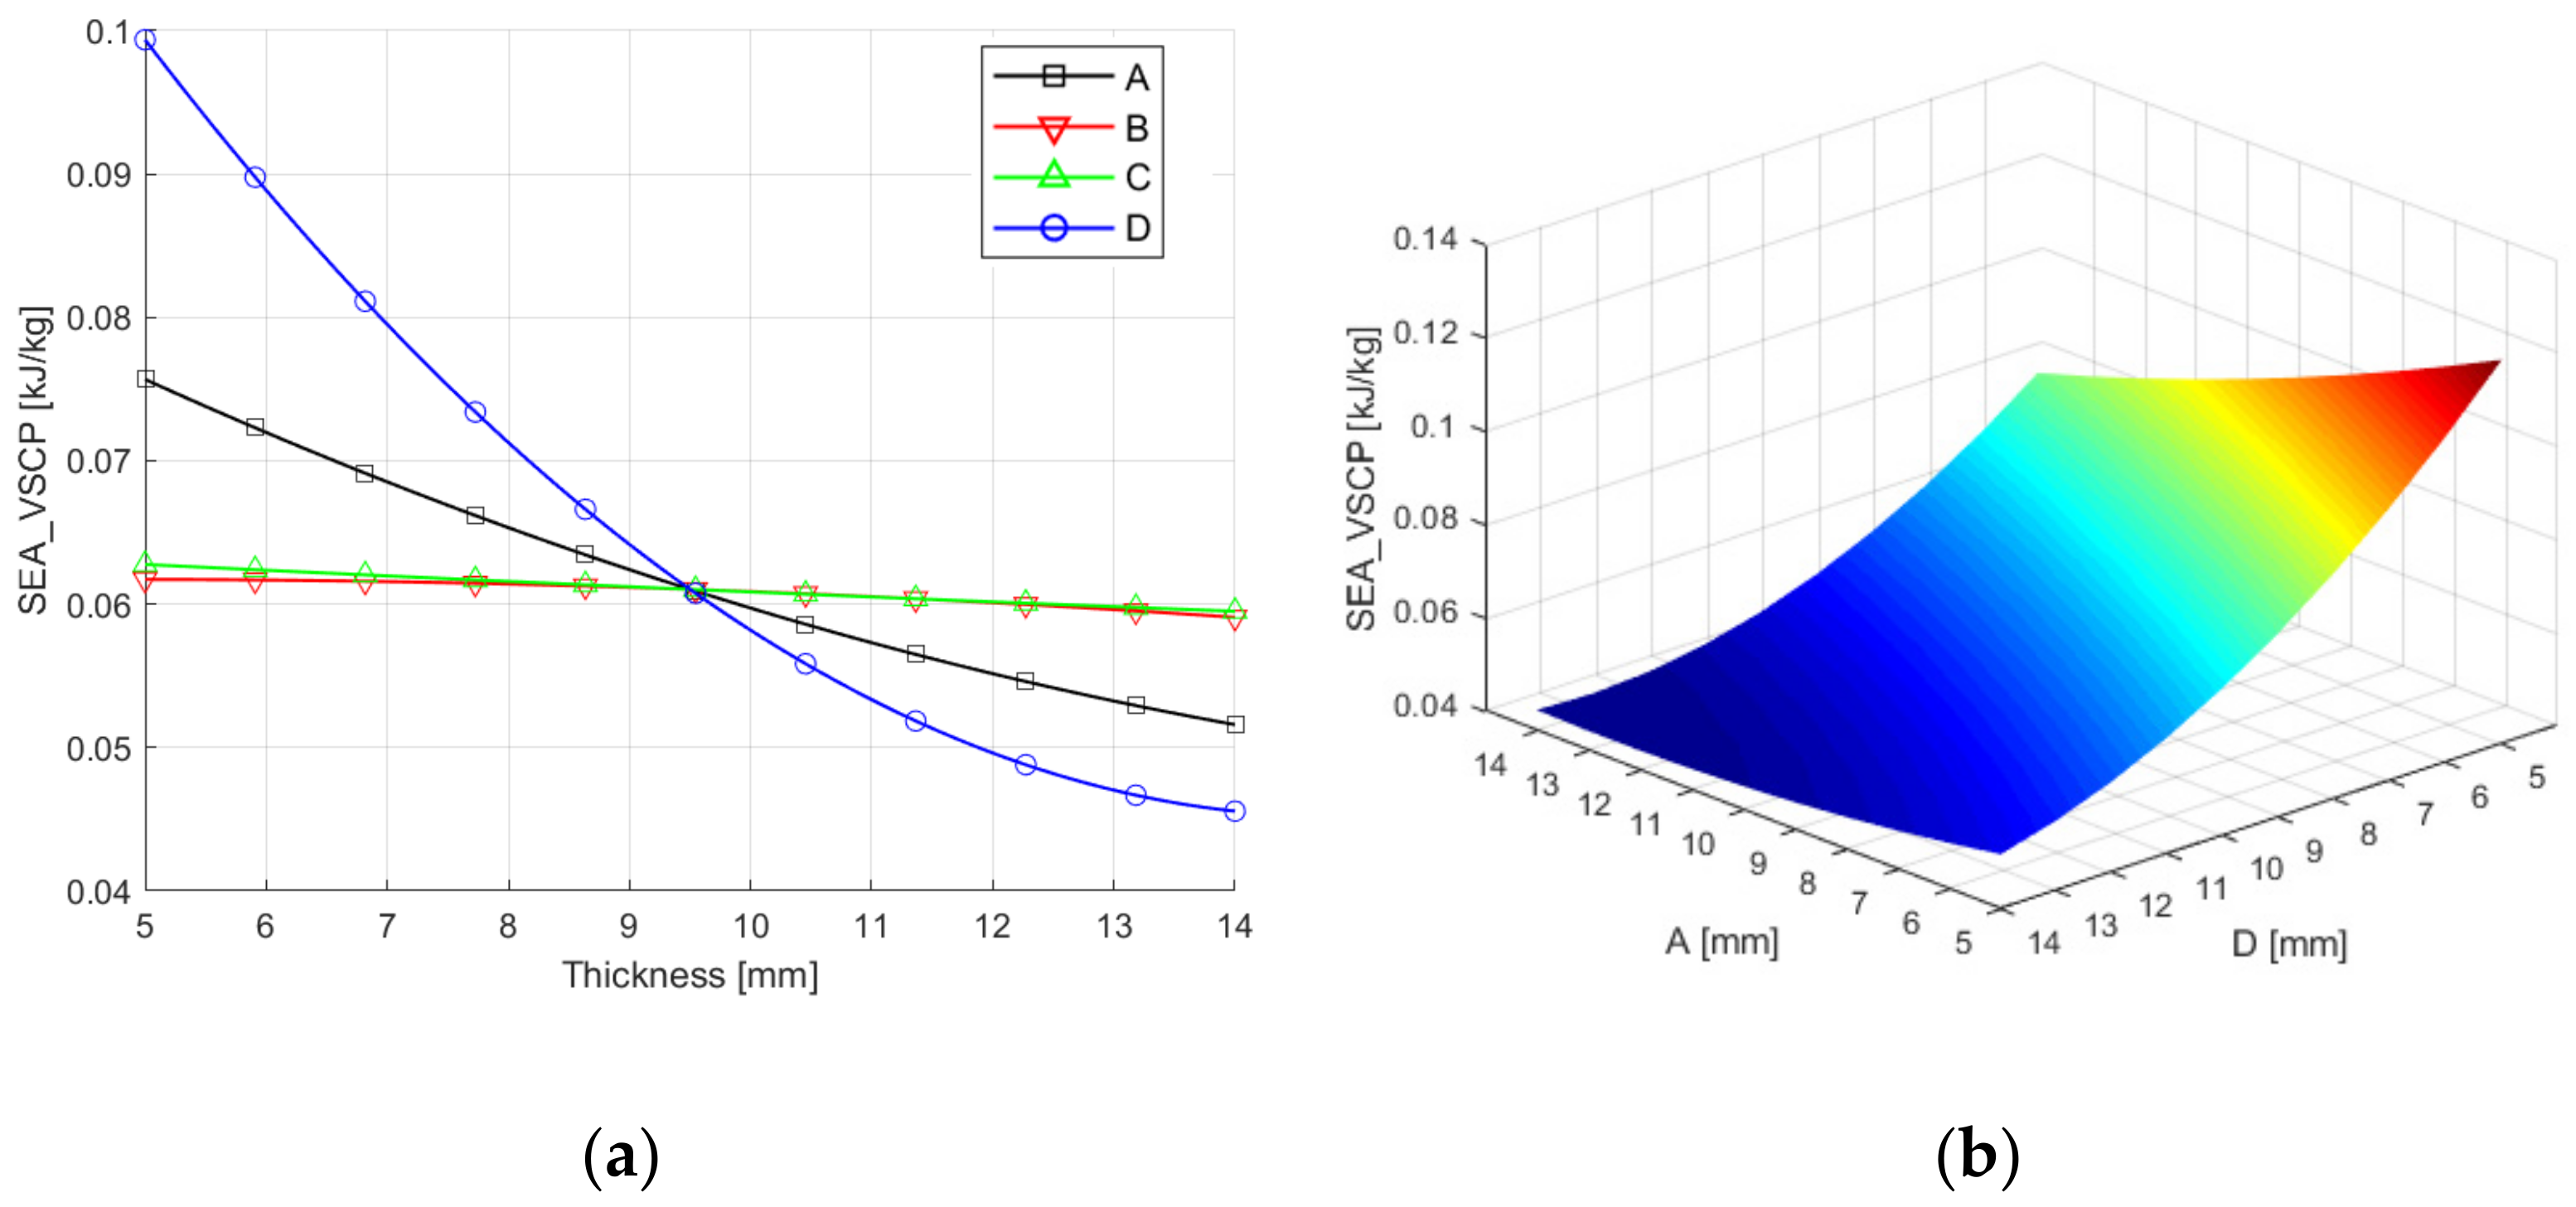
Figure 16.
Effect of thickness on the SEA_VSCP response: (a) effect of single variable thickness on SEA_VSCP; (b) response surface of SEA_VSCP with Parameters A and D.
Figure 16.
Effect of thickness on the SEA_VSCP response: (a) effect of single variable thickness on SEA_VSCP; (b) response surface of SEA_VSCP with Parameters A and D.
Figure 17.
Effect of thickness: (a) effect of thickness on PCF_VSCP response; (b) effect of thickness on EA_FE response.
Figure 17.
Effect of thickness: (a) effect of thickness on PCF_VSCP response; (b) effect of thickness on EA_FE response.
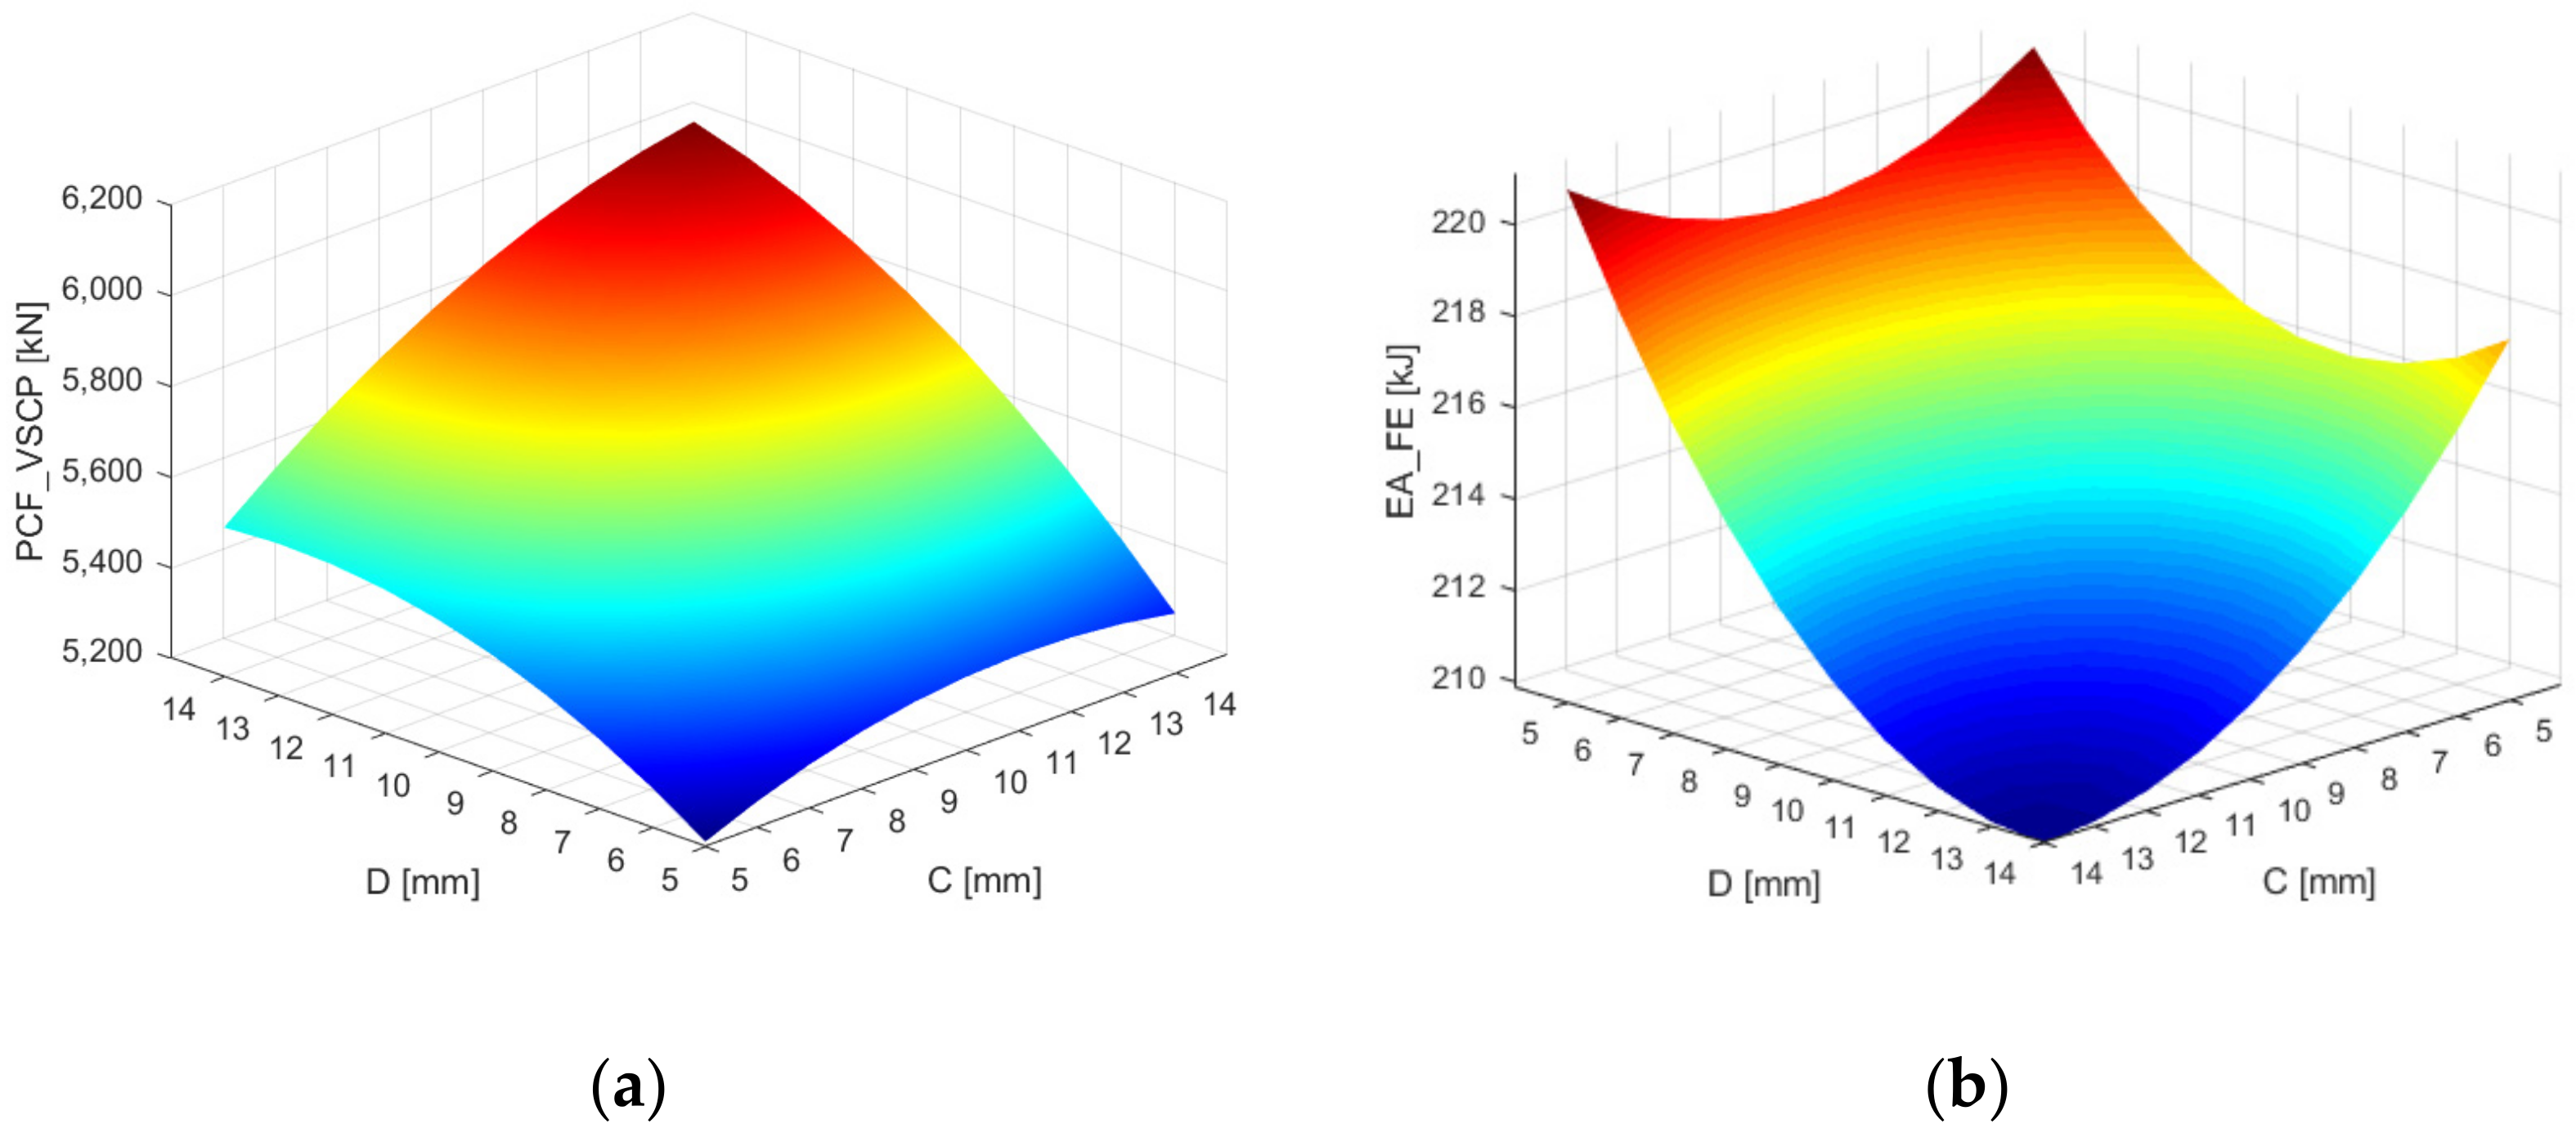
Figure 18.
Response surface: (a) response surface of PCF_VSCP with parameters C and D; (b) response surface of EA_FE with parameters C and D.
Figure 18.
Response surface: (a) response surface of PCF_VSCP with parameters C and D; (b) response surface of EA_FE with parameters C and D.
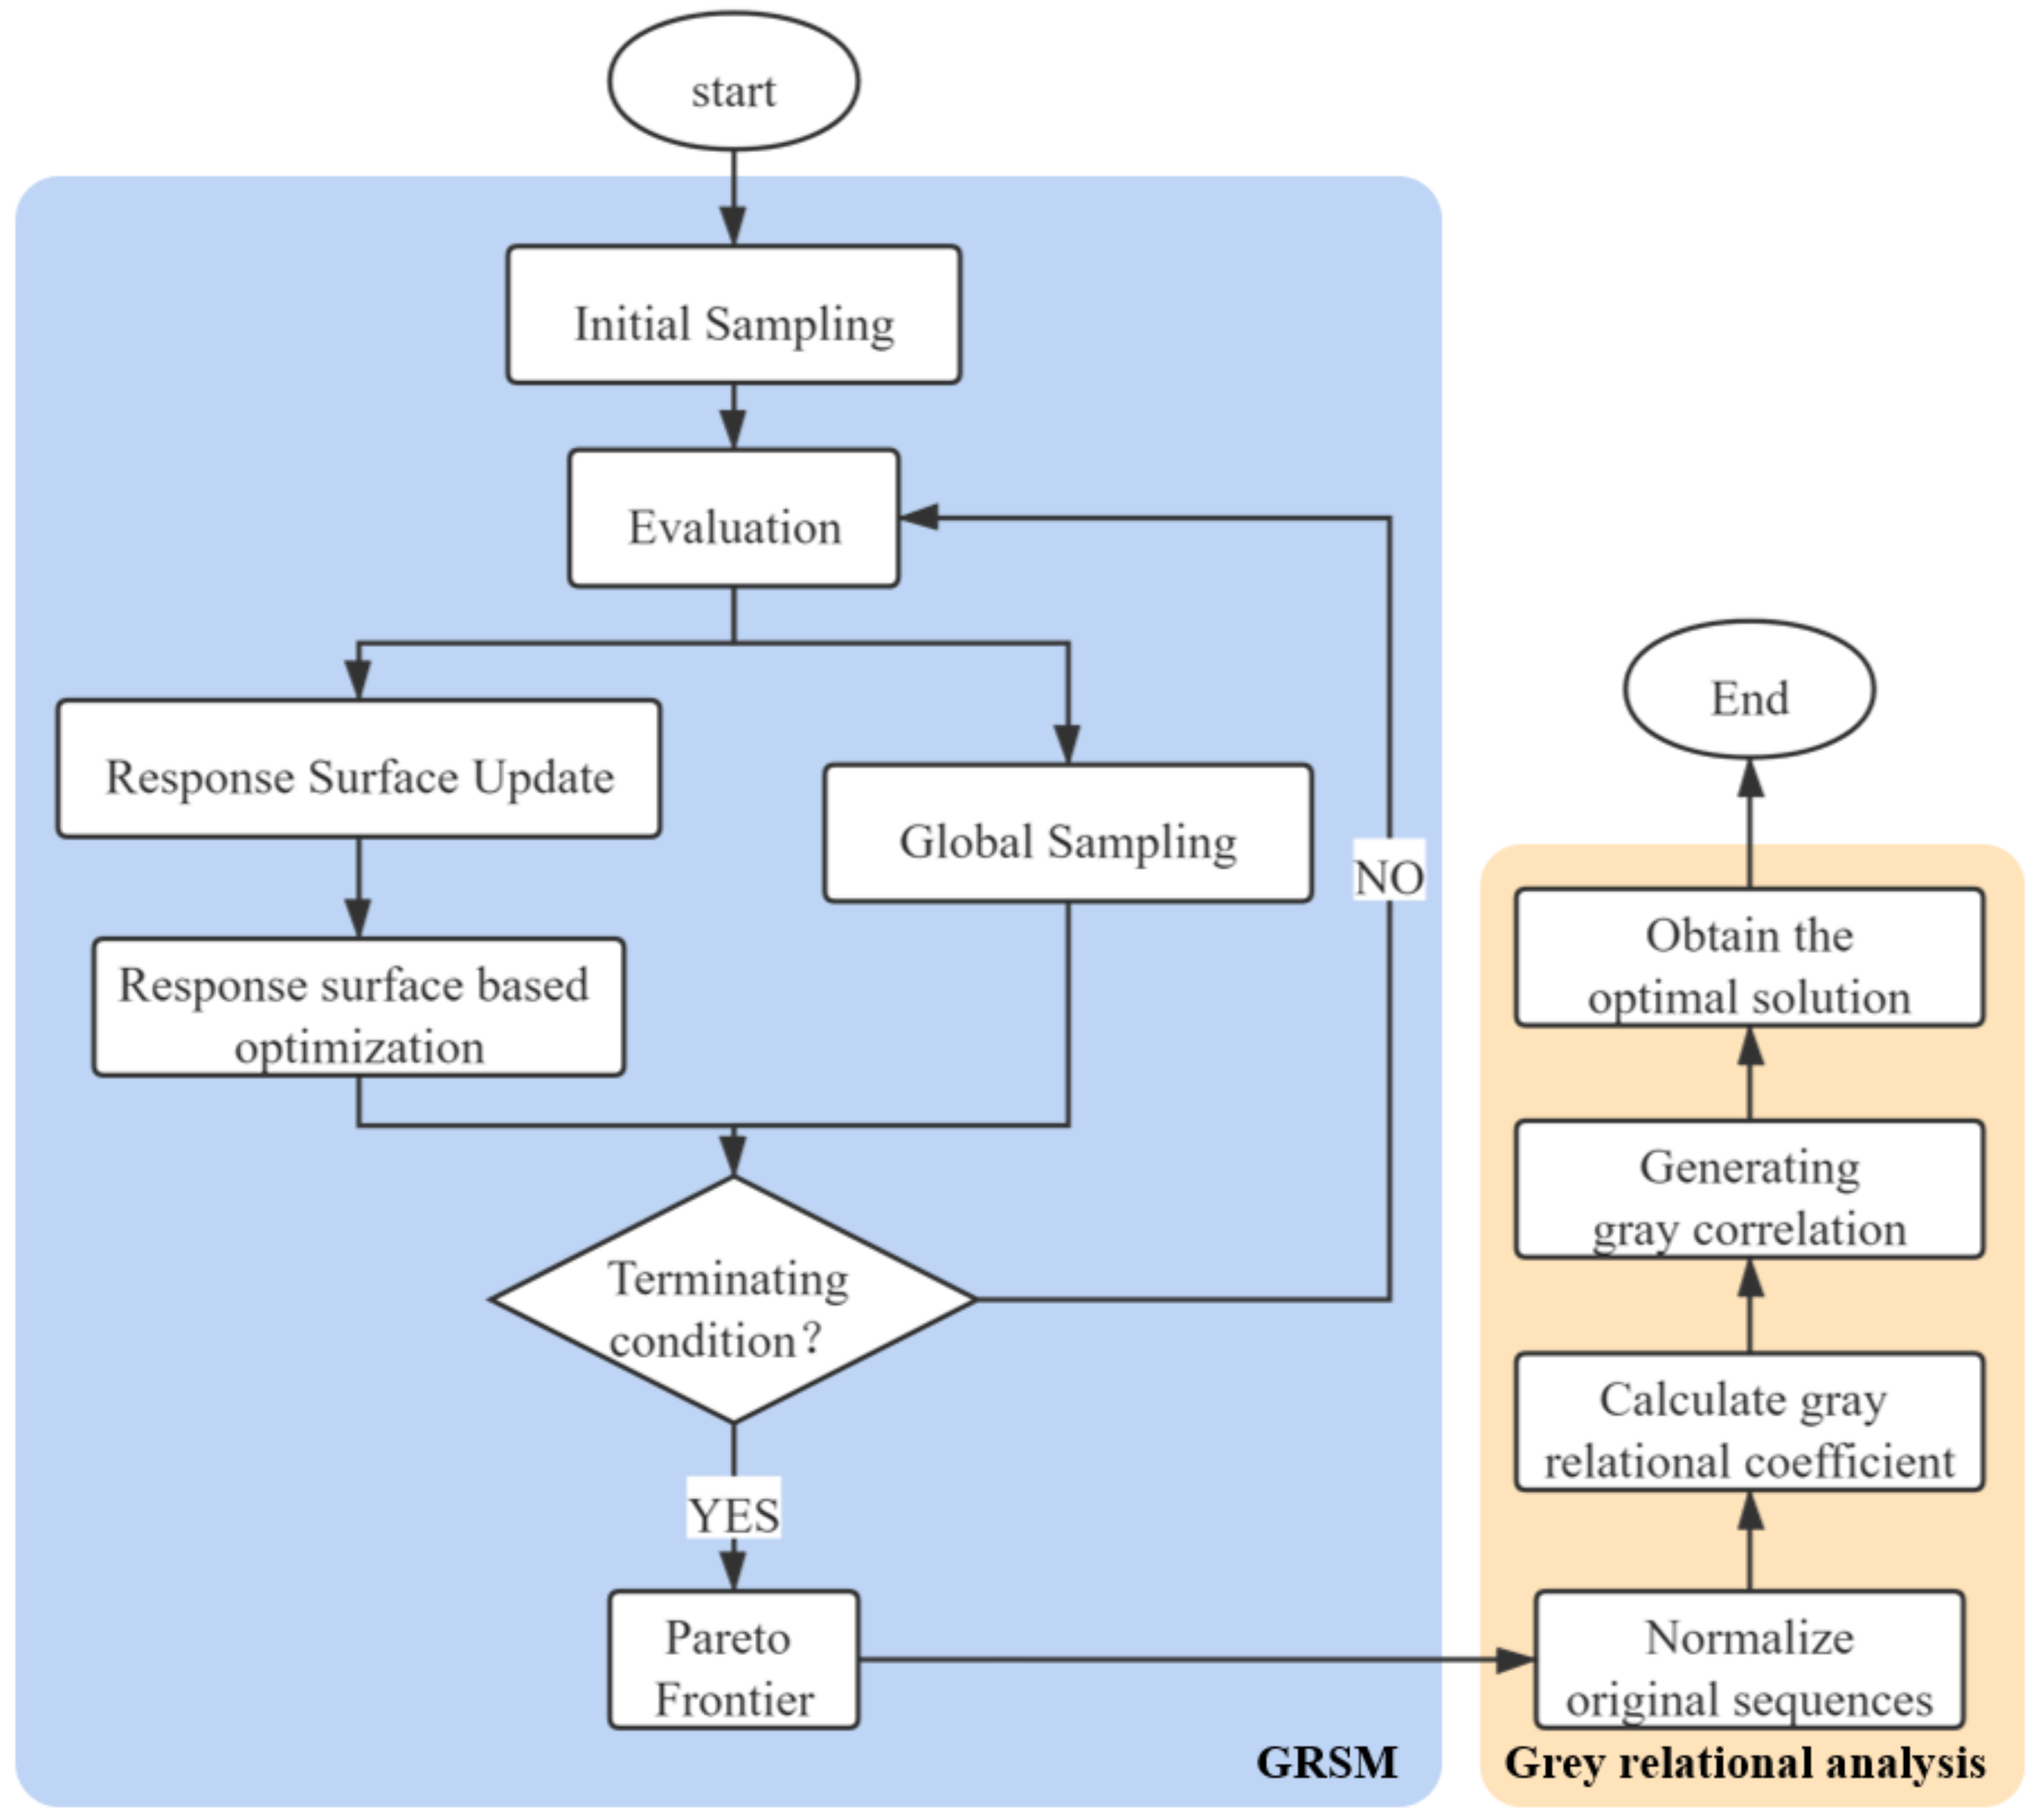
Figure 19.
Flowchart of crashworthiness optimization for VSCP.
Figure 19.
Flowchart of crashworthiness optimization for VSCP.
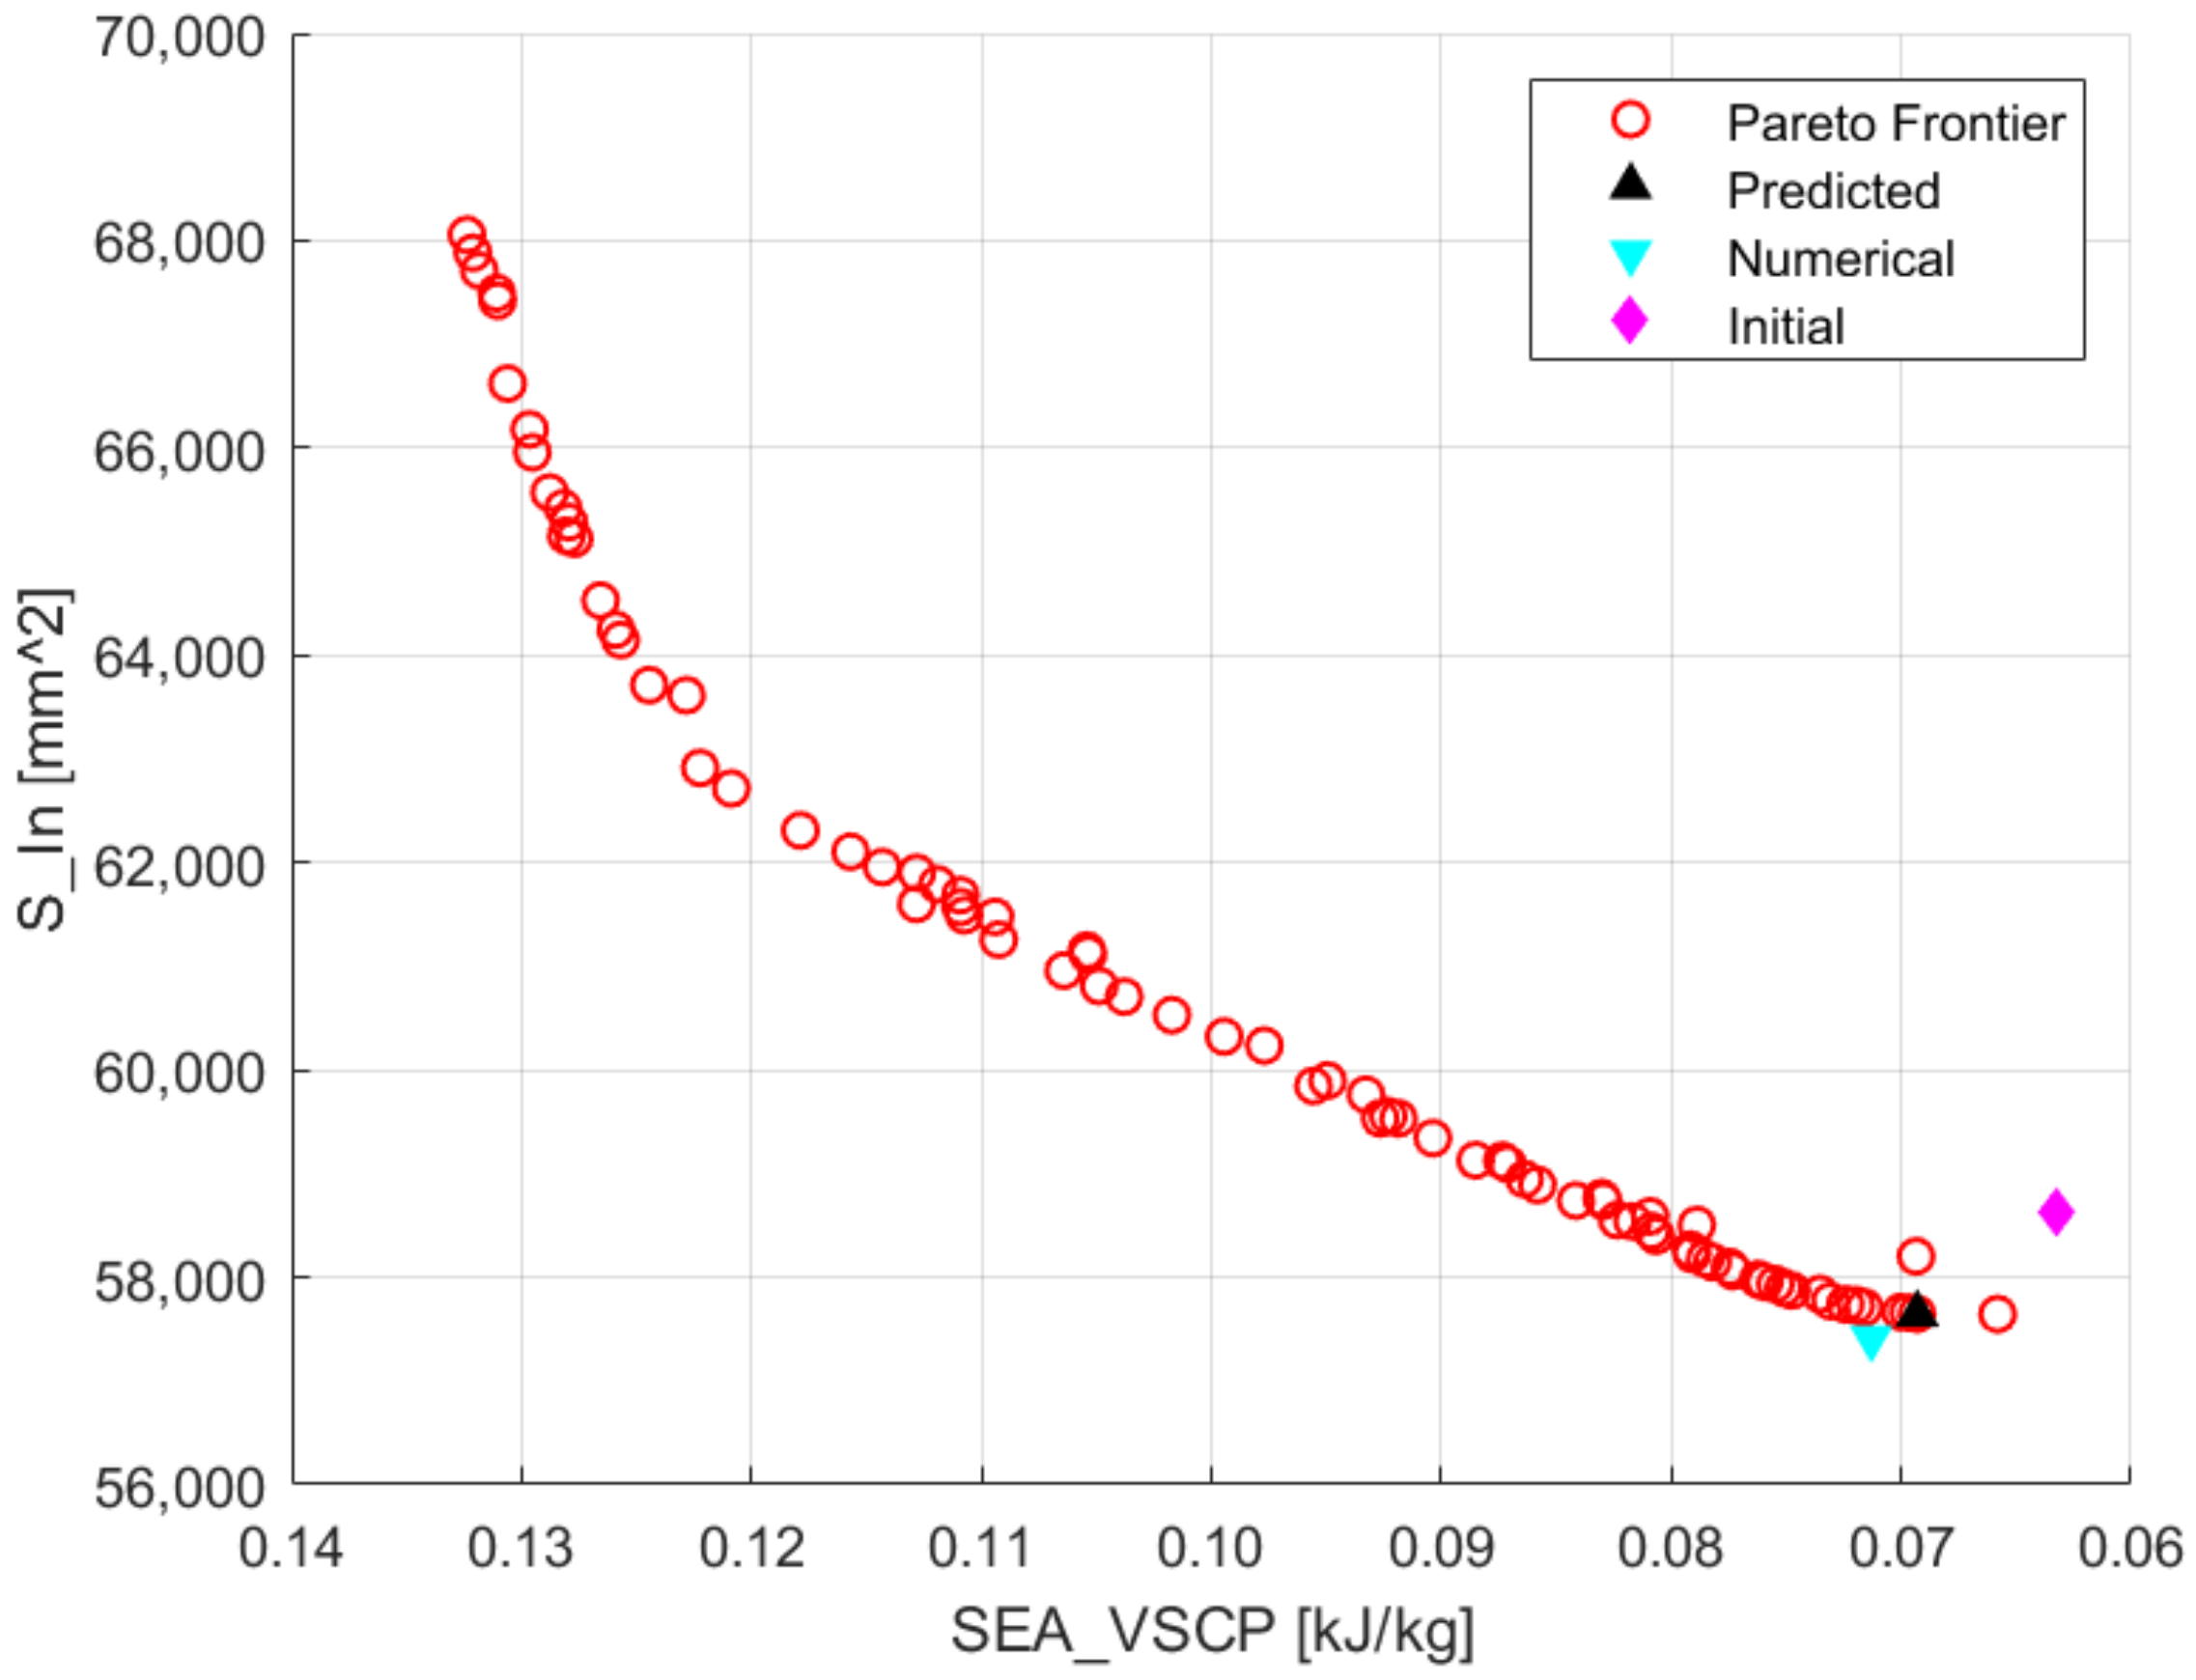
Figure 20.
Pareto frontier of the multiobjective optimization.
Figure 20.
Pareto frontier of the multiobjective optimization.
Table 1.
Material property parameters.
Table 1.
Material property parameters.
| Mechanical Parameters | Units | Values |
|---|
| Density | kg/m3 | 7800 |
| Young’s modulus | GPa | 207 |
| Poisson’s ratio | / | 0.3 |
| Yield stress | GPa | 690 |
Table 2.
Velocity and Energy.
Table 2.
Velocity and Energy.
| | Test | Simulation | Error |
|---|
| Crash velocity (m/s) | 4.69 | 4.69 | / |
| Rebound velocity (m/s) | 2.182 | 2.117 | 2.979% |
| Total mass (kg) | 24,662 | 24,662 | / |
| Energy (MJ) | 0.213 | 0.208 | 2.347% |
Table 3.
Thickness parameters and experimental design levels.
Table 3.
Thickness parameters and experimental design levels.
| Thickness Parameters | Code | −1 | 0 | 1 |
|---|
| Thickness of Part I | A | 5.0 | 9.5 | 14.0 |
| Thickness of Part II | B | 5.0 | 9.5 | 14.0 |
| Thickness of Part III | C | 5.0 | 9.5 | 14.0 |
| Thickness of Part IV | D | 5.0 | 9.5 | 14.0 |
Table 4.
Design of experiment and simulation results of VSCP.
Table 4.
Design of experiment and simulation results of VSCP.
| Std. | Thickness Parameters | Responses |
|---|
| A (mm) | B (mm) | C (mm) | D (mm) | SEA_VSCP (kJ) | S_In (mm2) | EA_FE (kJ) | PCF_VSCP (kN) |
|---|
| 1 | 5 | 5 | 9.5 | 9.5 | 20.4927 | 62,589.432 | 213.12 | 5446.6989 |
| 2 | 5 | 14 | 9.5 | 9.5 | 23.0703 | 57,814.749 | 212.197 | 5517.7271 |
| 3 | 14 | 5 | 9.5 | 9.5 | 21.3100 | 63,570.481 | 213.131 | 5482.8599 |
| 4 | 14 | 14 | 9.5 | 9.5 | 24.1989 | 59,263.441 | 213.196 | 5544.4636 |
| 5 | 5 | 9.5 | 5 | 9.5 | 22.1219 | 63,277.74 | 217.861 | 5171.6082 |
| 6 | 5 | 9.5 | 14 | 9.5 | 23.7490 | 59,637.754 | 212.906 | 5531.1088 |
| 7 | 14 | 9.5 | 5 | 9.5 | 22.3060 | 66,576.92 | 217.691 | 5204.1427 |
| 8 | 14 | 9.5 | 14 | 9.5 | 25.349 | 59,480.653 | 213.245 | 5573.385 |
| 9 | 5 | 9.5 | 9.5 | 5 | 31.6865 | 61,808.56 | 220.188 | 5039.2488 |
| 10 | 5 | 9.5 | 9.5 | 14 | 19.5427 | 60,593.651 | 212.091 | 5602.5853 |
| 11 | 14 | 9.5 | 9.5 | 5 | 31.8235 | 63,315.237 | 220.026 | 5043.4856 |
| 12 | 14 | 9.5 | 9.5 | 14 | 21.0165 | 61,016.728 | 212.63 | 5630.2207 |
| 13 | 9.5 | 5 | 5 | 9.5 | 21.2040 | 65,329.503 | 217.663 | 5168.0469 |
| 14 | 9.5 | 5 | 14 | 9.5 | 22.7954 | 61,696.916 | 213.111 | 5516.544 |
| 15 | 9.5 | 14 | 5 | 9.5 | 22.6148 | 63,286.588 | 217.191 | 5217.6989 |
| 16 | 9.5 | 14 | 14 | 9.5 | 25.8719 | 56,924.963 | 213.075 | 5584.1214 |
| 17 | 9.5 | 5 | 9.5 | 5 | 30.7063 | 65,535.246 | 220.268 | 5015.0507 |
| 18 | 9.5 | 5 | 9.5 | 14 | 18.4966 | 61,664.09 | 212.689 | 5579.529 |
| 19 | 9.5 | 14 | 9.5 | 5 | 32.0334 | 63,002.815 | 219.962 | 5052.5604 |
| 20 | 9.5 | 14 | 9.5 | 14 | 21.7133 | 57,000.466 | 212.362 | 5651.6439 |
| 21 | 9.5 | 9.5 | 5 | 5 | 29.1332 | 67,094.875 | 219.539 | 5002.3575 |
| 22 | 9.5 | 9.5 | 5 | 14 | 18.9549 | 62,508.464 | 216.981 | 5272.4815 |
| 23 | 9.5 | 9.5 | 14 | 5 | 32.8472 | 64,518.289 | 220.661 | 5040.4061 |
| 24 | 9.5 | 9.5 | 14 | 14 | 19.36247 | 58,380.467 | 210.191 | 5777.7708 |
| 25 | 9.5 | 9.5 | 9.5 | 9.5 | 22.95254 | 58,726.779 | 212.732 | 5510.8116 |
Table 5.
Details of five arbitrarily selected test points.
Table 5.
Details of five arbitrarily selected test points.
| Std. | Thickness Parameters |
|---|
| A (mm) | B (mm) | C (mm) | D (mm) |
|---|
| 1 | 12.763892 | 5.0492977 | 10.245132 | 8.9565827 |
| 2 | 8.9680140 | 9.5619450 | 11.151149 | 6.4011006 |
| 3 | 5.9441867 | 13.780611 | 13.022969 | 12.452696 |
| 4 | 7.5545501 | 11.198215 | 6.0056417 | 8.4904300 |
| 5 | 11.633395 | 7.2132390 | 8.0068415 | 11.175257 |
Table 6.
Error analysis of the RS models.
Table 6.
Error analysis of the RS models.
| Objective | Fit Specifics | ARE (%) | MRE (%) | R2 |
|---|
| SEA_VSCP (kJ/kg) | Squared | 5.7627 | 11.2748 | 0.9403262 |
| Cubic | 5.3546 | 9.7011 | 0.9477829 |
| Full Quadratic | 3.5395 | 6.6024 | 0.9744627 |
| S_In (mm2) | Squared | 0.7332 | 2.1796 | 0.9067982 |
| Cubic | 0.6954 | 2.1249 | 0.9205400 |
| Full Quadratic | 0.6519 | 1.9937 | 0.9312412 |
Table 7.
Grey correlation analytical data (top ten).
Table 7.
Grey correlation analytical data (top ten).
| Original Sequences | Normalized Data | Relational Coefficient | Grey Correlation |
|---|
| S_In (mm2) | SEA_VSCP (kJ) | S_In (mm2) | SEA_VSCP (kJ) | S_In (mm2) | SEA_VSCP (kJ) | Weighting |
|---|
| 57,648.0200 | 0.0693 | 0.0527 | 0.9997 | 0.3455 | 0.9994 | 0.6725 |
| 57,663.8630 | 0.0700 | 0.0632 | 0.9982 | 0.3480 | 0.9964 | 0.6722 |
| 57,660.4640 | 0.0697 | 0.0582 | 0.9985 | 0.3468 | 0.9971 | 0.6719 |
| 57,709.9750 | 0.0716 | 0.0871 | 0.9938 | 0.3539 | 0.9877 | 0.6708 |
| 57,739.2350 | 0.0724 | 0.0995 | 0.9910 | 0.3570 | 0.9822 | 0.6696 |
| 57,731.3230 | 0.0720 | 0.0926 | 0.9917 | 0.3553 | 0.9837 | 0.6695 |
| 57,770.3390 | 0.0731 | 0.1093 | 0.9880 | 0.3595 | 0.9765 | 0.6680 |
| 68,055.7860 | 0.1324 | 1.0000 | 0.0000 | 1.0000 | 0.3333 | 0.6667 |
| 57,645.1180 | 0.0658 | 0.0000 | 1.0000 | 0.3333 | 1.0000 | 0.6667 |
| 67,882.4910 | 0.1321 | 0.9962 | 0.0166 | 0.9924 | 0.3371 | 0.6647 |
Table 8.
Confirmation of optimal solution.
Table 8.
Confirmation of optimal solution.
| Optimum | | Optimal Points |
|---|
| A (mm) | | 8.27 |
| B (mm) | | 13.99 |
| C (mm) | | 11.81 |
| D (mm) | | 8.34 |
| SEA_VSCP (kg/kJ) | Numerical | 0.0713 |
| Predicted | 0.0693 |
| Error (%) | 2.81 |
| S_In (mm2) | Numerical | 57,413.441 |
| Predicted | 57,645.807 |
| Error (%) | 0.40 |
Table 9.
Difference between the optimal structure and initial structure.
Table 9.
Difference between the optimal structure and initial structure.
| | SEA_VSCP (kg/kJ) | S_In (mm2) |
|---|
| Initial structure | 0.0632 | 58,617.700 |
| Optimal structure | 0.0713 | 57,413.441 |
| Difference (%) | 12.82 | 2.05 |
Table 10.
Displacement contrast of 10 markers between VSCP and USCP.
Table 10.
Displacement contrast of 10 markers between VSCP and USCP.
| | VSCP (mm) | USCP (mm) |
|---|
| A | 1.431 | 1.742 |
| B | 15.976 | 15.483 |
| C | 30.031 | 28.800 |
| D | 31.739 | 32.745 |
| E | 30.147 | 31.318 |
| F | 24.670 | 25.670 |
| G | 19.796 | 20.622 |
| H | 13.962 | 14.575 |
| I | 7.399 | 7.797 |
| J | 2.499 | 2.773 |


