
A 1D–3D Approach for Fast Numerical Analysis of the Flow Characteristics of a Diesel Engine Exhaust Gas


Abstract
:1. Introduction
2. Numerical Analysis
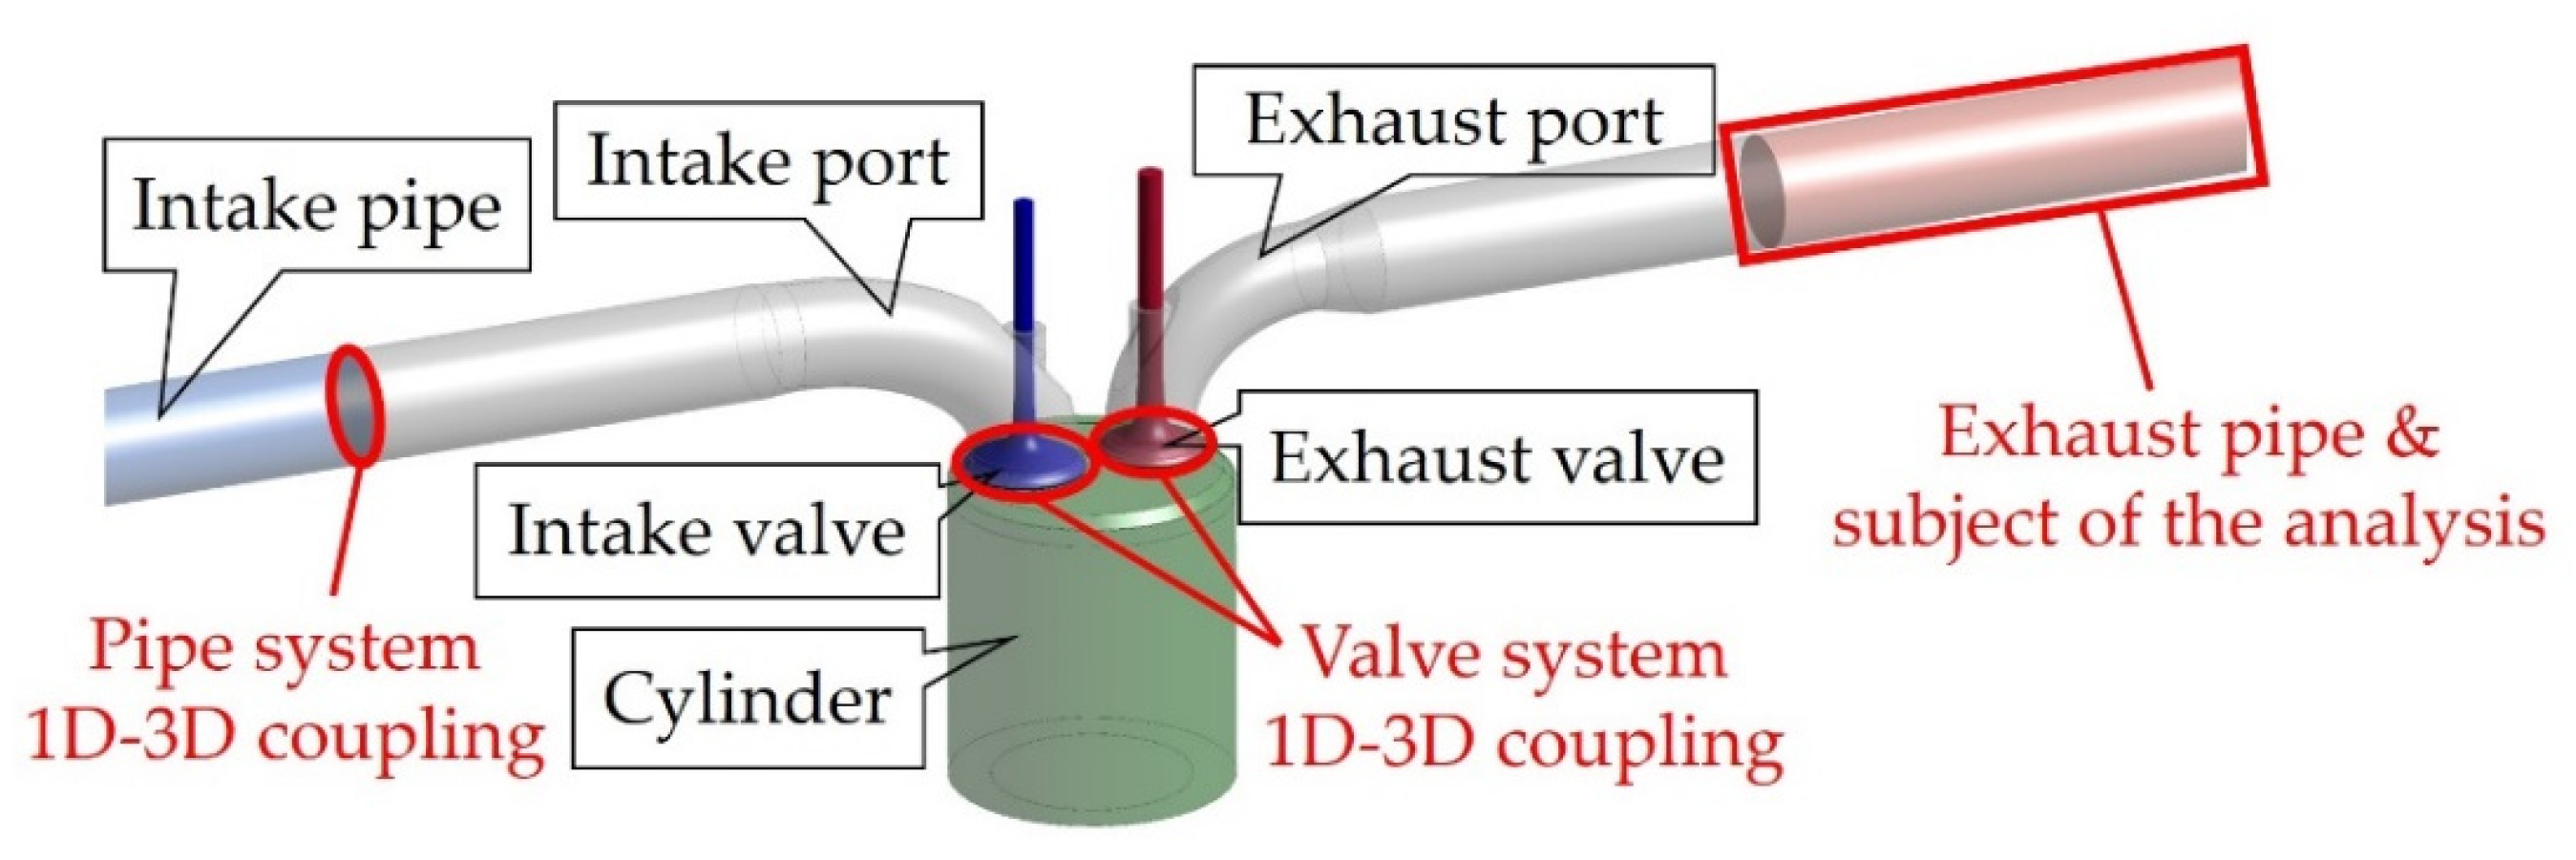
2.1. Modeling
2.2. Time Step
3. Results
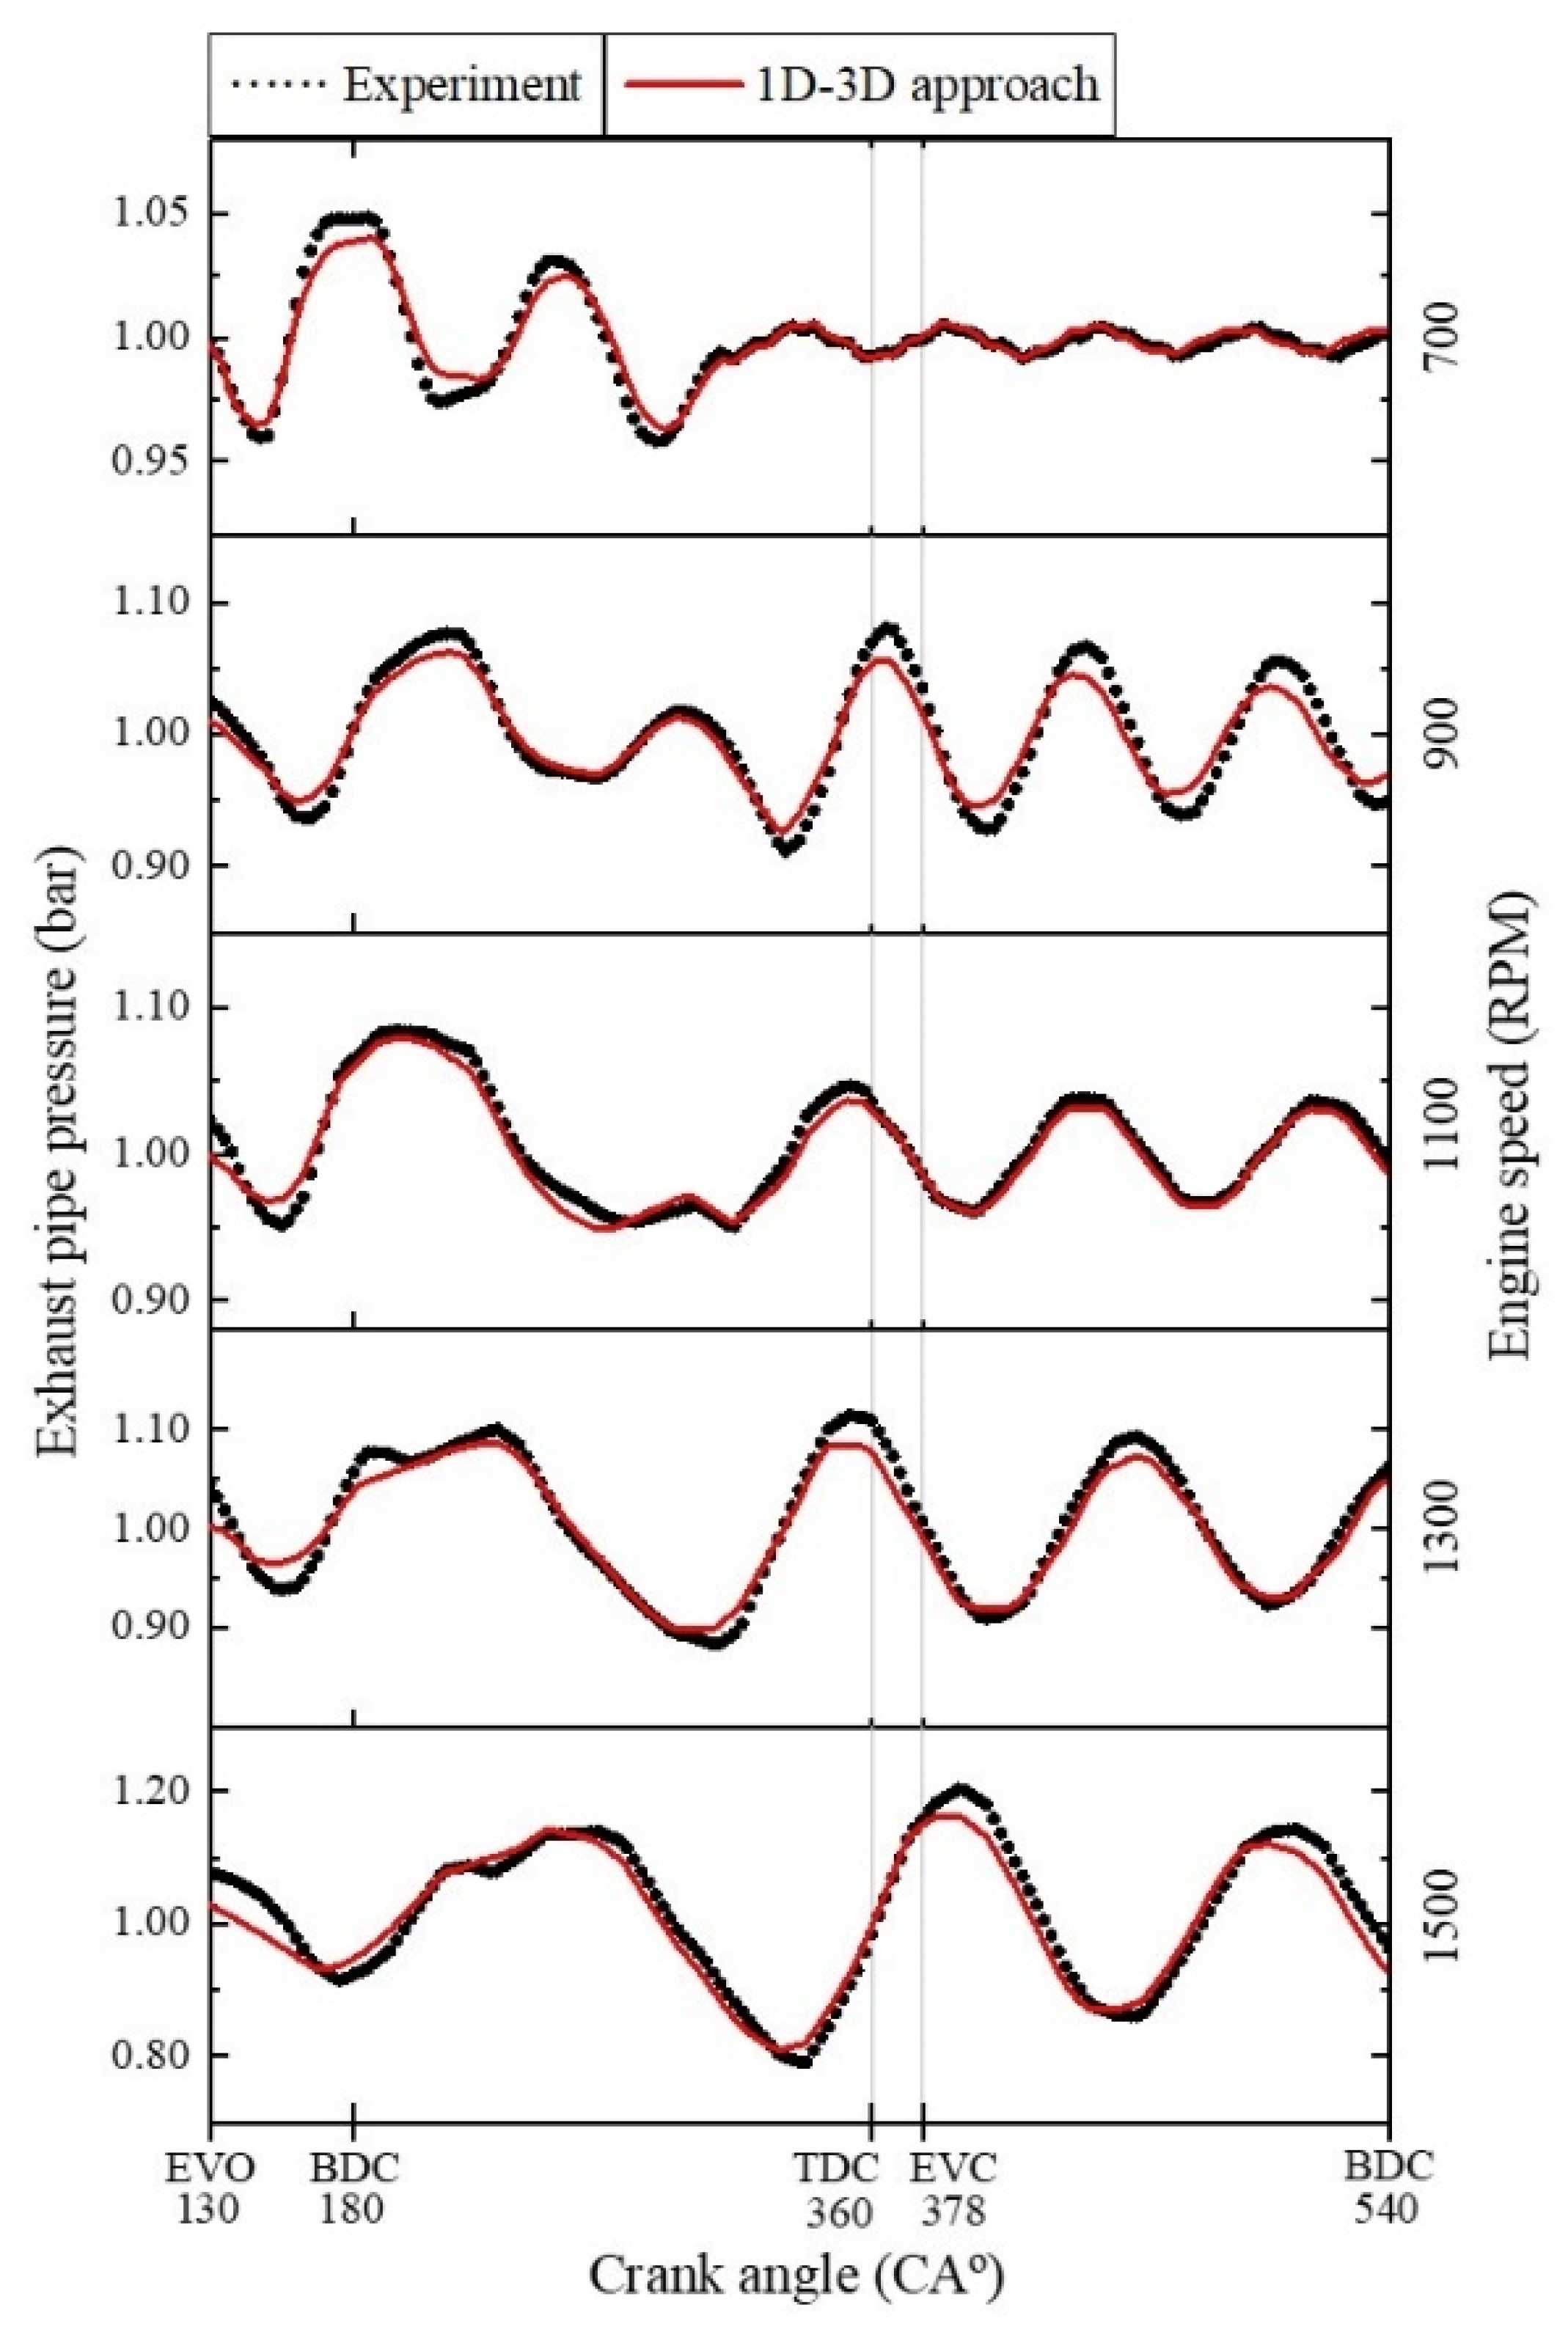
3.1. Validation
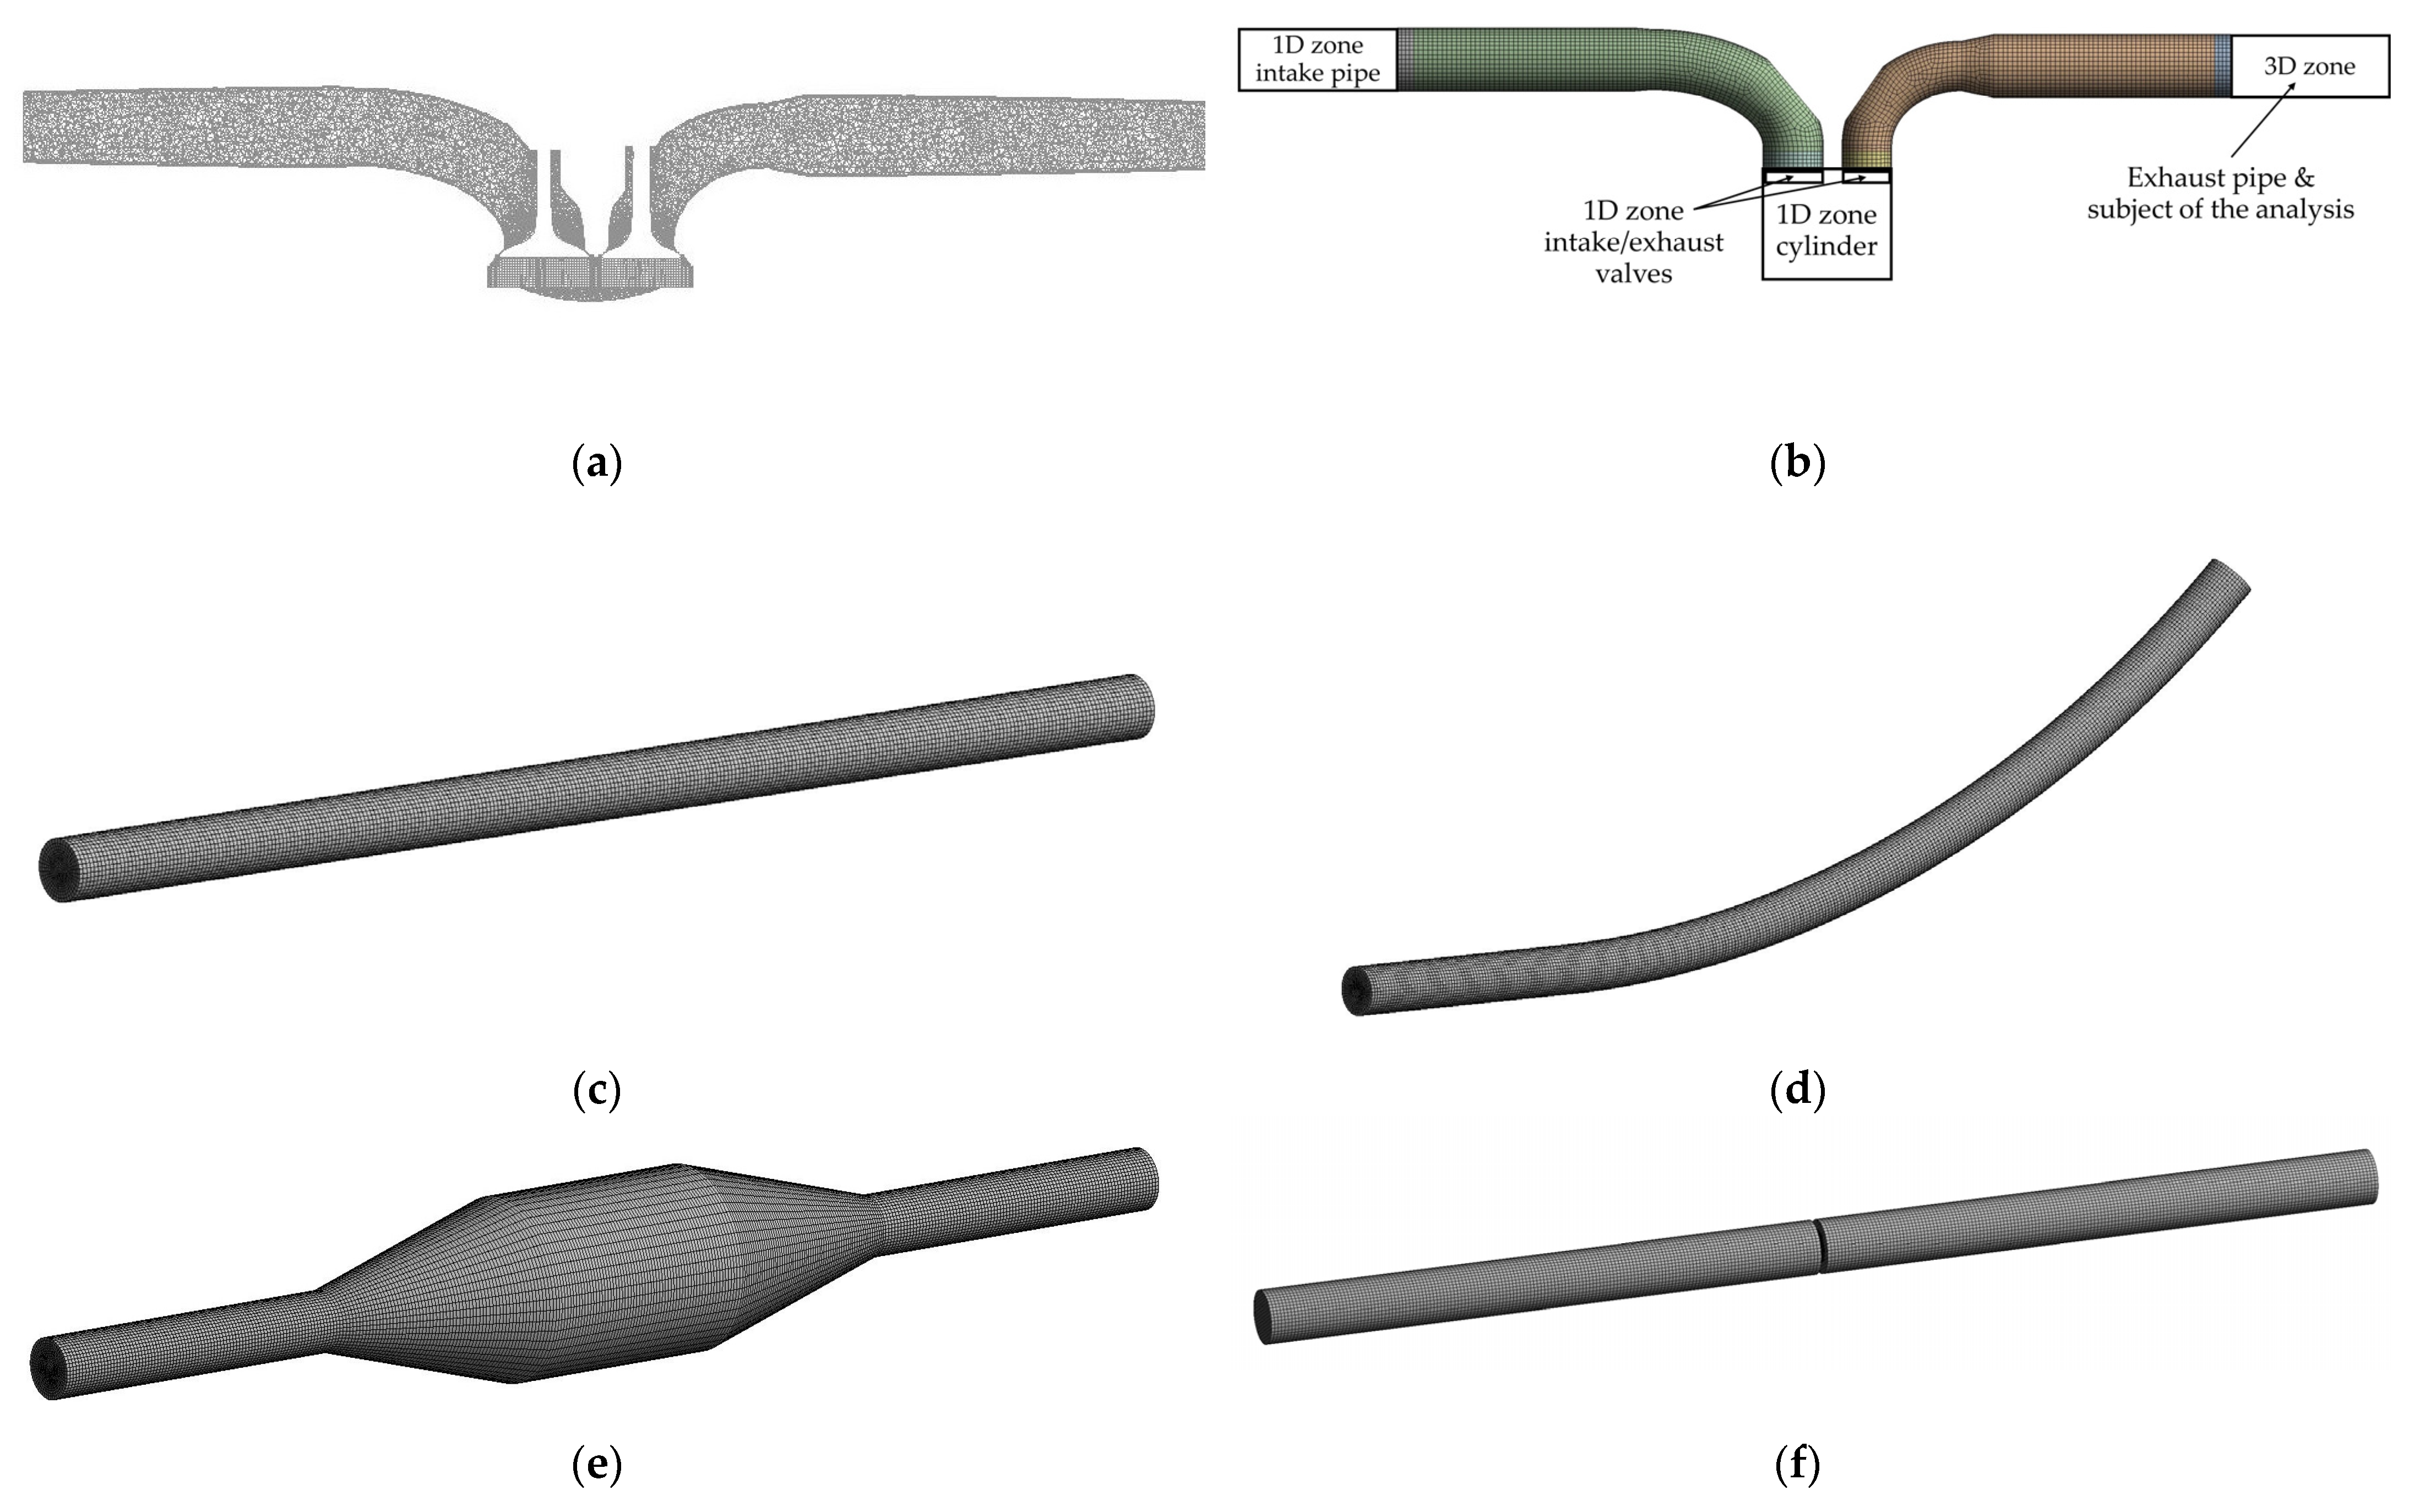
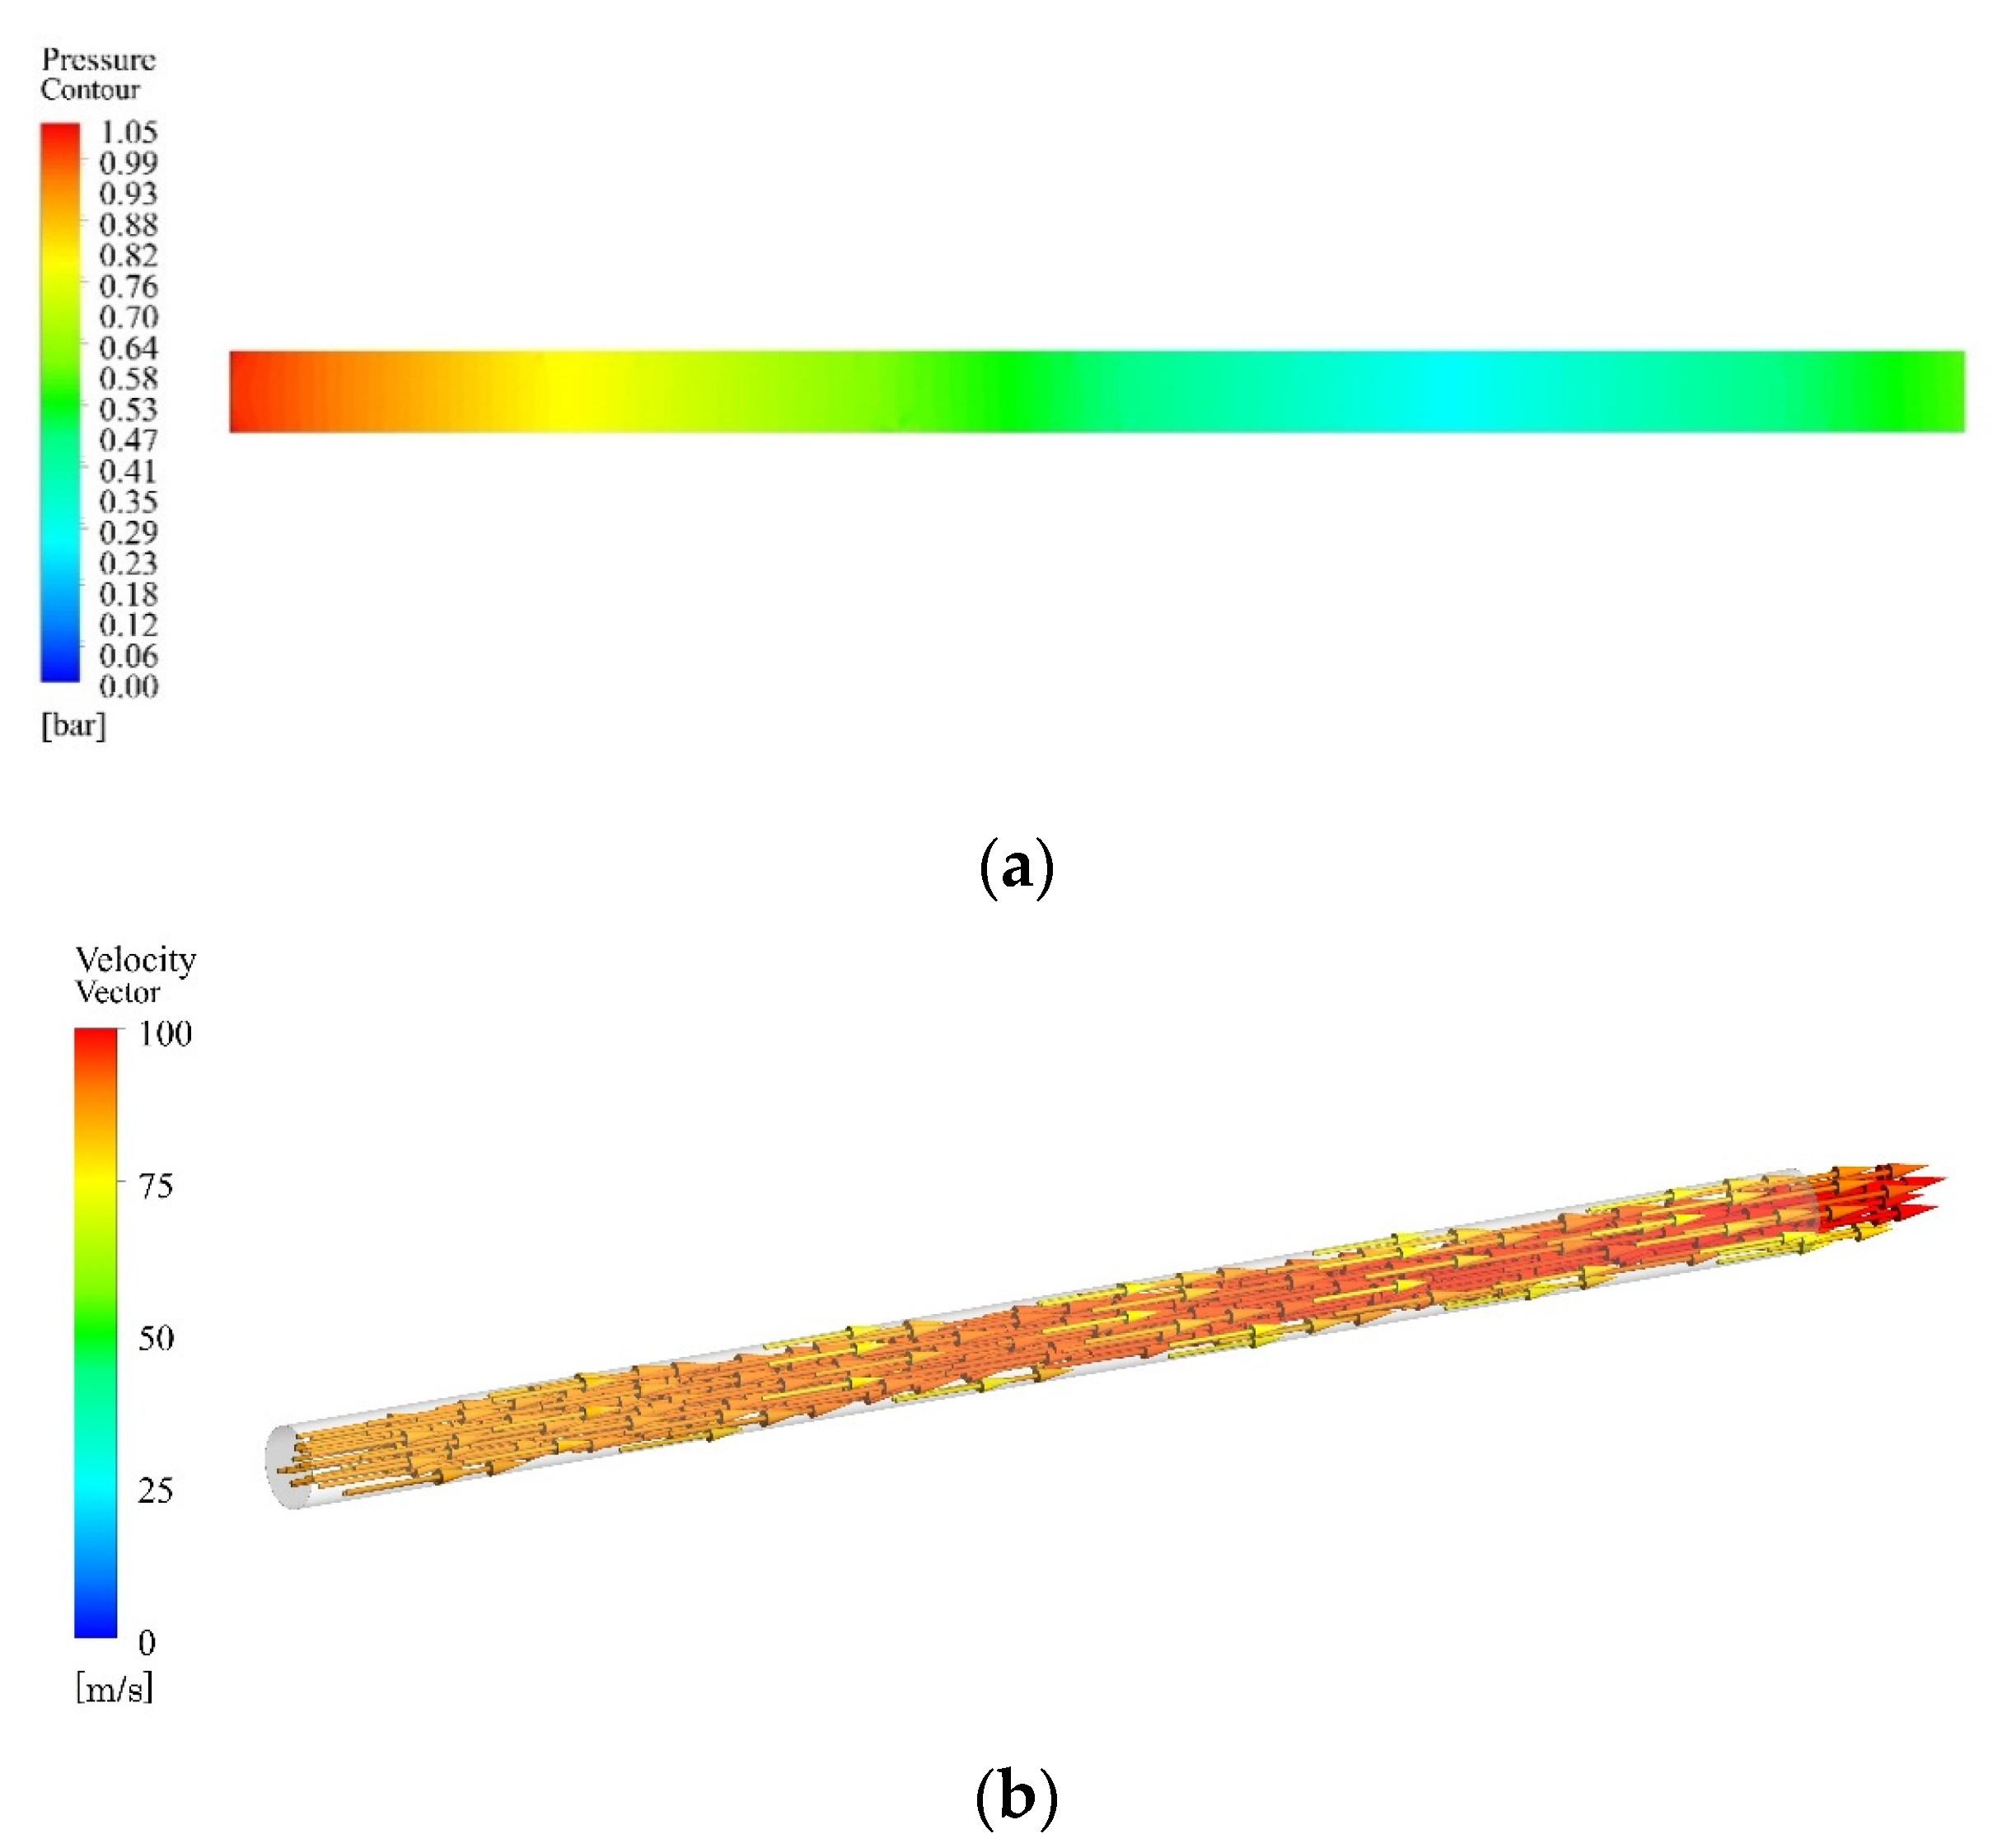
3.2. Flow Characteristics According to the Shape Change of the Exhaust System
3.3. Computation Time
4. Conclusions
- (1)
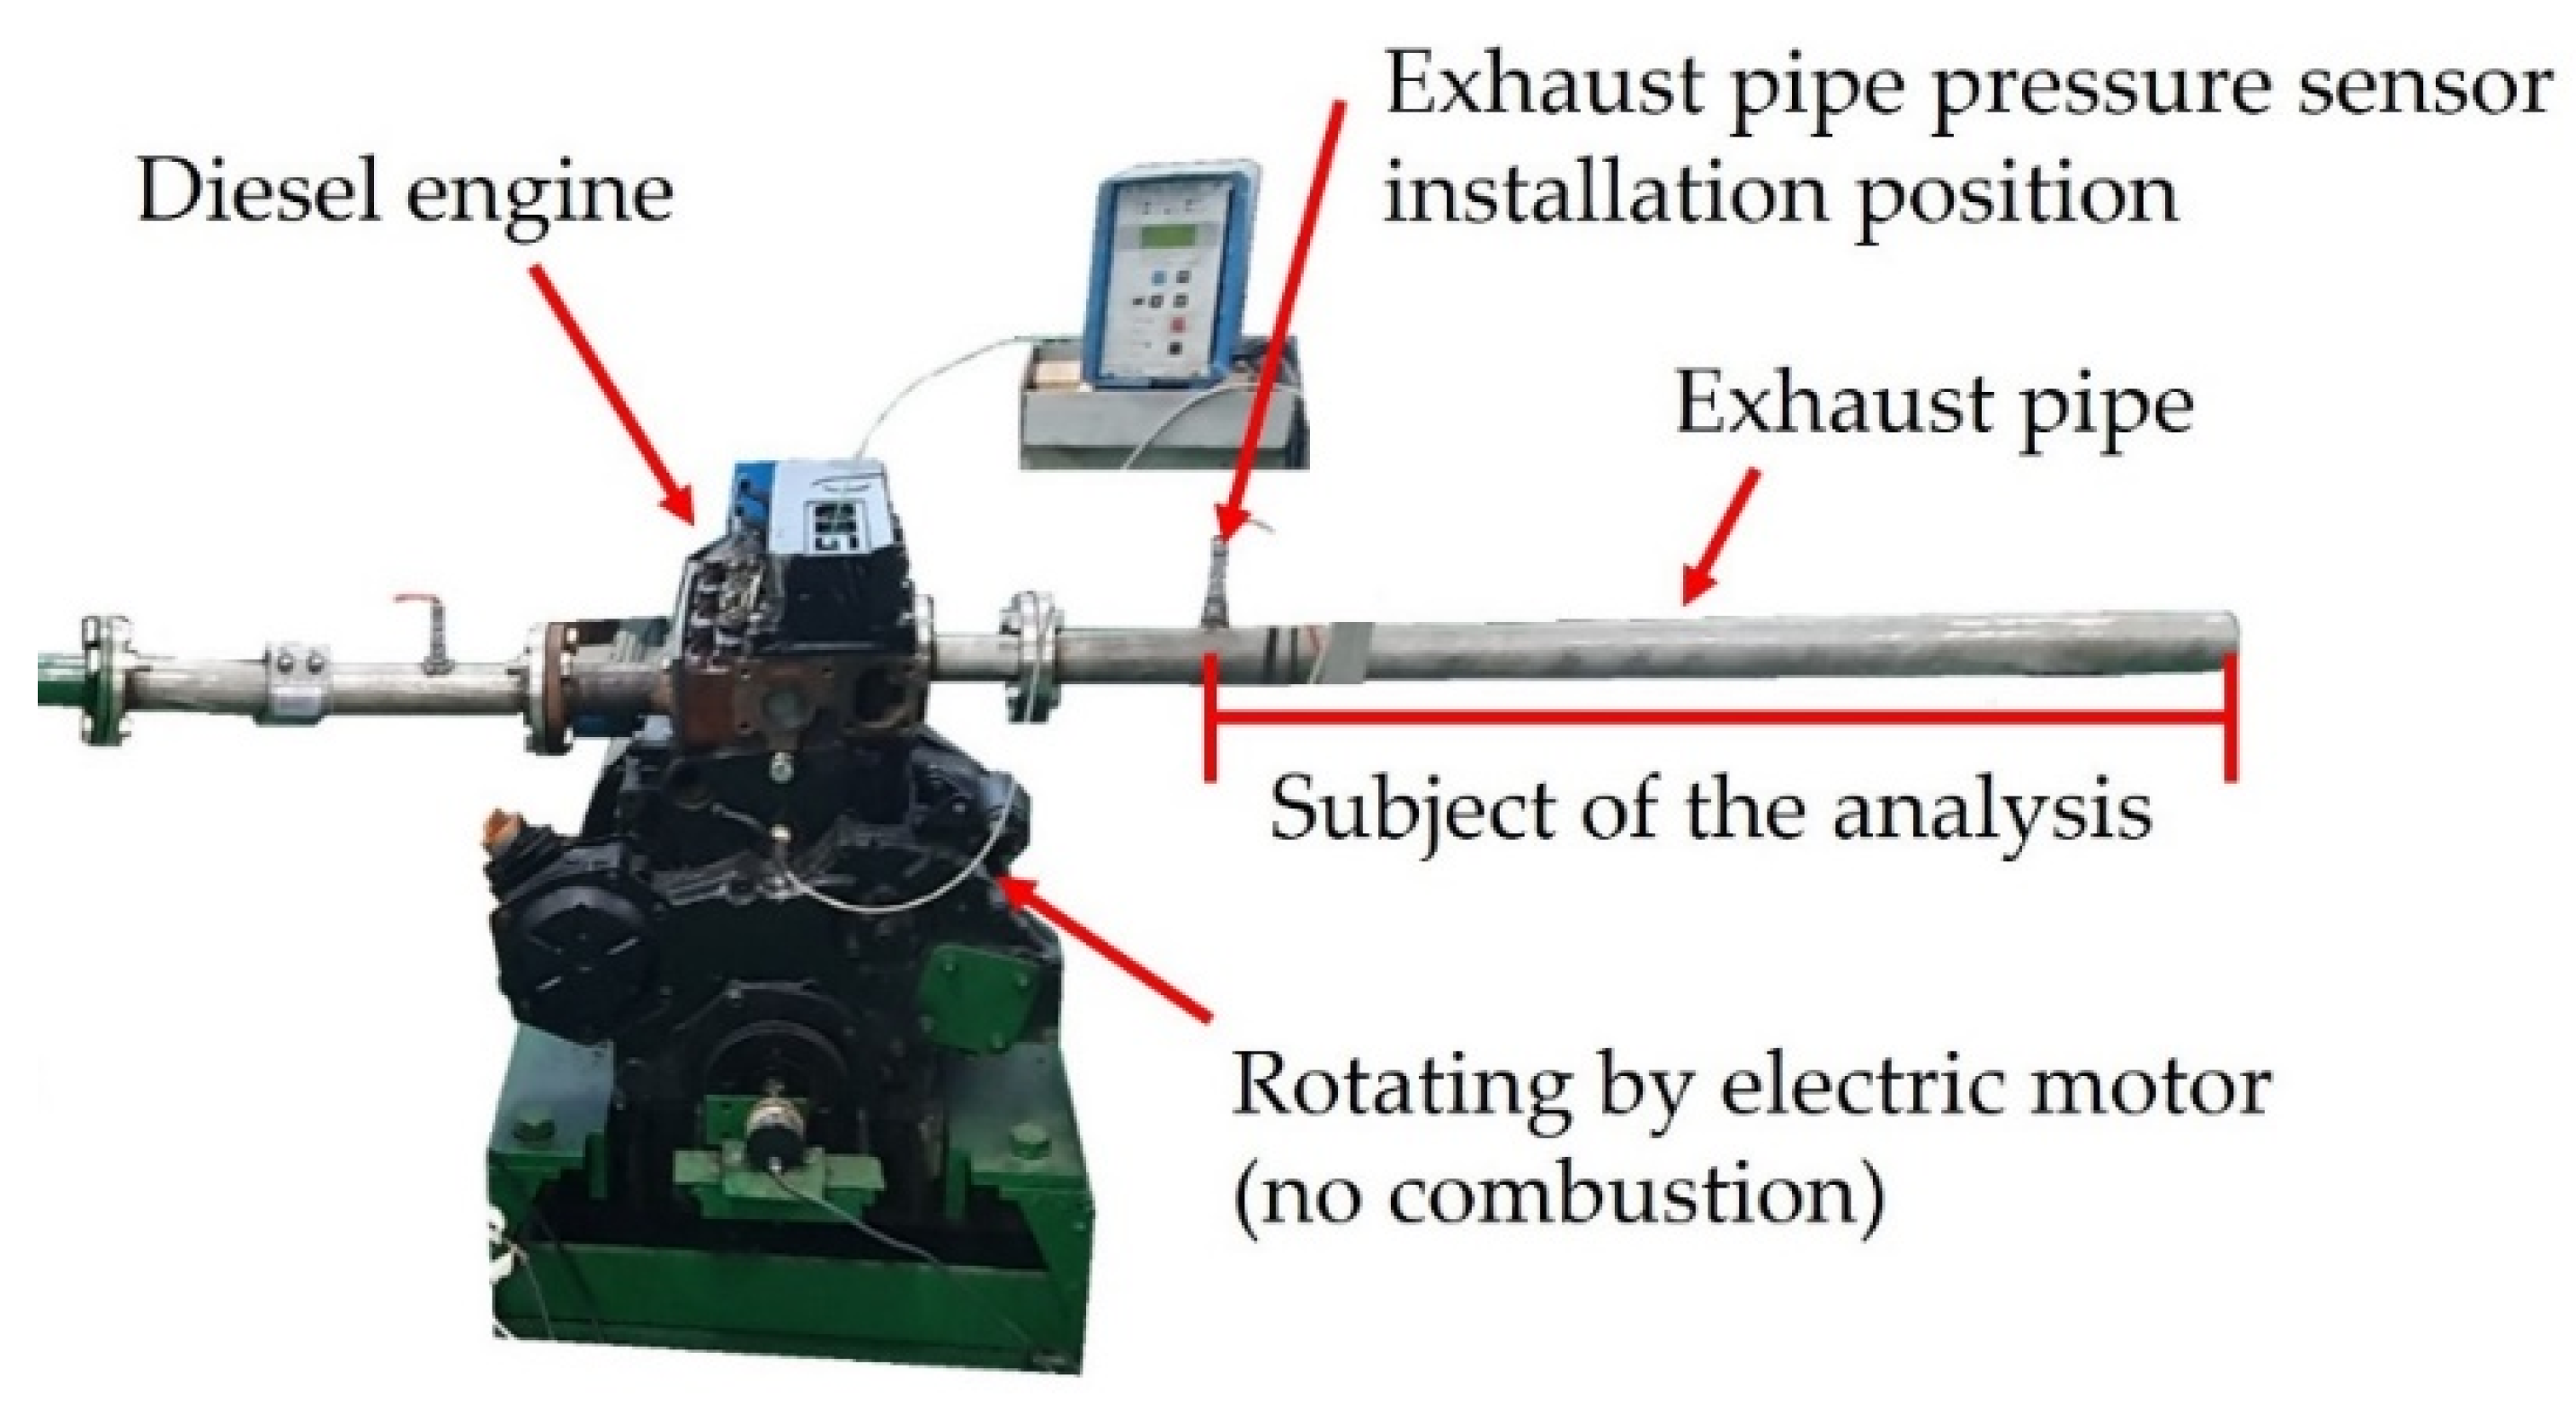
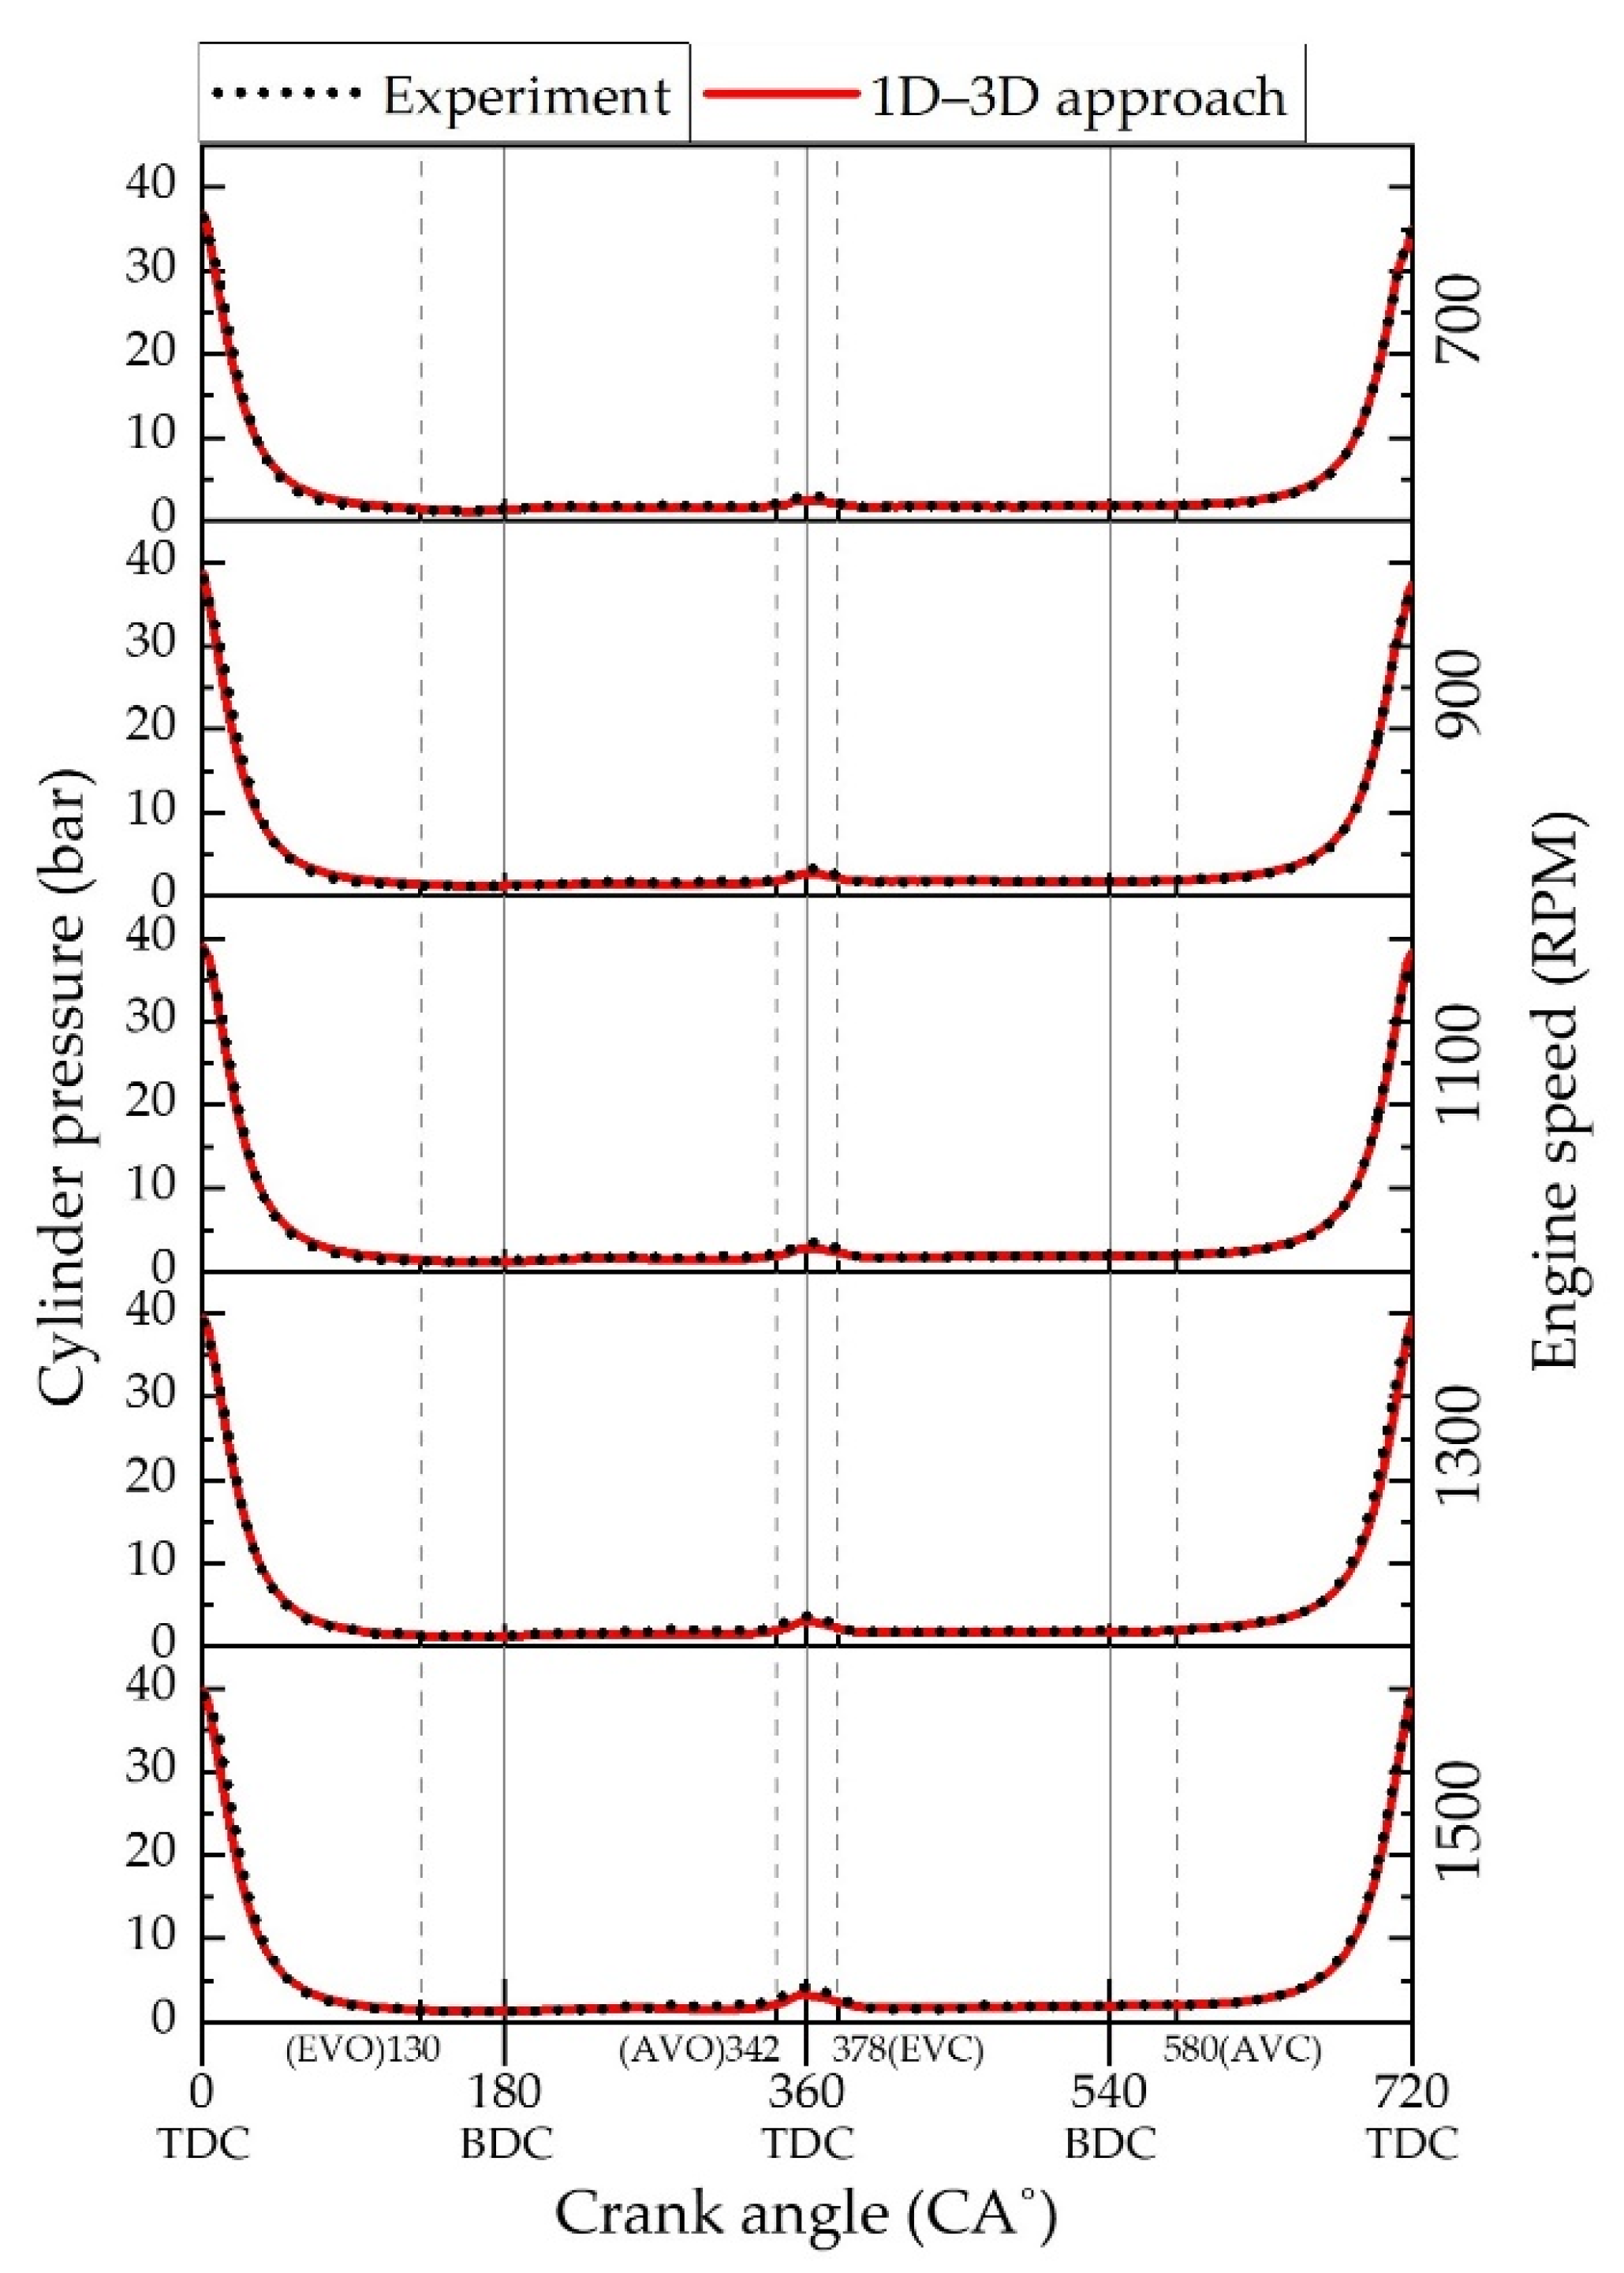
- To validate the results of the numerical analysis using the 1D–3D approach, the pressures of the cylinder and exhaust pipe measured in the experiment were compared. The error of the cylinder pressure was less than 1.8% and the average error of the exhaust pipe pressure was 2.8%, and accurate results were obtained.
- (2)
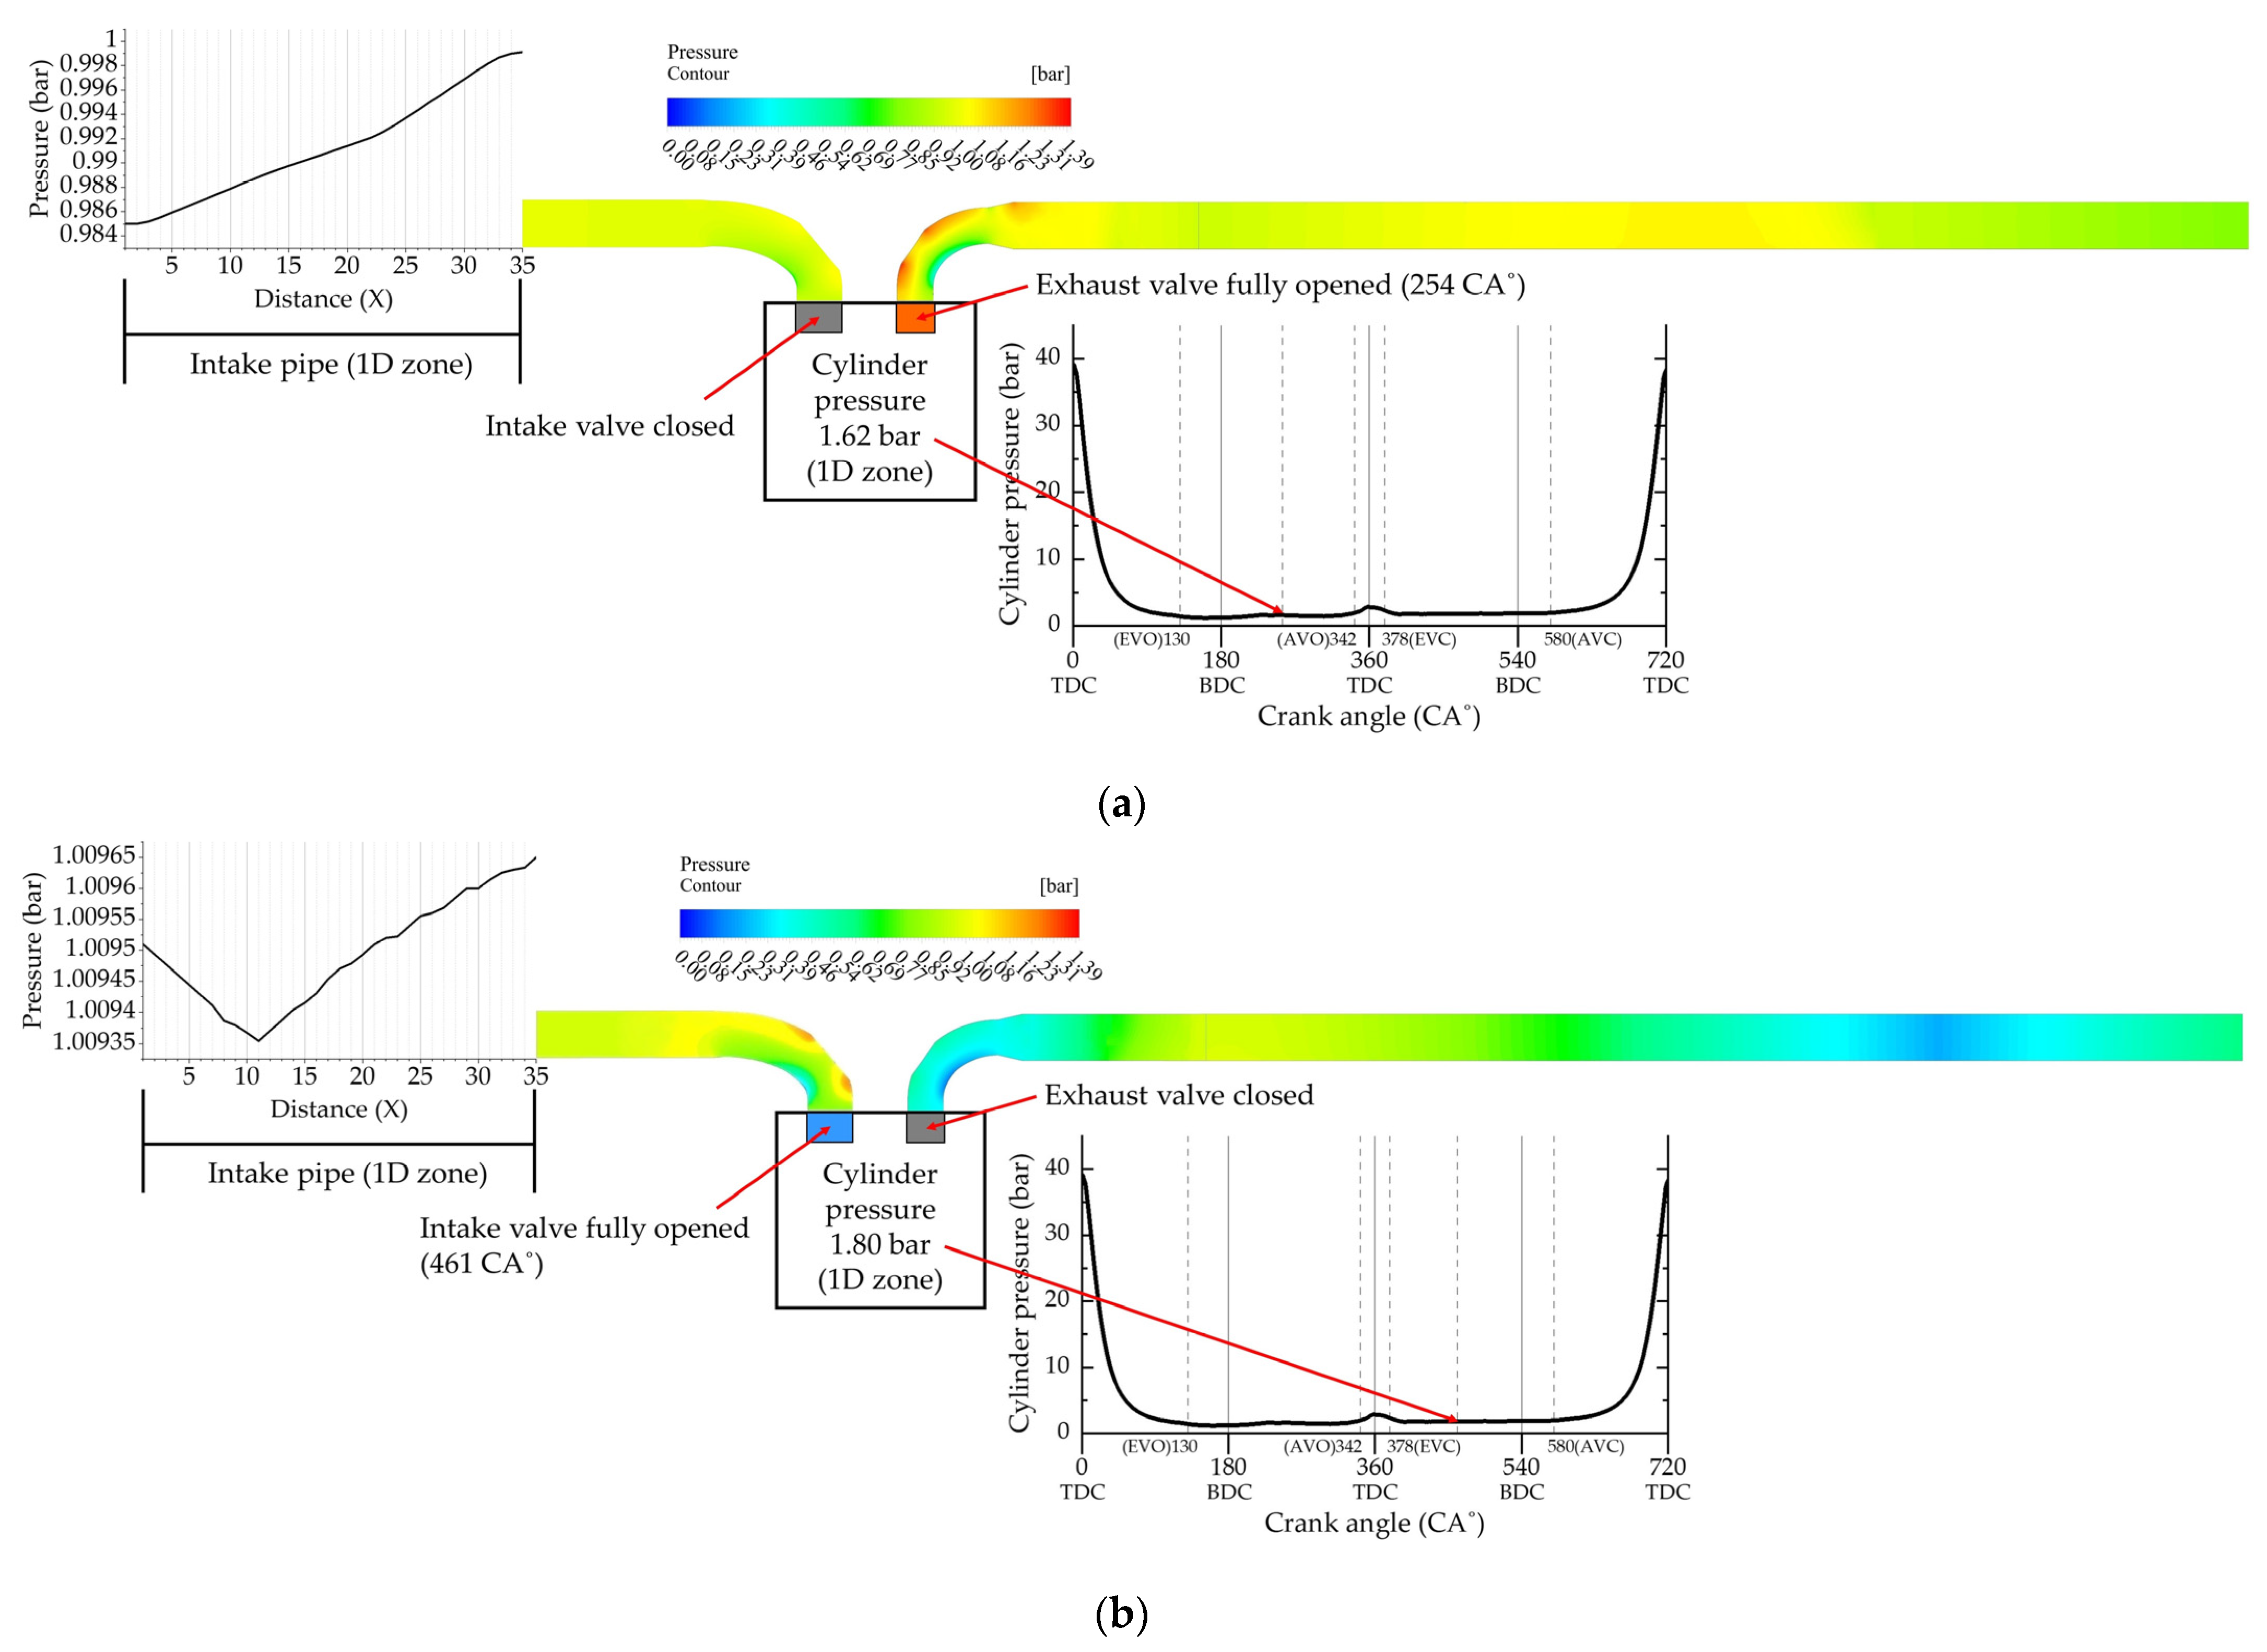
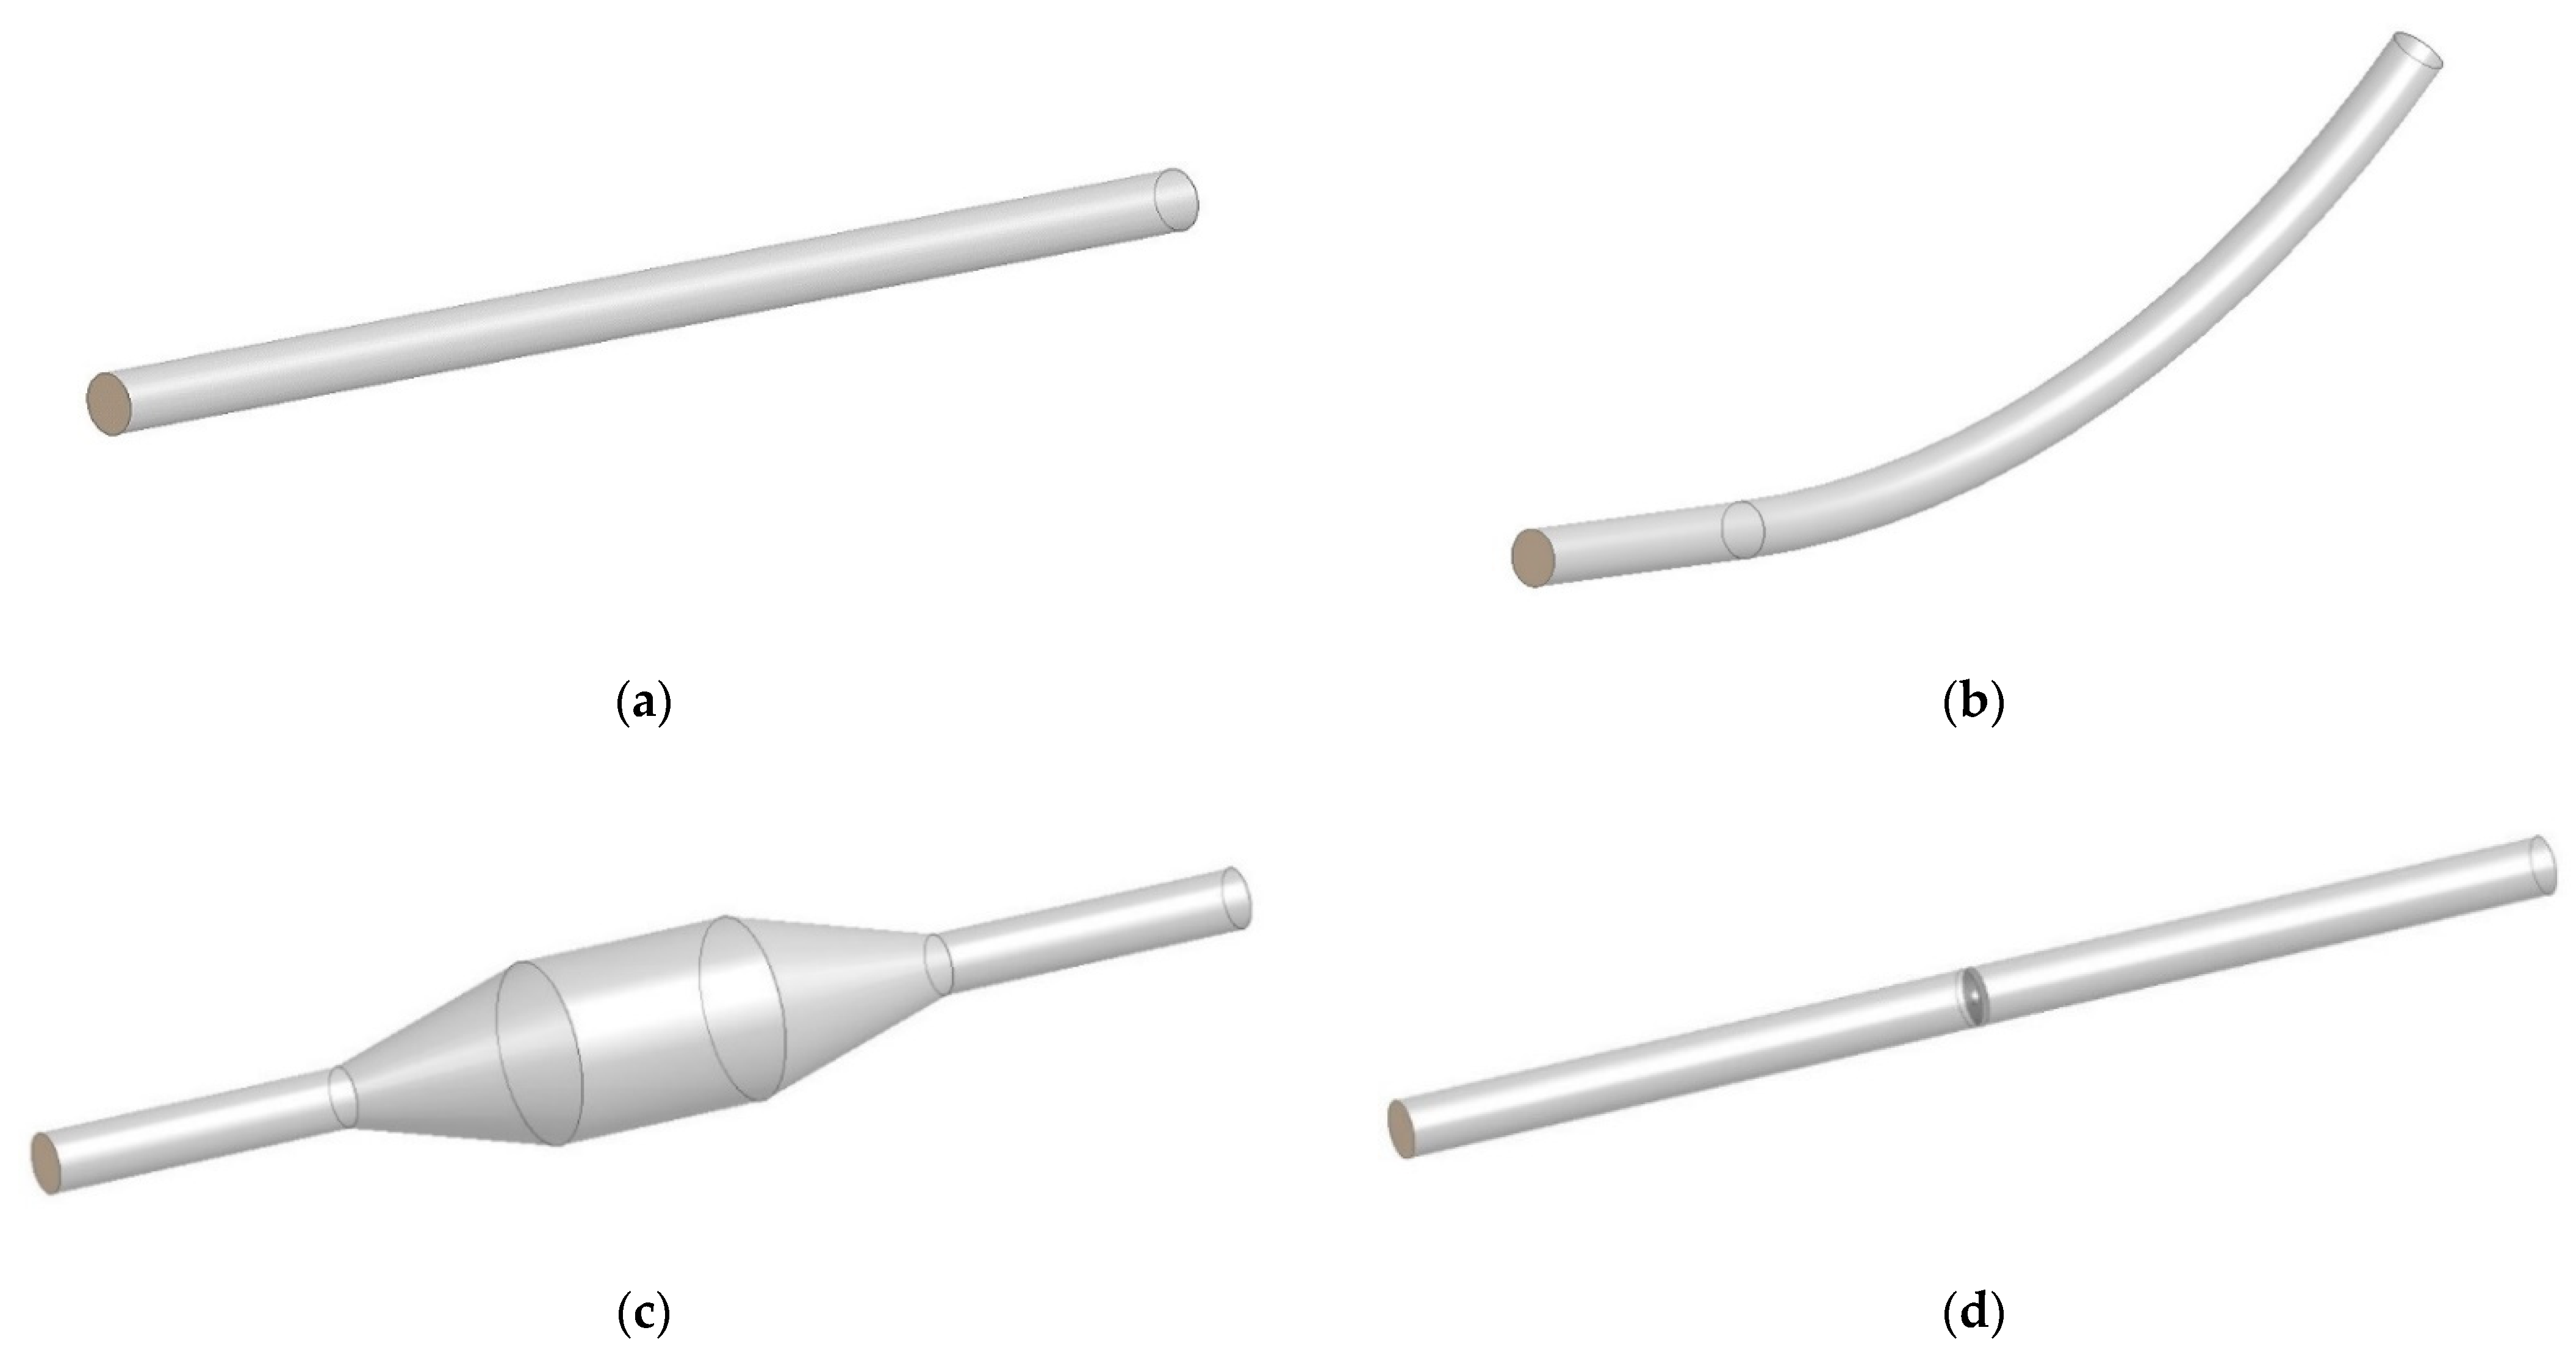
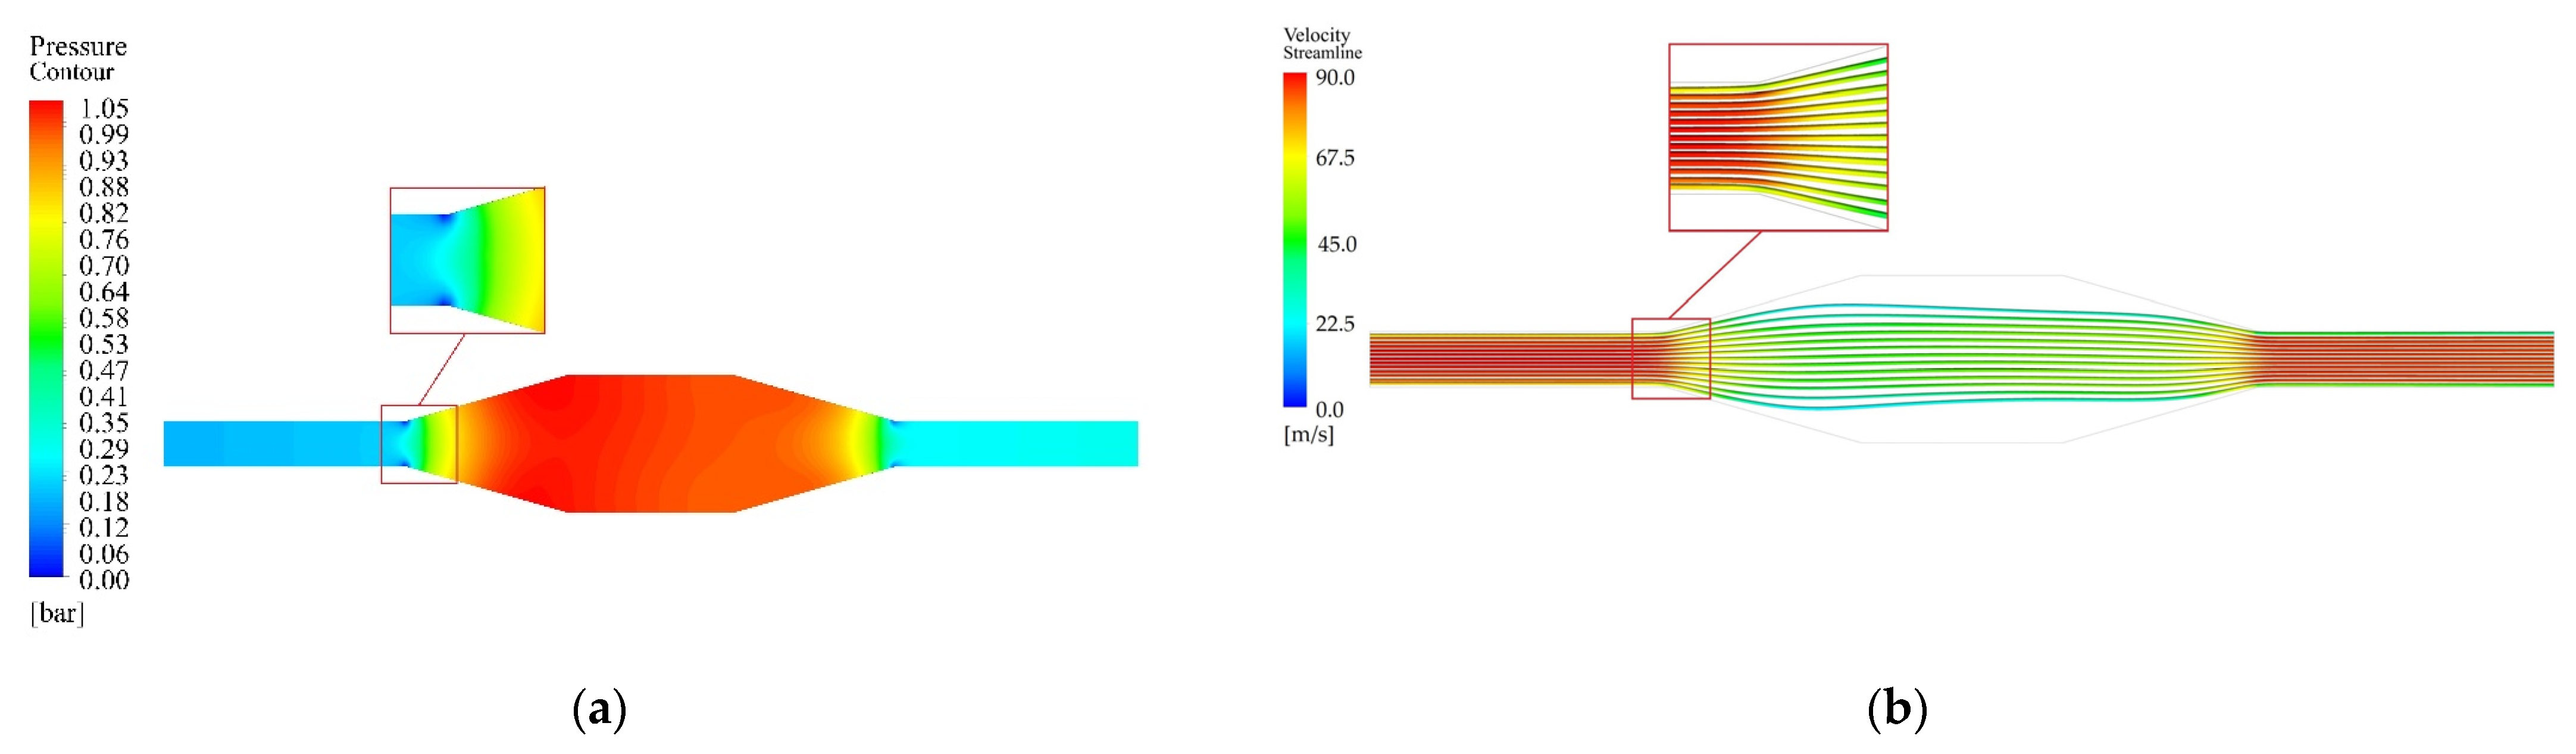
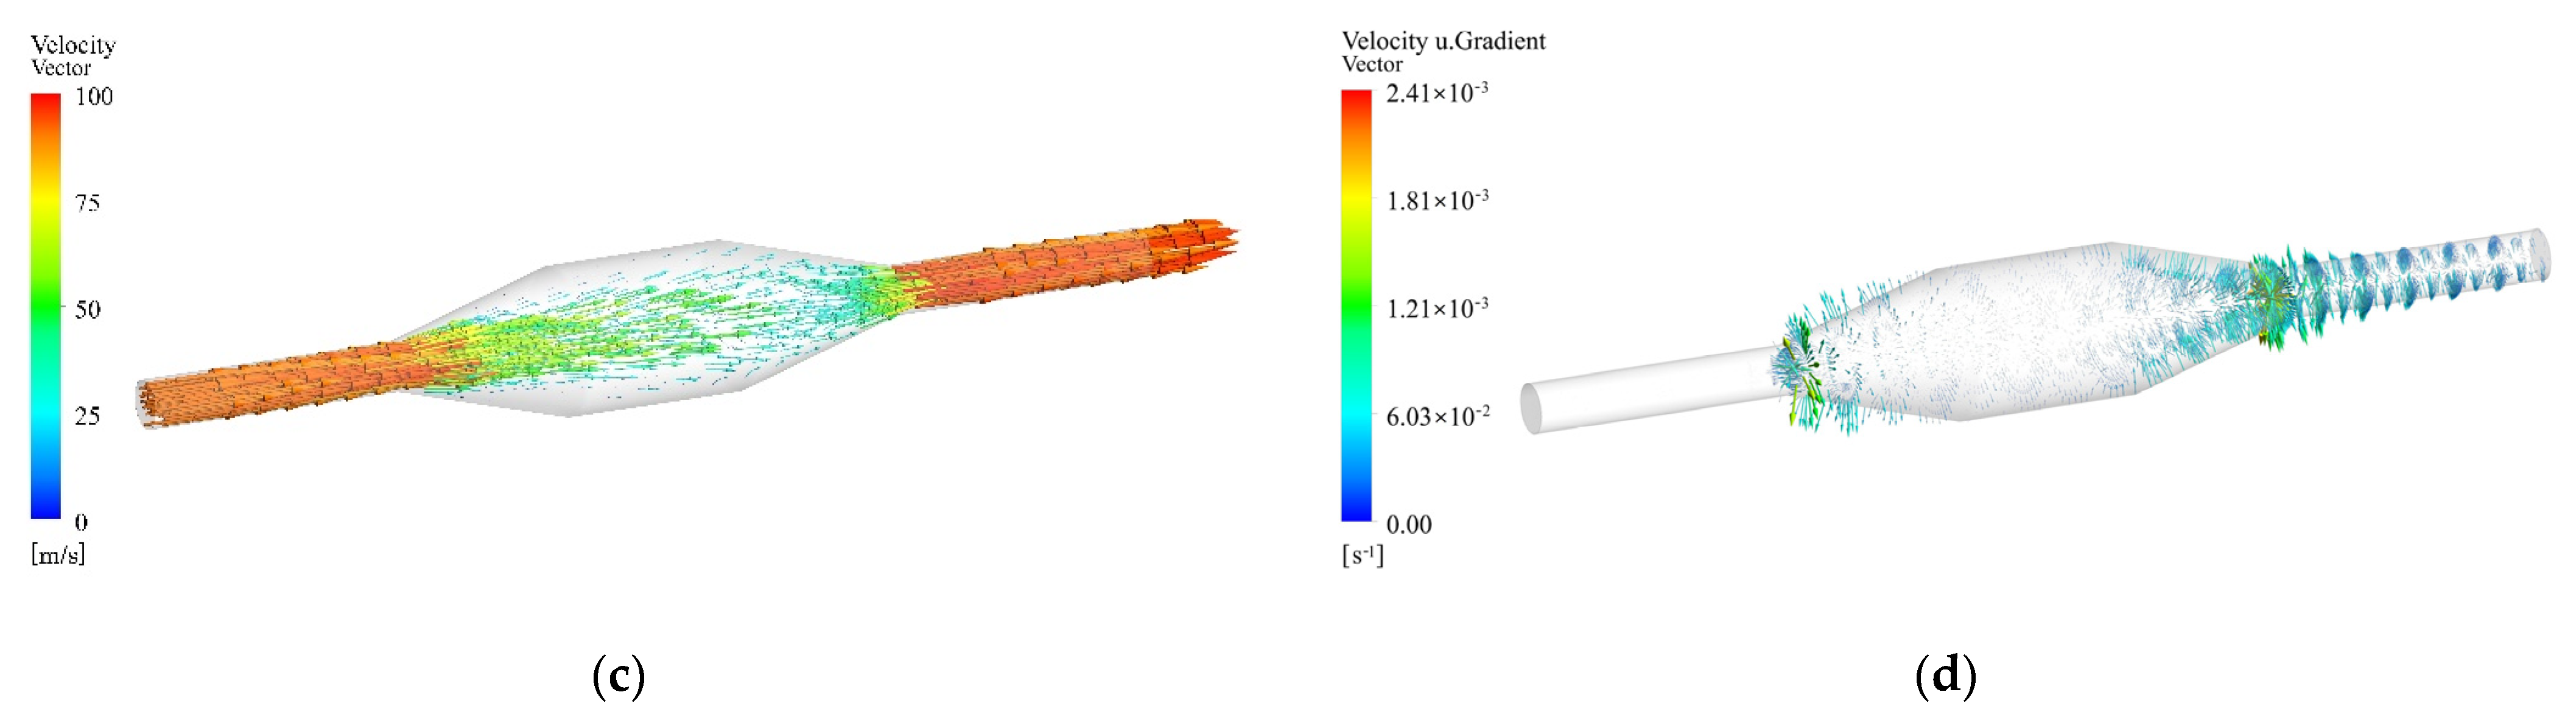
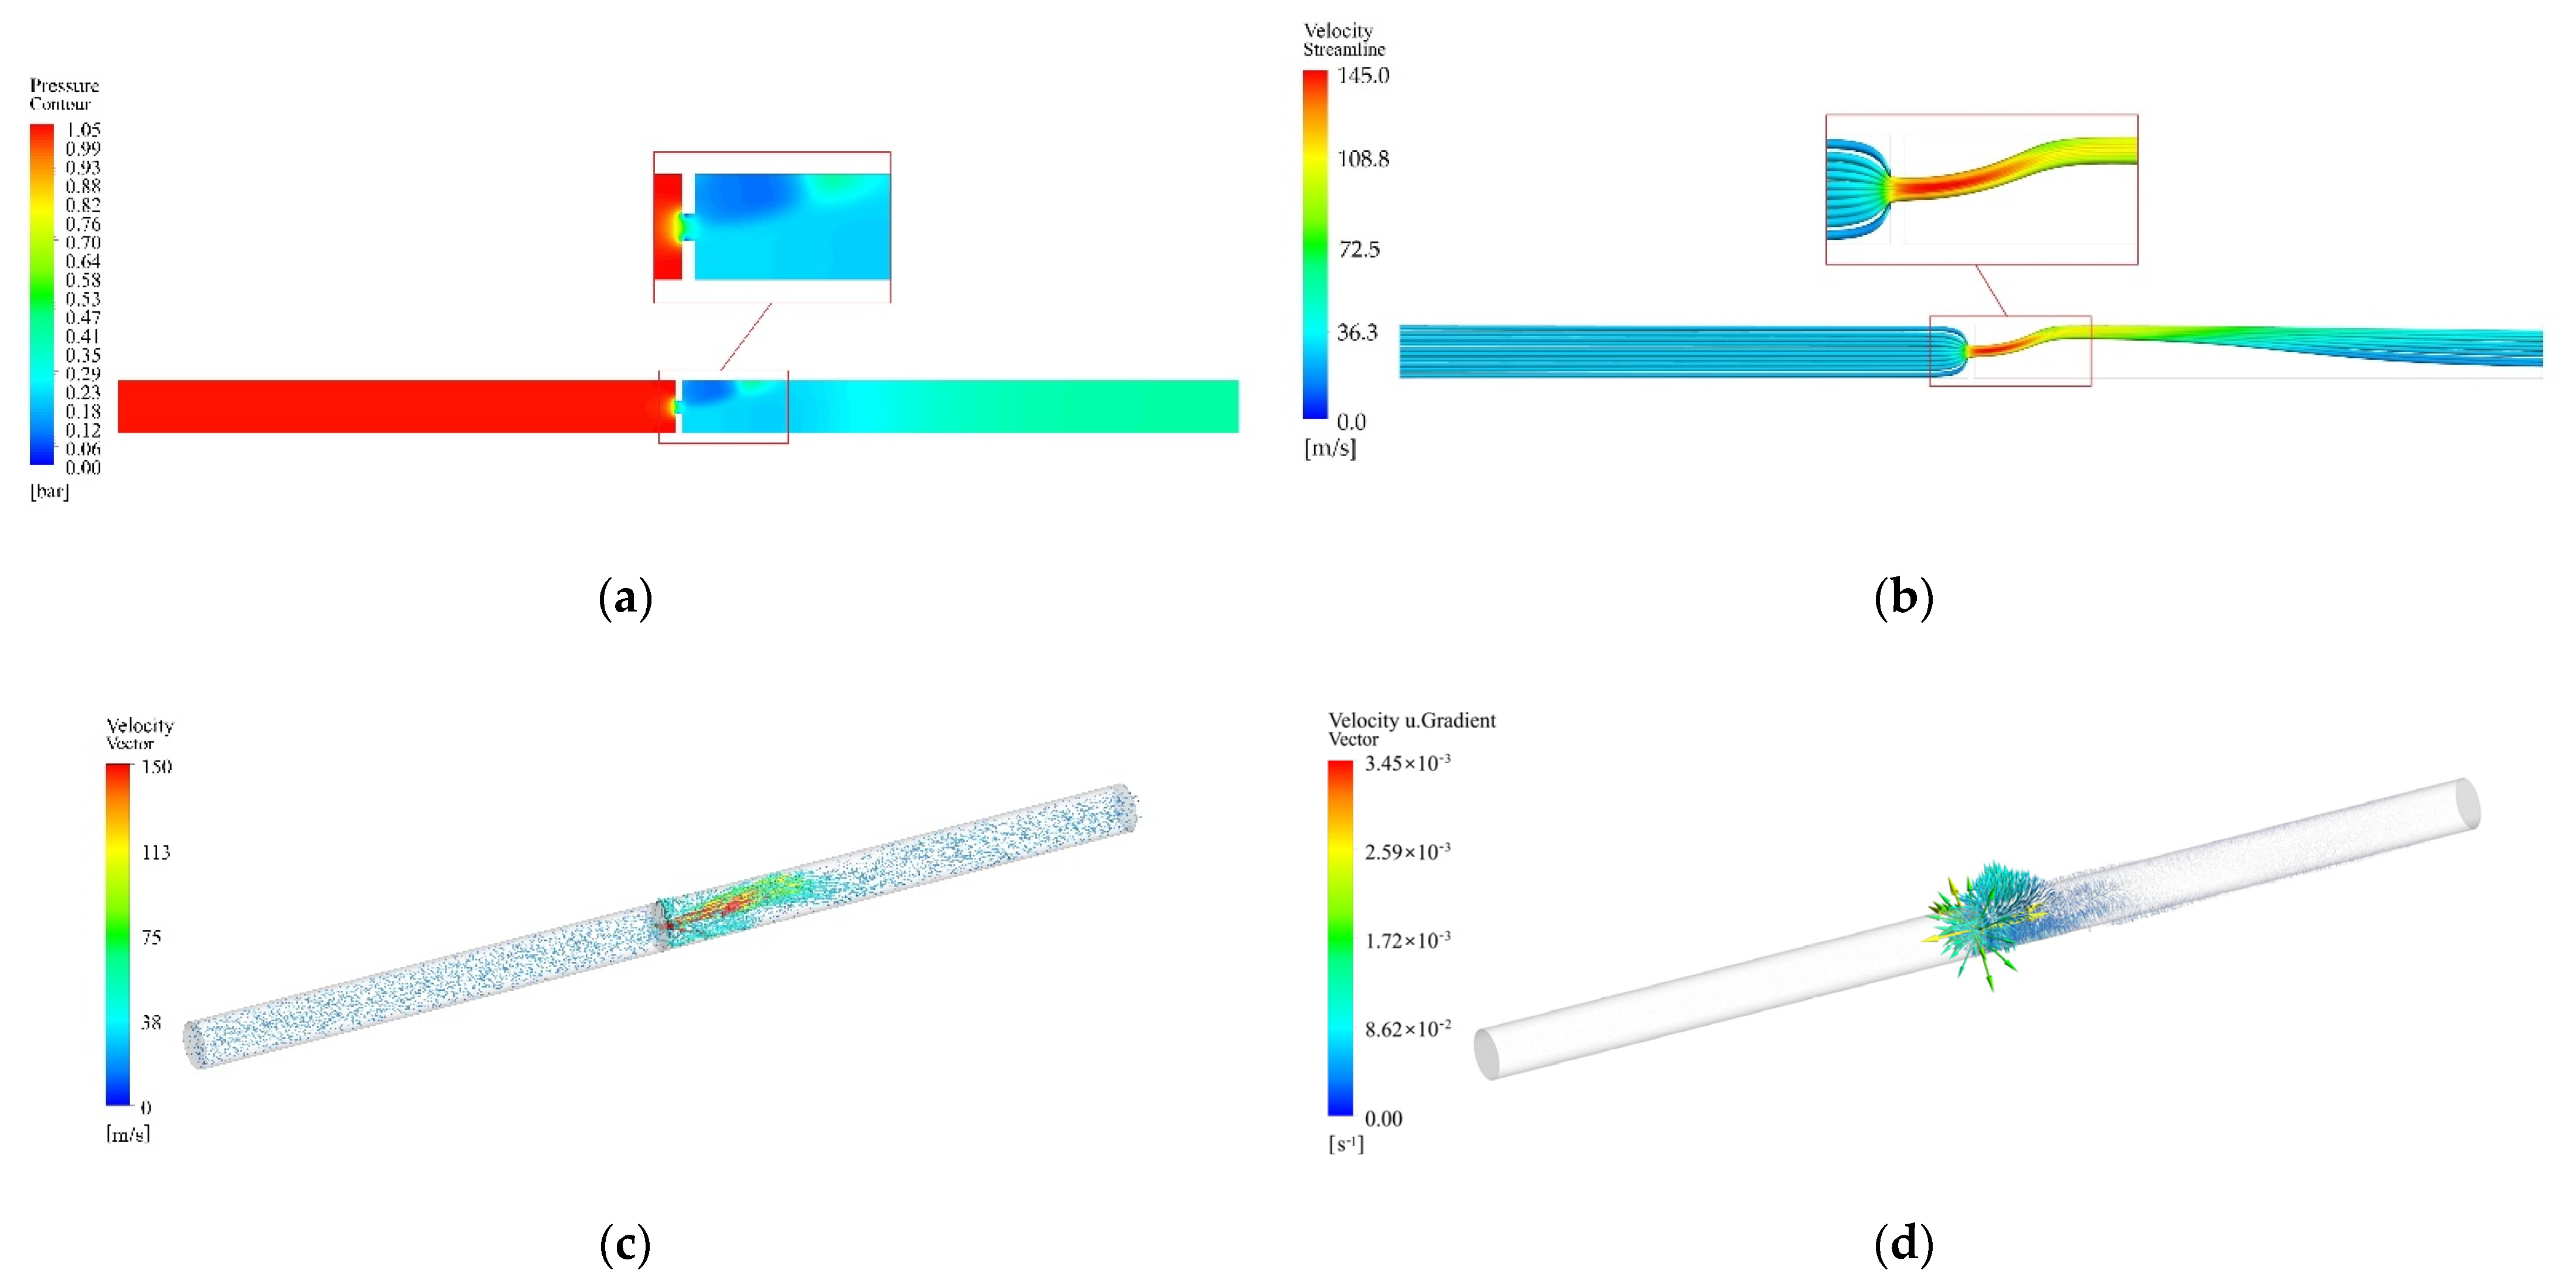
- The shape for analyzing the gas flow of the exhaust system to which an SCR and turbocharger were applied was modeled and numerically analyzed, and the flow characteristics could be confirmed through the pressure contour, streamline, and velocity results.
- (3)
- The 1D–3D approach was able to be computed about 300 times faster than the 3D approach. In addition, numerical analysis according to the shape change of the exhaust system could be quickly computed within 1 h using the 1D–3D approach.
Funding
Institutional Review Board Statement
Informed Consent Statement
Data Availability Statement
Conflicts of Interest
Appendix A
References
- International Maritime Organization (IMO). Guidelines Addressing Additional Aspects of the NOx Technical Code 2008 with Regard to Particular Requirements Related to Marine Diesel Engines Fitted with Selective Catalytic Reduction (SCR) Systems. In Marpol Annex 13 Resolution; MEPC: London, UK, 2017; Volume 291, p. 71. [Google Scholar]
- Guidance on the Application of Regulation 13 of MARPOL Annex VI Tier III Requirements to Dual Fuel and Gas-Fuelled Engines. Available online: https://wwwcdn.imo.org/localresources/en/OurWork/Environment/Documents/MEPC%201-Circ%20854.pdf (accessed on 15 September 2021).
- Mehdi, G.; Zhou, S.; Zhu, Y.; Shah, A.; Chand, K. Numerical Investigation of SCR Mixer Design Optimization for Improved Performance. Processes 2019, 7, 168. [Google Scholar] [CrossRef] [Green Version]
- Zeng, H.; Yuan, J.; Wang, J. Optimal Design of a Tower Type SCR-DeNOx Facility for a 1000 MW Coal-Fired Power Plant Based on CFD Simulation and FMT Validation. Appl. Sci. 2019, 9, 1012. [Google Scholar] [CrossRef] [Green Version]
- 2019 Guidelines for Port State Control under MARPOL Annex VI Chapter 3. Available online: https://wwwcdn.imo.org/localresources/en/OurWork/Environment/Documents/MEPC.321(74).pdf (accessed on 15 September 2021).
- Lebedevas, S.; Norkevičius, L.; Zhou, P. Investigation of Effect on Environmental Performance of Using LNG as Fuel for Engines in Seaport Tugboats. JMSE 2021, 9, 123. [Google Scholar] [CrossRef]
- Kornfeld, M.; Lindner-Silwester, T.; Hummel, E.; Streibl, B. Numerical Modelling of Explosion Protection. MTZ Ind. 2014, 4, 30–37. [Google Scholar] [CrossRef]
- Liu, R.; Zhang, Z.; Dong, S.; Zhou, G. High-Altitude Matching Characteristic of Regulated Two-Stage Turbocharger with Diesel Engine. J. Eng. Gas Turbines Power 2017, 139, 094501. [Google Scholar] [CrossRef]
- Kozak, D.; Mazuro, P.; Teodorczyk, A. Numerical Simulation of Two-Stage Variable Geometry Turbine. Energies 2021, 14, 5349. [Google Scholar] [CrossRef]
- Meloni, R. Pollutant Emission Validation of a Heavy-Duty Gas Turbine Burner by CFD Modeling. Machines 2013, 1, 81–97. [Google Scholar] [CrossRef] [Green Version]
- Cruz-Manzo, S.; Krishnababu, S.; Panov, V.; Bingham, C. Inter-Stage Dynamic Performance of an Axial Compressor of a Twin-Shaft Industrial Gas Turbine. Machines 2020, 8, 83. [Google Scholar] [CrossRef]
- De Robbio, R.; Cameretti, M.C.; Mancaruso, E.; Tuccillo, R.; Vaglieco, B.M. CFD Study and Experimental Validation of a Dual Fuel Engine: Effect of Engine Speed. Energies 2021, 14, 4307. [Google Scholar] [CrossRef]
- Benson, R.S.; Horlock, J.H.; Winterbone, D.E. The Thermodynamics and Gas Dynamics of Internal-Combustion Engines; Oxford University Press: Oxford, UK, 1982; Volume 1. [Google Scholar]
- Kim, K.-H.; Kong, K.-J. One-Dimensional Gas Flow Analysis of the Intake and Exhaust System of a Single Cylinder Diesel Engine. JMSE 2020, 8, 1036. [Google Scholar] [CrossRef]
- He, S.; Du, B.-G.; Feng, L.-Y.; Fu, Y.; Cui, J.-C.; Long, W.-Q. A Numerical Study on Combustion and Emission Characteristics of a Medium-Speed Diesel Engine Using In-Cylinder Cleaning Technologies. Energies 2015, 8, 4118–4137. [Google Scholar] [CrossRef] [Green Version]
- Millo, F.; Piano, A.; Peiretti Paradisi, B.; Marzano, M.R.; Bianco, A.; Pesce, F.C. Development and Assessment of an Integrated 1D–3D CFD Codes Coupling Methodology for Diesel Engine Combustion Simulation and Optimization. Energies 2020, 13, 1612. [Google Scholar] [CrossRef] [Green Version]
- Kim, K.-H.; Kong, K.-J. 1D–3D Coupling for Gas Flow Analysis of the Air-Intake System in a Compression Ignition Engine. JMSE 2021, 9, 553. [Google Scholar] [CrossRef]
- Kong, K.-J.; Jung, S.-H.; Jeong, T.-Y.; Koh, D.-K. 1D–3D Coupling Algorithm for Unsteady Gas Flow Analysis in Pipe Systems. J. Mech. Sci. Technol. 2019, 33, 4521–4528. [Google Scholar] [CrossRef]
- Kong, K.-J.; Jung, S.-H.; Lee, S.-D.; Koh, D.-K. A numerical analysis of the delivery pressure wave in a 210-kW/cyl fuel injection pump for medium-speed diesel engines. J. Korean Soc. Mar. Eng. 2016, 40, 295–300. [Google Scholar] [CrossRef]
- Zhao, C.; Lou, D.; Zhang, Y.; Lu, K.; Liu, S. Application Study on a New Hybrid Canning Structure of After-Treatment System for Diesel Engine. Energies 2020, 13, 734. [Google Scholar] [CrossRef] [Green Version]
- Zhao, B.; Zhao, Q.; Zhao, W.; Xiang, X.; Zhou, X. Numerical and Experimental Investigation of Turbocharger Compressor Low-end Performance Improvement Using a Variable Geometry Inlet Orifice. Int. J. Engine Res. 2020, 22, 146808742095109. [Google Scholar] [CrossRef]
- Cordiner, S.; Gambino, M.; Iannaccone, S.; Rocco, V.; Scarcelli, R. Numerical and Experimental Analysis of Combustion and Exhaust Emissions in a Dual-Fuel Diesel/Natural Gas Engine. Energy Fuels 2008, 22, 1418–1424. [Google Scholar] [CrossRef]
- Heisler, H. Advanced Engine Technology; Butterworth-Heinemann: Oxford, UK, 1995; pp. 274–275. [Google Scholar]
- Adams, T.-G. Effect of Exhaust System Design on Engine Performance; SAE Technical Paper 800319; SAE: Warrendale, PA, USA, 1980. [Google Scholar] [CrossRef]
- Liu, S.; Xu, J.; Gong, H.; Yu, K. Assessment of Streamline-Based Pressure Reconstruction for PIV Data in Supersonic Flows with Shock Waves. Exp Fluids 2020, 61, 161. [Google Scholar] [CrossRef]
- Martins, N.M.C.; Carriço, N.J.G.; Ramos, H.M.; Covas, D.I.C. Velocity-Distribution in Pressurized Pipe Flow Using CFD: Accuracy and Mesh Analysis. Comput. Fluids 2014, 105, 218–230. [Google Scholar] [CrossRef]
- Gao, Y.; Liu, Q.; Bian, L. Numerical Simulation and Optimization of Flow Field in the SCR Denitrification System on a 600 MW Capacity Units. Energy Procedia 2012, 14, 370–375. [Google Scholar] [CrossRef] [Green Version]
- Shingne, P.; Assanis, D.-N.; Babajimopoulos, A.; Keller, P.; Roth, D.; Becker, M. Turbocharger Matching for a 4-Cylinder Gasoline HCCI Engine Using a 1D Engine Simulation; SAE Technical Paper 2010-01-2143; SAE: Warrendale, PA, USA, 2010. [Google Scholar] [CrossRef]


| Gas Velocity | Time Step Size of the 3D Zone | Number of Time Steps in the 3D/One Time Step in the 1D |
|---|---|---|
| 0.0060554 msec | 4 | |
| 0.0012512 msec | 16 | |
| 0.0043253 msec | 5 |
| Engine Speed (RPM) | Maximum Cylinder Pressure (Bar) | Error (%) | |
|---|---|---|---|
| Experimental | 1D–3D Approach | ||
| 700 | 36.39 | 36.74 | 1.0 |
| 900 | 38.00 | 38.63 | 1.7 |
| 1100 | 38.35 | 39.04 | 1.8 |
| 1300 | 38.87 | 39.42 | 1.4 |
| 1500 | 39.16 | 39.78 | 1.6 |
| Approach | Shape of the Exhaust System | Number of Meshes | Computation Time | |
|---|---|---|---|---|
| 1D | 3D | |||
| 3D | Straight pipe | 0 | 1,144,077 | 6 days 8 h |
| 1D–3D | Straight pipe | 38 | 95,437 | 30 min |
| 1D–3D | Bent pipe | 38 | 103,465 | 33 min |
| 1D–3D | Tapered (SCR) | 38 | 162,181 | 55 min |
| 1D–3D | Orifice | 38 | 122,046 | 45 min |
Publisher’s Note: MDPI stays neutral with regard to jurisdictional claims in published maps and institutional affiliations. |
© 2021 by the author. Licensee MDPI, Basel, Switzerland. This article is an open access article distributed under the terms and conditions of the Creative Commons Attribution (CC BY) license (https://creativecommons.org/licenses/by/4.0/).
Share and Cite
Kong, K.-J. A 1D–3D Approach for Fast Numerical Analysis of the Flow Characteristics of a Diesel Engine Exhaust Gas. Machines 2021, 9, 239. https://doi.org/10.3390/machines9100239
Kong K-J. A 1D–3D Approach for Fast Numerical Analysis of the Flow Characteristics of a Diesel Engine Exhaust Gas. Machines. 2021; 9(10):239. https://doi.org/10.3390/machines9100239
Chicago/Turabian StyleKong, Kyeong-Ju. 2021. "A 1D–3D Approach for Fast Numerical Analysis of the Flow Characteristics of a Diesel Engine Exhaust Gas" Machines 9, no. 10: 239. https://doi.org/10.3390/machines9100239
APA StyleKong, K.-J. (2021). A 1D–3D Approach for Fast Numerical Analysis of the Flow Characteristics of a Diesel Engine Exhaust Gas. Machines, 9(10), 239. https://doi.org/10.3390/machines9100239