Surface Texture after Turning for Various Workpiece Rigidities


Department of Manufacturing and Production Engineering, Faculty of Mechanical Engineering, Gdansk University of Technology, 80-233 Gdańsk, Poland
*
Author to whom correspondence should be addressed.
Machines 2021, 9(1), 9; https://doi.org/10.3390/machines9010009
Submission received: 10 October 2020
/
Revised: 5 January 2021
/
Accepted: 7 January 2021
/
Published: 12 January 2021
(This article belongs to the Special Issue Advances and Trends in Non-conventional, Abrasive and Precision Machining)
Abstract
:In the paper, we present an analysis of the surface texture of turned parts with L/D (length/diameter) ratios of 6 and 12 and various rigidity values. The studies were carried out on samples made of S355JR steel and AISI 304 stainless steel. A detailed analysis of 2D surface profiles was carried out by using a large number of parameters that allowed us to distinguish significant differences in the surface microgeometry, which confirmed that determining surface characteristics from one height parameter (Ra—arithmetical mean height) is far from sufficient. The obtained results indicate significantly better roughness and waviness values of the AISI 304 steel surfaces in terms of its size, periodicity, and regularity. Therefore, the turning process of AISI 304 shafts with low rigidity allows one to be able to achieve better quality texture and have a positive effect on the general properties of a workpiece. In all tested samples, surface irregularities decreased along with the distance from the tailstock. The shafts with an L/D ratio of 12 had worse surfaces in the first two sections due to lower rigidity. The results received close to the three-jaw chuck, regardless of the L/D ratio and material type, demonstrated similar waviness and roughness parameters and profiles.
1. Introduction
During the turning process of a workpiece, cutting forces that cause an elastic deformation of a machining system—which is formed by a machine tool, grip, fixture, and cutting tool (MGFT system)—arise. The values of deformation for individual elements of this system are not constant because they depend on the applied cutting parameters and other processing conditions that exert a variable system of dynamic forces. As a result of variable cutting forces, vibrations of the machining system that significantly affect the tool path and deformation of the workpiece occur. Vibrations in the machining process are an undesirable phenomenon. They cause a number of part workmanship errors.
Since the MGFT system is dynamic and spatial, the mechanical vibrations generated in this system are also spatial. The components of vibrations in the direction perpendicular to the machined surface significantly affect the surface texture (roughness, waviness, etc.) and the components in line with the cutting speed direction-errors in the longitudinal section, e.g., conicity and a lack of parallelism between external and internal surfaces.
Deflections of element during processing comprise one of the most important factors influencing the final state of a product and, thus, its high quality expected by customers. Therefore, it is very important to optimize of the machining process to improve the dimensional accuracy of the finished product. According to Flisiak et al. [1], modelling the deflection of a workpiece during machining in terms of optimizing the processing technology of flexible elements is a priority task.
The quality of a machined surface, given by the set of roughness characteristics (microgeometry), affects the basic exploitation characteristics of the machine components [2]; therefore, surface roughness is a frequent subject of research [3,4,5,6]. For example Xavior et al. [5] investigated the effect of cutting fluids on the surface roughness of an AISI 304 steel workpiece after turning, Kaladhar et al. [6] explored the optimization of surface roughness and tool flank wear in the turning of AISI 304 austenitic stainless steel with a Chemical vapour deposition (CVD) coated tool, and Wagh et al. [7] conducted AISI 304 machinability studies using a Physical vapour deposition (PVD) system with cathodic arc evaporation (CAE) deposited onto AlCrN/TiAlN coated carbides (though they mainly analyzed the arithmetical mean height (Ra) parameter). The Ra parameter can get similar values for different tool geometries and machining principles. Different tool geometries and machining principles can lead to a surface with similar Ra parameter values. Only a detailed analysis of a 2D surface profile, described by a larger number of parameters, allows one to distinguish significant differences in surface microgeometry [2]. The authors of [8] presented the state of knowledge on the influence of surface roughness on the basic functional properties of a workpiece surface: substrate adhesion, fatigue strength, and tribological and corrosion properties. Relationships exist between 2D/3D surface roughness parameters and measurable indicators of surface functional characteristics. The authors argued that describing surface characteristics based on one height parameter (Ra), or even on several such parameters (Ra, root mean square height (Rq), maximum height of the profile (Rz), and total height of the profile (Rt)), is far from sufficient. Relationships between surface texture parameters and functional surface features should be investigated so that, on the basis of the first measurements, it is possible to predict the individual functional properties of manufactured parts.
The formation process of the geometric structure of the surface as a result of machining is complex and is influenced by many factors [9]. This process consists of the effect of individual elements of a machining system. In order to obtain specific surface texture parameters in the machining process, it is necessary to consider the kinematic and dynamic features characterizing the machine tool; the stereometry, dimensions, and properties of the tool material; and the physical properties and dimensions of the processed material.
The material qualities that influence the of surface texture are machinability (which is determined by the mechanical properties like hardness and strength), chemical composition, and material structure.
Another important feature is the rigidity of the material, which is defined as the force needed to deform an object. Material rigidity is often characterized by the Young′s modulus, a value that depends on the chemical composition, crystal structure, and phase composition of the microstructure. During longitudinal turning, rigidity is also influenced by the ratio of the workpiece length (L) to its diameter (D). In order to eliminate the influence of low workpiece rigidity, appropriate clamping is used. Liu et al. [10] implemented a finite difference (FD) analysis method for calculating the deformations of multi-diameter workpieces during cutting. The authors of [11] presented a mathematical model of the system of longitudinal turning and a mathematical model of the dynamic system of the machining of shafts with a low rigidity in the elastic-deformable state while considering factors interfering with and destabilizing the process of shaft machining. Benardos et al. [12] verified that the numerical method and development of an ANN (artificial neural network) model were based on data gathered from turning experiments conducted on a CNC lathe, thus allowing for a reduction of workpiece elastic deflections under cutting forces in turning.
The authors of [13] described a machining station, working together with a lathe, designed and constructed for the stabilization of the axis of low-rigidity parts in the process of machining. The basic element was a self-centering lunette with a hydraulic drive, allowing for part centering without any preliminary alignment. Świć et al. [14] presented an analysis of the possibility of increasing the accuracy and stability of the machining of low-rigidity shafts. A way of improving the accuracy of machining of shafts was to increase rigidity as a result of the oriented change of the elastic-deformable state through the application of a tensile force which, combined with the machining force, forms longitudinal–lateral strains.
2. Materials and Methods
The materials under investigation were in the form of Ø30 mm drawn bars, with length of 393 and 213 mm, made of S355JR steel and AISI 304 stainless steel, respectively. Machining processes were carried out on a TUR-50 CNC turning machine. A workholding method based on clamping shaft in a three-jaw chuck with a distance of 33 mm and a hydraulic pressure of 1.8 MPa supported by a revolving center (with a pressure of 1.2 MPa) (Figure 1). Every process was made with a coolant (SITALA D201.03 made by Houghton). The machining parameters in the turning operation were established as the following: a feed (f) of 0.20 mm and a cutting speed (vc) of 75 m/min. The cutting depth (ap) values for the S355JR and AISI 304 shafts were 0.7 and 0.8 mm, respectively. In the research, TWLNR 2525 M08 turning knives with turning inserts of the same geometry—WNMG 080408-MA MC6025 for S355JR and WNMG 080408-MA MC7025 for AISI 304 (both made by Mitsubishi Materials)—were applied. During investigation, two L/D (length/diameter) ratios of 6 and 12 of the turned shaft were considered (Table 1).
The surface texture validations were carried out with a Hommelwerk Standard 1000 surface roughness tester. During the measurements, the following parameters were adopted: evaluation length (ln) = 12.5 mm; cut off value (λc) = 2.5 mm; cut off ratio (λc/λs) = 300; and sampling interval = 1.5 µm. The stylus end was conical (taper angle of cone = 60°) with a spherical tip (tip radius (rtip) = 2 µm). These values were adopted because the main objective was to assess the surface condition on the possibly greatest length that was limited by the maximum measuring length of the used device. The shafts with an L/D of 12 were measured in four sections and the shafts with an L/D of 6 were measured in two sections at the distances presented in Figure 2. At each section, three parallel-to-the-feeding-direction measurements with a step of 120° were done. The surface texture for shafts with different rigidities was validated using the maximum height of the waviness profile (Wz) parameter, as well as selected roughness parameters. An analysis based on the Ra parameter was insufficient to define the surface texture, so the investigation considered other parameters such as Rq, Rdq (the root mean square for the local slope dz/dx within the sampling length), Rz, and Rt. A detailed analysis of the 2D surface profiles of the samples made of S355JR steel and AISI 304 stainless steel using a large number of parameters enabled us to distinguish significant differences in the surface micro-geometry and measurable indicators of surface functional characteristics.
3. Results and Discussion
Measuring the surface texture enabled a comparison of surface structures after turning AISI 304 and S355JR shafts with different L/D ratios. In comparing the profiles of the samples under investigation, significant changes in the appearance of the roughness (R) and waviness (W) profiles (the primary (P) profile was added for better visualization) could be noticed (Figure 3, Figure 4, Figure 5 and Figure 6).
In the case of turning the S355JR steel, it could be seen that the surface waviness obtained higher values than when machining the AISI 304 stainless steel, and greater waviness periodicity occurred. In addition, the profiles had greater irregularity. This was due to the adoption of various workpiece rigidities (L/D ratios) and steel/stainless steel properties such as machinability. It was also noticeable that the greater the distance from the tailstock, the lower the surface waviness that appeared in all samples. This was due to the vibrations of the maximum amplitude that occurred at the beginning of machining, related to the initial wear of the blade and the distribution of machining forces. Similar phenomena were observed in the roughness profiles. The turning operations of S355JR steel shafts resulted in an increase in surface roughness, and the R profiles were more irregular (both in the horizontal and vertical directions). The surfaces farther from the tailstock showed decreasing profile micro-irregularities.
By comparing the shafts with L/D = 6 with those with L/D = 12, it could be concluded that the longer workpieces had greater waviness and surface roughness in the first two sections. This was due to the lower rigidity of the shaft in these places during machining. Meanwhile, the waviness and roughness of the surfaces of the shafts of the same material closest to the three-jaw chuck had similar shapes and resulting R and W parameter values.
When comparing the third section of the shaft with L/D = 12 with the first section of the shaft with L/D = 6, it could be seen that despite the similar distance from the three-jaw chuck, the surface waviness and roughness were greater for the shorter shafts due to the phenomena occurring at the beginning of the machining.
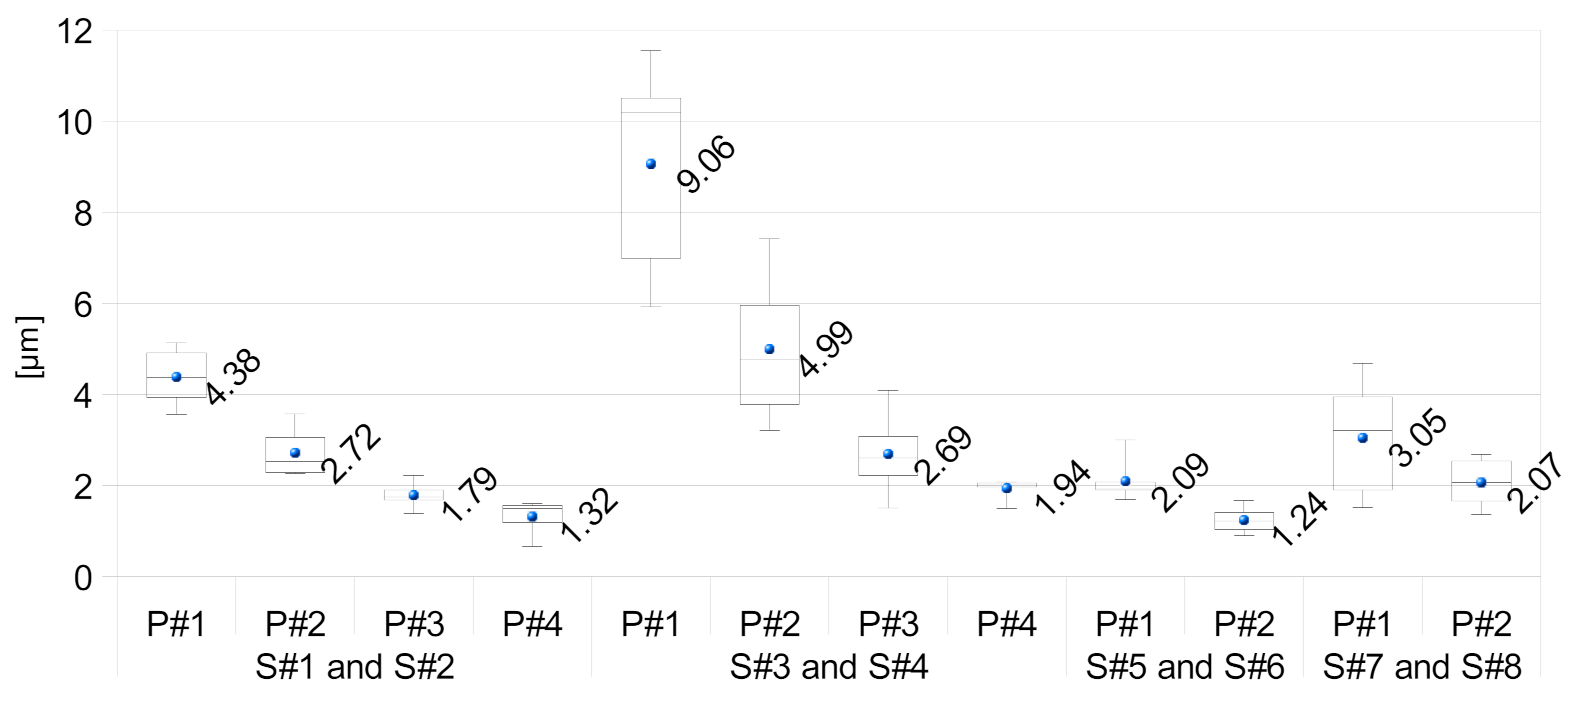
Based on the values of the maximum height of the Wz parameter, a significant increase in the surface waviness of the S355JR steel samples compared to the AISI 304 stainless steel samples was noted, and the maximum difference in the concerned cases was nearly 107% (Figure 7). The values of the Wz parameter were similar in the shafts on the chuck side, while they were significantly different at the end of the samples (when supported by the center) (Table 2). Shafts with L/D = 12 in the turning operation had more than twice the maximum height of the W profile in comparison with the shafts with L/D = 6 made of AISI 304 stainless steel, and these values were three times higher for workpieces made of S355JR steel. The increased height of the waviness profile from the center support caused by vibrations of maximum amplitude at this point. This was also confirmed by the lower rigidity of the support from the center side.
Despite the higher cutting resistance, the surface of the stainless steel workpieces after turning presented better quality, and significantly lower values of R parameters were received.
The irregularities of the parts after turning were evaluated by applying mean parameters, such as Rq (Table 3) and Ra (Table 4). The values of the Ra and Rq parameters in the case of the AISI 304 stainless steel samples were characterized by a relatively small dispersion of the obtained results. On the other hand, the machining of shafts with L/D = 12 made of S355JR steel resulted in an increase in the average roughness parameters, as well as their dispersion (Figure 8). The observed individual maximum and minimum height values had a larger effect on Rq values than on Ra. In all tested cases, the Rq parameter values were higher than Ra by an average of 20.37%.
The steepness of the surface could be numerically represented with the Rdq parameter, and the analysis of that parameter’s values made it possible to assess the susceptibility of the tested surfaces to processing. The advantage of this parameter is its high sensitivity to extreme peaks of the profile; low values characterize smooth surfaces, and higher values characterize rough surfaces (Table 5). For all shafts made of AISI 304 stainless steel, the Rdq parameter was in the range of 0.077°–0.091° with a relatively small dispersion (Figure 9). On the other hand, shafts made of S355JR steel, regardless of the L/D ratio, were characterized by large dispersions of the Rdq parameter, with values in the range of 0.099°–0.157°. In the case of section 4 (P#4), the highest value of the Rdq parameter was obtained for the S#3 shaft, and the greatest dispersion of the parameter occurred in section 2 (P#2) for S#4 shaft (Table 5).
The values of the Rt in the considered cases were approximately 15.76% greater than the corresponding Rz values. For the S355JR steel shafts, the values of the Rz and Rt parameters were higher and had a greater dispersion. The highest Rz values, Rt values, and Rt spread were observed for the S#4/1 sample section. However, the largest spread of the Rz parameter was for the S#3/1 sample section. The main statistics of the Rz and Rt parameters of the shafts with L/D ratios of 12 and 6 are presented in Table 6.
All parameters had the greatest dispersions for shafts with L/D = 12 made of S355JR steel; this phenomenon was caused by the instability of the machining process, which was also visible in the R and W profiles. The occurring waviness was caused by vibration in the MGFT system, so it is likely that the cutting edge was operating under uneven conditions, which could also have affected the surface texture. Furthermore, the samples were turned from a drawn bar, which, when processed, could obtain non-uniform properties. The AISI 304 stainless steel obtained a significantly smaller spread of parameter values, regardless of the L/D ratio. The surface texture after the turning of stainless steel is periodic, which leads to positive effects on workpiece properties after machining. In all samples under investigation, surface irregularities decreased along with the distance from the tailstock. The shafts with an L/D ratio of 12 obtained worse surfaces in the first two sections, which resulted from their lower rigidity. Regardless of the L/D ratio, similar waviness and roughness profiles close to the three-jaw chuck were obtained. The Ra and Rq roughness parameters had no differences due to the material type, whereas the Rz, Rt, and Rdq parameters had higher values for the S355JR steel.
4. Conclusions
The low rigidity of workpieces in relation to the rigid parts of a machine tool hinders the cutting process due to the generated vibrations. The properties of a workpiece material crucially affect the accuracy of execution.
The above-discussed data were also related to better properties of the AISI 304 material, which is characterized by a better machinability. The roughness parameters were found to improve with distance from the tailstock due to the phenomena that occurred at the beginning of the turning, the vibrations of the maximum amplitude at the point of the support of the center, and the lower rigidity of this support compared to the clamping in the chuck. For the same reasons, the shafts with an L/D ratio of 6 obtained better surface textures. In summarizing the results, it can be stated that the rigidity of a workpiece has a large impact on the geometric structure of a surface. Generally, analyses based on the Ra parameter are insufficient to define surface texture, so this paper considered other parameters as well.
Author Contributions
Conceptualization, M.D. and K.M.; formal analysis, M.D. and K.M.; investigation, M.D. and K.M.; methodology, M.D. and K.M.; writing—original draft, M.D. and K.M.; writing—review and editing, M.D. All authors have read and agreed to the published version of the manuscript.
Funding
This research received no external funding.
Acknowledgments
The authors wish to thank the firm GloBart for providing machine tool and raw material used in the study.
Conflicts of Interest
The authors declare no conflict of interest.
References
- Flisiak, J.; Józwik, J.; Włodarczyk, M. Analyzing the machining technology of the bolt for improvement dimensional accuracy of the finished product. Maint. Reliab. 2005, 2, 48–52. [Google Scholar]
- Dobrocký, D.; Studený, Z.; Pokorný, Z.; Joska, Z.; Faltejsek, P. Assessment of Surface Structure of Machined Surfaces. Manuf. Technol. 2019, 19, 563–572. [Google Scholar] [CrossRef]
- Duplák, J.; Zajac, J.; Hatala, M.; Mitaľ, D.; Kormoš, M. Study of Surface Quality after Turning of Steel AISI 304. Manuf. Technol. 2014, 14, 527–532. [Google Scholar] [CrossRef]
- Dirviyam, P.S.; Palanisamy, C. Optimization of surface roughness of AISI 304 austenitic stainless steel in dry turning operation using Taguchi design method. J. Eng. Sci. Technol. 2010, 5, 293–301. [Google Scholar]
- Xavior, M.A.; Adithan, M. Determining the influence of cutting fluids on tool wear and surface roughness during turning of AISI 304 austenitic stainless steel. J. Mater. Process. Technol. 2009, 209, 900–909. [Google Scholar] [CrossRef]
- Kaladhar, M.; Subbaiah, K.V.; Rao, C.H.S. Optimization of surface roughness and tool flank wear in turning of AISI 304 austenitic stainless steel with CVD coated tool. J. Eng. Sci. Technol. 2013, 8, 165–176. [Google Scholar]
- Wagh, S.S.; Kulkarni, A.P.; Sargade, V.G. Machinability Studies of Austenitic Stainless Steel (AISI 304) Using PVD Cathodic Arc Evaporation (CAE) System Deposited AlCrN/TiAlN Coated Carbide Inserts. Procedia Eng. 2013, 64, 907–914. [Google Scholar] [CrossRef] [Green Version]
- Grzesik, W. Prediction of the Functional Performance of Machined Components Based on Surface Topography: State of the Art. J. Mater. Eng. Perform. 2016, 25, 4460–4468. [Google Scholar] [CrossRef] [Green Version]
- Benardos, P.; Vosniakos, G.-C. Predicting surface roughness in machining: A review. Int. J. Mach. Tools Manuf. 2003, 43, 833–844. [Google Scholar] [CrossRef]
- Liu, Z.Q. Finite difference calculations of the deformations of multi-diameter workpieces during turning. J. Mater. Process. Technol. 2000, 98, 310–316. [Google Scholar]
- Świć, A.; Gola, A.; Wołos, D. Analysis of typical structures of dynamic systems of machining of elastic-deformable shafts with low rigidity. Adv. Sci. Technol. Res. J. 2018, 12, 1–9. [Google Scholar] [CrossRef]
- Benardos, P.G.; Mosialos, S.; Vosniakos, G.-C. Prediction of workpiece elastic deflections under cutting forces in turning. Robot. Comput. Manuf. 2006, 22, 505–514. [Google Scholar] [CrossRef]
- Świć, A.; Taranenko, V.; Gola, A. Analysis of the Process of Turning of Low-Rigidity Shafts. Appl. Mech. Mater. 2015, 791, 238–245. [Google Scholar] [CrossRef]
- Świć, A.; Wołos, D.; Litak, G. Method of control of machining accuracy of low-rigidity elastic-deformable shafts. Lat. Am. J. Solids Struct. 2014, 11, 260–278. [Google Scholar] [CrossRef]
Figure 1.
The view of the shafts with length/diameter (L/D) ratios of 6 (a) and 12 (b) during machining.
Figure 1.
The view of the shafts with length/diameter (L/D) ratios of 6 (a) and 12 (b) during machining.

Figure 2.
This the measurement positions for the shaft with L/D = 12 (a) and L/D = 6 (b).

Figure 3.
R (roughness), W (waviness), and P (primary) profiles of the first machined sample (L/D = 12; AISI 304): (a) section 1, (b) section 2, (c) section 3, (d) section 4.
Figure 3.
R (roughness), W (waviness), and P (primary) profiles of the first machined sample (L/D = 12; AISI 304): (a) section 1, (b) section 2, (c) section 3, (d) section 4.


Figure 4.
R, W, and P profiles of the third machined sample (L/D = 12; S355JR): (a) section 1, (b) section 2, (c) section 3, (d) section 4.
Figure 4.
R, W, and P profiles of the third machined sample (L/D = 12; S355JR): (a) section 1, (b) section 2, (c) section 3, (d) section 4.

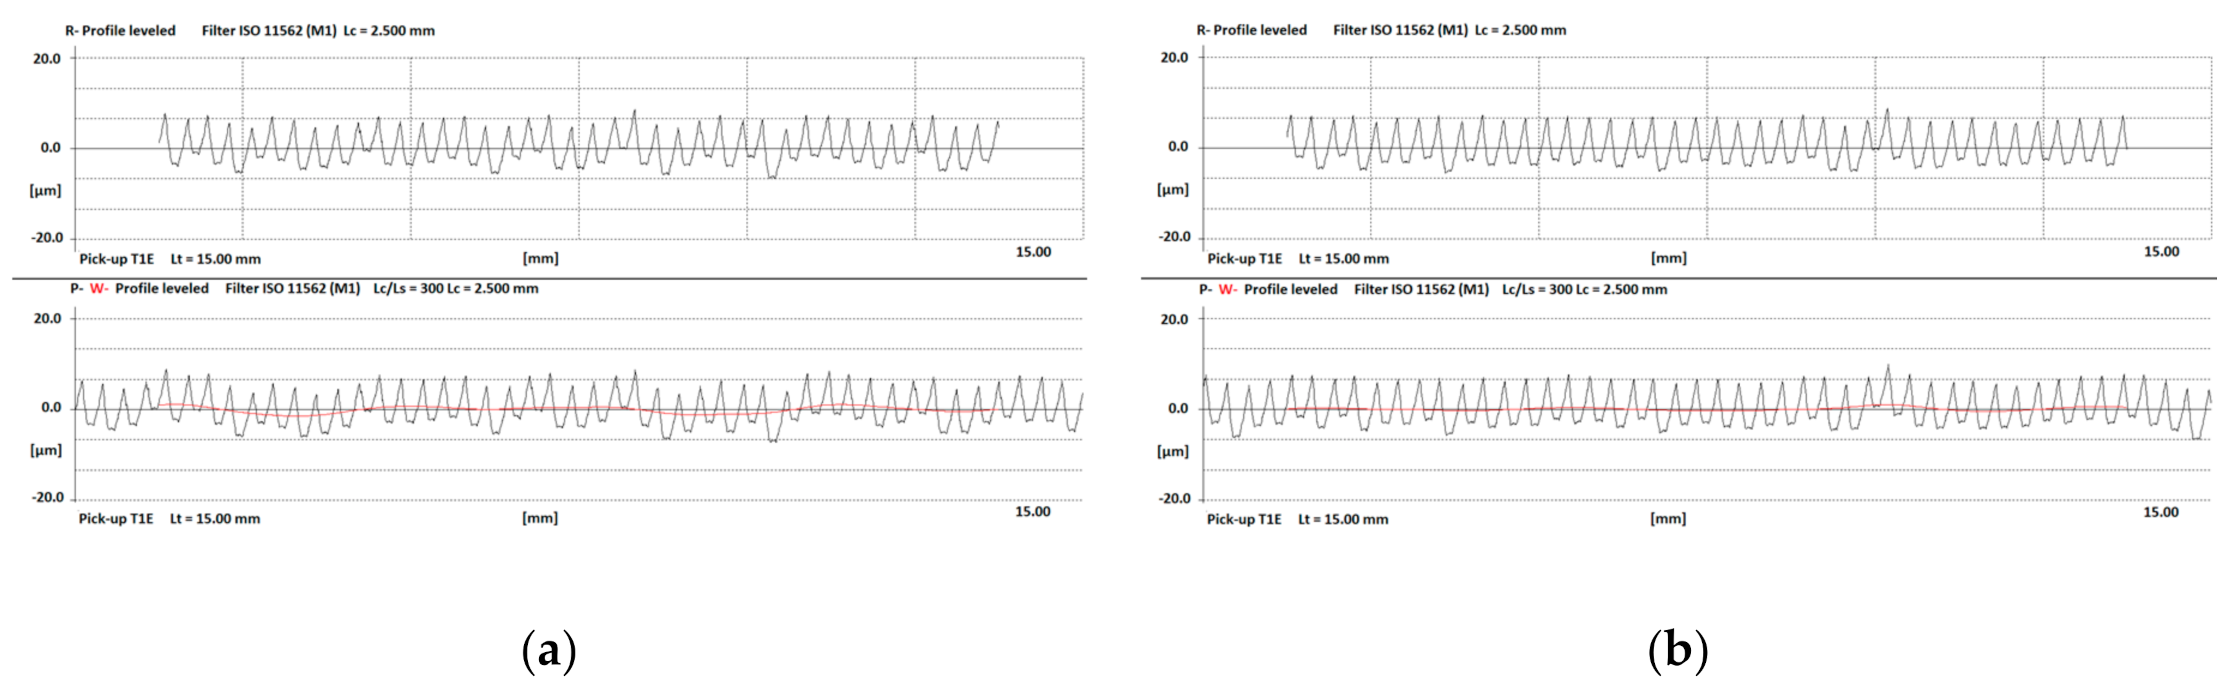
Figure 5.
R, W, and P profiles of the sixth machined sample (L/D = 6; AISI 304): (a) section 1, (b) section 2.
Figure 5.
R, W, and P profiles of the sixth machined sample (L/D = 6; AISI 304): (a) section 1, (b) section 2.

Figure 6.
R, W, and P profiles of the eighth machined sample (L/D = 6; S355JR): (a) section 1, (b) section 2.
Figure 6.
R, W, and P profiles of the eighth machined sample (L/D = 6; S355JR): (a) section 1, (b) section 2.

Figure 7.
The center and spread of a maximum height of the waviness profile (Wz) of the samples under investigation (the box plot presents the mean, the median, the interquartile range box, and the range of the data).
Figure 7.
The center and spread of a maximum height of the waviness profile (Wz) of the samples under investigation (the box plot presents the mean, the median, the interquartile range box, and the range of the data).

Figure 8.
The center and spread of Ra (a) and Rq (b) (the box plot presents the mean, the median, the interquartile range box, and the range of the data).
Figure 8.
The center and spread of Ra (a) and Rq (b) (the box plot presents the mean, the median, the interquartile range box, and the range of the data).


Figure 9.
The center and spread of the Rdq parameter (the box plot presents the mean, the median, the interquartile range box, and the range of the data).
Figure 9.
The center and spread of the Rdq parameter (the box plot presents the mean, the median, the interquartile range box, and the range of the data).


Table 1.
Designation of samples under testing.
| Material | AISI 304 | S355JR |
|---|---|---|
| L/D = 12 | S#1 | S#3 |
| S#2 | S#4 | |
| L/D = 6 | S#5 | S#7 |
| S#6 | S#8 |
Table 2.
Main statistics of the maximum height of the Wz parameter.
| Section | Mean | Median | Q1 | Q3 | Max | Min | ||
|---|---|---|---|---|---|---|---|---|
| L/D = 12 | AISI 304 | P#1 | 4.38 | 4.37 | 3.93 | 4.91 | 5.13 | 3.56 |
| P#2 | 2.72 | 2.53 | 2.29 | 3.06 | 3.57 | 2.26 | ||
| P#3 | 1.79 | 1.75 | 1.69 | 1.90 | 2.22 | 1.38 | ||
| P#4 | 1.32 | 1.50 | 1.19 | 1.56 | 1.60 | 0.66 | ||
| S255JR | P#1 | 9.06 | 10.20 | 6.99 | 10.50 | 11.54 | 5.92 | |
| P#2 | 4.99 | 4.76 | 3.78 | 5.96 | 7.41 | 3.21 | ||
| P#3 | 2.69 | 2.60 | 2.22 | 3.08 | 4.09 | 1.51 | ||
| P#4 | 1.94 | 2.02 | 1.97 | 2.06 | 2.08 | 1.49 | ||
| L/D = 6 | AISI 304 | P#1 | 2.09 | 1.93 | 1.91 | 2.07 | 3.00 | 1.69 |
| P#2 | 1.24 | 1.22 | 1.03 | 1.41 | 1.67 | 0.90 | ||
| S255JR | P#1 | 3.05 | 3.22 | 1.90 | 3.94 | 4.68 | 1.52 | |
| P#2 | 2.07 | 2.07 | 1.66 | 2.54 | 2.68 | 1.36 | ||
Table 3.
Main statistics of the mean square height (Rq) parameter.
| Section | Mean | Median | Q1 | Q3 | Max | Min | ||
|---|---|---|---|---|---|---|---|---|
| L/D = 12 | AISI 304 | P#1 | 4.42 | 4.40 | 4.14 | 4.68 | 4.83 | 4.03 |
| P#2 | 3.74 | 3.74 | 3.72 | 3.77 | 3.78 | 3.67 | ||
| P#3 | 3.58 | 3.59 | 3.55 | 3.61 | 3.63 | 3.53 | ||
| P#4 | 3.67 | 3.67 | 3.63 | 3.69 | 3.72 | 3.62 | ||
| S255JR | P#1 | 5.49 | 5.79 | 4.44 | 6.27 | 7.03 | 3.91 | |
| P#2 | 4.56 | 4.55 | 3.97 | 5.13 | 5.31 | 3.86 | ||
| P#3 | 3.78 | 3.80 | 3.66 | 3.92 | 3.93 | 3.60 | ||
| P#4 | 3.72 | 3.71 | 3.69 | 3.76 | 3.94 | 3.52 | ||
| L/D = 6 | AISI 304 | P#1 | 3.09 | 3.07 | 3.04 | 3.10 | 3.31 | 2.93 |
| P#2 | 3.32 | 3.32 | 3.31 | 3.34 | 3.46 | 3.17 | ||
| S255JR | P#1 | 3.30 | 3.35 | 3.18 | 3.52 | 3.59 | 2.81 | |
| P#2 | 3.22 | 3.19 | 3.01 | 3.38 | 3.62 | 2.93 | ||
Table 4.
Main statistics of the arithmetical mean height (Ra) parameter.
| Section | Mean | Median | Q1 | Q3 | Max | Min | ||
|---|---|---|---|---|---|---|---|---|
| L/D = 12 | AISI 304 | P#1 | 3.65 | 3.65 | 3.45 | 3.85 | 3.95 | 3.38 |
| P#2 | 3.18 | 3.18 | 3.16 | 3.21 | 3.22 | 3.14 | ||
| P#3 | 3.09 | 3.10 | 3.06 | 3.11 | 3.12 | 3.04 | ||
| P#4 | 3.16 | 3.16 | 3.14 | 3.18 | 3.20 | 3.13 | ||
| S255JR | P#1 | 4.38 | 4.68 | 3.56 | 4.95 | 5.59 | 3.13 | |
| P#2 | 3.63 | 3.58 | 3.20 | 4.09 | 4.18 | 3.13 | ||
| P#3 | 3.11 | 3.12 | 2.99 | 3.22 | 3.28 | 2.94 | ||
| P#4 | 3.10 | 3.11 | 3.05 | 3.16 | 3.27 | 2.91 | ||
| L/D = 6 | AISI 304 | P#1 | 2.61 | 2.60 | 2.57 | 2.64 | 2.80 | 2.45 |
| P#2 | 2.85 | 2.86 | 2.84 | 2.87 | 2.93 | 2.73 | ||
| S255JR | P#1 | 2.65 | 2.70 | 2.59 | 2.83 | 2.85 | 2.23 | |
| P#2 | 2.63 | 2.59 | 2.43 | 2.78 | 2.99 | 2.37 | ||
Table 5.
Main statistics of the Rdq parameter.
| Section | Mean | Median | Q1 | Q3 | Max | Min | ||
|---|---|---|---|---|---|---|---|---|
| L/D = 12 | AISI 304 | P#1 | 0.089 | 0.090 | 0.088 | 0.091 | 0.092 | 0.085 |
| P#2 | 0.086 | 0.088 | 0.084 | 0.088 | 0.088 | 0.082 | ||
| P#3 | 0.086 | 0.086 | 0.084 | 0.088 | 0.088 | 0.083 | ||
| P#4 | 0.091 | 0.091 | 0.090 | 0.092 | 0.092 | 0.090 | ||
| S255JR | P#1 | 0.105 | 0.105 | 0.100 | 0.110 | 0.117 | 0.095 | |
| P#2 | 0.130 | 0.134 | 0.124 | 0.137 | 0.142 | 0.111 | ||
| P#3 | 0.147 | 0.147 | 0.138 | 0.154 | 0.160 | 0.135 | ||
| P#4 | 0.149 | 0.150 | 0.141 | 0.152 | 0.168 | 0.136 | ||
| L/D = 6 | AISI 304 | P#1 | 0.077 | 0.078 | 0.076 | 0.079 | 0.079 | 0.075 |
| P#2 | 0.083 | 0.083 | 0.083 | 0.083 | 0.084 | 0.079 | ||
| S255JR | P#1 | 0.117 | 0.118 | 0.111 | 0.124 | 0.129 | 0.105 | |
| P#2 | 0.129 | 0.127 | 0.125 | 0.132 | 0.142 | 0.123 | ||
Table 6.
Main statistics of the total height of the profile (Rt) and maximum height of the profile (Rz) parameters.
Table 6.
Main statistics of the total height of the profile (Rt) and maximum height of the profile (Rz) parameters.
| Total Height of the Profile—Rt | Maximum Height of the Profile—Rz | |||||||||
|---|---|---|---|---|---|---|---|---|---|---|
| Section | Mean | Median | Max | Min | Mean | Median | Max | Min | ||
| L/D = 12 | AISI 304 | P#1 | 21.69 | 22.20 | 24.43 | 18.43 | 18.99 | 19.00 | 21.25 | 16.83 |
| P#2 | 16.93 | 16.71 | 18.12 | 16.24 | 15.21 | 15.23 | 15.60 | 14.70 | ||
| P#3 | 15.28 | 15.23 | 16.47 | 14.45 | 14.03 | 14.01 | 14.76 | 13.42 | ||
| P#4 | 14.77 | 14.76 | 15.21 | 14.31 | 13.92 | 13.89 | 14.20 | 13.66 | ||
| S255JR | P#1 | 30.22 | 29.22 | 39.62 | 23.81 | 23.84 | 25.16 | 27.95 | 17.88 | |
| P#2 | 28.46 | 28.67 | 34.09 | 23.54 | 21.21 | 21.67 | 23.67 | 17.98 | ||
| P#3 | 21.73 | 21.81 | 23.94 | 19.02 | 17.82 | 17.70 | 18.85 | 17.08 | ||
| P#4 | 19.26 | 18.97 | 21.59 | 17.72 | 16.83 | 16.78 | 18.58 | 15.58 | ||
| L/D = 6 | AISI 304 | P#1 | 13.70 | 13.64 | 15.27 | 12.52 | 12.28 | 12.19 | 13.38 | 11.67 |
| P#2 | 13.81 | 13.44 | 15.37 | 13.01 | 12.52 | 12.33 | 13.90 | 12.00 | ||
| S255JR | P#1 | 19.37 | 20.28 | 22.16 | 15.09 | 16.53 | 16.79 | 19.01 | 14.02 | |
| P#2 | 17.22 | 16.95 | 19.14 | 16.11 | 15.28 | 15.15 | 17.09 | 14.05 | ||
Publisher’s Note: MDPI stays neutral with regard to jurisdictional claims in published maps and institutional affiliations. |
© 2021 by the authors. Licensee MDPI, Basel, Switzerland. This article is an open access article distributed under the terms and conditions of the Creative Commons Attribution (CC BY) license (http://creativecommons.org/licenses/by/4.0/).
Share and Cite
MDPI and ACS Style
Dobrzynski, M.; Mietka, K. Surface Texture after Turning for Various Workpiece Rigidities. Machines 2021, 9, 9. https://doi.org/10.3390/machines9010009
AMA Style
Dobrzynski M, Mietka K. Surface Texture after Turning for Various Workpiece Rigidities. Machines. 2021; 9(1):9. https://doi.org/10.3390/machines9010009
Chicago/Turabian StyleDobrzynski, Michal, and Karolina Mietka. 2021. "Surface Texture after Turning for Various Workpiece Rigidities" Machines 9, no. 1: 9. https://doi.org/10.3390/machines9010009
Note that from the first issue of 2016, this journal uses article numbers instead of page numbers. See further details here.