1. Introduction
Today, there is an increasing use of composite laminates in engineering applications, due to their high strength-to-weight ratio, as well as excellent corrosion and fatigue resistance. Continuous and extensive research and development in composite material science and technology led to the growing increase in the usage of composite materials from primary applications, such as the interiors of automobiles, to very advanced applications in automotive, aerospace, marine, and off-shore industries. The manufacturing flexibility of composites having customized mechanical properties for specific applications has been one of their greater advantages and also one of the more perplexing challenges to adopting them as alternative to conventional materials [
1,
2,
3].
Today, there is a good knowledge on manufacturing Glass Fiber Reinforced Polymer (GFRP) products using the filament winding technique [
4]. Composite tubes, in particular, are widely used for a range of industrial applications [
5]. They outperform traditional pipe materials in applications requiring low weight, corrosion resistance, and high strength. Composite tubes are usually manufactured by the filament winding process where controlled amount of resin and oriented composite fibers are wound around a rotating mandrel and cured to produce the required composite part [
6]. The use of machining is increasing as the field of application of composite pipes is increasing [
7]. However, it is often difficult to machine the GFRP composite tubes since such procedure brings many undesirable results, such as rapid tool wear, a defective surface layer with cracks or delamination, a rough surface finish, etc. To avoid such problems, it is necessary to select the appropriate process parameters and thereby to achieve the highest performance for desired dimensional accuracy.
Many researchers had studied the effect of input machining parameters on cutting quality [
8,
9]. Dehghan et al. [
10] investigated the effect of drilling parameters, such as spindle speed, feed rate, diameter and drill geometry on the thrust force, and the delamination factor for the composite pipes, produced by the filament winding process. Korlos et al. [
11] compared the delamination effects in drilling and Electrical Discharge Machining (EDM) procedures in CFRP composites, while Prasad et al. [
12] analyzed the surface roughness behavior from different hole cutting conditions on GFRP composites using abrasive water jet machining. Additionally, El-Ghaoui et al. [
13] investigated the effects of a graphene filled matrix on GFRP machinability.
In particular, the machining of FRP is different from that of metal working in many respects because the metal behavior is not only inhomogeneous but also dependent on fiber and matrix properties, fiber orientation, and the type of fibers. In machining, most of the composite materials produce discontinuous, powdery chips. The powdery chips pose health hazard to the operator. Collection and disposal of the chips is also a problem. Proper safety equipment must be used while working with these composite materials. The tool wear must be kept at a minimum when machining composite materials. During the machining operation, the tool continuously machines matrix and fiber materials sometimes at different orientations; thereby, their response to machining can vary greatly. Both thermal and mechanical stresses are induced in the cutting zone. Due to the variations in properties of matrix and fiber, the cutting nose may be subjected to localized dynamic loading. Such load may cause tool failure due to possible low cycle fatigue apart from the usual types of wear. The surface quality is related with the features that are generated on the machined surface. For optimized surface finish, it is necessary to understand the mechanisms of the material removal and the kinetics of machining processes that affect the performance of the cutting tool. It is understood that the cutting mechanism of the composite materials is due to a combination of plastic deformation of the matrix, shearing, and bending rupture of the fibers. The severity of such mechanisms depends on the toughness of the reinforcing fibers/particles their flexibility and orientation. As in metals, the surface roughness can be assessed by the different surface roughness parameters, such as arithmetic average height (Ra), the average maximum peak to valley of five consecutive sampling lengths within the measuring length (Rz), root mean square roughness (Rq), maximum height of peaks (Rp), maximum height of the profile (Rt), or mean of the third point height (R3z). Even though many surface roughness parameters are used, the average surface roughness (Ra), which is most used in industries. On an FRP machined surface, the result of the surface roughness test depends mainly on the direction of fibers, which changes from layer to layer. In addition, the method that is used to measure the surface features is very important since contact and non-contact methods might give slightly different values.
Davim et al. [
14] presented an optimization study of surface roughness in turning FRPs tubes manufactured by filament winding and hand lay-up, using polycrystalline diamond cutting tools. In Naveen et al.’s [
15] work, the machining characteristics of GFRP pipes made by hand lay-up, and filament winding process were also thoroughly analyzed. Kumar et al. [
16] proposed a utility concept for multi-response optimization in turning uni-directional glass fiber-reinforced plastics composite using a carbide cutting tool. A multi-response optimization problem has been converted to an equivalent single objective optimization problem, which has been further solved by the Taguchi methodology [
17]. The work of Hussain et al. [
18] investigated some aspects on machinability, such as surface roughness and cutting force, in turning of GFRP composite materials for a range of fiber orientation angles (30–90°) with a Cubic Boron Nitride (CBN) cutting tool insert using fuzzy rule-based optimization of multiple responses.
Maintaining the surface quality of machined FRP materials is a demanding task. In order to understand the surface morphology and study the dimensional properties, it is necessary to characterize and quantify the quality of the machined surface and the effect of process parameters on the surface quality. Raveendran et al. [
19] used grey relational analysis, desirability function analysis, and analysis of variance approach for optimization purposes and they mainly focused on the effective turning of GFRP using TiCN/TiN-coated tool. In addition, in other research work [
20], the influence of cutting parameters and insert radius on the cutting force and surface roughness of GFRP material during machining was investigated, where it was observed that high cutting speeds and low feed rates provide the best surface quality in the turning process of GFRP composite materials. In another study [
21], an attempt has been made to investigate the machining characteristics of GFRP composite tubes of different fiber orientations with various process parameters and surface roughness (Ra) and machining time were analyzed using Analysis of Variance (ANOVA). In addition, in another investigation [
22], a relatively novel module was applied for multi response optimization in turning of glass fiber reinforced epoxy composites using Grey coupled artificial neural network model towards optimizing of cutting force, surface roughness, and material removal rate. Equbal et al. [
23] performed a multi-response optimization procedure, to achieve the optimal setting of the cutting parameters by using a combination of Artificial Neural Network (ANN) and Genetic Algorithm (GA). ANN was used to establish the relationship between the input and output parameters, and verification of the network showed that the neural network produced accurate results for obtaining objective value from any set of input parameters. The genetic algorithm was used to generate the Pareto optimal solutions.
In addition, the Response Surface Methodology (RSM) has been utilized in the past to develop statistically-based models for the prediction of the surface roughness during machining. The RSM is a recognized mathematical tool that can be used to investigate the relationship between a number of input variables and one or more responses (outputs). Several machining-related studies exist in the literature where RSM has been implemented successfully. Subramanian et al. [
24] developed a statistical model to predict surface roughness with respect to rake angle, nose radius of cutting tool, and machining parameters, such as cutting speed, feed rate, and depth of cut. Efkolidis et al. [
25] used RSM and similar methodologies to predict the thrust force and torque generated during drilling of Al7075. Similarly, Tzotzis et al. [
26] established statistical models for the machining force components induced when hard turning AISI4140. Moreover, Malakizadi et al. [
27] developed prediction models, by combining RSM with numerical investigation, for the flank wear evolution of tool.
In the current work, the influence of cutting conditions (cutting speed, feed rate, and depth of cut) on surface integrity evolution has been studied on turning Filament Winding GFRP Pipe Rings. The main goal was to investigate the difference of surface roughness for various turning conditions. Initially, the experimental details of the proposed cutting model are presented, as well as the experimental data obtained using a Computer Numerical Control (CNC) machine during an internal turning process. Thereafter, the influence of the cutting parameters on surface quality is presented by microscopic examination. Modeling of roughness based on statistical method is also presented while the roughness measurements, once performed, are recorded and analyzed using a statistical technique. Finally, conclusions summarize the results and contributions of this study.
3. Influence of Cutting Parameters on Surface Morphology
Table 1 contains all the important cutting conditions used in the experiments performed in this study, as well as the measured values for the average maximum height of the profile
Rz and the average roughness
Ra. It should be noted that the orientation of the winding fibers was ±45°; thereby, the effect of fiber angle on the surface roughness values was not a parameter that has been studied in the current work. The measurements of
Ra and
Rz were performed on the internal diameter of rings at four locations spaced 90° each, where a mean value of the measurements was calculated. It seems that the increase in cutting speed from 75 m/min to 100 m/min has detrimental effect on both surface roughness
Ra and
Rz values despite the fact that, when cutting speed increases from 100 m/min to 125 m/min, that decrease is smaller. In addition, the increase in feed rate results in small increase in the roughness values, especially when the feed rises from 0.1 mm/rev to 0.15 mm/rev. However, when the feed shifts from 0.15 mm/rev to 0.2 mm/rev the results are mixed with noticeable differences. The results from the changes of the depth of cut show a peculiar response since, for low speed of 75 m/min, the roughness values are decreasing; however, for all other cutting conditions, the roughness values are increasing. It seems that, in order to obtain low values of roughness, the most critical parameter is the cutting speed. The best values of Ra obtained for the cutting conditions of
V = 75 m/min,
S = 0.1 mm/rev, and a = 1.5 mm. The relationship between the surface roughness and cutting parameters, which is further discussed in
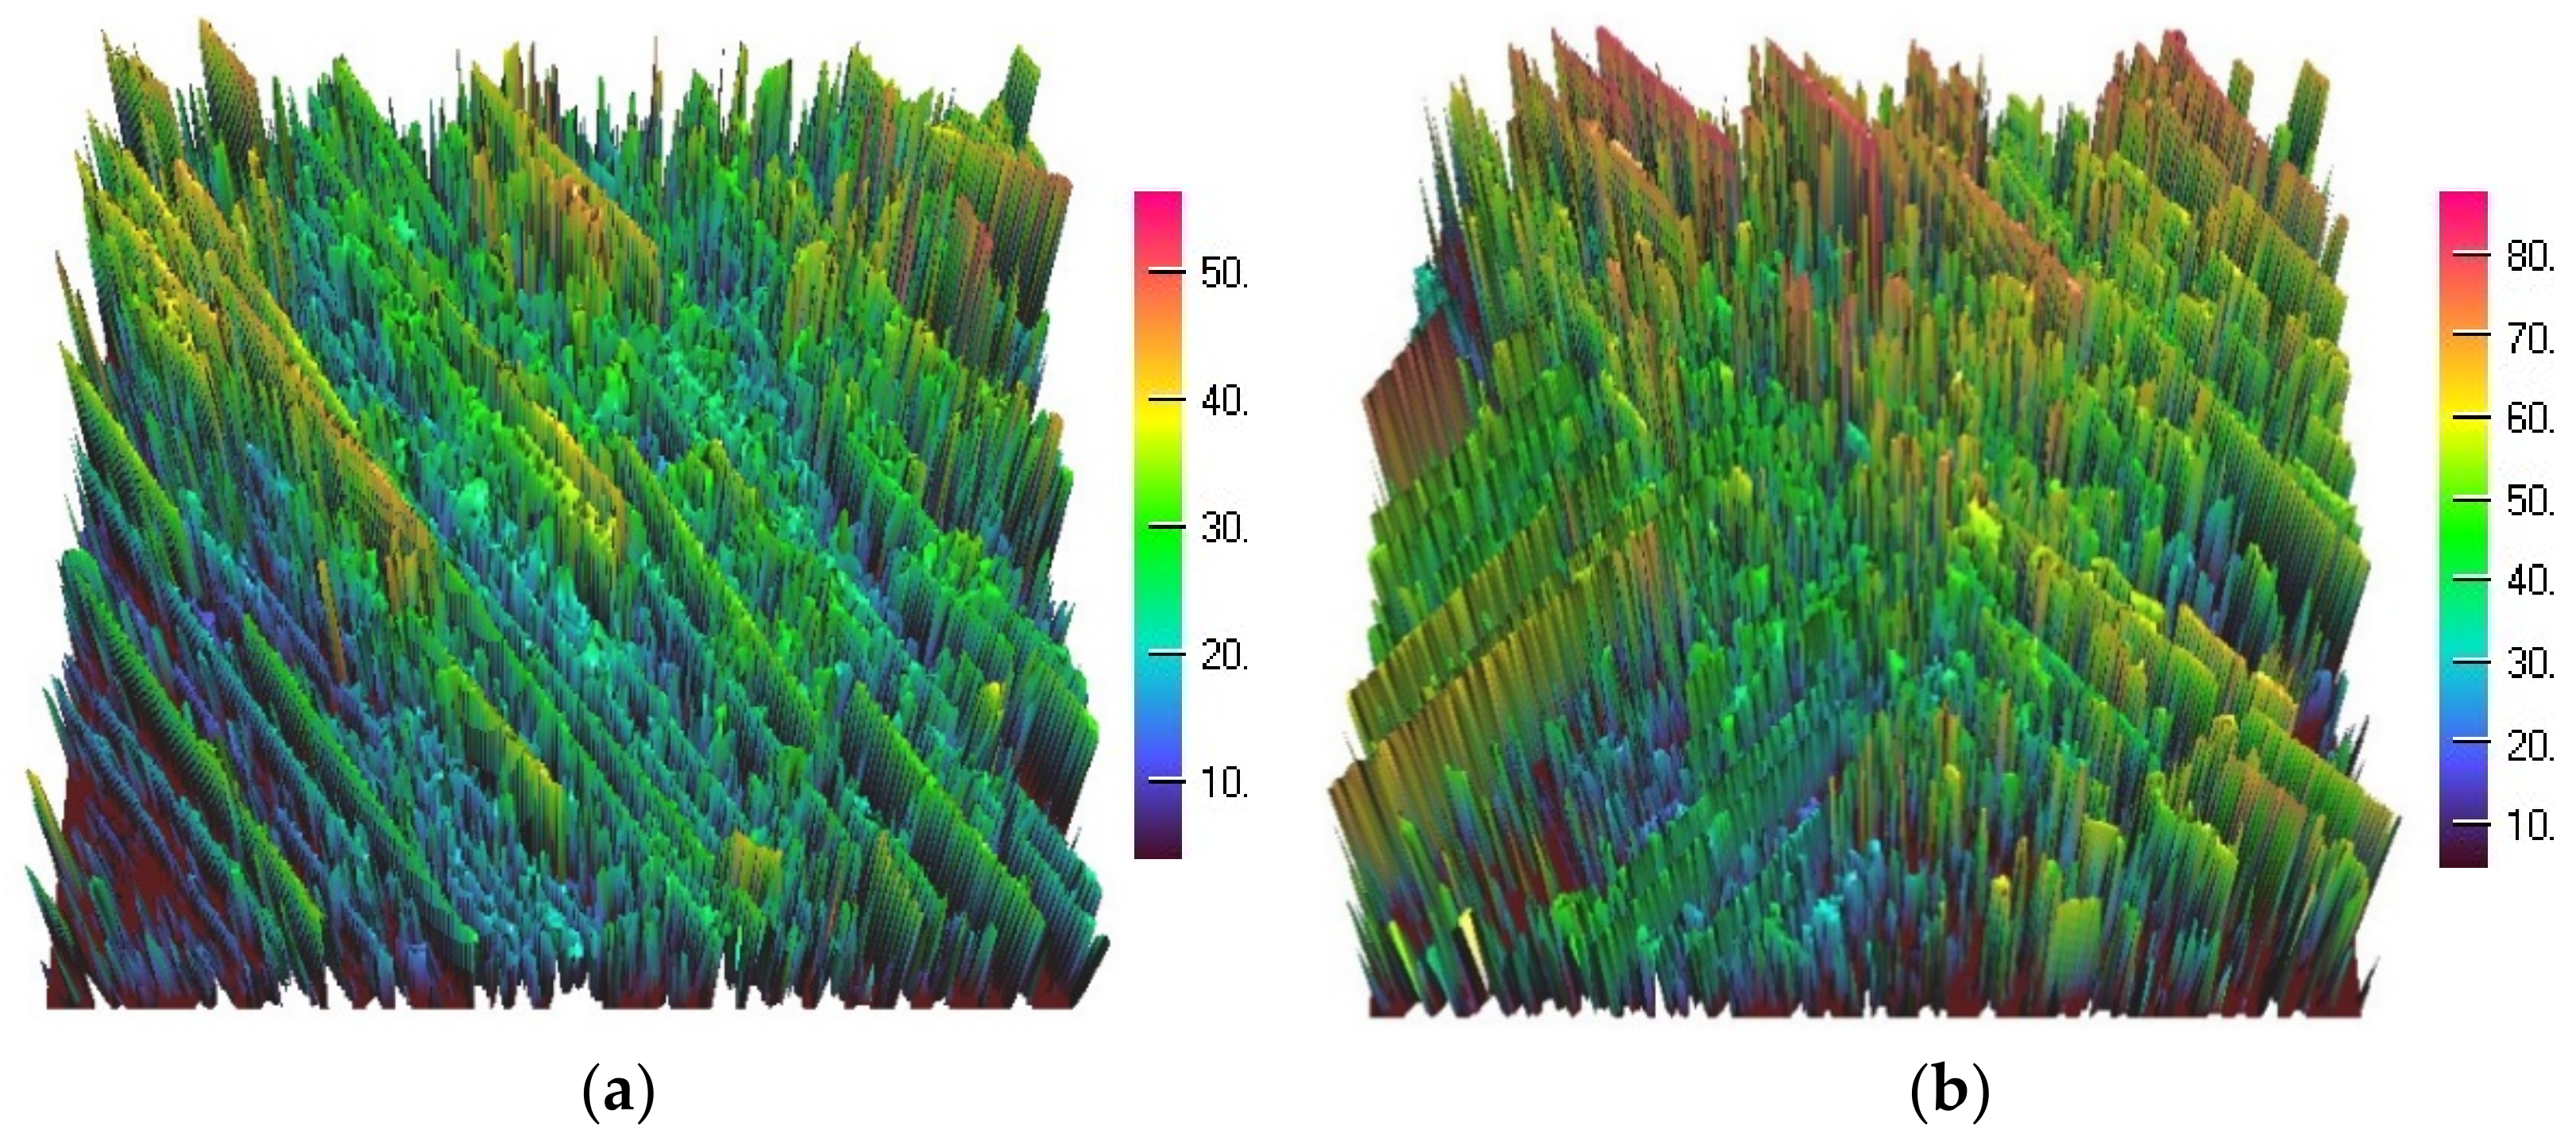
Section 4, is caused by the inhomogeneous microstructure of reinforcing fibers in the composite material, which results in surface details including deformations and fractures at micro level. A typical surface profile from observed in turning of GFRP composites is presented in
Figure 2. It represents a schematic of the 3D surface profile from the 3D measurement system μsurf with cutting conditions in case of
Figure 2a as
V = 75 mm/min,
S = 0.15 mm/rev,
a = 1.5 mm, as well as for
Figure 2b as
V = 100 mm/min,
S = 0.15 mm/rev,
a = 0.5 mm. These images are obtained when measuring surface roughness on the machined material, and they represent different roughness profiles with peak values of 50 μm and 80 μm. The orientation of the fibers after machining is clearly seen, especially in
Figure 2b, where the lower left corner shows the winding fibers in +45° direction as compared with the rest of the images that the fibers are oriented at −45°. The distribution of fibers is not even, and there is probably a preferential removal of fibers in the composite materials during machining.
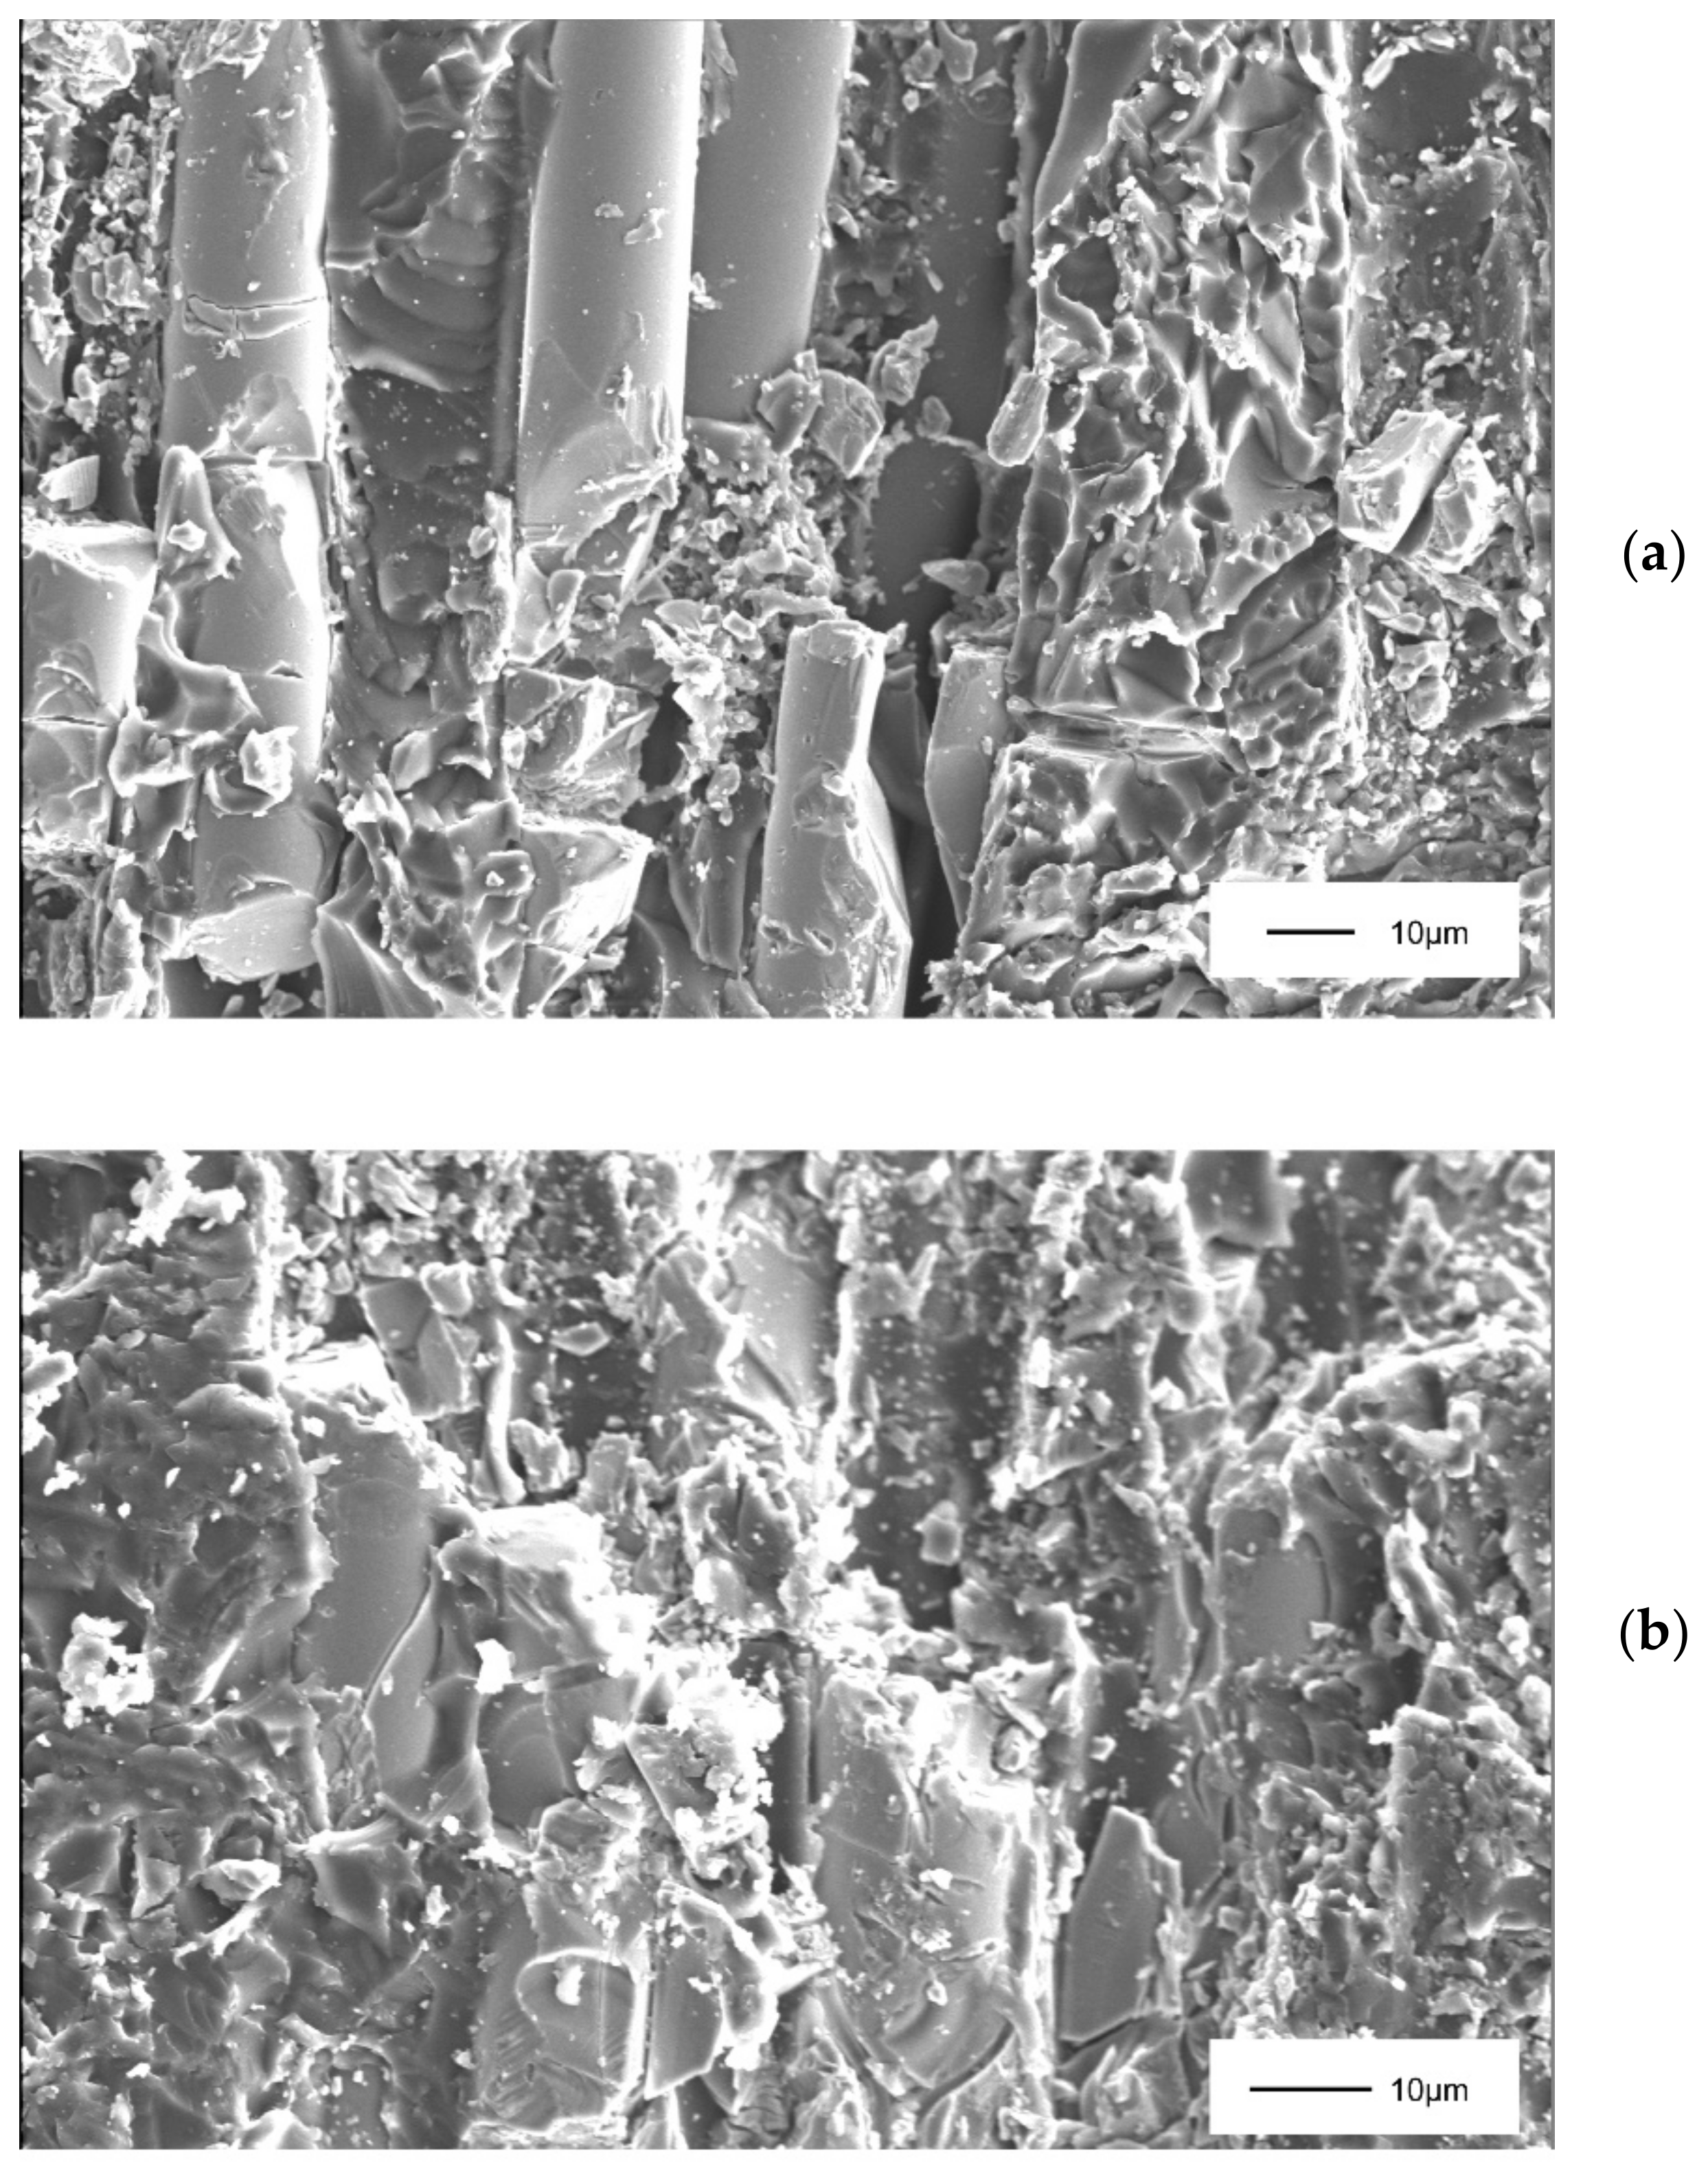
Figure 3 shows a typical scanning electron micrograph (SEM Phenom ProX) of the machining surface with cutting conditions of
V = 75 m/min,
S = 0.1 mm/rev, and
a = 1.5 mm. All surfaces had comparable appearance irrespective of the machining parameters. No damage-free surfaces were obtained in the current work.
Figure 3a shows a poor surface finish due to mainly debonding and brittle breakage of fibers, which is similar to the scanning electron micrographs obtained in another study [
15]. There were fiber ends sticking out, peaks of deformed matrix material, and tensile and shear patterns of fibers fracture, as well as debonding between fibers and matrix.
Figure 3b shows a magnification of the surface near fiber ends revealing the detrimental effect of the machining on the fibers.
4. Modeling of Roughness Based on Statistical Methodologies
The mathematical models for the surface roughness were developed based on the experimental results. The parameters that were involved in the present study are the cutting speed, the feed and the depth of cut. Thus, the fit of the regression models was done based on the aforementioned factors.
Table 1 contains all the important cutting conditions used in the experiments performed in this study, the coded values of the produced mathematical models, and the measured values for the average maximum height of the profile
Rz and the average roughness
Ra. The measurements of
Ra and
Rz were performed on the internal diameter of rings at four locations spaced 90° each and the mean value of the measurements is shown in
Table 1. Equation (1) represents the second order polynomial that is produced by the regression analysis. The
Y variable is the response of the model, whereas the
Xi values are the predictors (in this case, the three key parameters, cutting speed, feed, and depth of cut). Finally, the
bi values are the regression coefficients.
With the implementation of the experimental results and the previously stated polynomial, Equations (2) and (3) were generated for the prediction of the average maximum height of the profile
Rz (μm) and the average roughness
Ra (μm), respectively.
where
Rz is the average maximum peak to valley of five consecutive sampling lengths within the measuring in μm,
Ra is the average roughness in μm,
V is the cutting speed in m/min,
S is the feed in mm/rev, and
a is the depth of cut in mm.
With the processing of the results that are presented in
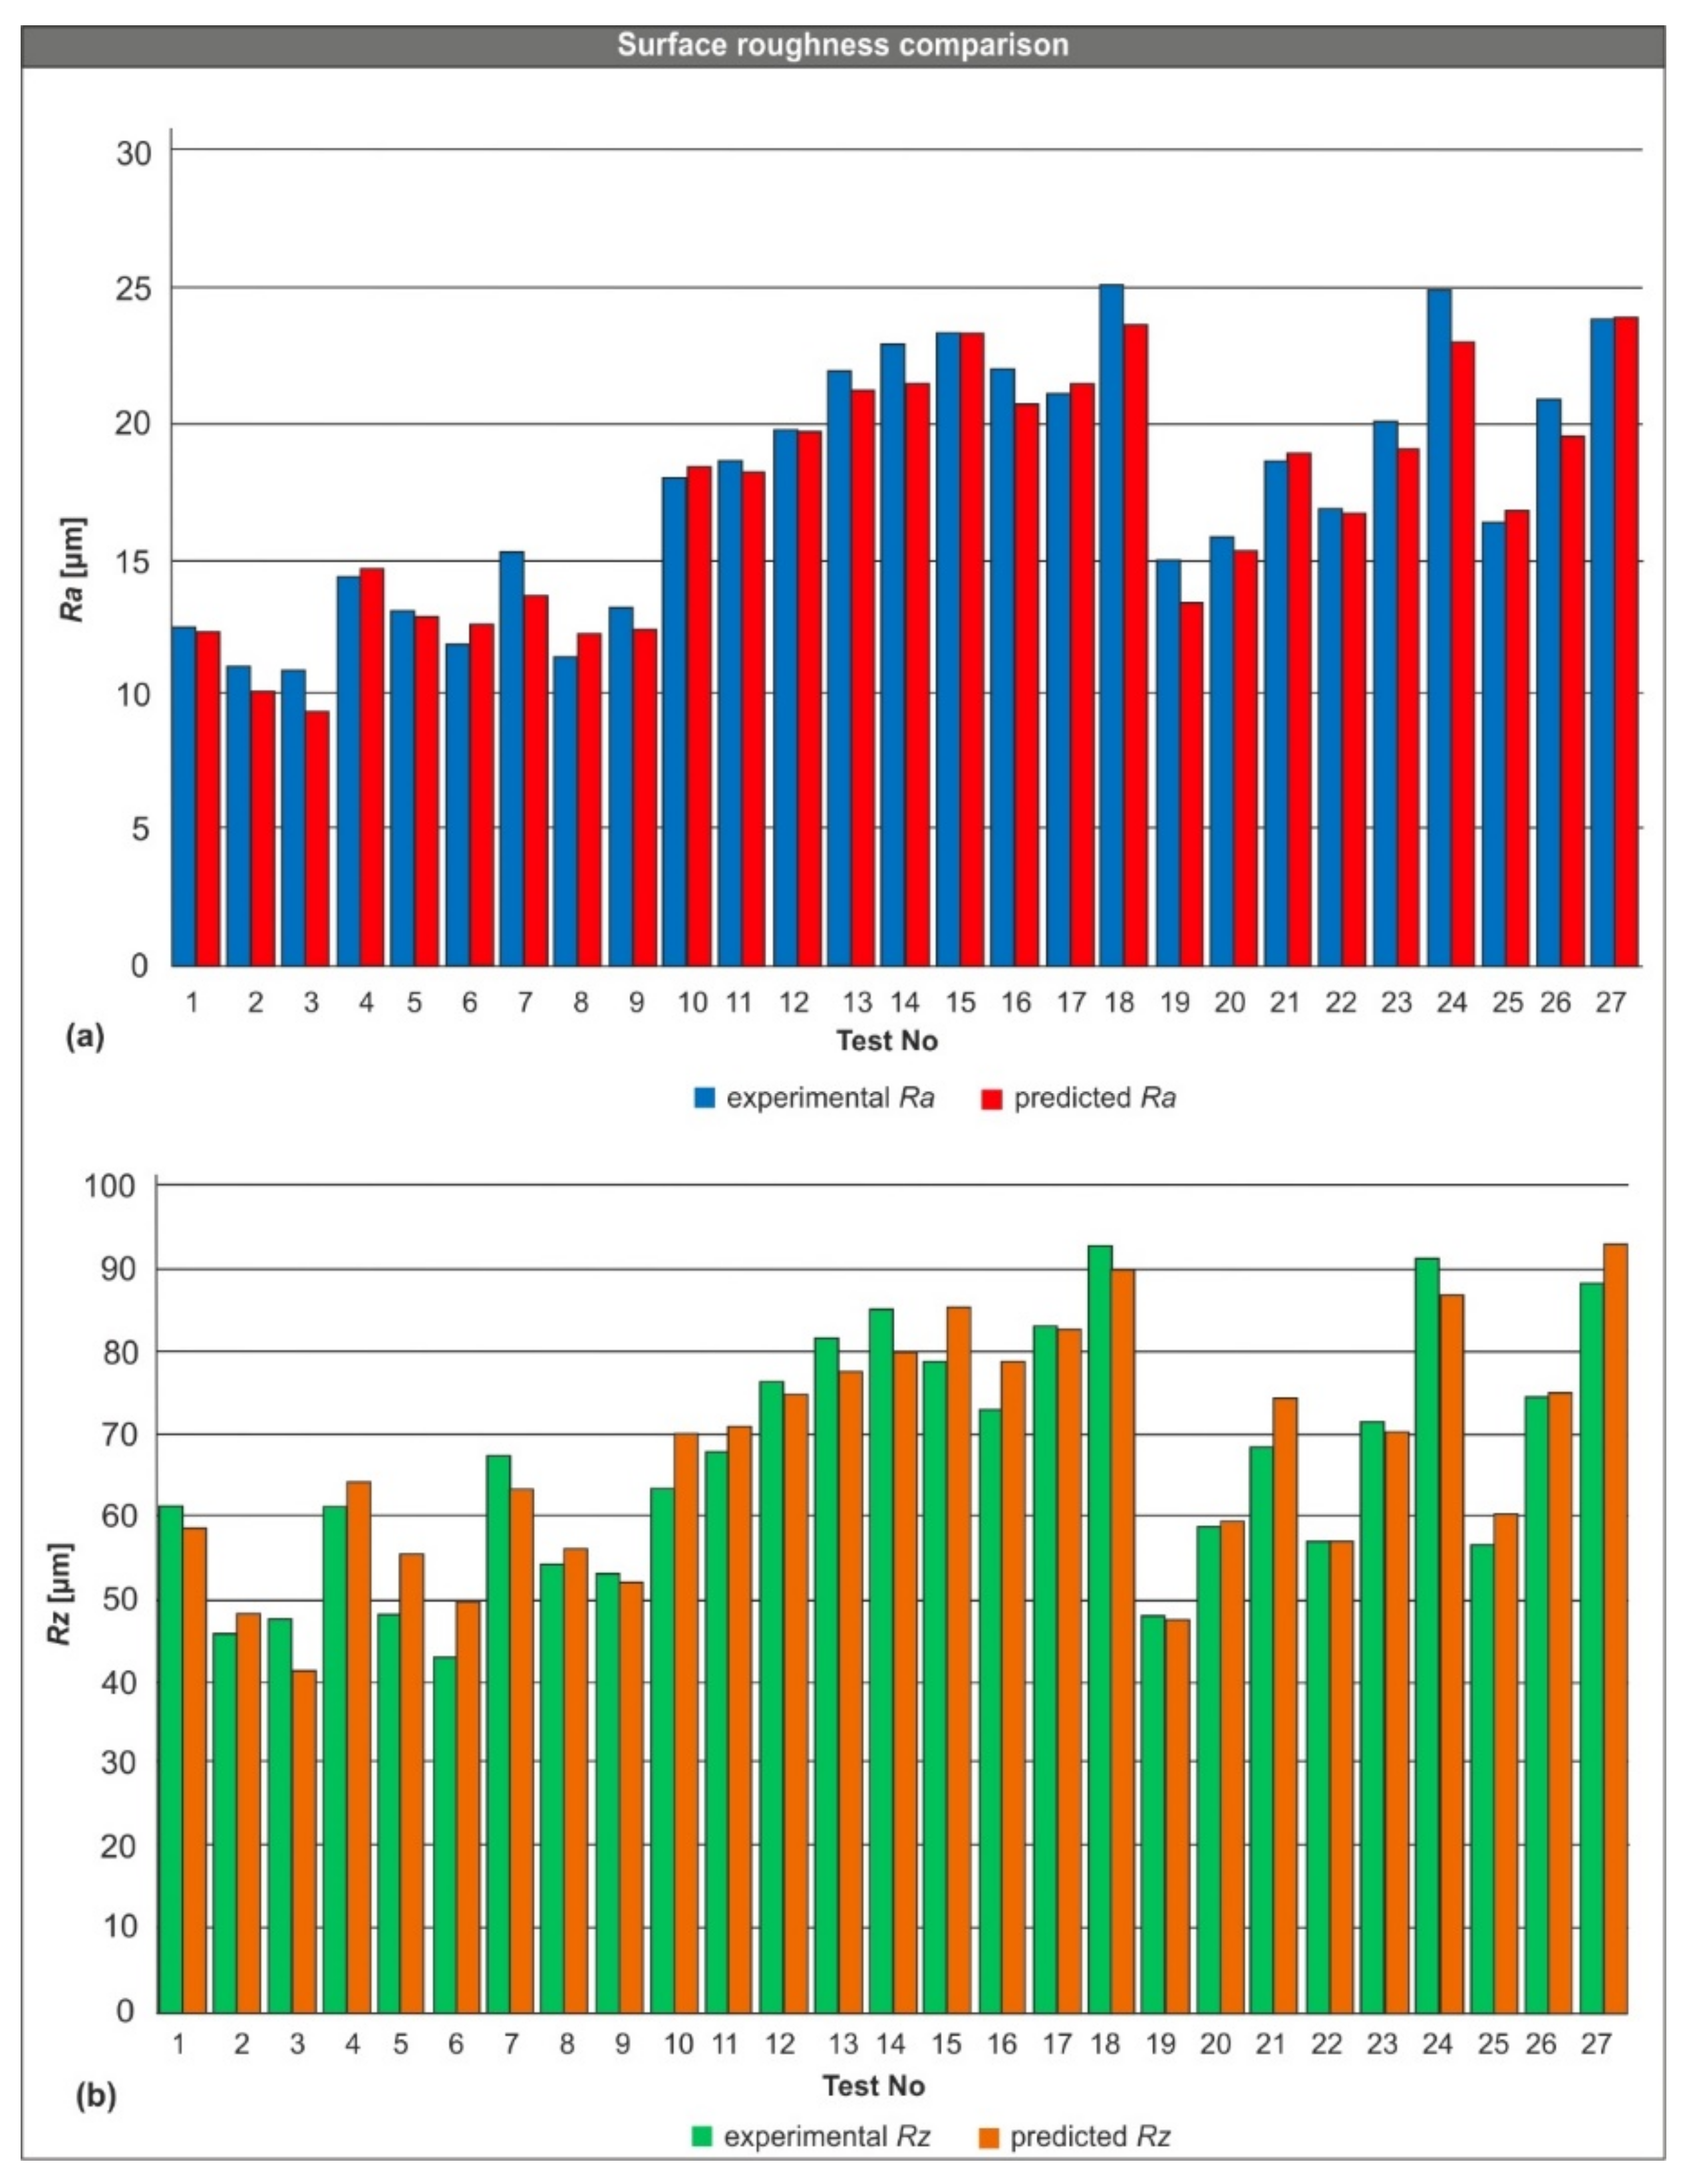
Table 1, the next charts were plotted for visualizing the comparison between the experimental and the predicted values of surface roughness, as illustrated in
Figure 4. These charts present the mean values of the
Ra (
Figure 4a) and the
Rz (
Figure 4b), for both the experiments and the prediction model.
In order to validate the models, ANOVA has been performed with a confidence level of 95%. The adjusted R-square was found to be very high in both cases (88% and 95.2%, respectively) which proves the validity of the fit. Because the used significance level was 0.05, the factors that contribute the most to the derived models are those with a
p-value smaller than 0.05. According to the values found in
Table 2, such contributors for the
Rz model are:
V,
a,
V2 and
V ×
a, all with a
p-value of 0.000 and the constant of the model with a
p-value of 0.004. Similarly for the case of
Ra, the main contributors based on the values found in
Table 3 are: the constant,
V,
a,
V2 and
V ×
a, all with a
p-value of 0.000 and
S2 with a
p-value of 0.001. The fact that the
p-value of the analysis for both cases is 0.000 further enhances the adequacy of the models. The accuracy of the models was evaluated with the utilization of a residual analysis.
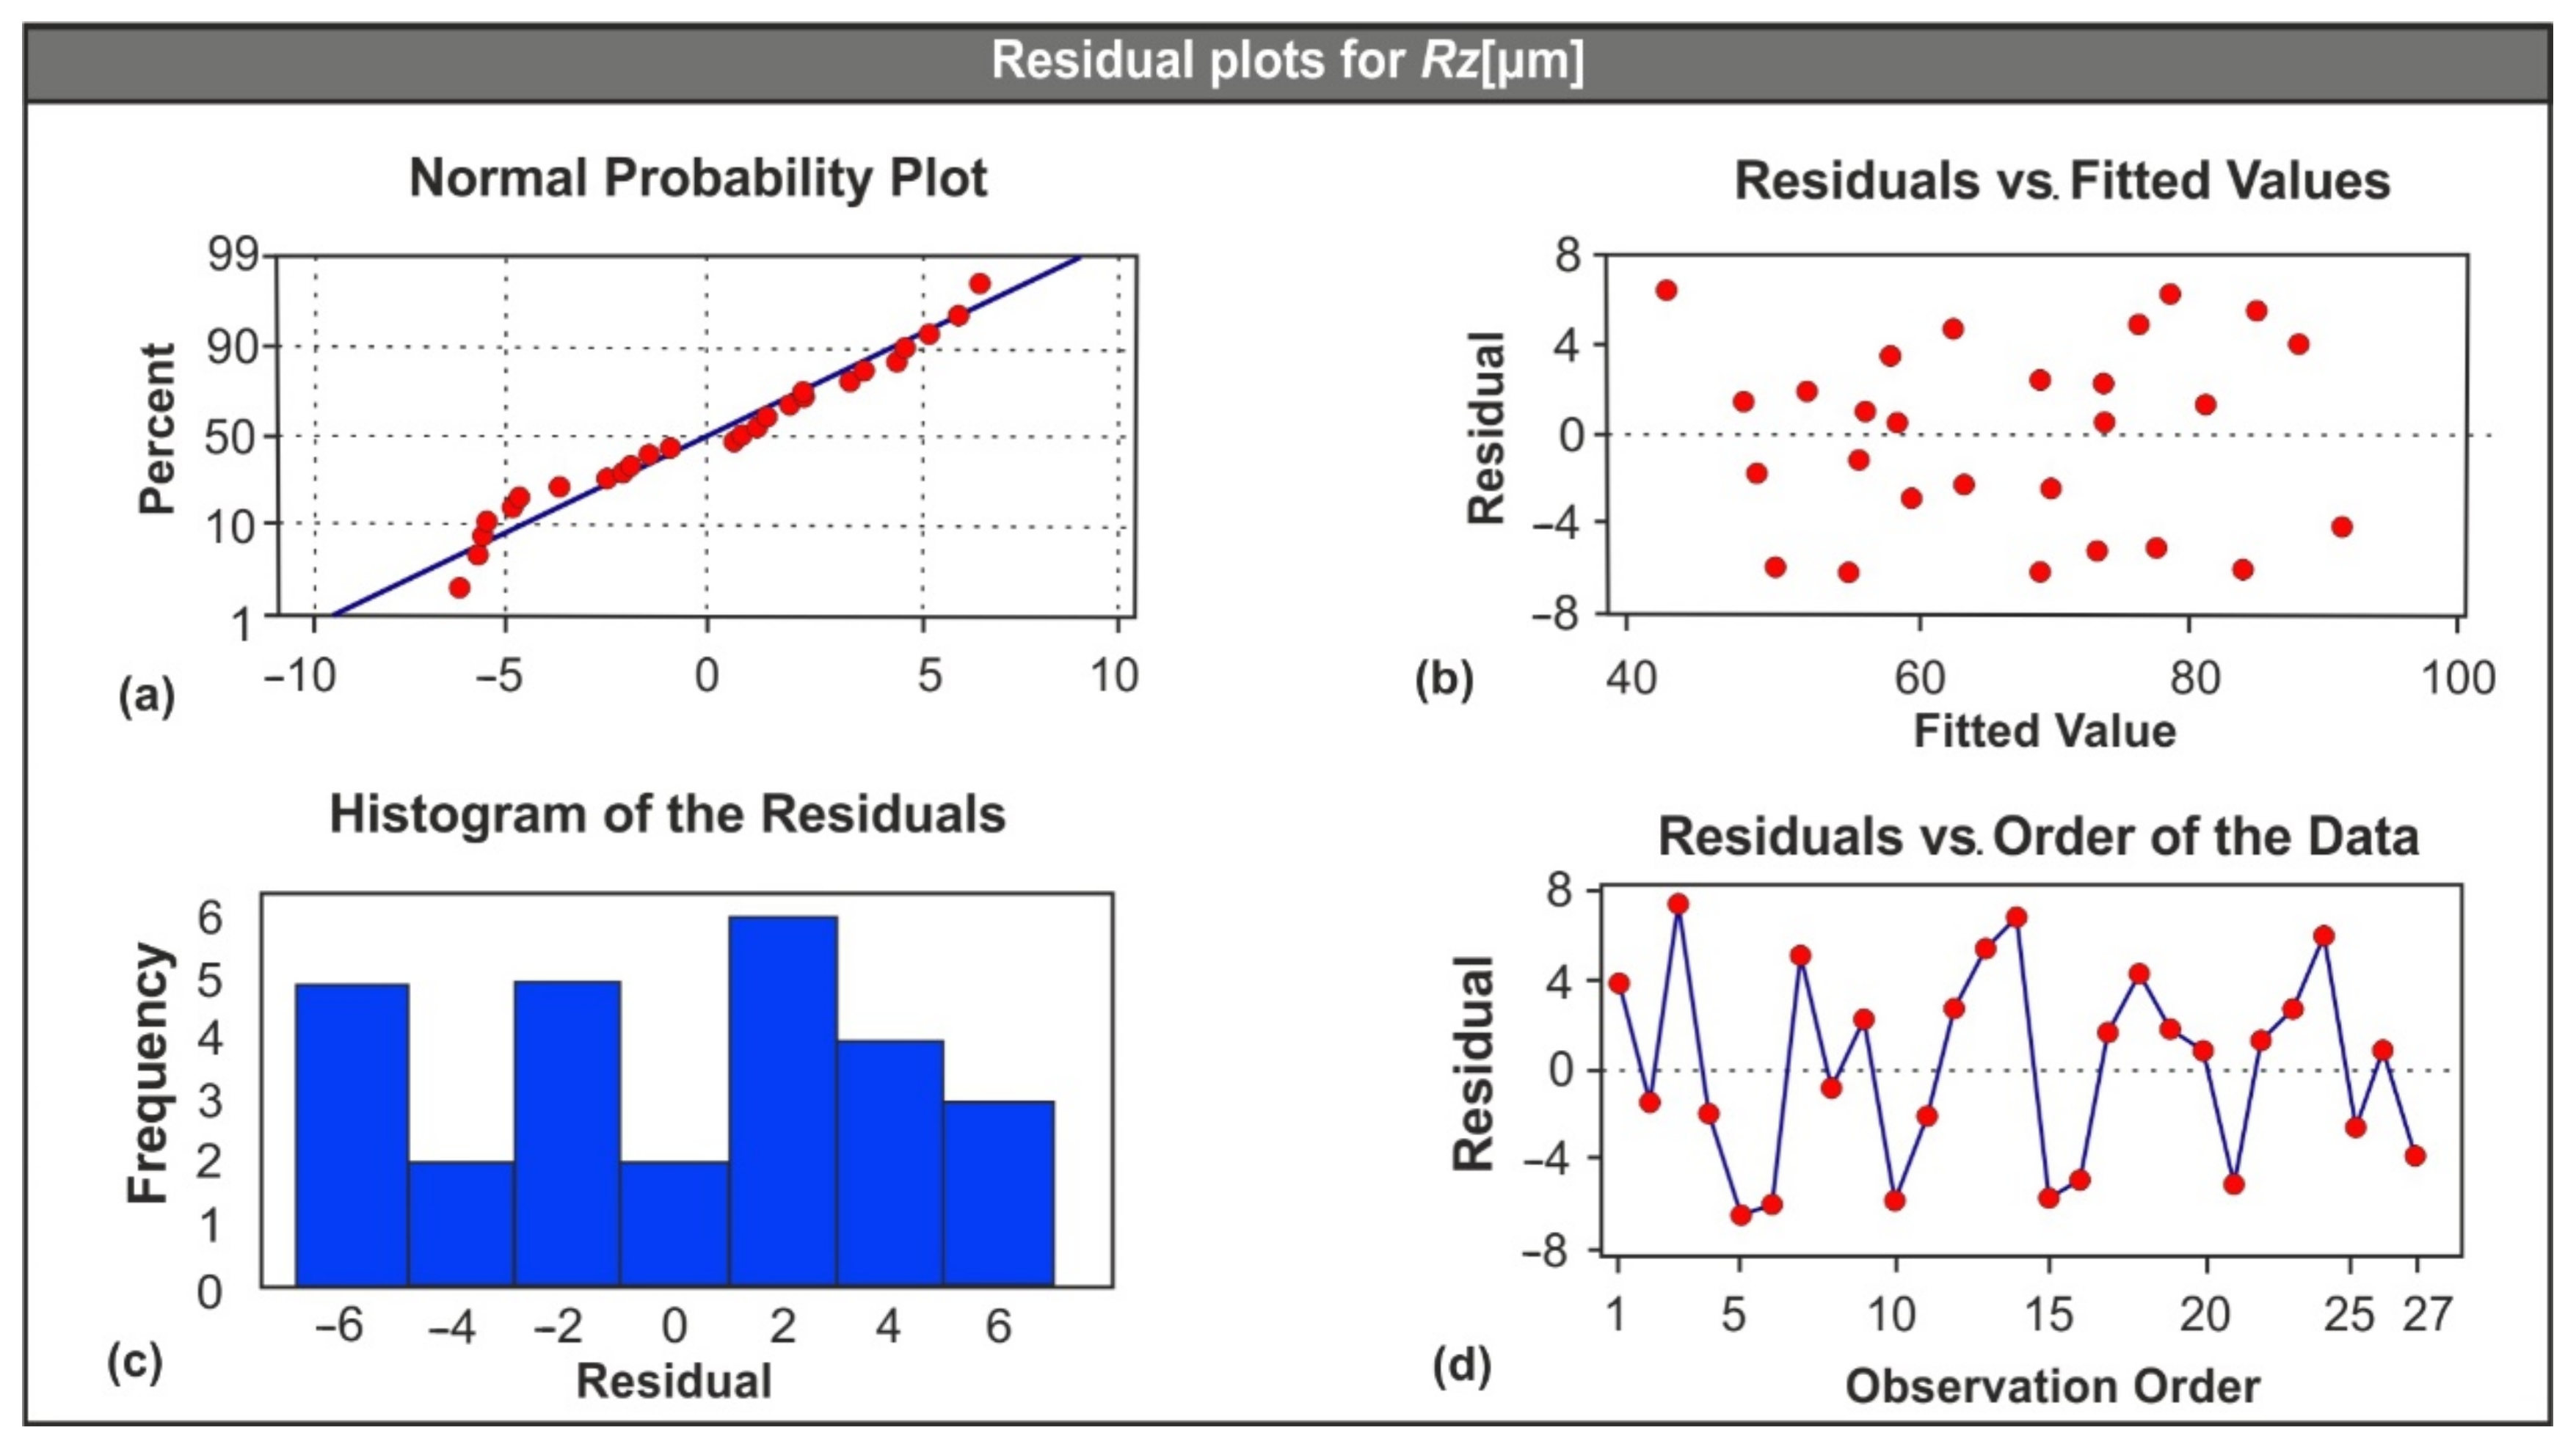
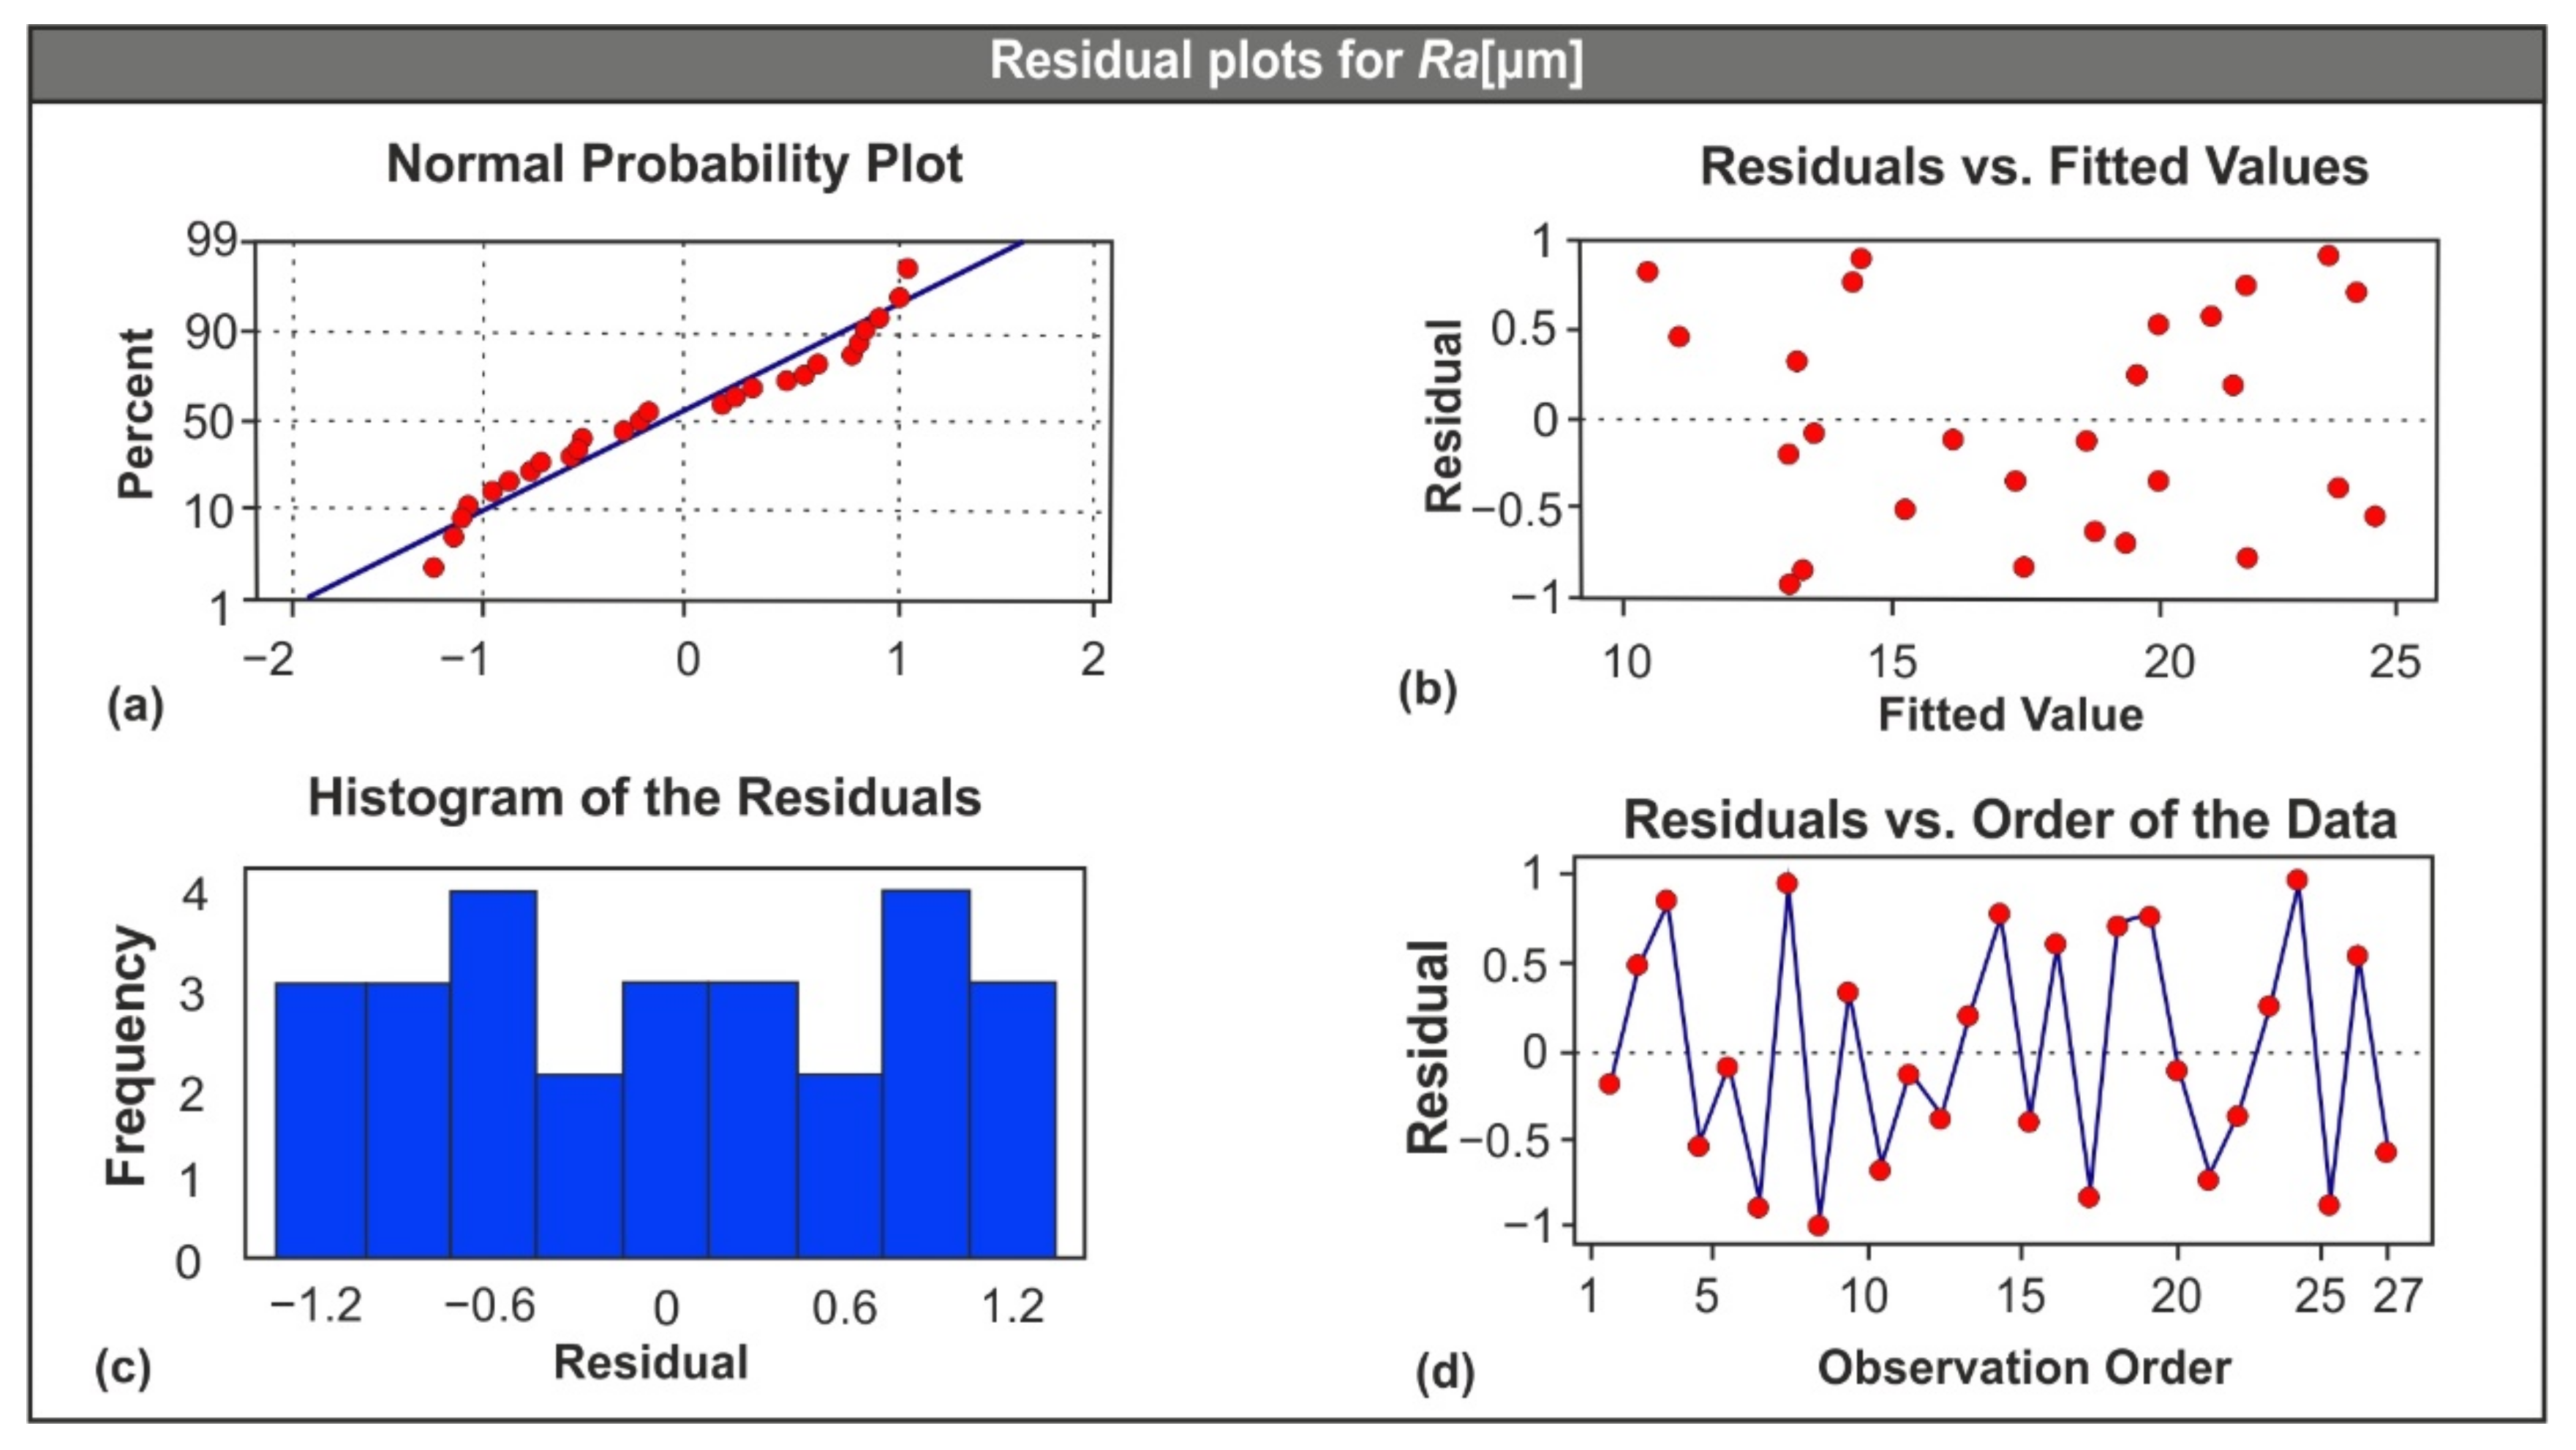
Figure 5 and
Figure 6 each contain four different graphs that relate to the
Rz and
Ra values accordingly: the normal probability plot (
Figure 5a and
Figure 6a), the residuals versus the fitted values (
Figure 5b and
Figure 6b), the histogram of the residuals (
Figure 5c and
Figure 6c), and the residuals versus the order of the data (
Figure 5d and
Figure 6d). It is obvious that all plots present a normality in distribution, which indicates a strong validity of the regression models.
The normal probability plot of the residuals for both the Rz and Ra shows that the observed values are close to the fitted line and there is no evidence of significant variation. The scatter plot of the residuals versus the fitted values for both Rz and Ra points out that the residuals do not follow any specific pattern; rather, they are scattered on both sides arbitrarily. Moreover, the residuals versus the order of the data plots suggests that there are no systematic errors present in the system.
Finally, the histogram of the residuals depicts the distribution of the residuals based on their appearance in the observations. Both
Figure 5 and
Figure 6 indicate that there is no major skewness present. Upon validation of both mathematical models with the aid of ANOVA, the model-based values of
Rz and
Ra were generated for comparison purposes.
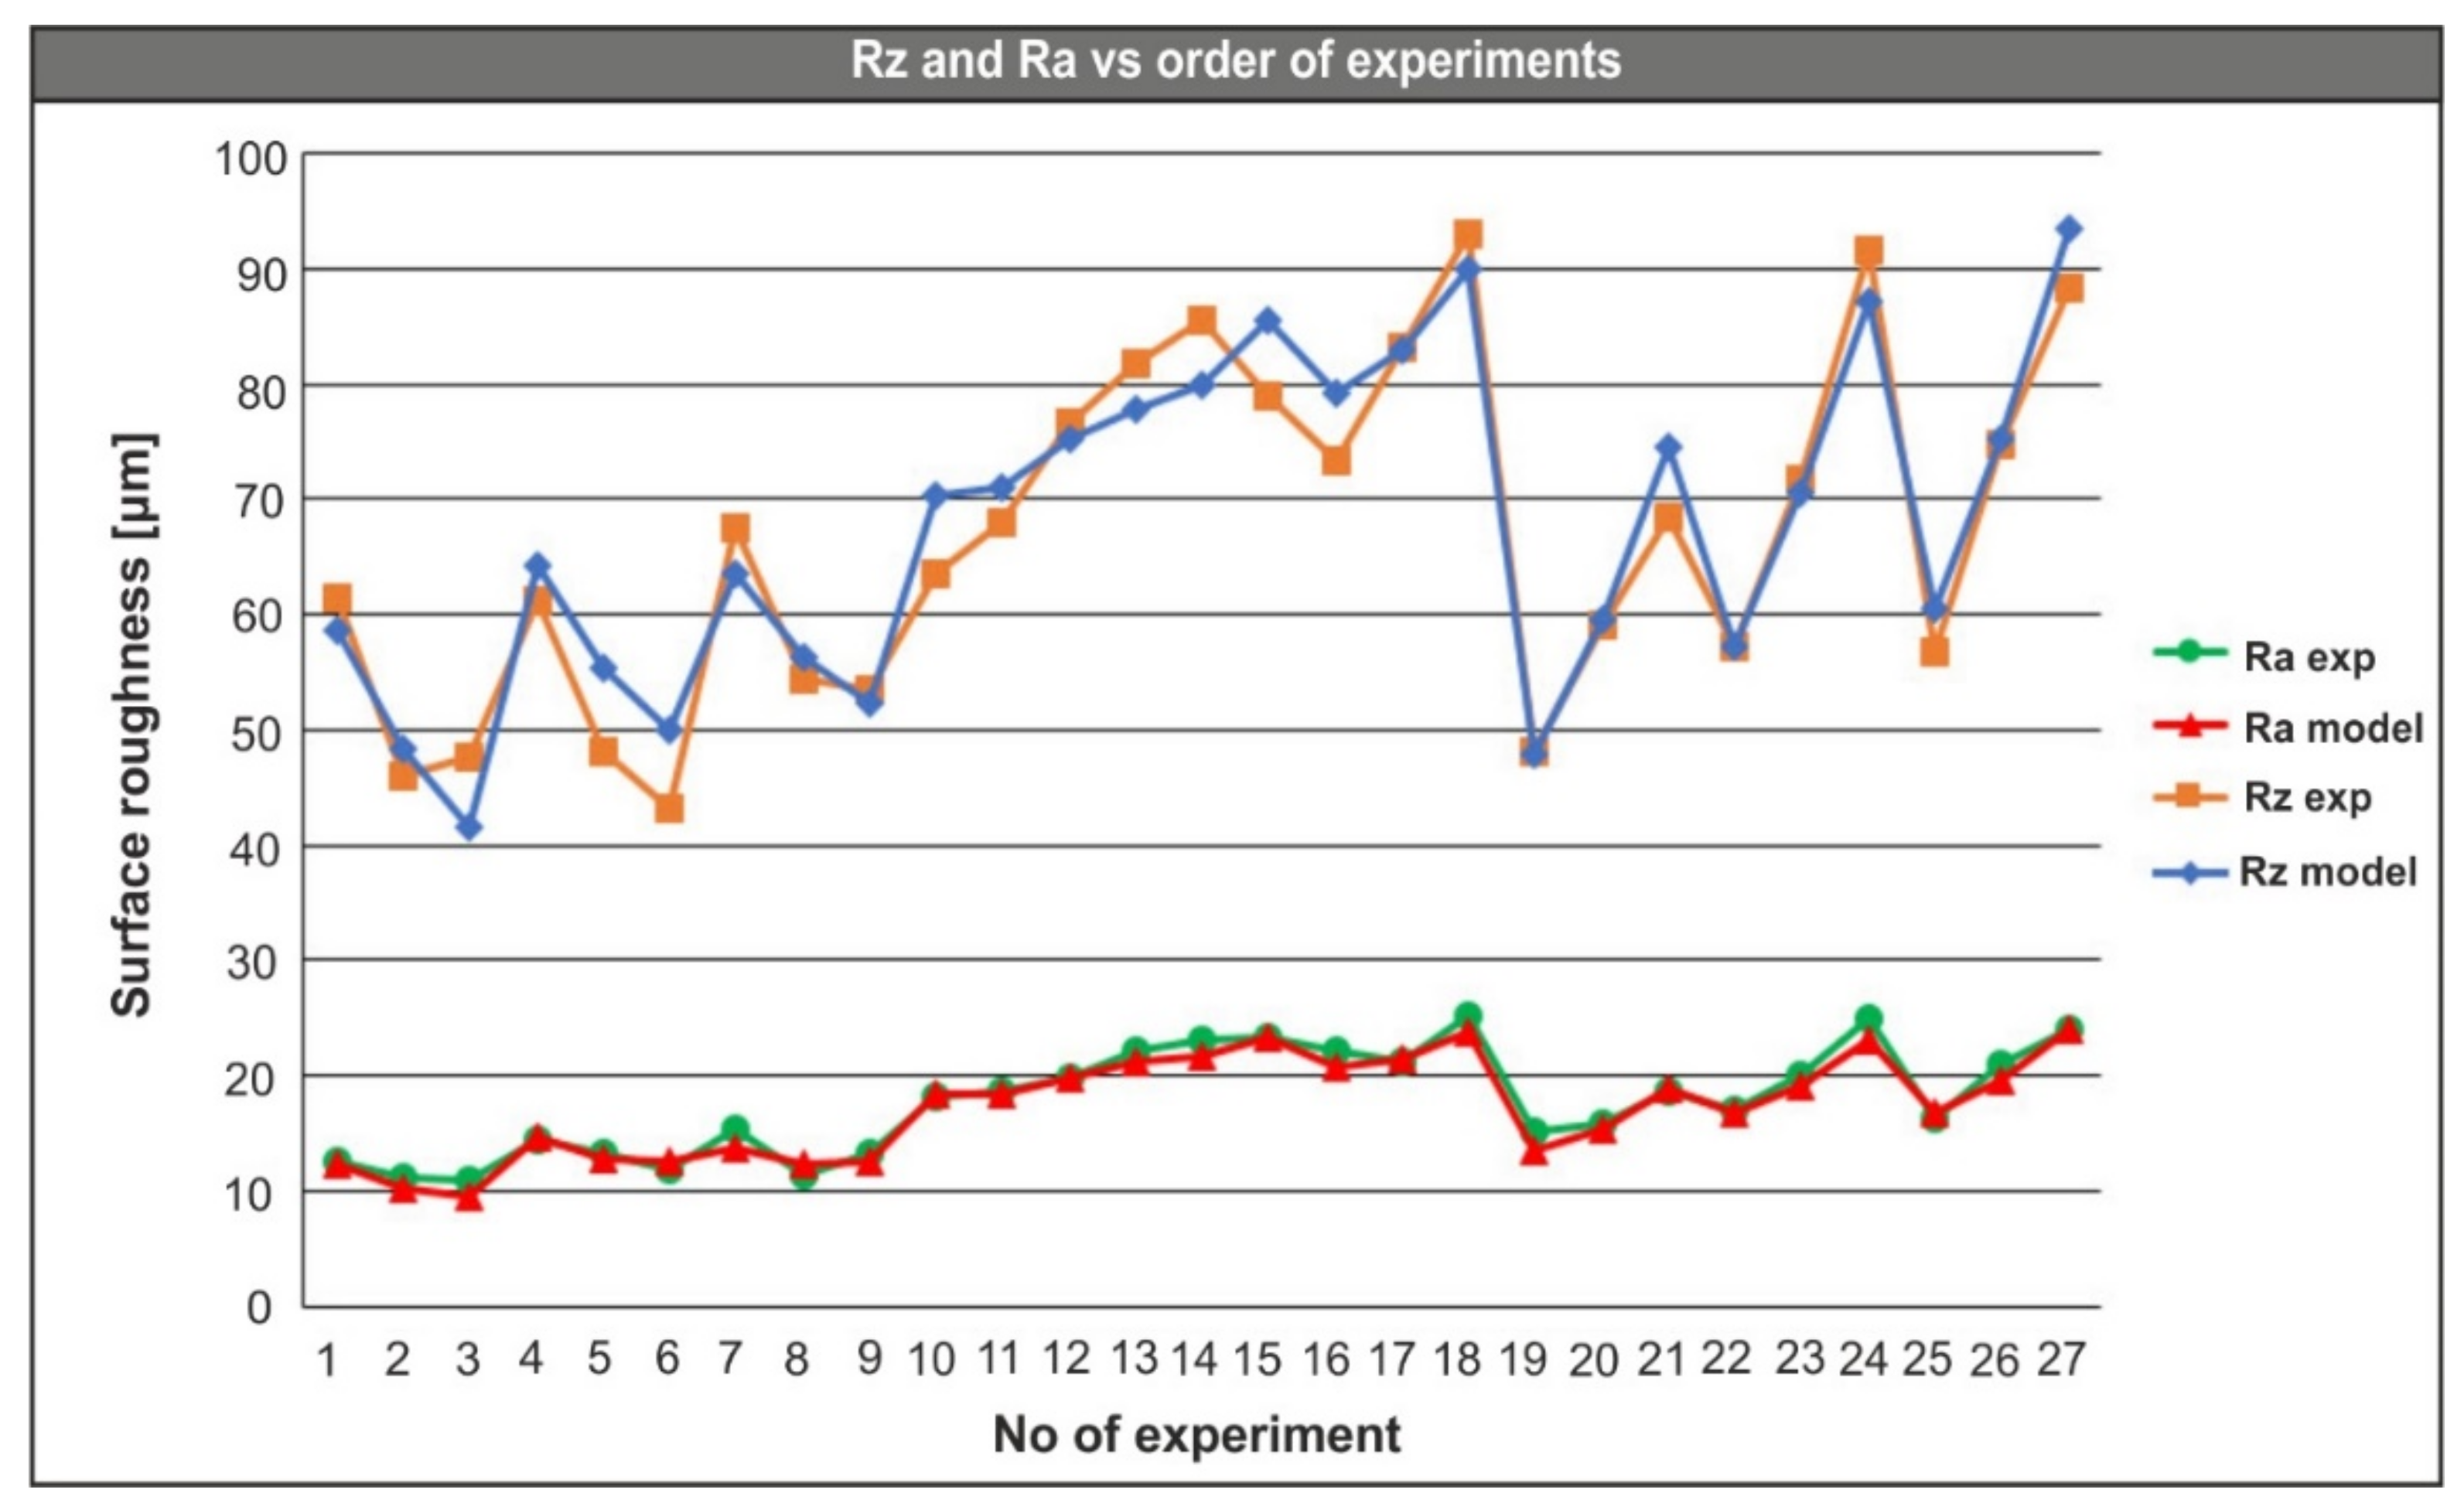
Figure 7 illustrates this comparison: the blue line indicates the modeled values for
Rz, whereas the orange line represents the experimental values for
Rz. Similarly, the red line of the plot depicts the modeled values of
Ra and the green line stands for the experimental values of
Ra. The values of all four lines in the plot follow the same order of the experiments. It is clear that the correlation between the experimental results and the modeled values is very high. The relative error for the
Rz fluctuates between −12.9% and 15.6%. However, seven cases exhibit an error at the range of −0.7% and 0.8%. Examining the relative error for the
Ra, it is found to be between −13.2% and 7.2%. In addition, an error ranging from −2% to 2.8% is present in almost half of the cases.
In addition to ANOVA, the Analysis of Means (ANOM) plots were included to visualize the statistically significant levels for each cutting parameter utilized in the present study.
Figure 8 depicts the ANOM plots for both
Ra and
Rz. It is pointed out that the means of levels one and two of the cutting speed are statistically different from the overall mean at significance level of 0.05. Moreover, the variation of each mean (for all three levels of feed and depth of cut) from the overall mean is relatively short compared to the one for the levels of cutting speed. This fact, clearly indicates the strong influence of the cutting speed to the surface roughness.
Finally, analyzing the results of this paper can lead to the following conclusions. The shift in depth of cut (either from 0.5 mm to 1.0 mm or from 1.0 mm to 1.5 mm) acts decreasingly to both
Rz and
Ra under certain conditions (
V = 75 m/min and
S = 0.1 mm/rev to 0.2 mm/rev). In contrast, for all other cutting conditions, the shift in depth of cut acts increasingly on both
Rz and
Ra. Any change in feed has notable effect on roughness. When feed shifts from 0.1 mm/rev to 0.15 mm/rev,
Ra is increased by approximately 16% on average. Similarly,
Rz increases about 11%. Additionally, as the value of feed rises from 0.15 mm/rev to 0.2 mm/rev, the effect on both
Ra and
Rz is mixed, with the percentage of change close to 10% in most cases. Other published research work reports the same trend, i.e., lower feed rates are beneficial for the surface quality of GFRP composites [
8,
14,
15]. When cutting speed changes from 75 m/min to 100 m/min, the resultant
Ra gains a significant increase of about 41% on average. On the contrary, when cutting speed increases from 100 m/min to 125 m/min,
Ra decreases about 14%, which is in accordance with other work [
20]. The same trend applies to
Rz with the equivalent percentages at 30% and 17%, respectively. Consequently, the validity of the generated mathematical models for both
Rz and
Ra is proved by the high level of fit (R-square value equal to 88% and 95.2%, respectively). Moreover, the successful fit of both models is highlighted by the increased correlation between the experimental and the predicted values of roughness; the relative error was calculated ranging from −12.9% to 15.6% for
Rz and from −13.2% and 7.2% for
Ra.
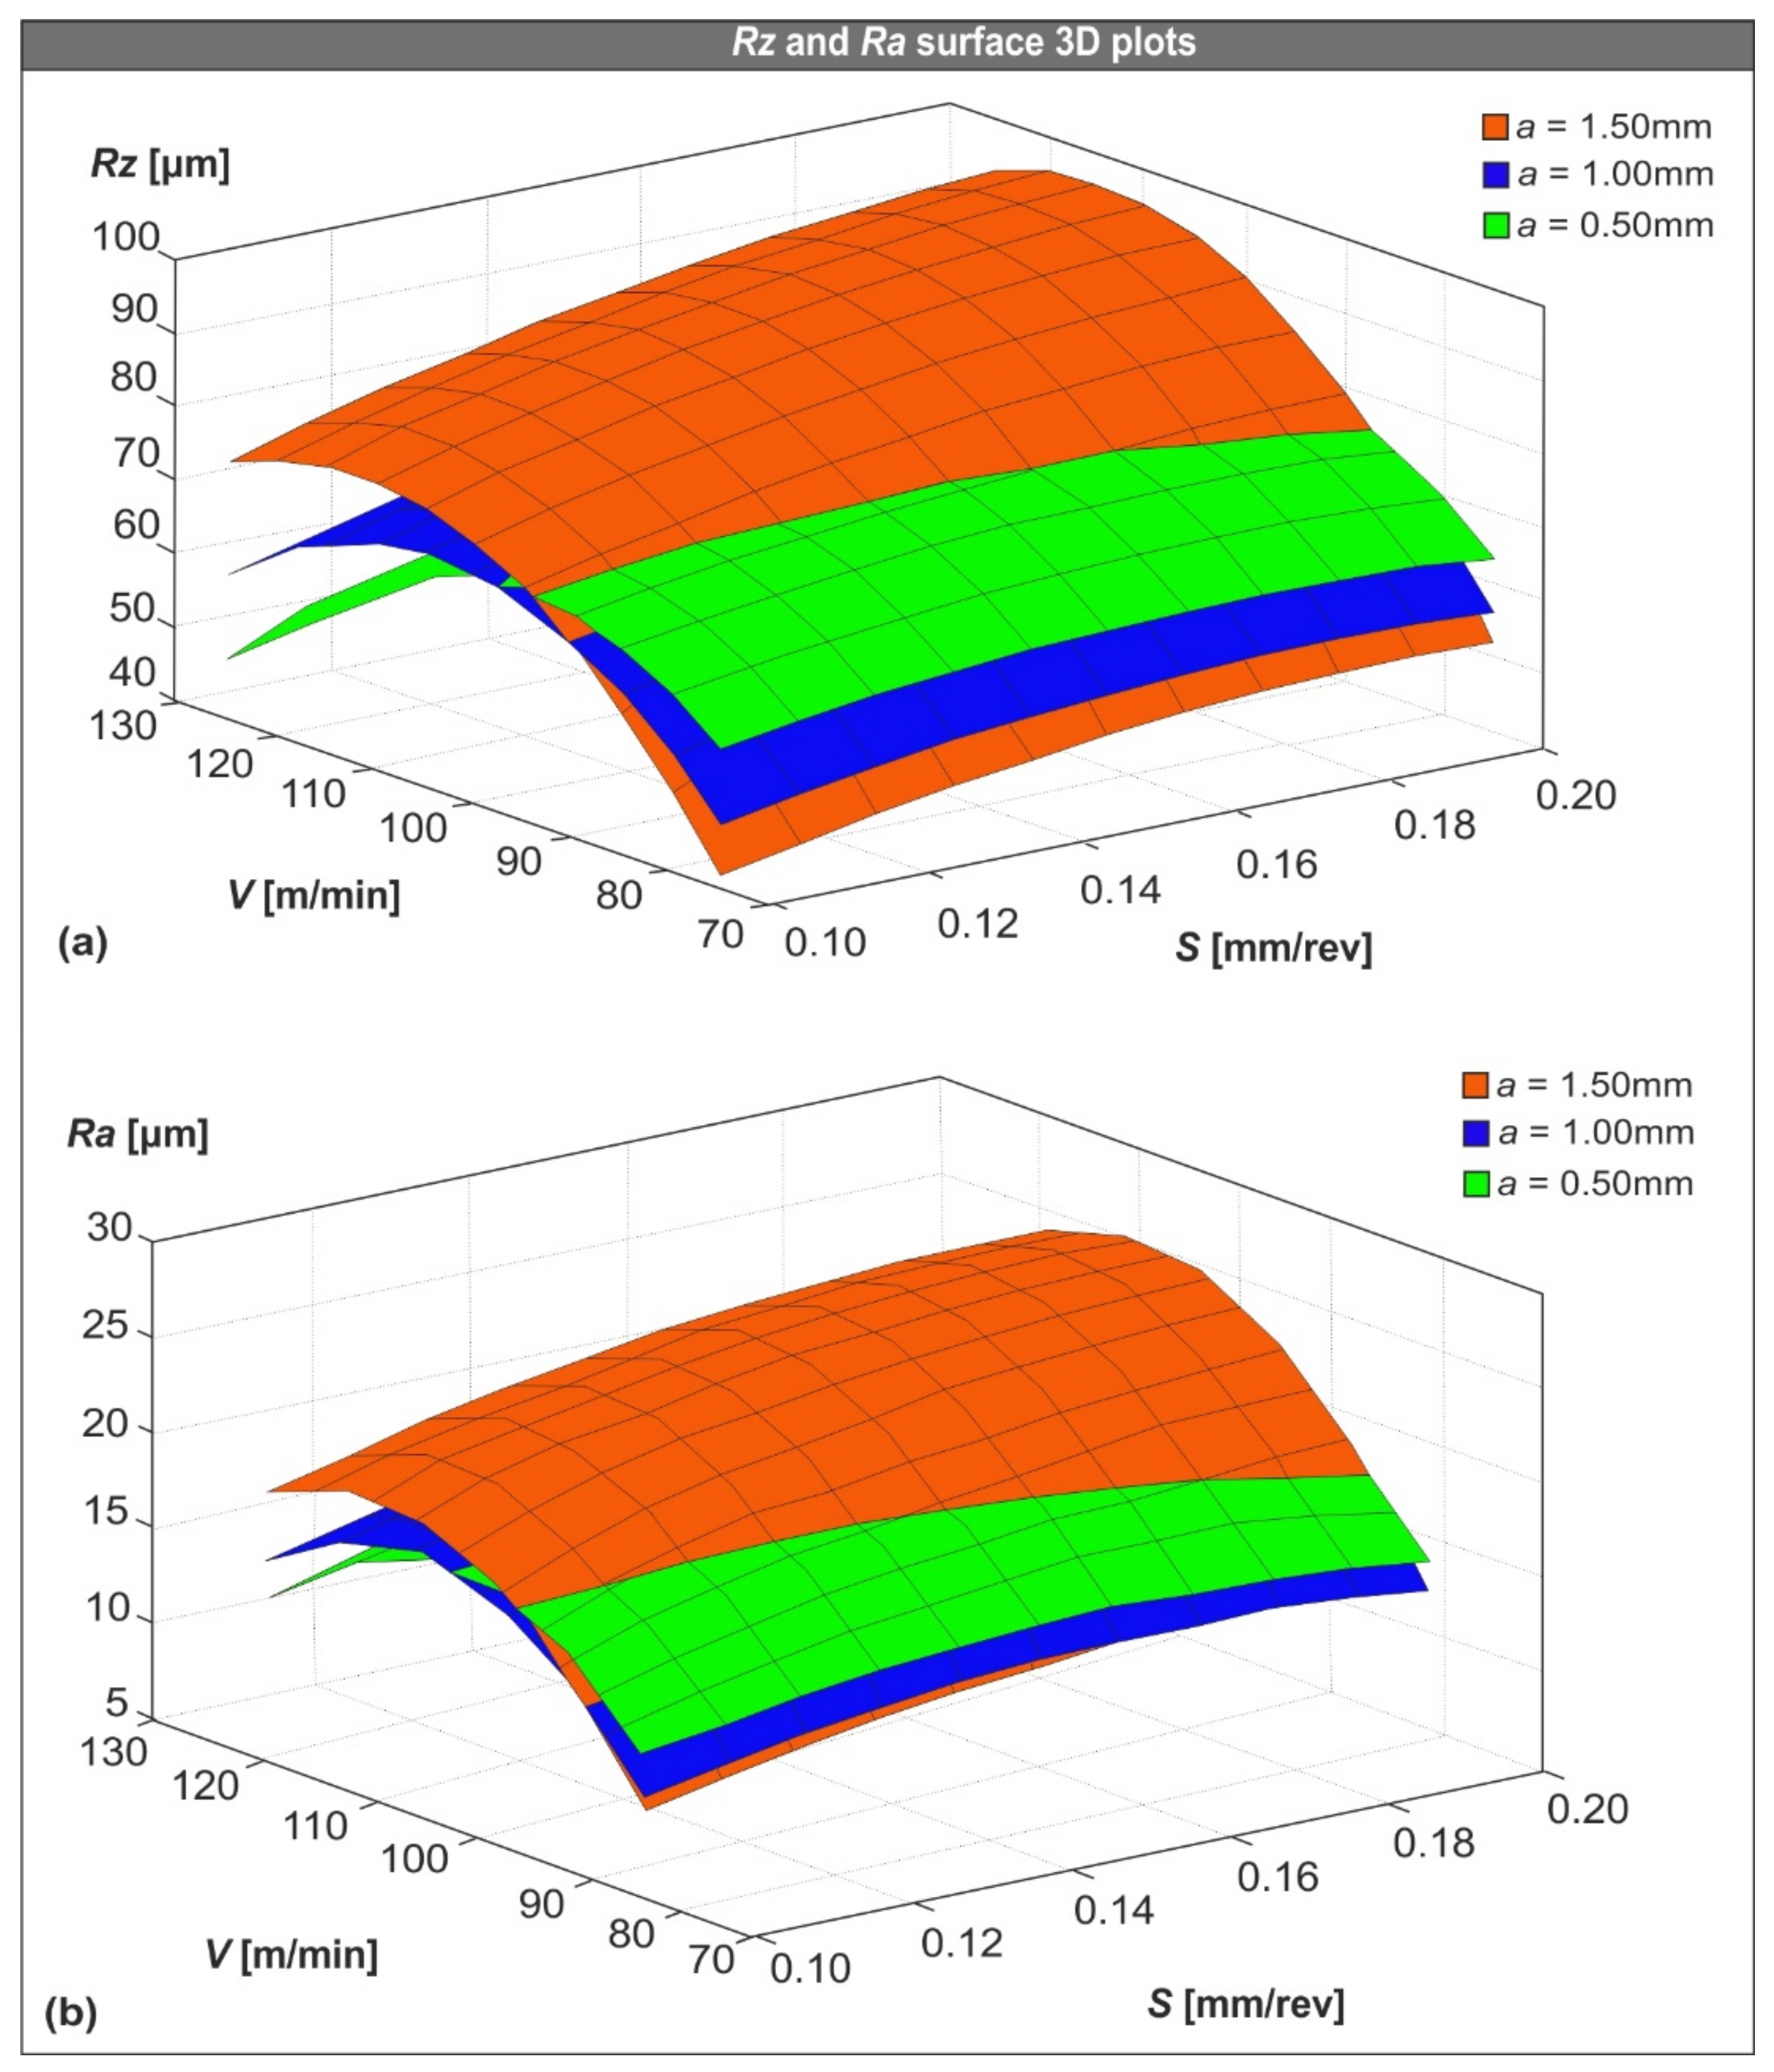
The developed prediction models were further analyzed by plotting their 3D response surfaces generated from the polynomial solutions (see Equations (2) and (3)). In other words, the data used to plot the surfaces are the ones used to solve the polynomials. Thus, the 3D plots can be used to visualize the combined effect of the investigated machining conditions (cutting speed, feed, and depth of cut) on the formed roughness.
Figure 9a,b illustrate the aforementioned 3D plots for
Rz and
Ra, respectively, at each examined depth of cut (0.50 mm, 1.00 mm, and 1.50 mm).
Finally, three experiments were performed to further examine the validity of the prediction model by utilizing randomly selected conditions from within the range of the data applied in the present study. The applied cutting conditions are as follows: Test number one (
V = 80 m/min,
S = 0.14 mm/rev, and
a = 0.9 mm), test number two (
V = 115 m/min,
S = 0.11 mm/rev, and
a = 1.4 mm), and test number three (
V = 120 m/min,
S = 0.16 mm/rev, and
a = 0.8 mm). The results are presented in
Table 4, where it is highlighted that the relative error is low for all tests.

