Article

The Possibilities of Improving the Fatigue Durability of the Ship Propeller Shaft by Burnishing Process

by
Stefan Dzionk
*,
Włodzimierz Przybylski
and
Bogdan Ścibiorski
Department of Manufacturing and Production Engineering, Faculty of Mechanical Engineering, Gdansk University of Technology, 80-233 GDAŃSK, Poland
*
Author to whom correspondence should be addressed.
Machines 2020, 8(4), 63; https://doi.org/10.3390/machines8040063
Submission received: 31 August 2020 / Revised: 13 October 2020 / Accepted: 15 October 2020 / Published: 18 October 2020

Abstract

:
Heavily loaded structural elements operating in a corrosive environment are usually quickly destroyed. An example of such an element is a ship propeller operating in a seawater environment. This research presents a fatigue resistance test performed on elements operating in seawater. Different processing parameters applied on the samples in particular were compared with the specimens whose surface had been burnished differently and they were compared to specimens with a grinded surface. The research shows that the structural elements whose surface has been burnished can have up to 30% higher fatigue strength in a seawater environment than the elements whose surface has been grinded. During burnishing, an important feature of the process is the degree of cold rolling of the material. The resistance of the component to fatigue loads increases only to a certain level with increasing the degree of the cold rolling. Further increasing the degree of cold rolling reduces the fatigue strength. Introducing additional stresses in the components (e.g., assembly stresses) reduces the fatigue strength of this component in operation and these additional stresses should be accounted for while planning the degree of the cold rolling value. A device that allows for simultaneous turning and shaft burnishing with high slenderness is presented in the appendix of this article. This device can be connected to the computerized numerical control system and executed automatic process according to the machining program; this solution reduces the number of operations and cost in the process.

1. Introduction

The propeller drive is currently a basic way of propulsion for ships and other watercrafts (fish boats, yachts, et al.). The characteristic element of this drive is the propeller placed on the shaft extending beyond the hull outline. The propeller elements work in an environment of seawater and they transmit heavy loads; therefore, they must be carefully designed and produced. They are important parts used for the safety of the ship. Unfortunately, the detailed causes of ship accidents are limited in statistical databases due to the interests of ship-owners. On the other hand, Bureau Veritas [1] presents data for the number of fatigue damages in the ship propeller shaft and in recent years, more similar failures have been recorded (in this case, there is a lack of confirmed data, while it is estimated at about several dozen per year) [2,3]. This article presents proposals for a machining method for the ship propeller shaft where the surface layer is smoothed and strengthened by the burnishing process. This process increases fatigue strength and corrosion resistance, which affects the durability and life of the propeller shaft and applies to other structural elements operating in a harsh environment.

1.1. Loads of Propeller Shaft

The failures of ship screw engine shafting are the result of shaft work in particularly harsh environmental conditions. There are, among others, the dynamic load of the shaft as well as the seawater environment. The main shaft load forces are:
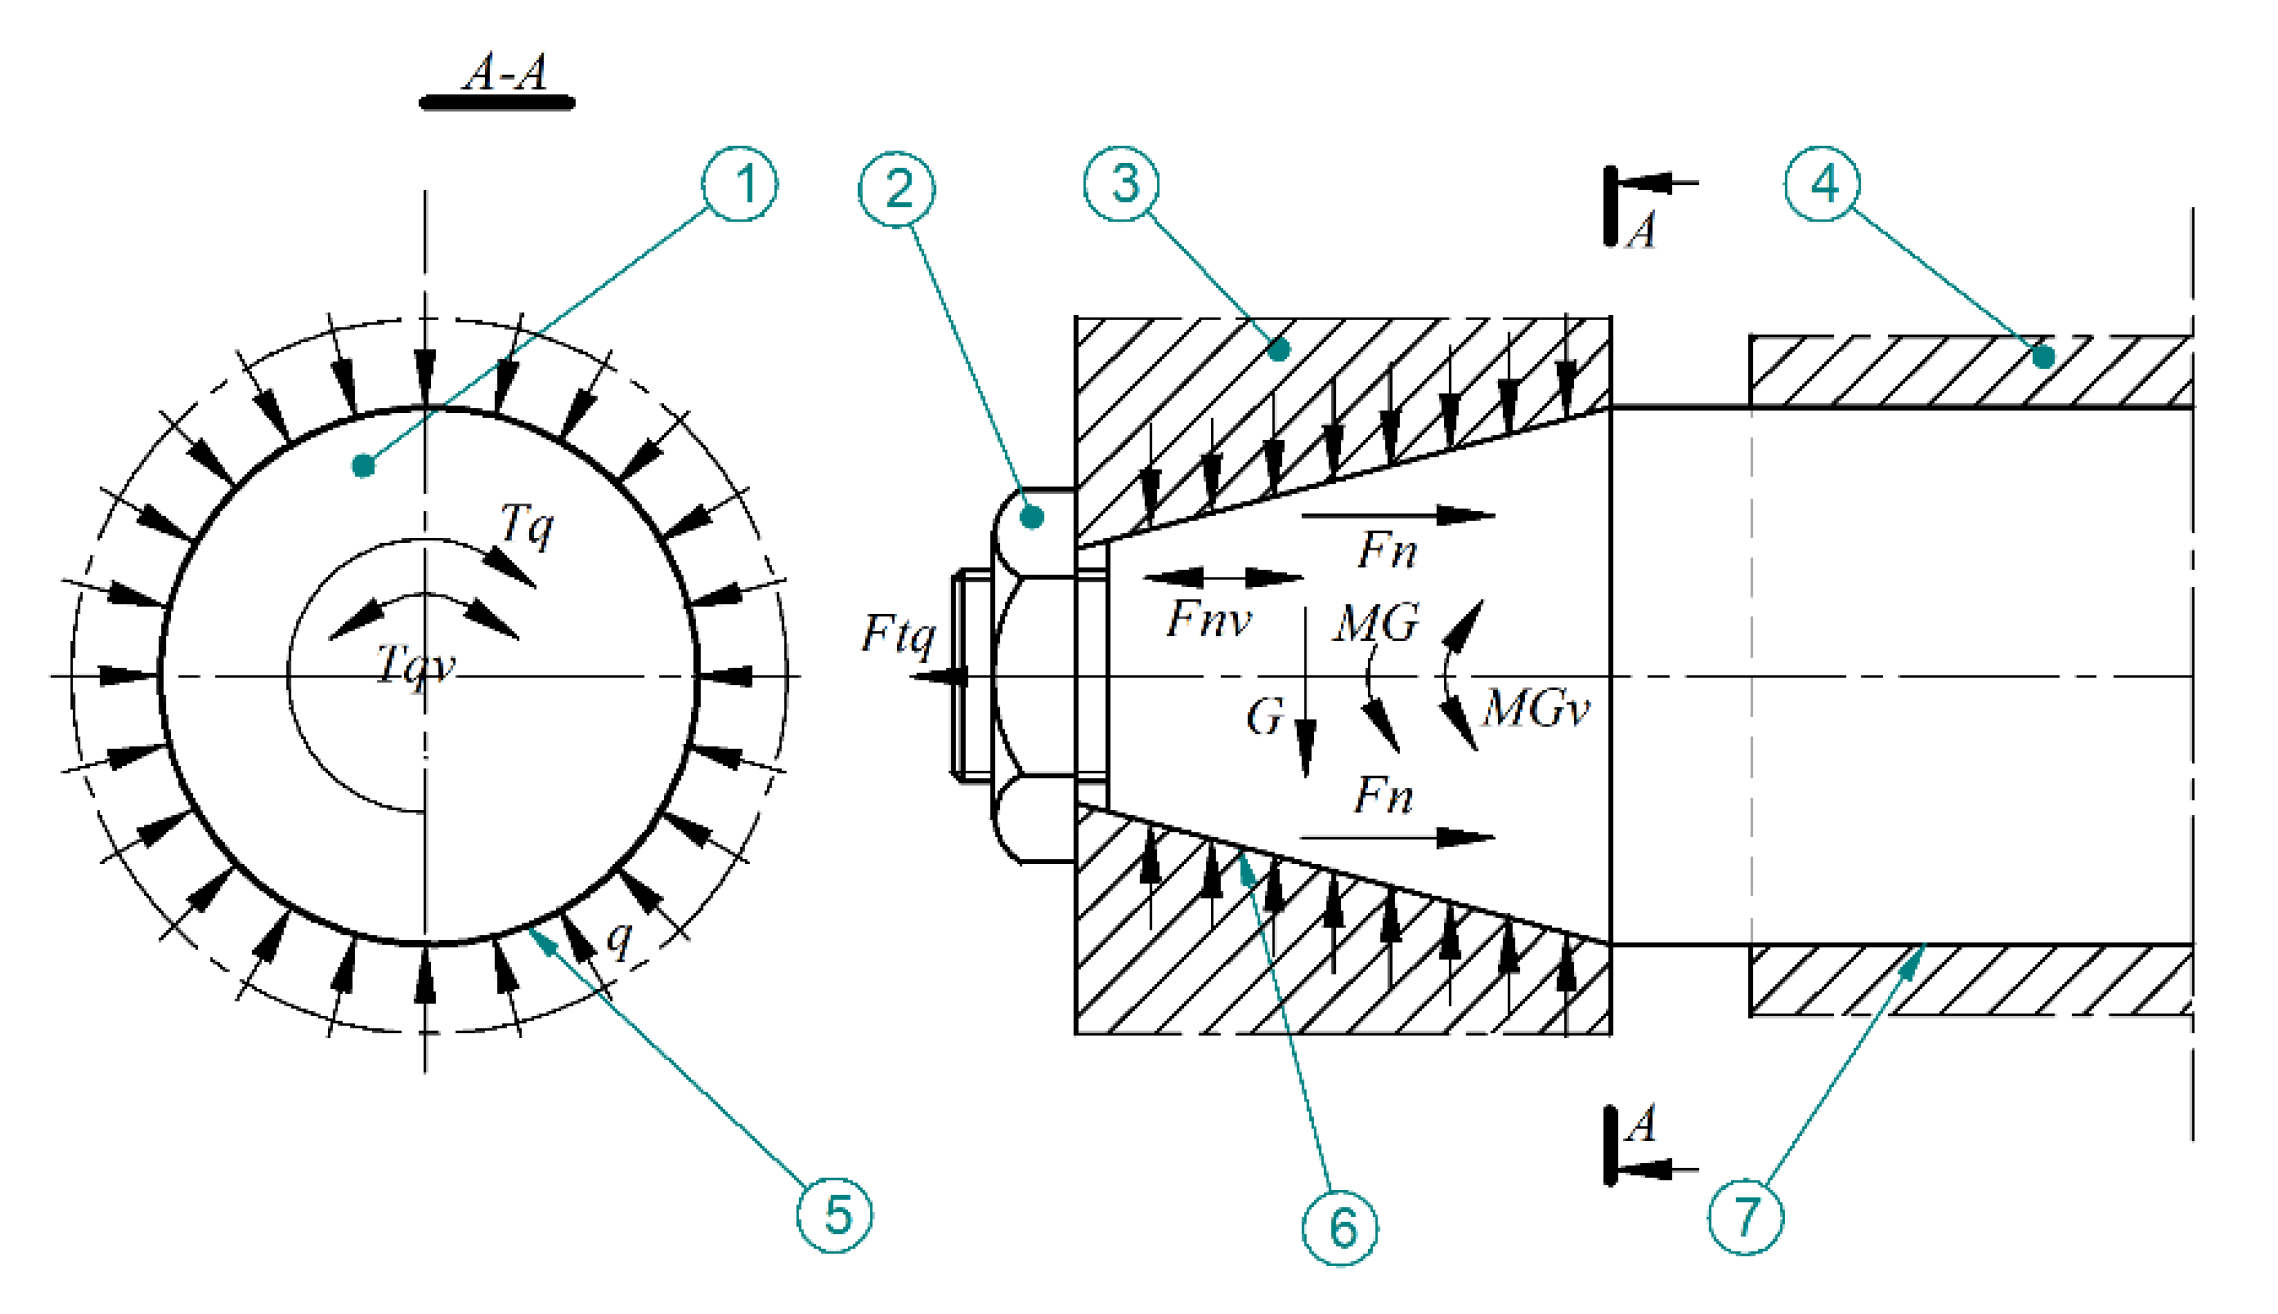
  • The torsional torque transmitted by the ship’s propulsion system;
  • Compressive stress induced by the driving force of the propeller;
  • Bending torque of the shaft from screw gravity force;
  • The loads as a result of vibration of the powertrain system.
These loads are, among others, a reason to create phenomena to expedite the destruction processes of operating elements of the propeller system. There are, among others, pitting corrosion, fretting corrosion, and fatigue cracks on the shaft surface. The scheme of occurrence of these phenomena at the screw shaft joints is shown in Figure 1.
The propeller shaft, apart from the external forces, is loaded at strengths resulting from the connection joint of the shaft and the propeller. These forces overlap with the external loads that additionally contribute to the development of the abovementioned phenomena, accelerating the process of destruction of the propeller shaft. A scheme of basic forces and moments loading the ship’s propeller shaft is presented in Figure 2.
Considering the detailed effects of forces, moments, torques, and vibration occurring in the propulsion system, it may be noticed that the propeller shaft during operation is subjected to a complex state of forces and loads [4,5]. The main load is primarily as a result of the shaft torque, which is created during the power transmission to the propeller. In addition, there are compressive forces as a result of propeller operation that makes the ship move, bending movements as a result of gravity force of the propeller, vibrations arising from a drive system operation, and others. In addition, except external forces, there are internal forces as a result of assembling the propeller and shaft. These forces create stresses in the propeller shaft, which may be the cause of creating surface flaws in the seawater environment (scheme in Figure 1). Increased resistance to the above phenomena can be obtained by surface treatment of the shaft. The literature [6,7,8] indicates that the burnishing process (described in Section 1.3) enhances the surface resistance on the different external factors.

1.2. Bibliography Review

Articles regarding the burnishing of a ship propeller shaft are rarely found in the literature. More articles can be found on other components used in the seawater environment, e.g., pump shafts [9]. The first articles on the ship propeller shafts were written in the 1960s; however, in the following years, this topic has not been addressed. This may be due to fact that this process had been used by the military and the data of this subject have not been available.
The articles [10] analyze the aspects of strengthening and smoothing the shaft surface. In the research for strengthening the process of burnishing, there is the use of geometrically different rollers, which are used for smoothing. This divides the burnishing process into strengthening and smoothing, which is related to the depth of the hardened layer. There are large discrepancies as to the optimal depth of the reinforced layer. Kudryavtsev’s study [11] suggests that this layer should be in a range δ = ~0.05r, where r—radius of the shaft.
An additional problem arose before burnishing tools were discussed in the literature [2,10,12]. This wave under the burnishing rollers during the process was being pulled. In shop floor practice, this wave may be easily pulled under burnishing tools and cause destruction in the processed surface, which brings a problem in the shaft manufacturing process. In the literature [2,10], this process is known as the “jumping wave”.
In the literature [2,10] for steals with a carbon content in the range of 0.2–0.45% as a result of burnishing, an increase in hardness in the surface layer was obtained by about 1.6 times compared to the hardness after annealing. It is stated that the depth of the burnished layer is not proportional to the obtained hardness, but depends on the diameter of the treated shaft as well as on the geometry of the burnishing element and in particular, on the curvature of the burnishing elements surface. These parameters, together with the burnishing force, create the contact form (surface) on which the depth of hardening depends.
According the literature data [2,10], a cure depth of up to 16% shaft radius may be obtained by the burnishing process. It is necessary to interpret such data carefully because the process of deep hardening of the propeller shaft may cause flaking of the material on its surface. This type of flaw is found in the literature and it is recommended that the shaft surface should be turned or grinded until the removal of this defect and then, the burnishing process is repeated.
In the analyzed articles [13,14], the value of burnishing forces was determined by the Hertz method. This method of burnishing forces determination is not accurate because it is difficult to find the contact area between the tool and the shaft and it is mainly used for single pass machining.
There is very little detail in the literature on the corrosion resistance of burnished surfaces. The available research [7,8,9,10,11,12] shows that the corrosion resistance of the burnished surface depends on the degree of the cold rolling and, similarly to the fatigue strength, it begins to decrease after exceeding the optimal value. As the corrosion resistance also depends on the type of material and the operating environment, it is difficult to predict its value.
Outside the field of marine technologies, the literature on the fatigue strength of burnished elements is not very large. The research is conducted for various techniques [15,16,17,18,19] (burnishing, shot-peening) and materials (stainless steel, nonferrous materials). The comparative analyses of the low plastic burnishing with other technologies in terms of fatigue strength can be found in the literature [16,18]. The results presented in this work show that the burnishing process increases the fatigue strength the most, while there is no information about the limitations concerning low plasticity burnishing. In this research, an increase in fatigue strength to 52% was achieved [17]. In addition, the research is carried out on other processing modifying the surface layer [20] (e.g., laser peening) to improve the properties of manufactured parts.
Recent publications [3,21] indicate that the problem of fatigue strength of marine vehicle propeller shafts is still valid. It is known in the literature [12] that the burnishing treatment improves the surface quality and increases the fatigue strength of the manufactured part, while too high cold rolling range causes the surface to flake and deteriorate its strength. However, there are no precise data on the optimal degree of cold rolling level in relation to the maximum fatigue strength. In addition, the load on the part and the environment in which a given element is operated significantly affects its fatigue strength, while there are few such studies in the literature.
The flaking of the surface after the burnishing process disqualifies the usefulness of the workpiece. On the other hand, the burnishing process increases the fatigue strength only to a certain degree of material cold rolling. The optimum cold rolling value (which maximally increases the fatigue strength) is much lower than the value when flaking occurs and also depends on the operational stresses which will be present in the part. There is a lack of details in the literature on the possible range of the burnishing parameters which could increase the fatigue strength of the workpiece. The lack of this information limits the use of the burnishing process because then it is easy to exceed the optimal degree of cold rolling, which results in lower fatigue strength as compared with its expected value. The aim of the research is to present the possibilities of increasing the fatigue strength of components working in seawater by surface burnishing, also presenting the limitations of this process. As the problem of fatigue strength of marine vehicle propeller shafts is still valid and described in the literature [3,21], the results of the presented research may be useful in designing components for marine vehicles or other applications in the area of ocean technology. The purpose of the article is to test the fatigue strength in seawater of the burnished samples. The results can be useful in designing components for marine vehicles and other applications in ocean technology.

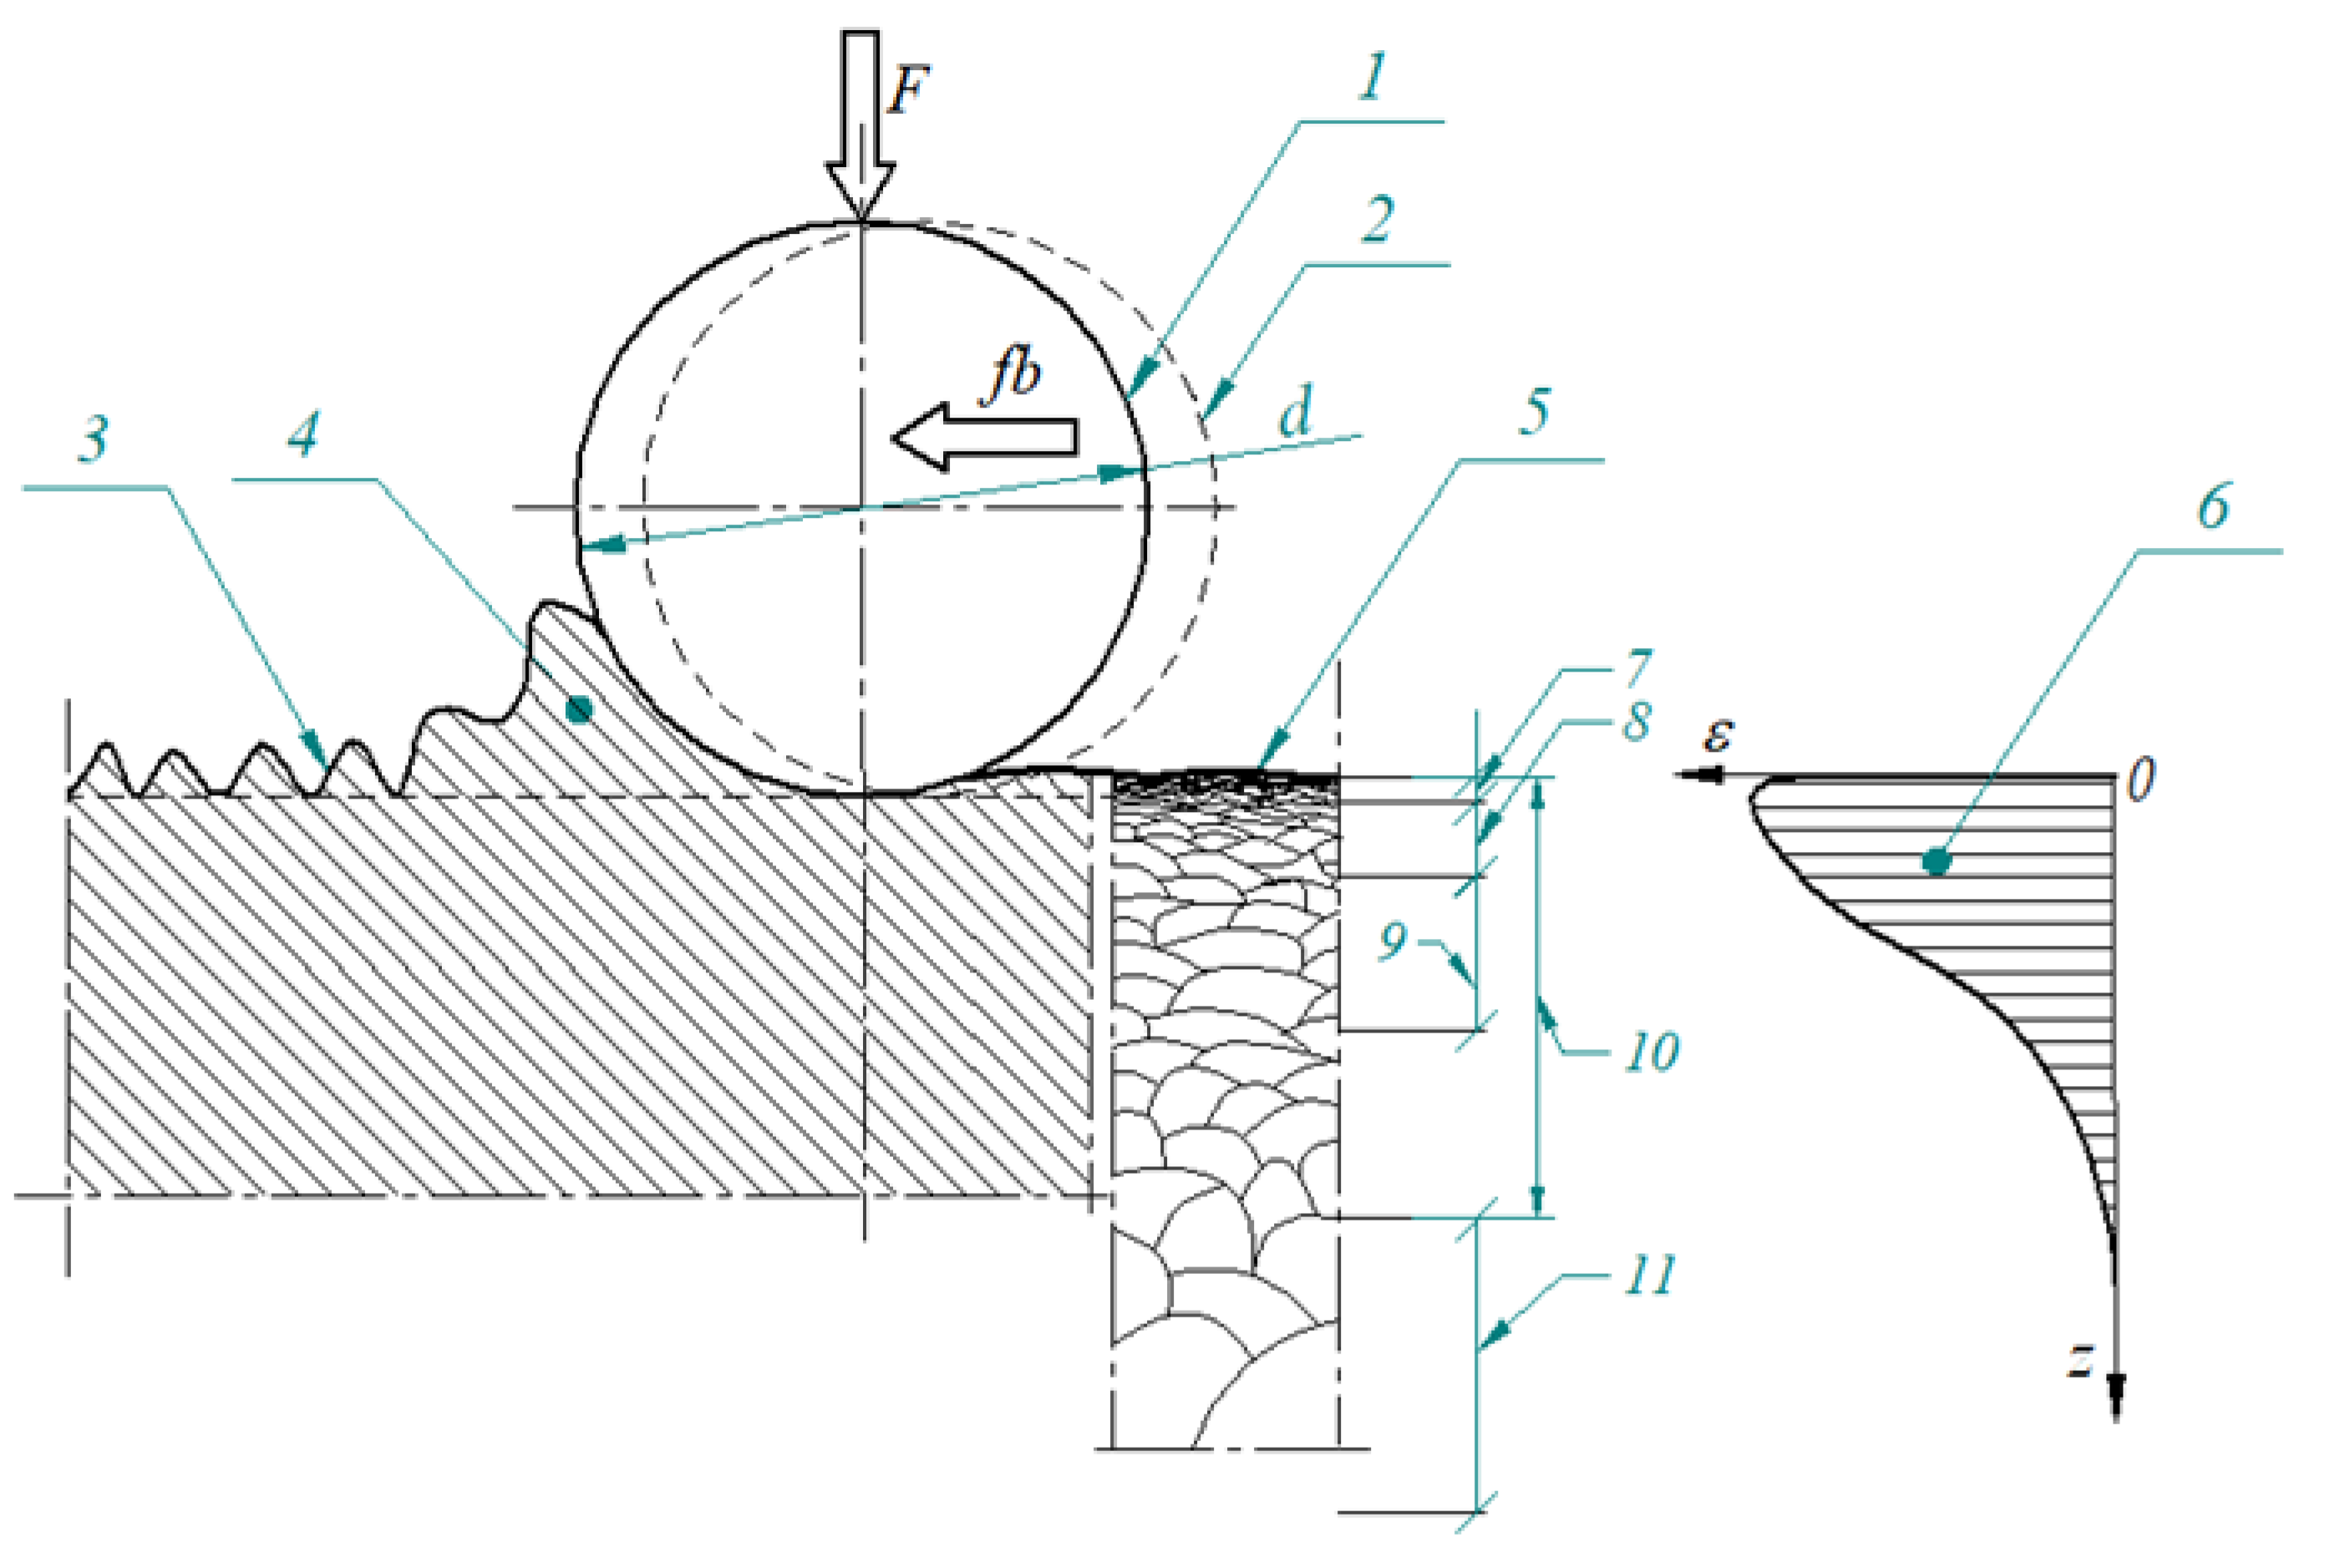
1.3. Introduction to Burnishing Process

The low plasticity burnishing process consists of plastic deformation of the processed surface [12,22,23]. A scheme of this process is in Figure 3. The processed part during plastic deformation is shaped by the tools, which can be rolling or slipping elements, whereby these types of processes are called rolling or sliding burnishing. In rolling burnishing, as working elements roller balls, barrels, and rollers, et al., are used. These elements are usually made from very hard material such as hardened tool steel, sintering carbide, technical ceramic, et al., whereas sliding burnishing tools are usually made from diamond (not using to ferrous materials), regular boron nitride, or other very hard materials. The working surfaces of these tools are usually shaped in the form of a sphere or another similar configuration (for example, paraboloid). The plastic deformation during the burnishing process causes a reduction in the roughness of the surface and moreover, the surface layer of the burnished element also has been strengthened. During this process, the structure of the material changes in the surface layer. The grains of the material are deformed and displaced along the surface to form a surface layer of the different mechanical proprieties in relation to the core, such as hardness, strengthening, et al. Moreover, cold working introduces additional compressive stress into the surface layer.
The zones of the surface layer diversified in terms of the properties and structures are shown in Figure 3. The roughness zone includes the range of irregularities of the surface created as a result of processing. The cold plastic deformation process changes the structure of irregularities, mainly by reducing their shape and height. The next zone in the literature [22] is characterized as the grain fragmentation zone, where the material grains were crushed and moved along surface. This zone characterized high hardness and high compressive stresses. Planning the technological process, it should be taken into account that too much deformation degrees and displacement of the material may cause the formation of microcracks in this zone, which may subsequently cause flaking. The graph of strain of the material during the burnishing process in the surface layer is schematic and shown in item 6 in Figure 3.
The next zone is a plastic deformation zone. In this zone, the grains are not crumbled but only plastic deformed and an elongated shape is obtained. In this zone, slight material strengthening occurs and increased hardness and also compressive stress take place. Machining parameters, including the burnishing force, determine the depth of changes in the surface layer of the workpiece and also influence the thickness of particular zones. In the elastic deformation zone, the material is only elastic deformed as a result of the stresses there.
The surface is processed in this way, usually characterized by increased resistance to fatigue loads as well as increased corrosion resistance. The cold rolling degree determined by the burnishing force cannot be too high because it causes surface cracking and next, degreasing of flakes on the burnished surface. This phenomenon in the initial stage is invisible, while damaging the surface and causing a decrease in quality of the processed parts because the fatigue strength corrosion and resistance rapidly go down.
Another phenomenon occurring during the burnishing of soft material (up to 40 Rockwell scale) is the wave of material forming in front of the burnishing tool and moving with it (item 4 in Figure 3). The size of this wave increases with the distance of the tool path. It happens that too large a wave is pulled under the burnishing elements; this causes destruction of the burnished surface. This phenomenon is known in the literature [2,10] as a jumping wave. Usually, counteracting this phenomenon consists of using an additional cutting tool that reduces the excessive size of wave creation.

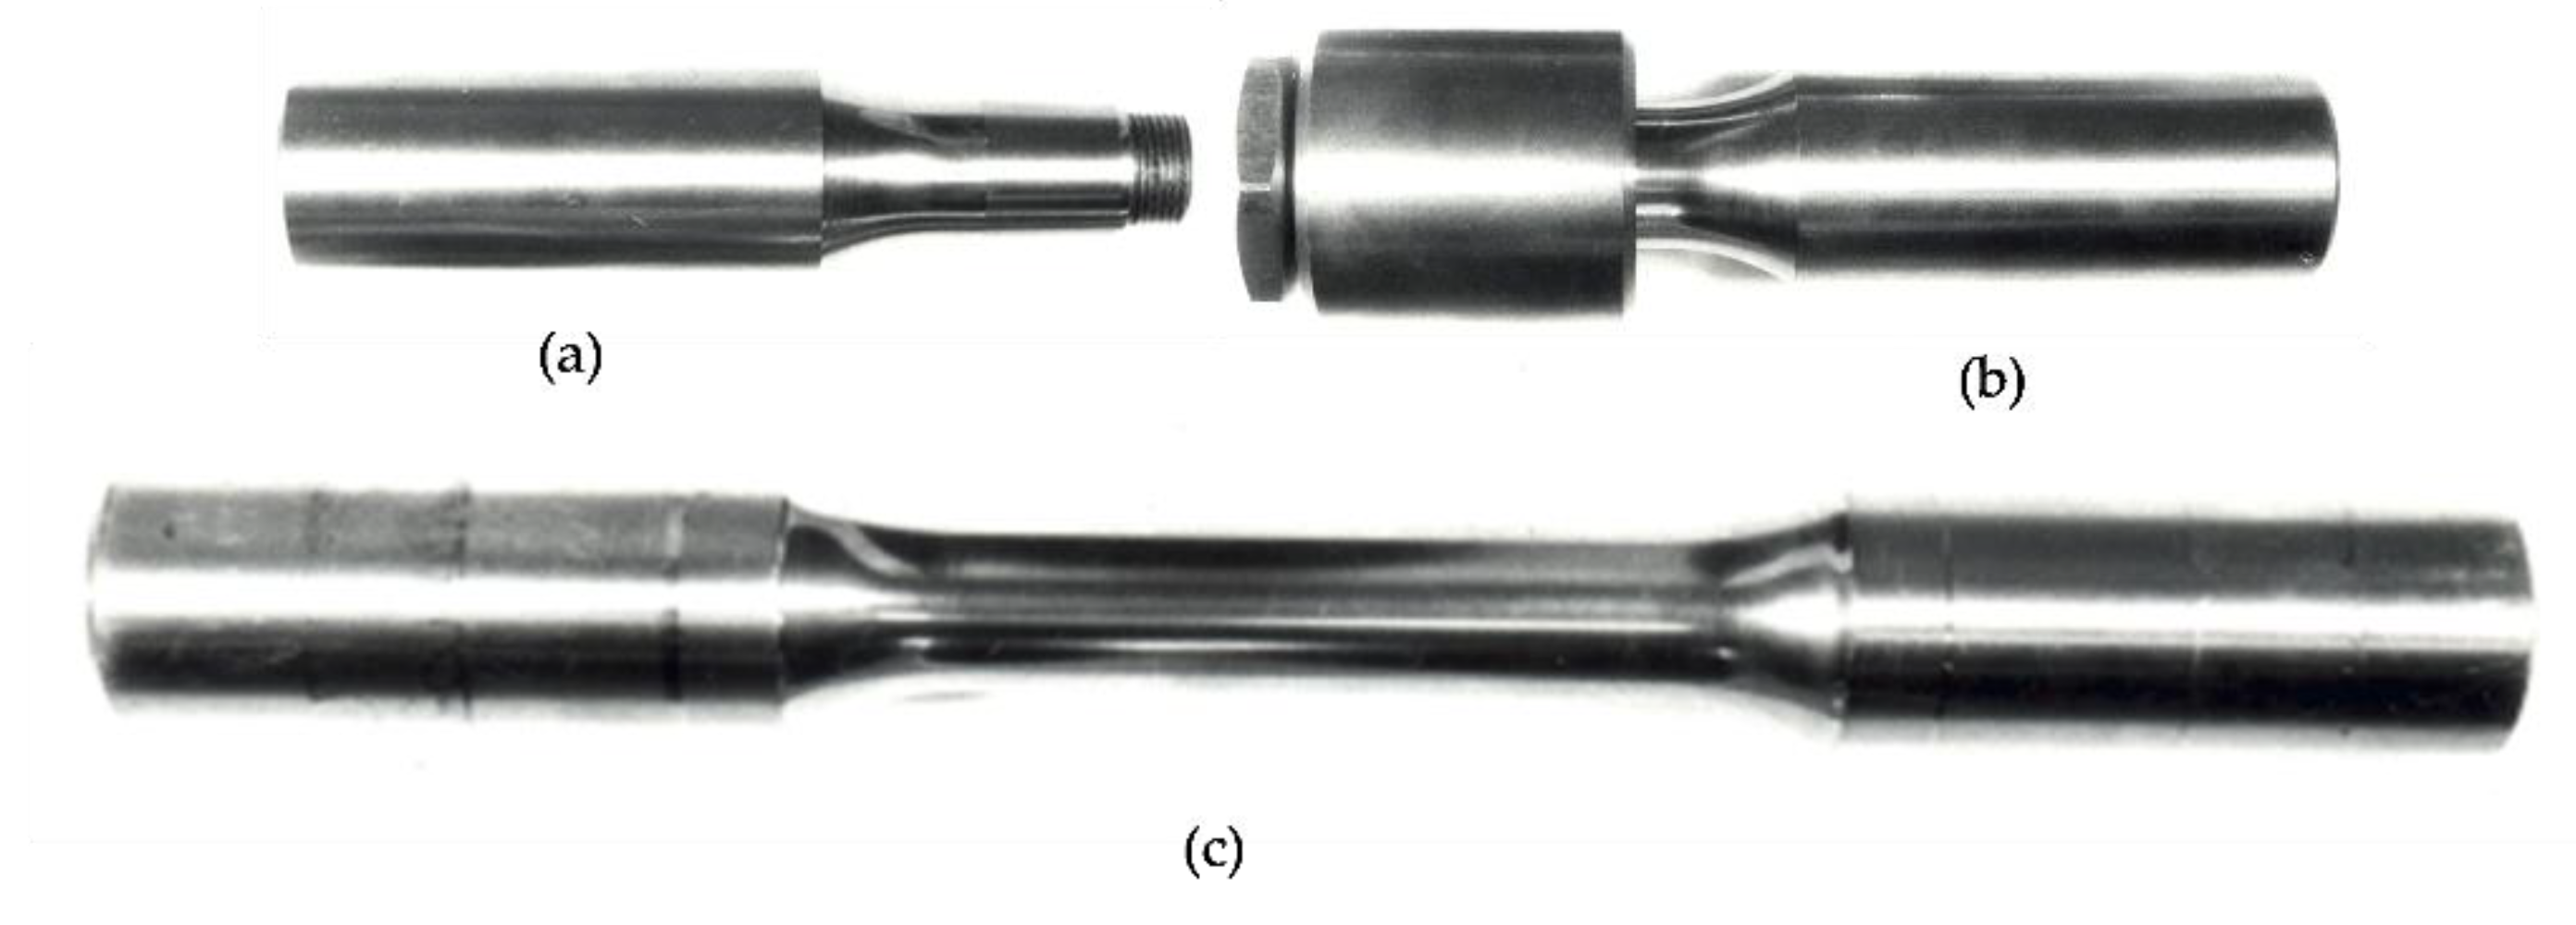
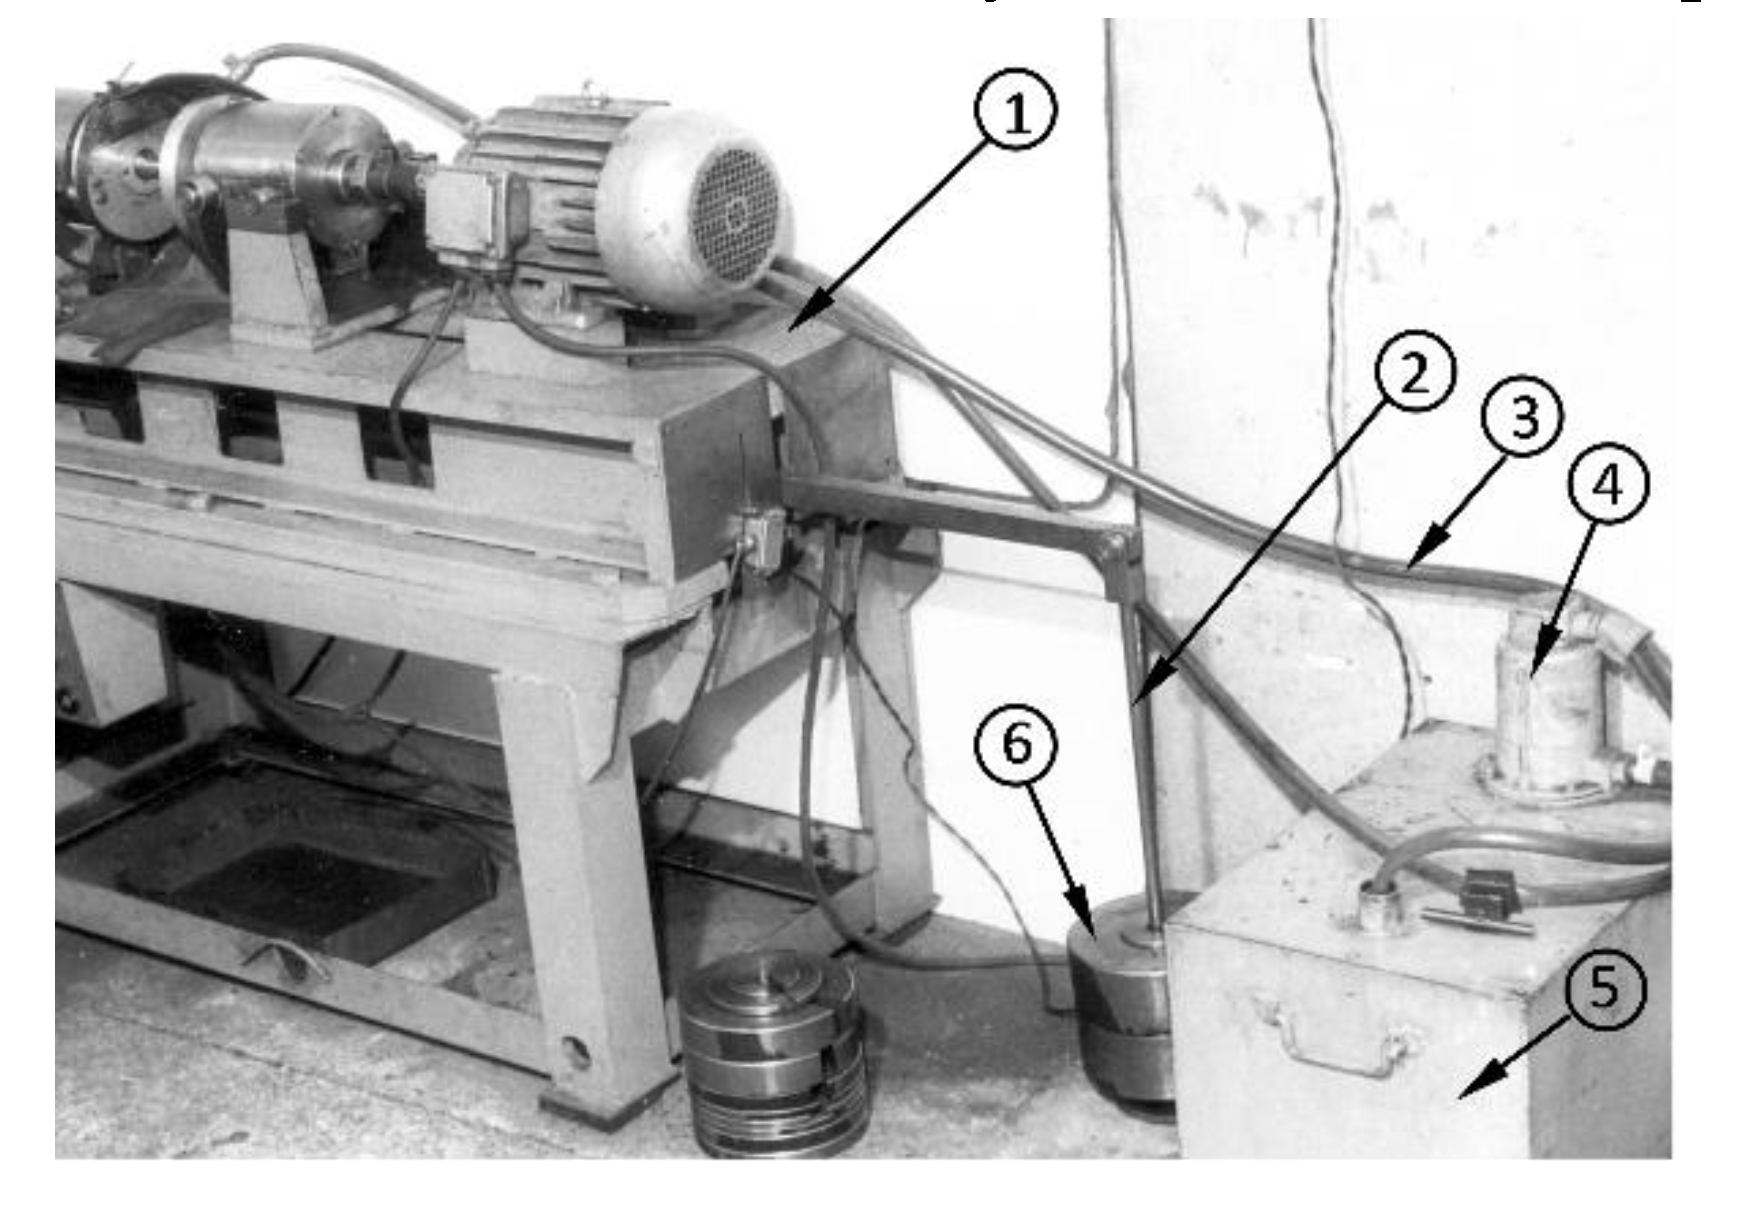
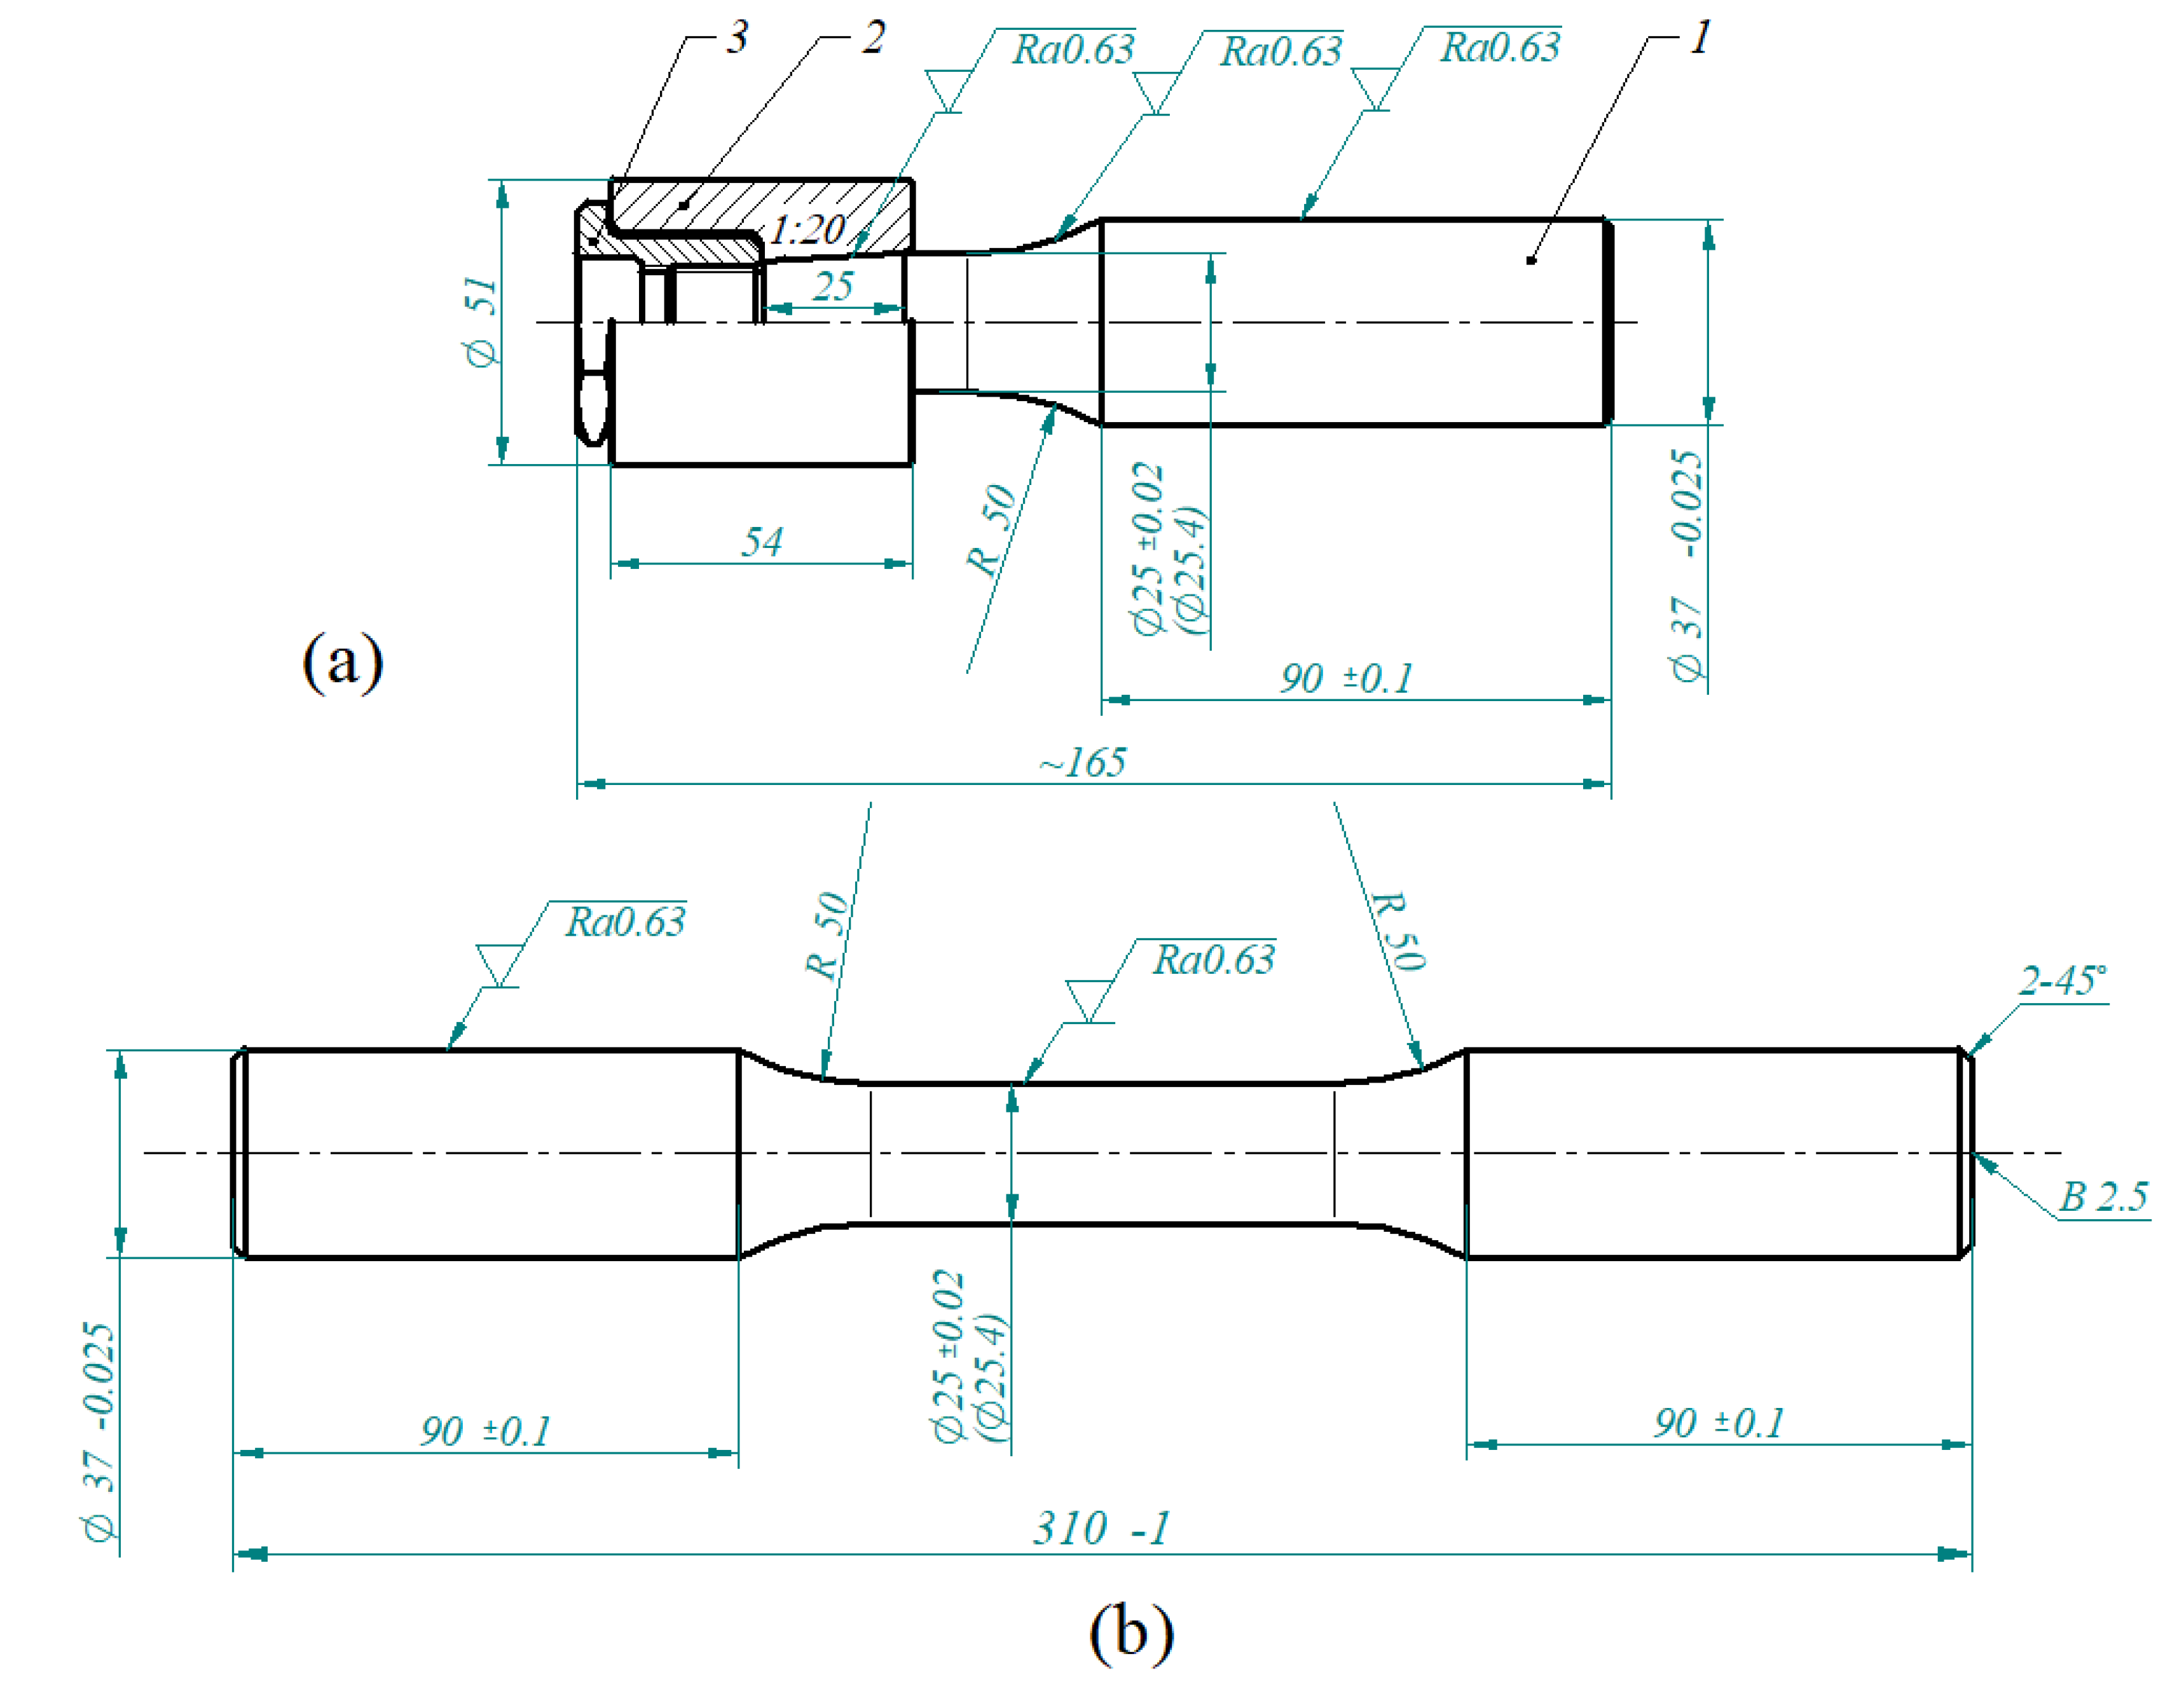
2. Fatigue Strength Research Test Parameters

The purpose of the experimental tests was to check how the fatigue strength of uniform and joint components operating in the seawater environment are affected by a machining surface process such as burnishing. The cylindrical uniform samples and the conical samples were designed specially to test. Internal stresses of the conical samples were designed by the press sleeve onto the shaft. This press joint was realized using two materials (copper alloy and steel). The idea of the research samples is shown in Figure 4.
The tested samples had been prepared as conically and cylindrically shaped with a diameter of 25 mm and were made from steel C35 (1.0501). Steel C35 has been selected for testing because according to the requirements for propeller shaft materials, the steel should have a strength Rm ≥ 430 MPa and be suitable for forging. The chemical composition and mechanical properties in normalized conditions of steel C35 are in Table 1.
The sleeves of the pressing joints of samples were made of a copper alloy. The trade name of this alloy is “Novoston”. The chemical composition and mechanical properties of this alloy are presented in Table 1.
Test samples were made by the turning process and then, by surface processing by burnishing or grinding. During the machining, the required dimensional accuracy was to ensure that the deviation of areas of the sample cross-section was not more than 0.5 mm2. The samples were rolled, burnishing with variable force value. The range of force changes was from 1.5 to 6 kN. Detailed parameters of the samples processing with the burnishing force are presented in Table 2 and Table 3 The feed of burnishing for all samples amounted to 0.214 mm/rev. Burnishing was carried by the three rollers simultaneously, wherein the diameter of rollers was 60 mm. The rounding radius of the burnishing roller profile was R = 20 mm. After the turning process, the surface roughness of the testing shaft determined by the Ra parameter was in a range Ra = 8.77 ÷ 9.07 µm. The sample surface roughness after burnishing according the Ra parameter was in a range Ra = 0.2 ÷ 0.63 µm; the measurement parameters and profile characteristics are presented in Figure 5.
As a burnishing tool cooling liquid and lubricant during the burnishing process, the machine oil type L-AN 46 (ISO 3448) was used. Figure 6 presents a photograph of the testing samples.
In the conical research samples, additional squeezed stresses were induced by a special sleeve and a nut. The sleeve had been pressed in with the force F = 14.29 kN. The preset amount of interference between the sleeve and sample was performed by the specially designed nut, which had been tightened with the determined torque. The torque value was about M = 60 Nm. In this way, assembled samples were put in the special implement. This implement enabled testing of the samples in the fatigue equipment. The scheme of the implement is presented in Figure 7.
The sample with the sleeve was settled in the special equipment (3). Next, the sample was clamped by tightening by the screws. This prepared sample was settled in the testing stand in the place marked (4) in Figure 8. Then, the sample was placed in a special cover, which enabled fatigue testing in the seawater environment.
Seawater was supplied to the cover by a pump from the tank. Figure 9 presents a photograph of the testing stand with the tank of seawater and the system of bending stresses set for the tested samples. In this case, the bending stresses were set by changing the number of weights (6) on the lever (Figure 9).
A summary of the conditions carried out for the fatigue research in the testing stand, which is presented in Figure 8 and Figure 9, for the pressed in conical joint and cylindrical samples, is as follows:
  • Testing materials: tempered steel C35 (shaft), “Novoston” alloy (sleeve).
  • Type of load: rotary bending, σm = 0. R = −1; 1.
  • Load frequency: 48.2 cycles/s.
  • Adopted base of fatigue cycles: 10 7 cycles.
  • Cooling and environment liquid: seawater.
  • The cone inclination of shaft–sleeve joint: 1:20 (details of shaft and sleeve dimensions are presented in Figure 4, Figure 5, Figure 6 and Figure 7).
The research was conducted mainly to determine the permanent fatigue strength.

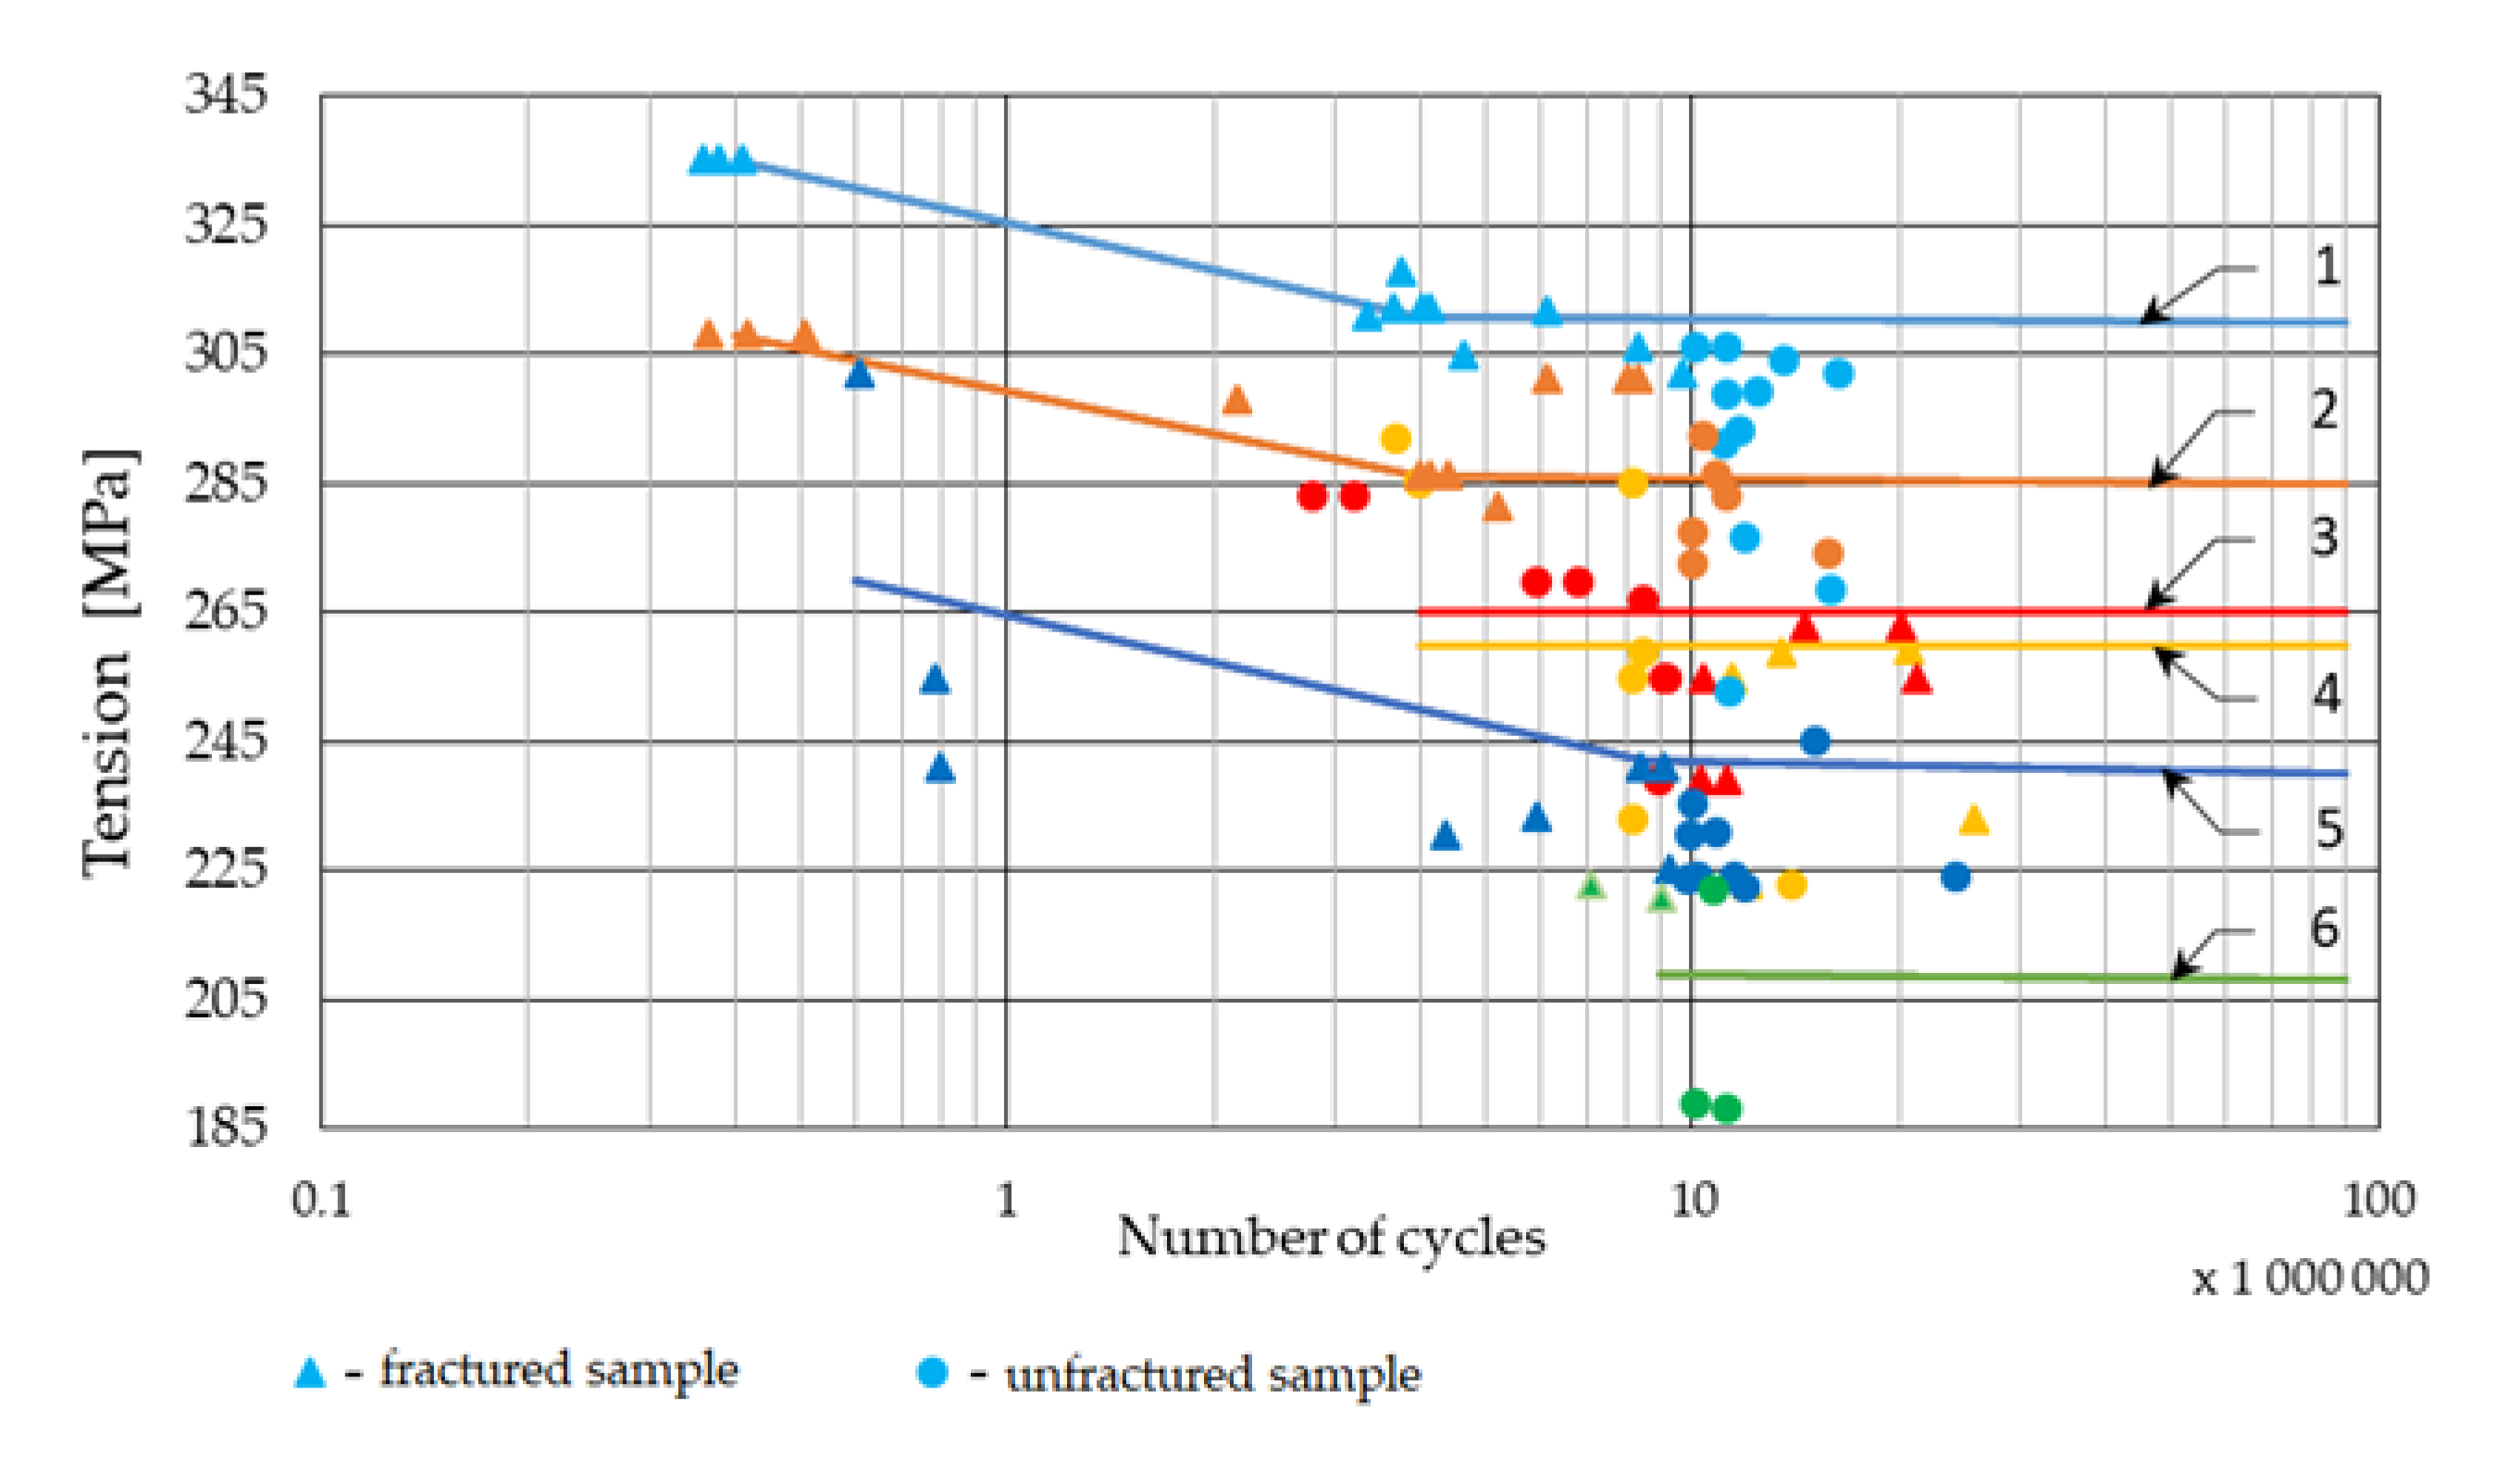
3. Results and Discussion

The results of resistance to rotational bending are presented in Table 2. The staircase method was applied in the research, wherein the number of destroyed samples was approximately equal to the number of samples not destroyed. The basic criterion of the sample during the fatigue test was occurrence of a sample crack, wherein the fracture should show characteristic features of material fatigue. Using these criteria, the results obtained from the measurements were recalculated and sorted. The results prepared in this way are shown in Table 3.
The results of the tested cylindrical samples in the converted form and sorted are presented in Table 4.
The stair step method requires the number of damaged samples to be equal to the number of samples which have not been destroyed for the same cycle’s quantity. In the calculation for the permanent fatigue strength, the number of tests (events) was used, of which frequency of occurrence was smaller. The estimating value of permanent fatigue strength was determined by the following formula [24]:
σ ¯ = Z g j = σ 0 + ( i = 0 q i n i i = 0 q n i ± 1 2 ) Δ σ
where σo—the value of the lowest stress level for a rarer occurring test (event); i—number of stress levels; ni—the frequency of rarer occurring events; Δσ—the difference of the stress level value; “+”—for the damaged samples; “-“—for the not damaged samples.
The estimate average value of standard deviation [24]:
S ( σ ) = 1.62 [ n i 2 n i ( n i ) 2 n 2 + 0.029 ] Δ σ
where σo—the value of the lowest stress level for a rarer occurring test (event); i—number of stress levels; ni—the frequency of rarer occurring events; Δσ—the difference of the stress level value; “+”—for the damaged samples; “-“—for the not damaged samples.
In Figure 10, the calculated fatigue strength results of the cylindrical samples are presented. The calculation was made on the basis of the data in Table 4 using Equations (1) and (2). The estimated standard deviation has been superimposed on the graph points (±σ). The graph shows that the surface burnishing of the samples significantly increased their fatigue strength compared to the grinding. The increase in fatigue strength of the burnished samples compared to the grinded samples is: for burnishing force 1.5 kN—15%; for burnishing force 2 kN—20%; for burnishing force 3 kN—30%.
However, the fatigue strength of samples burnished with the force 6 kN are lower and its value is similar to the samples burnished with the force of 2 kN. It can be assumed that the degree of cold rolling of the material on the surface of the samples increases their fatigue strength only to some extent. Exceeding this critical cold rolling value causes the fatigue strength of the samples to decrease. Excessive force of burnishing causes the creation of microcracks and flakes on the surface. These phenomena cause the formation of notches on the surface, decreasing its fatigue strength. Stress-increased causes enlarge deeper hardening of the surface. The increase in forces enhances the hardening layer but excessive forces cause the formation of cracks on the burnishing surface, which is the reason for the decrease in fatigue strength. Based on the data in Table 3 and Table 4, converted according to Equation (1), the comparative results of the fatigue strength for conical and cylindrical samples, which were grinded and burnished with different burnishing forces, are presented in Figure 11. The values of the fatigue results are shown in this figure in the form of points.
The burnishing process increases the fatigue strength of the conical samples. Samples burnishing with a pressing force of 3 kN show fatigue strength greater by about 20% compared to the same samples whose surface was grinded. In Figure 11, it can be seen that conical specimens with a pressed-in sleeve have a lower fatigue strength than cylindrical specimens with the same circular cross-sectional area. This applies to both types of surface processing, i.e., grinding and burnishing. The fatigue strength of the cylindrical specimen is about 20% higher than that of the conical sample processed in this same way. It can be assumed that the reduced strength of the conical specimen is due to the additional stress introduced by the pressed-in sleeve. The increase in tension in the sample as a result of overlapping the internal tensions on the external loads had caused the decrease in fatigue strength. As in the case of cylindrical samples, increasing the degree of cold rolling by increasing the crushing force over the extent level does not improve the fatigue strength because samples crushed with 3 and 6 kN do not show significant differences.
It can be assumed that the internal stress caused by the pressed-in sleeve superimposed on the external load, as a result of which the conical sample shows lower resistance to fatigue load. During design works, the occurrence of this phenomenon should be taken into account. When considering the causes of reduced fatigue strength of pressed-in sleeve samples, it is important to take into account that in this joint are the different materials; it may cause, in the seawater, these materials to create a local electric cell, thereby electrochemical processes taking place there may have an effect on the fatigue strength of the joint.
The fatigue fracture of the tested specimen is presented in Figure 12. The area of fatiguing fracture and the immediate fracture (marked 3) can be seen. Comparing these areas may demonstrate that this sample had a large reserve of endurance. There are no visible flaws on the surface on the presented specimen that could be a source of fatigue scrap propagation.
Figure 13 presents the fatigue fracture of the tested sample, which was burnished by the force 6 kN. In this figure, surface cracks may be noticed. The cracks appear mainly on the surface and penetrate inside the material. Such a structure of cracks may result from an excessive material of surface layer deformation during the burnishing process. A too high degree of cold working causes microcracks and flaking on the surface; these cracks increase during fatigue load weakening of the sample. These cracks should be investigated in more detail because they greatly reduce the quality parameters of this shaft. Comparing Figure 12 and Figure 13, it can be seen that the surface cracks have occurred only if the surface deformation caused by the burnishing force is too high, which causes a higher degree of cold work.
The fatigue fracture of the conical samples occurred in the area of the larger diameter of the cone near the edge of the pressed-in sleeve. This case confirms occurrence of a stress notch in this place. The impact of the stress notch on the fatigue strength of such components can be limited by strengthening this area by using appropriate design or technological solutions.

4. Conclusion

The article presents research on the fatigue strength of cylindrical and conical samples whose surfaces were burnished with different forces. The samples were tested in an environment of seawater and conical samples were additionally loaded by internal stresses resulting from the pressing in of the testing sleeve. On this basis, these tests may be presented with the following conclusions:
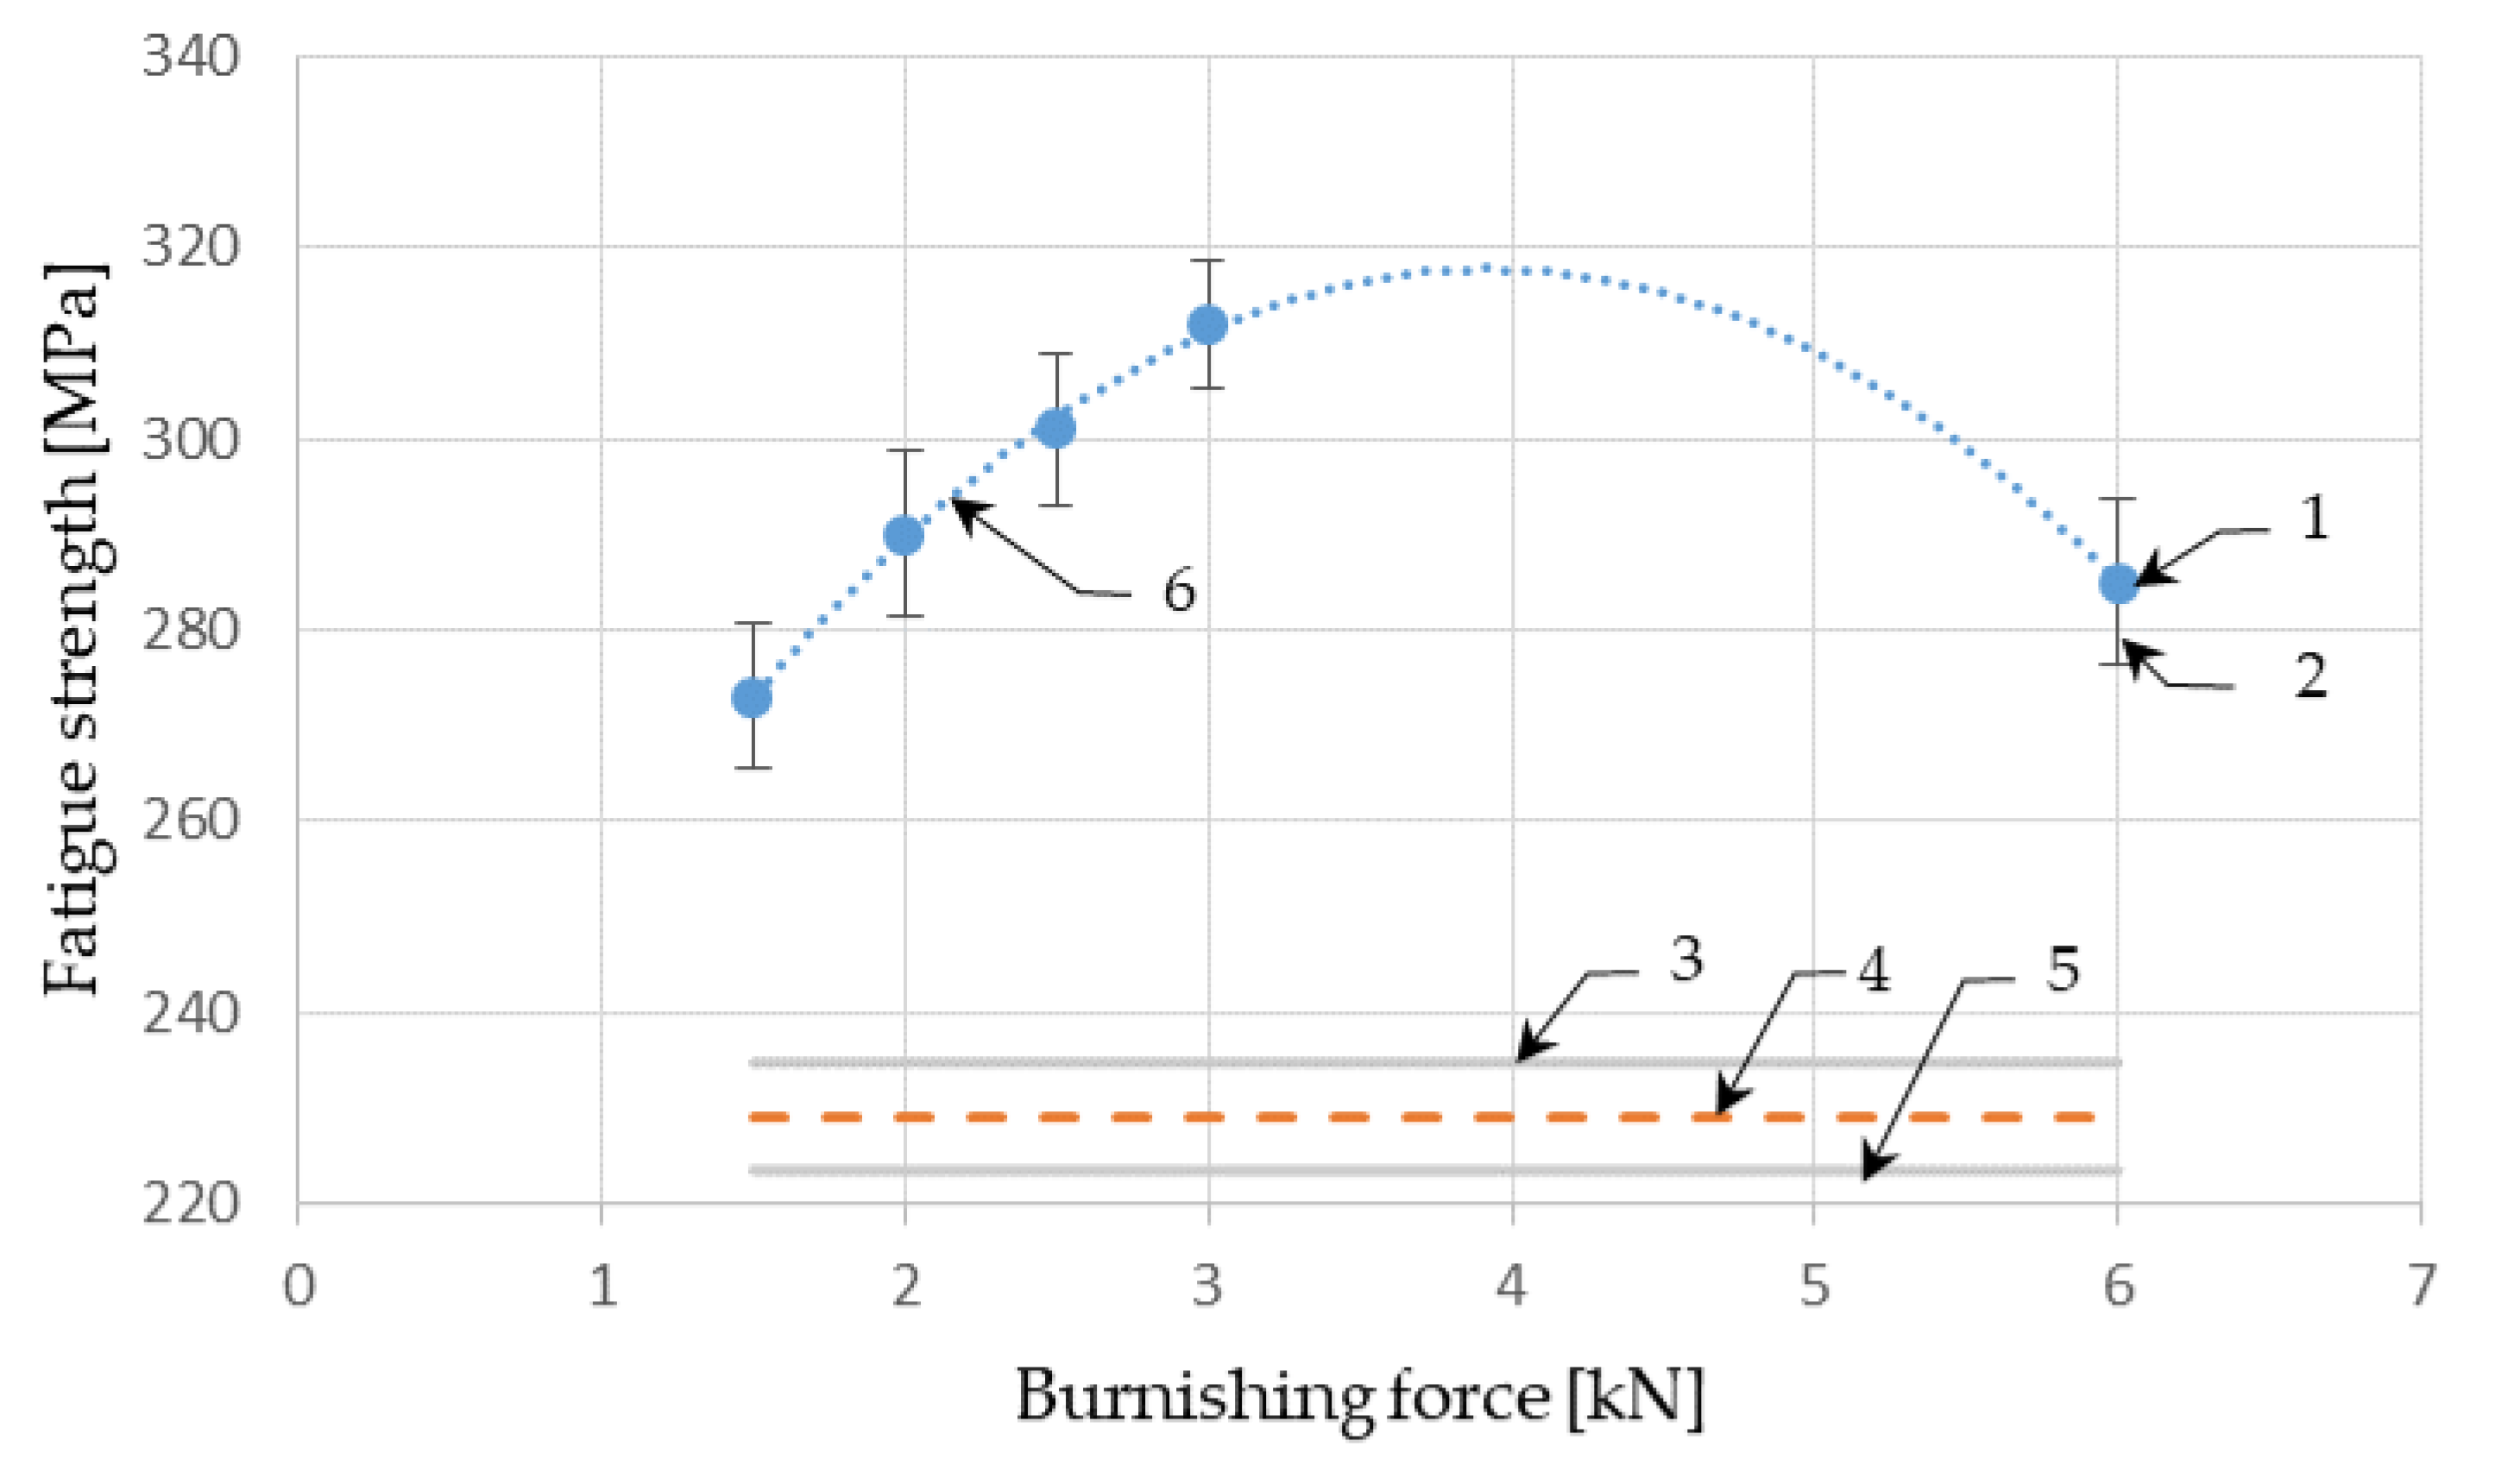
  • The sample surface burnishing increases the fatigue strength. The tests showed 30% increase in the fatigue strength of the cylindrical burnished samples in relation to the value of the grinded samples. The fatigue strength increases with the degree of surface cold rolling but only up to a certain value of this cold rolling. Continual increase in the cold rolling degree causes the fatigue strength of the samples to deteriorate, e.g., increasing the burnishing force from 3 to 6 kN, reducing the fatigue strength of the cylindrical samples by 8.7% in relation to the value of the burnished sample with force 3 kN.
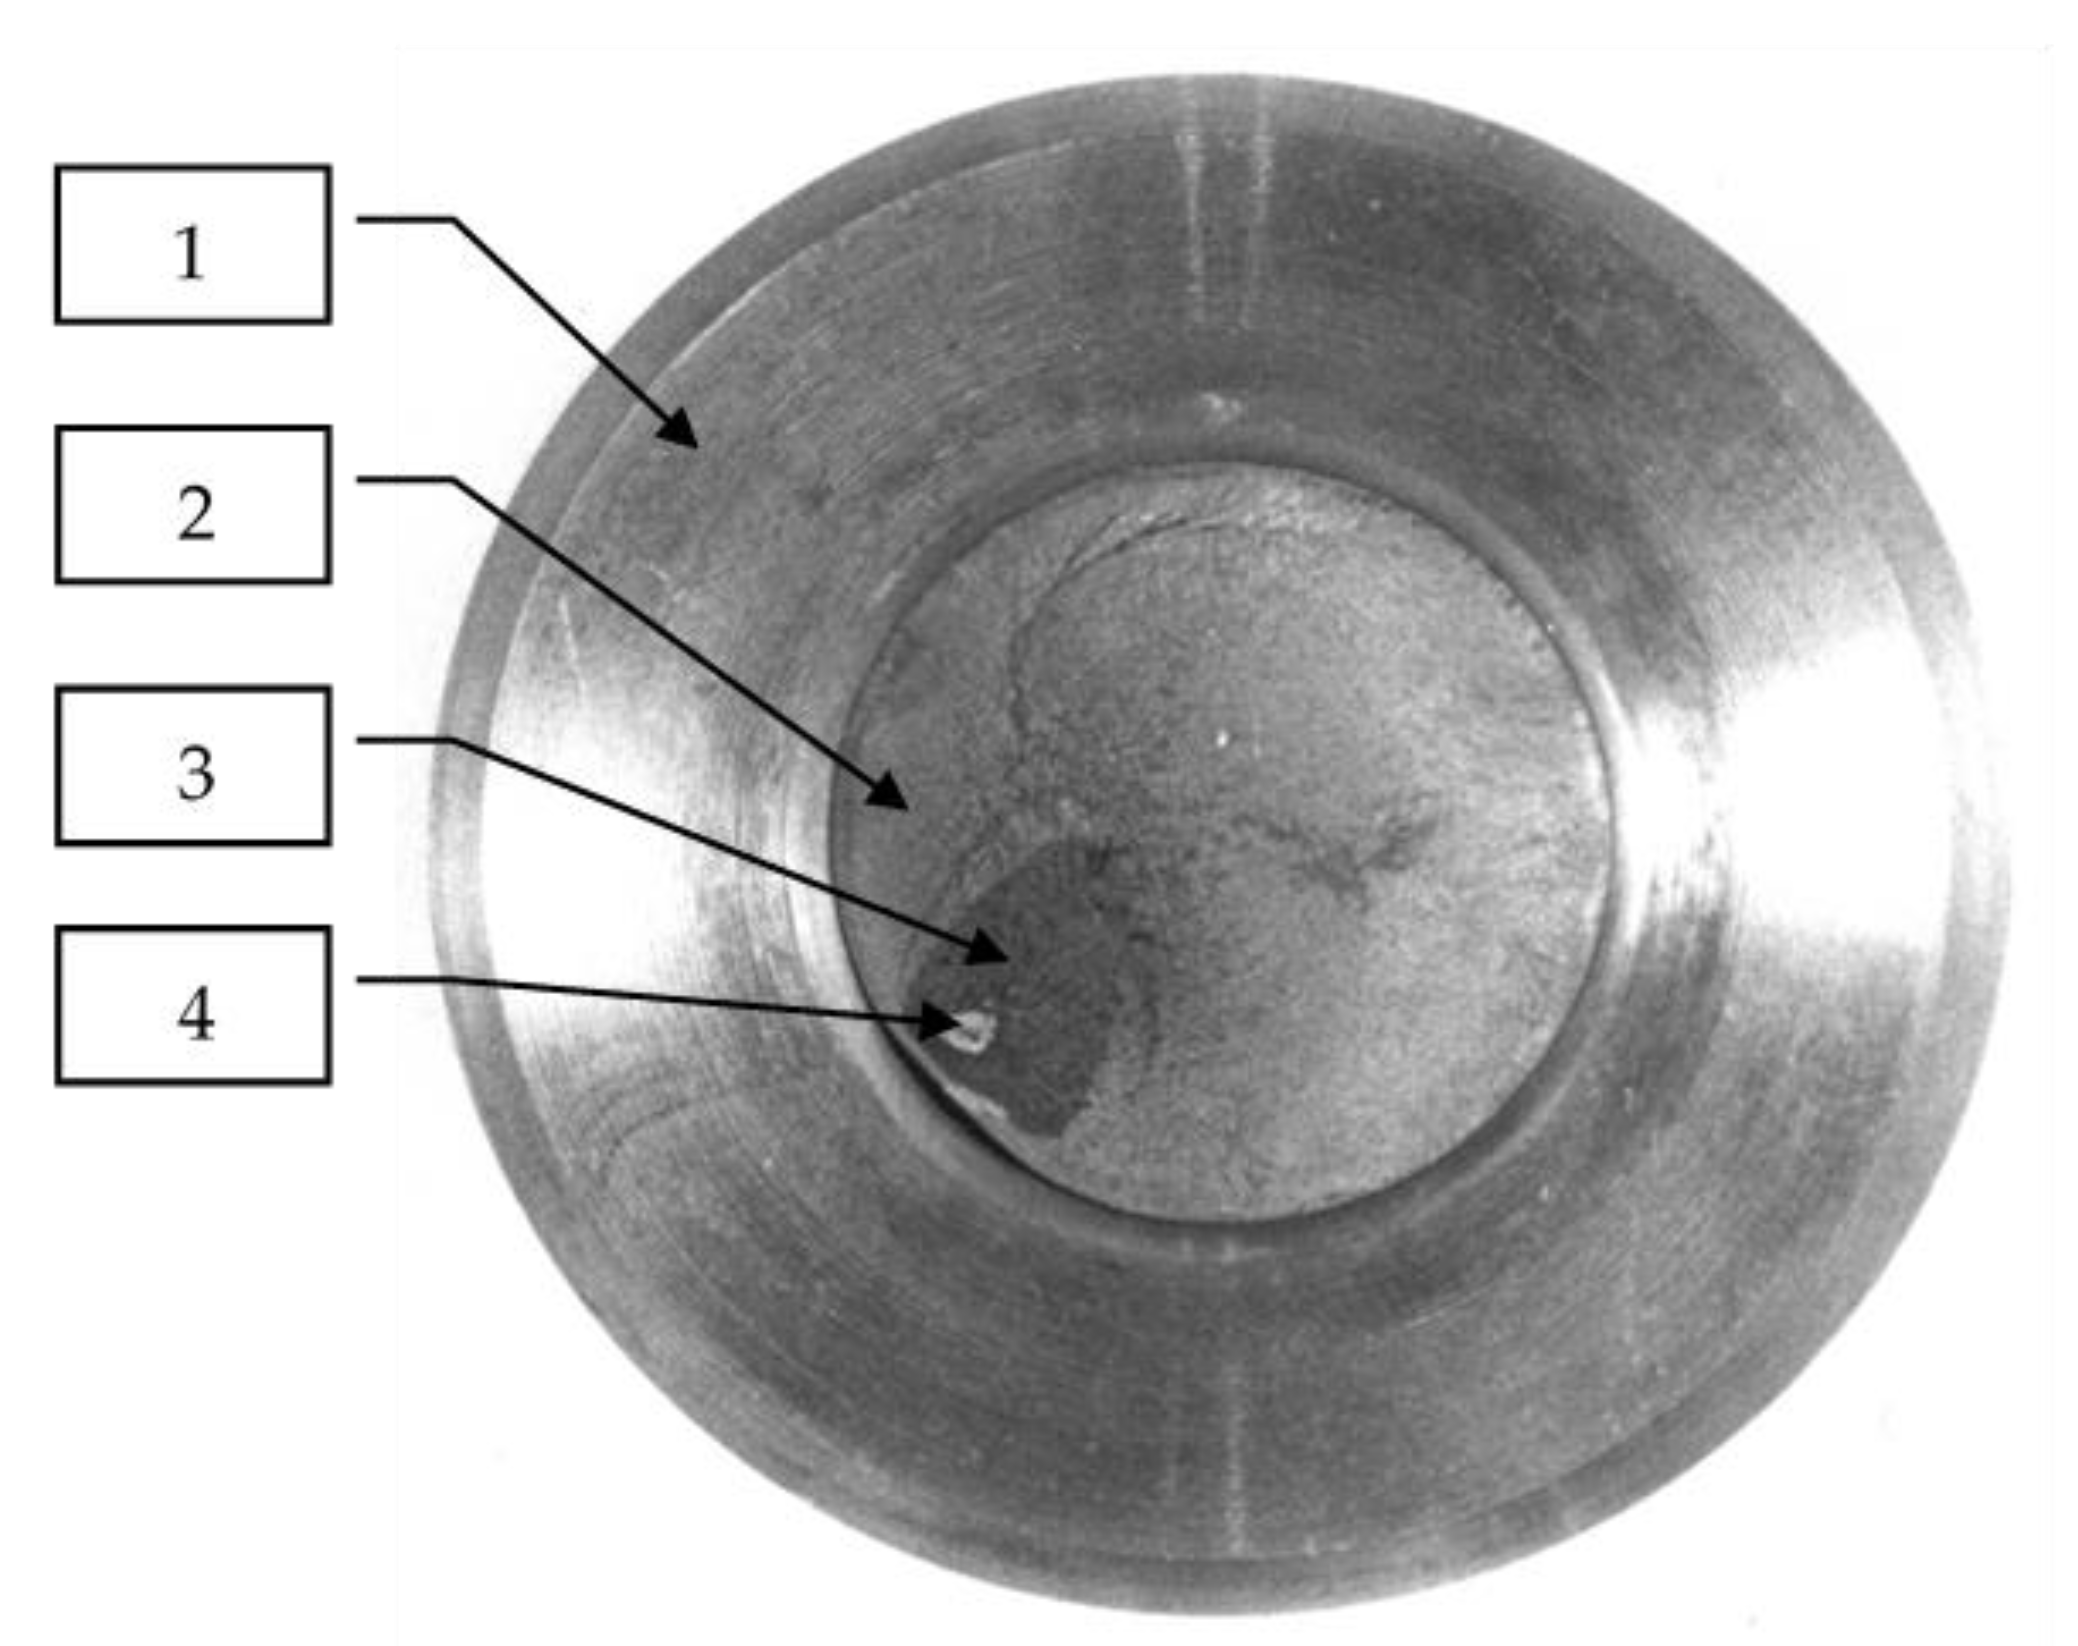
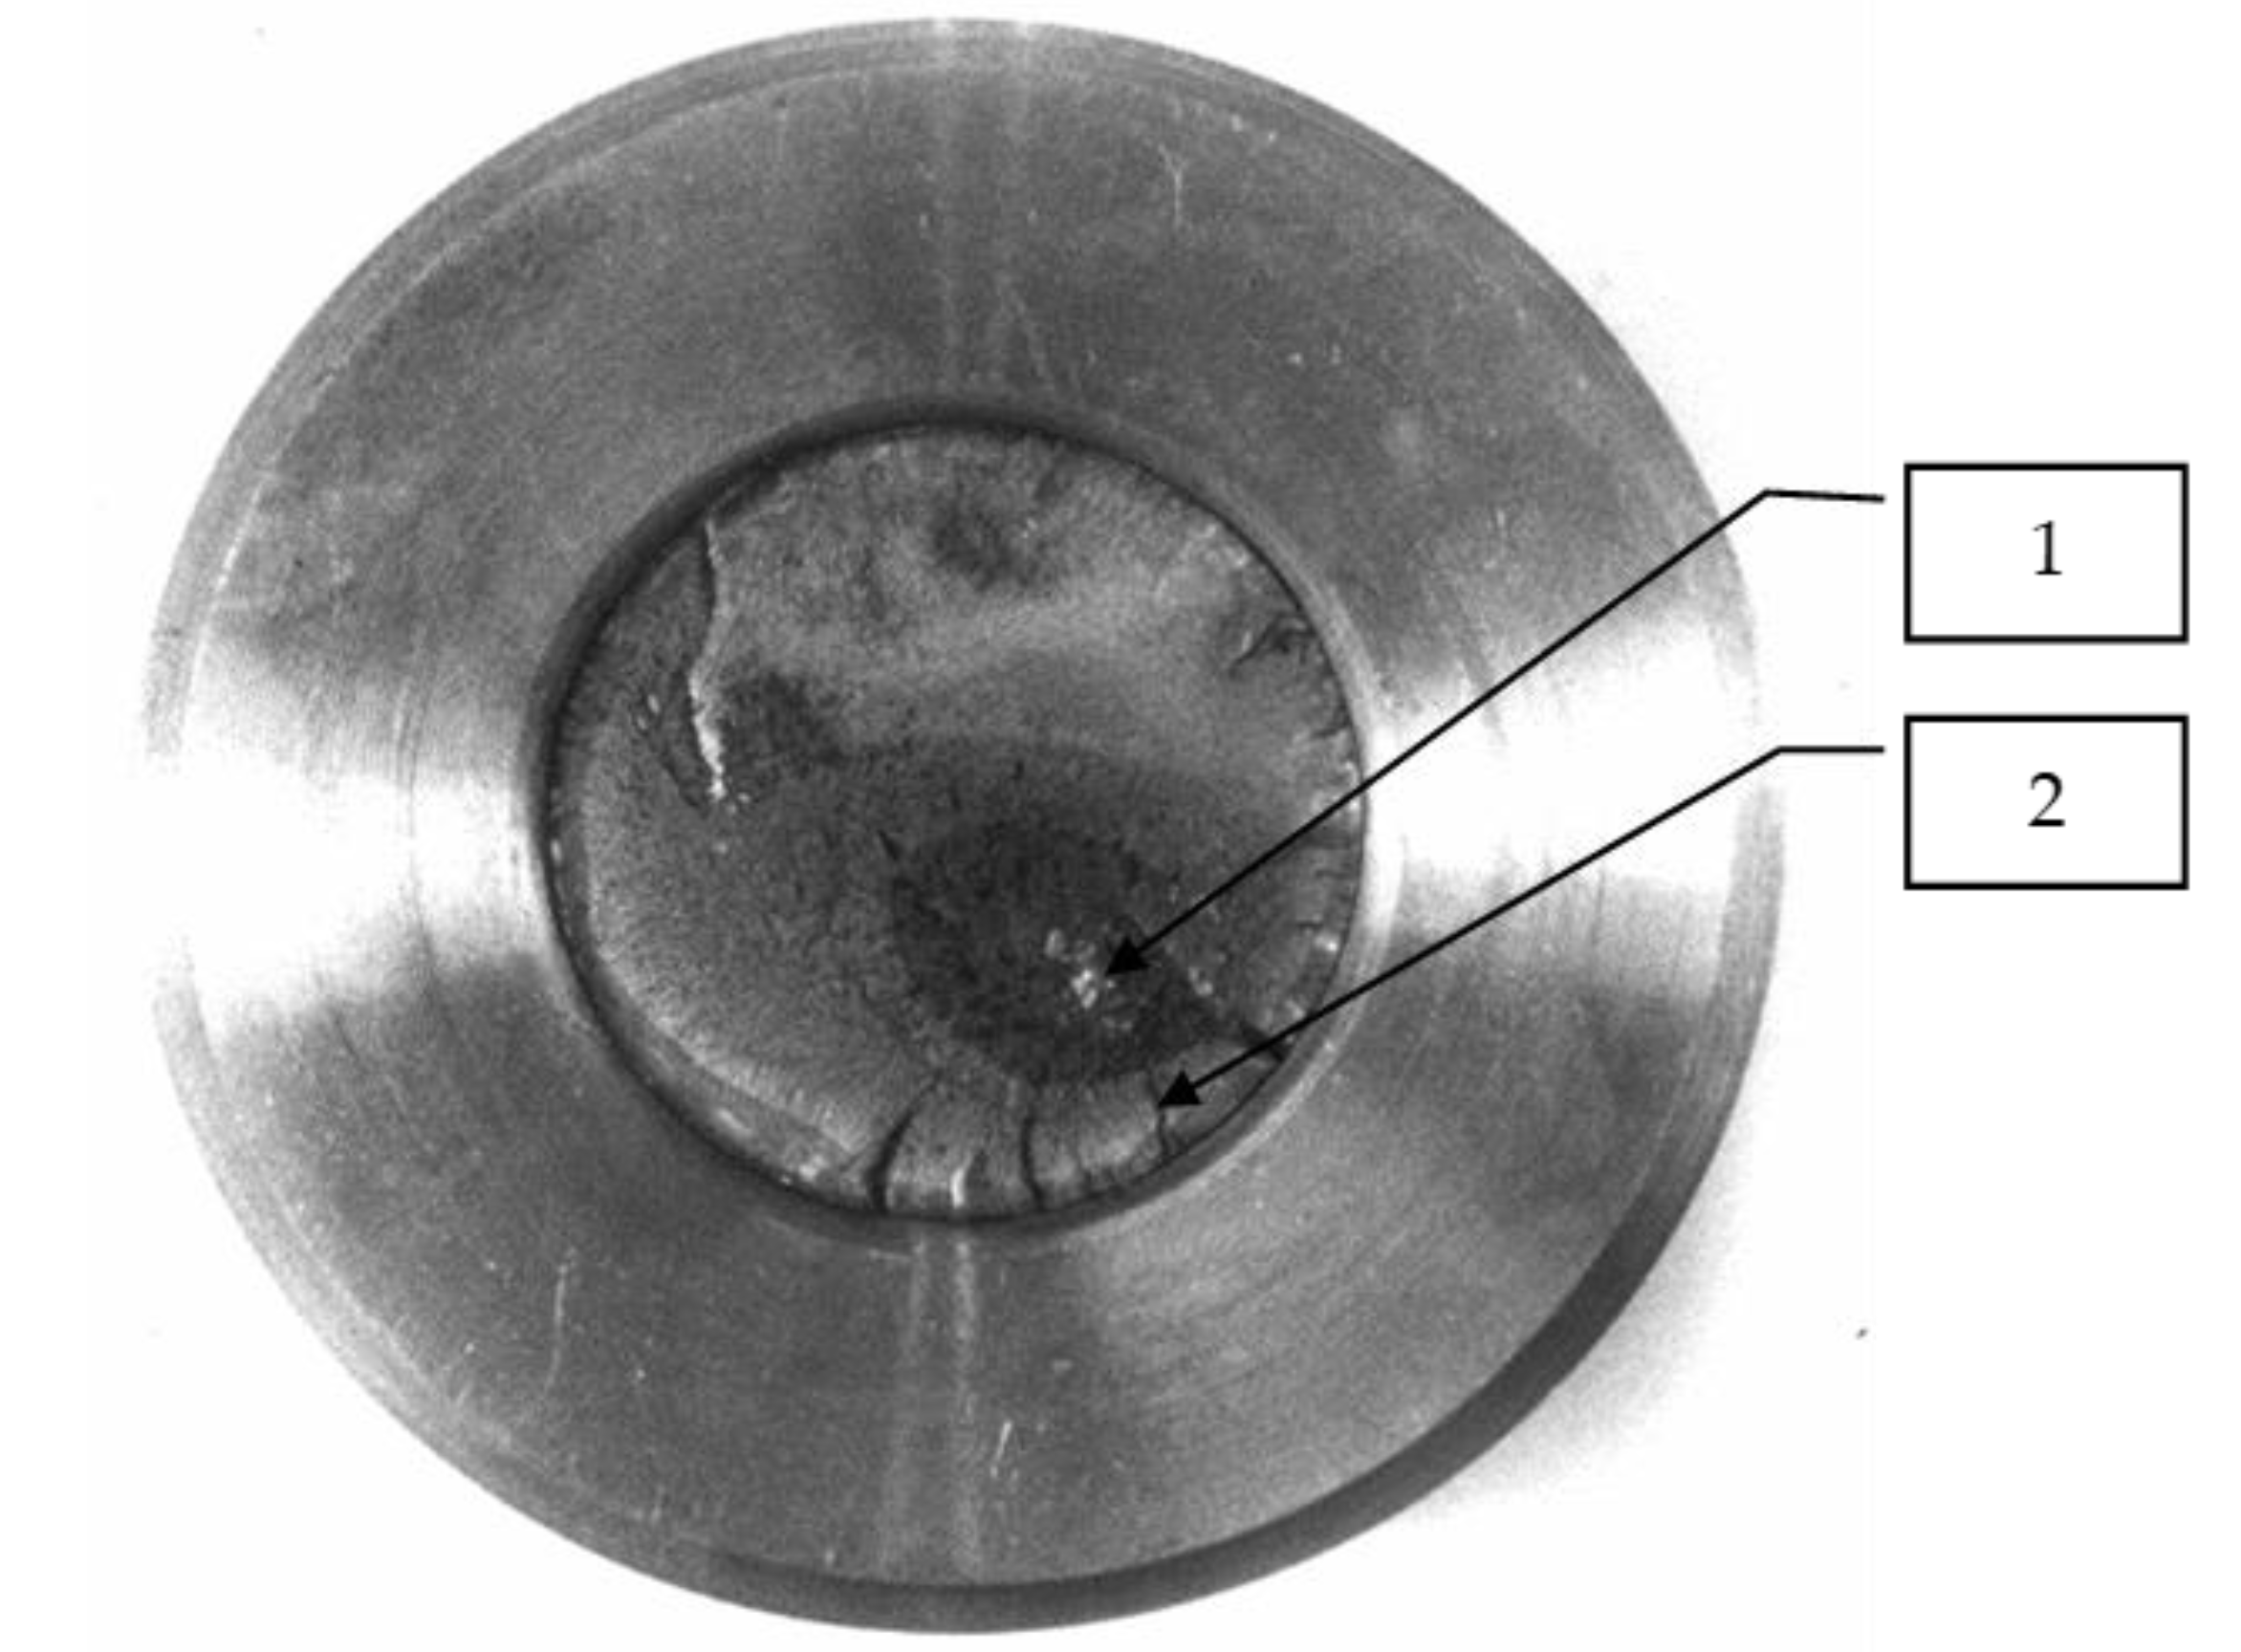
  • The pressed-in joint has a lower fatigue strength than a uniform sample. The fatigue strength of the cylindrical samples is about 20% greater than the conical specimen with the sleeve pressed in, notwithstanding both specimens had been processed in this same way. This may be due to the additional stress created by the pressed-in sleeve. The surface burnishing of the specimens in such a joint also increases their fatigue strength; the values of fatigue strength of the samples are 20% higher than those in which the surface was grinded. In this case, too much cold rolling on the sample surface does not increase the fatigue strength. This may be due to the formation of microcracks on the surface. The cracks on the surface, decreasing in fatigue strength, of the sample had been observed on the fatigue scrap.
Further research work will be focused on the investigation into the surface layer characteristics being constituted in burnishing processes, realized under differentiated machining conditions.

5. Patent

Method of Shaft Manufacturing

Manufacturing technology of the shafts by burnishing in production conditions may be difficult because burnishing by single tools creates lot of problems such as: balancing of processing forces, clamping and supporting of shafts, and centering on the lathe. In this case, invent equipment was designed, which can turn and burnish simultaneously, and creates an internal balanced layout of processing forces. This equipment enables high quality machining because machining forces do not cause deformation of the workpiece. This equipment can be controlled by a computer system which allows the automation of the process while maintaining very precise machining. The head for integrated machining of stepped shafts is shown in Figure 14. This equipment allows simultaneous machining with cutting and burnishing as well as separate process operating of turning or burnishing. This head should be mounted in the tool holder in such a way that the axis of symmetry of the head should coincide with the rotation axis of the spindle (for the controller, it is usually the Z-axis). The machined shaft is placed inside the head ring. The setting up of the shaft is based on the centers or the lathe chuck and center. The head may be mounted as a floating element and in this case, the head is self-centering relative to the shaft. The control wires of the stepper motor or servomotor and measuring probe should be connected to the machine tool controller. The machining head performs machining simultaneously with three tools, which ensures a balance of cutting forces within the machining place. This type of processing force distribution causes the creation of only torsional stresses in the workpiece, while the shaft does not bend and forces and deformations which could cause shape defects of the workpiece do not occur.
This force distribution is important during the machining of non-rigid shafts because in this case, the unbalanced processing forces deform the machining shaft, which create form errors of the manufactured part. The move out cylinder (6) system in burnishing tools enables independent operation of cutting and burnishing tools. This system enables planning of the burnishing process only on selected surfaces and the turning or burnishing process may be carried out in many passes. The measuring probe (8) placed on the head verifies the obtained dimensional effects of machining and in case of deviations, may create applications of appropriate corrections. The above head covered by the patent application [25] increases the productivity of stepped shafts manufacturing with high slenderness by eliminating many technological operations and human labor from the currently used technologies.
Figure 15 presents an example instruction sheet of the processing of the marine propeller shaft. The process of shaft manufacturing is planned with the use of special equipment shown in Figure 14. The whole process of turning and burnishing may be carried out in a computerized numerically controlled machine tool. The fine surface burnishing process enables manufacturing of the shaft in one turning and burnishing operation, eliminating the grinding operation as a finishing. The measuring probe and machining control system allows the realization of the machining process, which has been executed with the accuracy required for a marine propeller shaft.

Author Contributions

Conceptualization, S.D., W.P. and B.Ś.; methodology, S.D., W.P. and B.Ś.; software, S.D., W.P. and B.Ś.; validation, S.D., W.P. and B.Ś.; formal analysis, S.D., W.P. and B.Ś.; investigation, S.D., W.P. and B.Ś.; resources, S.D., W.P. and B.Ś.; data curation, S.D., W.P. and B.Ś.; writing—original draft preparation, S.D., W.P. and B.Ś.; writing—review and editing, S.D., W.P. and B.Ś.; visualization, S.D., W.P. and B.Ś. All authors have read and agreed to the published version of the manuscript.

Funding

This research received no external funding.

Conflicts of Interest

The authors declare no conflict of interest.

References

  1. Carion, G.; Simihiati, B. Damage to and Repairs of Propeller Shaft and Liners; Bulletin technique du Bureau Veritas: Levallois-Perret, France, 1985. [Google Scholar]
  2. Shook, L.L.; Long, C.I. Surface Cold rolling of Marine Propeller Shafting. 1957. Available online: https://www.shotpeener.com/library/pdf/1957004.pdf (accessed on 16 October 2020).
  3. Kettrakul, P.; Promdirek, P. Failure analysis of propeller shaft used in the propulsion system of a fishing boat. Mater. Today 2018, 5, 9624–9629. [Google Scholar] [CrossRef]
  4. Huang, Q.W.; Liu, H.G.; Ding, Z. Dynamical response of the shaft-bearing system of marine propeller shaft with velocity-dependent friction. Ocean Eng. 2019, 189, 106399. [Google Scholar] [CrossRef]
  5. Yao, H.Y.; Cao, L.L.; Wu, D.Z.; Yu, F.X.; Huang, B. Generation and distribution of turbulence-induced forces on a propeller. Ocean Eng. 2020, 206, 107255. [Google Scholar] [CrossRef]
  6. Karpenko, G.V.; Pogoretskii, R.G.; Sirak, Y.M. The influence of surface hardening by burnishing on the fatigue resistance of shafts with press fits in a corrosive medium. In The Protection of Metals from Corrosion-Mechanical Damages; Profizdat: Moscow, Russia, 1970; pp. 113–115. [Google Scholar]
  7. Ryabchenkov, A.V. Corrosion Fatigue Strength; Mashgnitz: Moscow, Russia, 1953; [in Russian]. [Google Scholar]
  8. Vaingarten, A.M.; Goman, G.M.; Mendelson, I.V. The corrosion fatigue strength and corrosion resistance of 35 steel specimens in relation to the hardening method. Tfkh. Sudostroyeinie. 1973, 3, 54–57. [Google Scholar]
  9. Dyl, T.; Dolny, K. The influence of the Burnishing on Technological Quality of Elements of Part Shipping Machines. J. KONES 2010, 17, 89–95. [Google Scholar]
  10. Toshio, K.; Eiichi, S.; Bunzai, A. On Fatigue Test of Materials with Cold Rolling for the purpose of Strengthening of Marine Propeller Shaft. In Japan Shipbuilding and Marine Engineering; Japan Association for Technical Information: Tokyo, Japan, 1966. [Google Scholar]
  11. Kudryavtsev, I.V. Selection of the basic parameters for strengthening shafts by burnishing, I.V. Kudryavtsev. Vestnik Mashinostroenia 1983, 4, 8–10, [in Russian]. [Google Scholar]
  12. Przybylski, W. Low Plastic Burnishing Processes, Fundamentals, Tools and Machine Tool; Institute for Sustainable Technologies-National Research Institute: Radom, Poland, 2019. [Google Scholar]
  13. Klocke, F.; Lierman, J. Roller burnishing of hard turned surfaces. Int. J. Mach. Tools Manuf. 1998, 38, 419–423. [Google Scholar] [CrossRef]
  14. Skalski, K.; Morawski, A.; Przybylski, W. Analysis of contact elastic-plastic strains during the the process of burnishing. Int. J. Mech. Sci. 1995, 37, 461–472. [Google Scholar] [CrossRef]
  15. Travieso-Rodríguez, J.A.; Jerez-Mesa, R.; Gómez-Gras, G.; Llumà-Fuentes, J.; Casadesús-Farràs, O.; Madueño-Guerrero, M. Hardening effect and fatigue behavior enhancement through ball burnishing on AISI 1038. J. Mater. Res. Technol. 2019, 8, 5639–5646. [Google Scholar] [CrossRef]
  16. Avilés, A.; Avilés, R.; Albizuri, J.; Pallarés-Santasmartas, L.; Rodríguez, A. Effect of shot-peening and low-plasticity burnishing on the high-cycle fatigue strength of DIN 34CrNiMo6 alloy steel. Int. J. Fatigue 2019, 119, 338–354. [Google Scholar] [CrossRef]
  17. Yuan, X.L.; Li, C.Y. An engineering high cycle fatigue strength prediction model for low plasticity burnished samples. Int. J. Fatigue 2017, 103, 318–326. [Google Scholar] [CrossRef]
  18. Aviles, R.; Albizuri, J.; Rotriguez, A.; Lopezde Lacalle, L.N. Influence of low-plasticy burnishing on the high-cycle fatigue strength of medium carbon AISI1045 steel. Int. J. Fatigue 2013, 55, 230–244. [Google Scholar] [CrossRef]
  19. Zielecki, W.; Bucior, M.; Trzepieciński, T.; Ochał, K. Effect of slide burnishing of shoulder fillets on the fatigue strength of X19NiCrMo4 steel shafts. Int. J. Adv. Manuf. Technol. 2020, 106, 2583–2593. [Google Scholar] [CrossRef]
  20. Karthik, D.; Kalainathan, S.; Swaroop, S. Surface modification of 17-4 PH stainless steel by laser peening without protective coating process. Surf. Coat. Technol. 2015, 278, 138–145. [Google Scholar] [CrossRef]
  21. Arisoy, C.F.; Başman, G.; Kelami, Ş.M. Failure of a 17-4 PH stainless steel sailboat propeller shaft. Eng. Fail. Anal. 2003, 10, 711–717. [Google Scholar] [CrossRef]
  22. Przybylski, W.; Dzionk, S. Hibrid processing by turning and burnishing of machine components. In Advances in Manufacturing; Hamrol, A., Ciszak, O., Legutko, S., Jurczyk, M., Eds.; Springer International Publishing: Cham, Switzerland, 2018; pp. 587–598. [Google Scholar]
  23. Ścibiorski, B.; Dzionk, S. The roughness of the hardened steel surface created by rolling burnishing process. Solid State Phenom. 2015, 220, 881–886. [Google Scholar] [CrossRef]
  24. Dyląg, Z.; Orłoś, Z. Fatigue Strength of Materials; Wydawnictwa Naukowo-techniczne: Warszawa, Poland, 1962; [in Polish]. [Google Scholar]
  25. Dzionk, S.; Przybylski, W. Way and Device for Single Operation Turning or Burnishing of High Slender Shafts on a Numerically Controlled Machine Tool. PL. Patent 221524 B1, 22 May 2019. [Google Scholar]
Figure 1. Scheme of screw shaft joint with ship propeller: 1—ship propeller; 2—hull of a ship; 3—bearing sleeve; 4—screw shaft; 5—area of damage; 6—pitting corrosion; 7—fatigue cracks; 8—fretting corrosion; 9—cover.
Machines 08 00063 g001
Figure 2. Scheme of forces in screw shaft joint with ship propeller: 1—screw shaft; 2—propeller tightening nut; 3—ship propeller; 4—bearing sleeve; 5—interference surface; 6—conical pressure surface; 7—bearing sliding surface; G—gravity force of propeller; MG—bending moment from propeller gravity force; MGv—bending moment vibration cause by propeller rotation; Fn—propelling force; Fnv—longitudinal vibrations of the shaft; Tq—shaft torque; Tqv—vibration of shaft torque; q—unit pressure in junction of shaft and propeller hub; Ftq—force of assembly tension.
Machines 08 00063 g002
Figure 3. Scheme of low plasticity burnishing process: 1—burnishing ball or roll; 2—previous position of burnishing ball; 3—surface before burnishing; 4—wave of material before burnishing element; 5—surface after burnishing; 6—graph of material strain in parallel to the surface direction; 7—roughness zone; 8—grain fragmentation zone; 9—zone of plastic deformation; 10—zone of elastic deformation; 11-core; F—burnishing force; fb—feed of burnishing.
Machines 08 00063 g003
Figure 4. Drawing of test samples (dimensions are specified in [mm]): (a) conical sample with assembly joint; (b) cylindrical sample; 1—test sample (steel); 2—pressure sleeve (copper alloy); 3—tightening screw.
Machines 08 00063 g004
Figure 5. Surface profile of burnishing samples: (a) roughness profile; (b) material ratio curve; (c) frequency density curve.
Machines 08 00063 g005
Figure 6. Photographs of samples: (a) conical test sample; (b) test sample in assembling state as a tightening joint; (c) cylindrical sample.
Machines 08 00063 g006
Figure 7. Test sample in the connector for fatigue tests (dimensions are specified in [mm]): 1—test sample; 2—pressure sleeve; 3—connector for fatigue test; 4—tightening screw.
Machines 08 00063 g007
Figure 8. Photograph of testing stand for fatigue strength: 1—support bearing; 2—joints for creating testing loads; 3—plates for assembling water cover sheet for seawater; 4—testing sample in the connector; 5—rubber cover sheet for seawater (in open position); 6—clutch; 7—motor; 8—state base; 9—sample before testing; 10—sample after testing.
Machines 08 00063 g008
Figure 9. Fatigue testing stand with equipment for testing in seawater: 1—stand body; 2—weight rod; 3—connecting pipe; 4—water pump; 5—seawater container; 6—weights.
Machines 08 00063 g009
Figure 10. The graph of fatigue strength for the cylindrical samples made with steel (C35) for different burnishing forces and to compare grinding samples. 1—the burnishing; 2—standard deviation of burnishing; 3 and 5—standard deviation of grinding; 4—the grinding; 6—approximating curve as a 2nd degree polynomial.
Machines 08 00063 g010
Figure 11. The calculated S–N curves for the samples made with steel (C35): 1—burnishing cylindrical samples by force 3 kN; 2—burnishing cylindrical samples by force 6 kN; 3—burnished conical samples by force 6 kN with a pressed-in sleeve; 4—burnished conical sample by force 3 kN with a pressed-in sleeve; 5—grinded cylindrical samples; 6—grinded conical sample with a pressed-in sleeve.
Machines 08 00063 g011
Figure 12. Fatigue fracture for conical sample burnished with the force 3 kN: 1—pressure sleeve; 2—test sample; 3—brittle fracture; 4—material flaw.
Machines 08 00063 g012
Figure 13. Fatigue fracture for conical sample burnished with the force 6 kN: 1—brittle fracture; 2—cracks on the sample surface.
Machines 08 00063 g013
Figure 14. Scheme of the equipment for machining stepped shafts on computerized numerical controlled machine tools by turning and burnishing: 1—stepper motor; 2—equipment body; 3—worm gear; 4—quick-release joint of the hydraulic system; 5—cutting insets; 6—burnishing balls; 7—slide-way of tools; 8—measuring probe; d—direction of tool offset.
Machines 08 00063 g014
Figure 15. Exemplary instruction sheet for the operation of strengthening burnishing of a B557 type marine tail shaft with the use of the equipment for turning and burnishing.
Machines 08 00063 g015
Table 1. Chemical composition and mechanical properties of the sample material.
Chemical composition [%] and mechanical properties in normalized condition of C35 (steel 1.0501)
CSiMnP
max.
S
max.
Cr
max.
Ni
max.
Cu
0.32 ÷ 400.17 ÷ 0.370.50 ÷ 0.800.0400.0400.250.250.25
Yield Strength
Re
min
Tensile Strength
Rm
min
Elongation
A5
min
Z
min
314 [MPa]530 [MPa]20 [%]45 [%]
Chemical composition [%] and mechanical properties in normalized condition for the alloy (75Cu-3Fe-8Al-2Ni-12Mn) ASTM C95700.
CuMn Al FeNi Si
7111.0–14.07.0–8.52.0–4.01.5–3.00.1
Yield Strength
[MPa]
Tensile Strength
[MPa]
Elongation
[%]
27562015
Table 2. Results of the fatigue test.
Sample No.Burnishing Force F [kN]Sample Diameter d
[mm]
Cross-Sectional Area [mm2]Stresses of Sample
[MPa]
Number of Cycle
×106
Condition of the Sample after TestingSetting Load of the Machine
[N]
13.025.00490.87292.73.691584.5
1625.00490.87259.013.50484.4
3725.00490.87222.712.00383.4
3825.01491.27222.714.01383.4
4625.01491.27297.20.8671586.4
4725.00490.87259.920.80486.4
4825.01491.27259.08.51484.4
33.025.00490.87254.111.80469.7
2125.01491.27254.18.21469.7
2325.01491.27285.14.01557.0
225.01491.27222.725.80383.4
1325.00490.87254.111.40469.7
1825.01491.27285.18.21557.0
1725.00490.87222.78.21383.4
46.025.01491.27239.311.20433.5
1525.00490.87255.09.11475.6
2525.00490.87255.010.40475.6
2625.00490.87255.021.30475.6
3525.00490.87255.09.21475.6
4525.01491.27270.26.81516.8
2125.01491.27270.25.91516.8
66.025.00490.87239.38.91433.5
1925.00490.87239.310.30433.5
1725.01491.27266.88.51509.9
3225.00490.87262.920.10498.2
3525.00490.87262.914.60498.2
1425.00490.87283.53.21557.0
2025.00490.87283.52.81557.0
0—The sample did not crack during the test; 1—The sample cracked during the test.
Table 3. Calculation results of the fatigue test on the conical samples.
The Kind of Manufacturing MethodsThe Stress Range
[MPa]
No of SampleConsidered Occurrence
Did Not DestroyDestroyedSample Did Not DestroySample Destroyed
The Level of Stressi·nii2·niThe Level of Stressi·nizi2·niz
The grinded conical samples 189.620000000
224.312111122
25902200248
∑ni = 3∑niz=4 ∑ini=1∑i2ni=1 ∑iniz=6∑i2niz=10
The conical samples burnished with the force F = 3.0 kN (on the entire length l)222.711000000
259.921122111
297.102200248
∑ni = 3∑niz=4 ∑ini=2∑i2ni=2 ∑iniz=5∑i2niz=9
The conical samples burnished with the force F = 3.0 kN (on the ½ length l)222.711000000
254.121122111
285.102200248
∑ni=3∑niz=4 ∑ini=2∑i2ni=2 ∑iniz=5∑i2niz=9
The conical samples burnished with the force F = 6.0 kN (on the ½ length l)239.311000000
266.821122111
283.502200248
∑ni=3∑niz=4 ∑ini=2∑i2ni=2 ∑iniz=5∑i2niz=9
The conical samples burnished with the force F = 6.0 kN (on the ½ length l)239.310000000
255.022122122
270.202200248
∑ni=3∑niz=4 ∑ini=2∑i2ni=2 ∑iniz=6∑i2niz=10
The bold values were adopted for the calculation of the estimated fatigue strength.
Table 4. Calculation results of the fatigue test on the conical samples.
Type of TechnologyStress Range
[Mpa]
Number of SamplesConsidered Occurrence
Did Not Destroy
ni
Destroyed
nid
Samples Did Not DestroySamples Destroyed
The Level of Stress i·nii2·niThe Level of Stressi·nidi2·nid
Ground samples223
229
235
241
5
2
1
0
∑ni = 8
0
1
2
3
∑nid = 6
0
1
2
3
0
2
2
0
∑i·ni = 4
0
2
4
0
∑i2·ni = 6
0
1
2
3
0
1
4
9
∑i·nid = 14
0
1
8
27
∑i2·nid = 36
Samples burnished with force F = 1.5 kN263
271
279
287
2
2
1
0
∑ni = 5
0
1
2
3
∑nid = 6
0
1
2
3
0
2
2
0
∑i·ni = 4
0
2
4
0
∑ini = 6
0
1
2
3
0
1
4
9
∑i·nid = 14
0
1
8
27
∑i2·nid = 36
Samples burnished with force F = 2.0 kN267
275
283
291
3
1
2
0
∑ni = 6
0
1
1
3
∑nid = 5
0
1
2
3
0
1
4
0
∑i·ni = 5
0
1
8
0
∑i2·ni = 9
0
1
2
3
0
1
2
9
∑i·nid = 12
0
1
4
27
∑i2·nid = 32
Samples burnished with force F = 2.5 kN286
292
298
304
4
1
2
0
∑ni = 7
0
2
1
2
∑nid = 5
0
1
2
3
0
1
4
0
∑i·ni = 5
0
1
8
0
∑i2·ni = 9
0
1
2
3
0
2
2
6
∑i·nid = 10
0
2
4
18
∑i2·nid = 24
Samples burnished with force F=3.0 kN292
299
306
313
2
2
3
0
∑ni = 7
0
1
2
3
∑nid = 6
0
1
2
3
0
2
6
0
∑i·ni = 8
0
2
12
0
∑i2·ni = 14
0
1
2
3
0
1
4
9
∑i·nid = 14
0
1
8
27
∑i2·nid = 36
Samples burnished with force F=6.0 kN274
283
292
301
2
2
1
0
∑ni = 5
0
1
2
3
∑nid = 6
0
1
2
3
0
2
2
0
∑i·ni = 4
0
2
4
0
∑i2·ni = 6
0
1
2
3
0
1
4
9
∑i·nid = 14
0
1
8
27
∑i2·nid = 36
The bold values were adopted for the calculation of the estimated fatigue strength.
Publisher’s Note: MDPI stays neutral with regard to jurisdictional claims in published maps and institutional affiliations.

