Abstract
Single-sided lapping is one of the most effective planarization technologies. The process has relatively complex kinematics and it is determined by a number of inputs parameters. It has been noted that prediction of the tool wear during the process is critical for product quality control. To determine the profile wear of the lapping plate, a computer model which simulates abrasive grains trajectories was developed in MATLAB. Moreover, a data-driven technique was investigated to indicate the relationship between the tool wear uniformity and lapping parameters such as the position of conditioning rings and rotational speed of the lapping plate and conditioning rings.
1. Introduction
Lapping is the basic planarization process which allows achieving a high degree of flatness and parallelism of machined workpieces. It has become a crucial finishing technology in manufacturing several parts, e.g., valve plates, ceramic sealing rings or sliced silicon wafers. The lapping process is very complex and is influenced by many technologically-based conditions. The model of the process consists of several components: lapping plate, abrasive slurry, workpieces and machine tool. These elements decisively affect the mechanism of surface formation and determine workpieces quality, tool wear and overall process efficiency. In addition, the input factors of lapping process can be classified as controllable and uncontrollable. The first group includes mainly machining parameters, i.e., lapping pressure, rotational speed of the lapping plate and conditioning rings, types of abrasive grains, tool condition and machining time. The uncontrollable parameters include the ambient temperature, grains size distribution, vibrations, internal stresses, etc. [1].
In lapping, the lapping plate has a significant impact on the dimensional and shape accuracy, as well as on the surface quality of the workpieces. The material, design and technological parameters of the lapping plates are selected depending on the desired material removal rate, required surface finish, expected flatness and hardness and geometry of the lapped workpieces [2,3]. The most important features of the tool are the mechanical properties, type of material, structure, macrogeometry and topography of the active surface [2,4]. The mechanical properties and structure of the lapping plate material have a decisive influence on the abrasion resistance and quality of the machined surfaces. The macrogeometry of the lapping plate surface has an impact on the distribution of the abrasive slurry in the working gaps, and thus on the topography of the lapped surface. Equally significant is the hardness parameter. Using a lapping plate with too high hardness causes most abrasive grains to roll, resulting in stress-induced microcracks and sedimentation of the grains in workpieces. However, this also leads to lower tool wear. On the other hand, a plate made of a material with lower hardness keeps the abrasive grain on the surface and causes more sliding movements, and the loss of material results from scratching [5,6].
In addition, the flatness of the workpieces and the proper surface finish are maintained while maintaining appropriate conditions of the process and frequently correcting the lapping plate flatness. Excessive wear of the tool by the workpieces causes the following flatness errors: concavity, convexity or the axial runout of the active surface [7]. Therefore, it is important to properly check and adjust the flatness of the lapping plate before and during the machining. Additionally, the machine operator should periodically lap the plate with fine abrasive grains to obtain a surface free from larger scratches.
The main subject of this article is the analysis of single-sided lapping systems in the aspect of wear uniformity of the lapping plate. The remainder of this paper is structured as follows. Section 2 reviews the related work on tool wear prediction in planarization technologies. Section 3 describes in detail the lapping mechanism and the influence of process parameters on the accuracy of machining. A kinematics-based model of the lapping plate profile wear, which allows analyzing lapping system parameters, as well as to control the shape of the tool in terms of the required flatness, was developed. Section 4 introduces the data driven approach to predictive modeling of lapping plate wear. Section 5 closes with conclusions and future work.
2. Related Work
Previous studies on different planarization technologies, such as lapping, face grinding with lapping kinematics or chemical-mechanical polishing (CMP), have focused primarily on analysis of abrasives path distribution, determining the technological aspects of machining new materials or study on thermal influence on the process efficiency and the workpieces quality [8,9,10]. Many studies have been published on mechanisms of material removal and the effects of input variables on material removal rate (MRR). Moreover, today’s progress in the field of machine learning allows classifying predictive methods for estimating MRR into two categories: physics-based and data-driven methods. Both types of models can also be used to determine the rate of the lapping plate wear.
2.1. Physics-Based Models
Chang et al. [11] developed the mechanical material removal mechanisms using concepts of two-body vs. three-body abrasion and ductile vs. brittle machining position information. MRR was captured in the model through the change in abrasive size distribution. Kling et al. [12] described the material removal mechanisms of the workpieces and the lapping plate in single- and double-sided lapping. Presented examples of calculations showed how to control the shape of the plate by controlling the workpiece distribution and the speed ratio. Nguyen et al. [13] studied the pad wear non-uniformity by combining the kinematic motions and contact time. It was indicated that the cutting path density and the contact time near the center of pad are higher than near the edge of the pad. Barylski and Deja [14] presented a model which based on the kinematics of lapping and local shape errors of the tool estimates the profile error. Simulation results have been compared with experimental results obtained during machining of silicon wafers. Lee et al. [15] introduced a model that estimates the MRR using a modified Preston equation. Three parameters, namely relative velocity distribution, normal contact stress distribution and chemical reaction rate distribution, were considered for obtaining the MRR profile in the copper CMP process.
2.2. Data-Driven Models
Wang et al. [16] developed a data-driven technique based on the deep belief network to reveal the relationship between MRR and polishing parameters such as pressure and rotational speeds of the wafer and pad. To predict MRR in CMP, Li et al. [17] developed a decision tree-based ensemble learning algorithm. Three decision tree-based machine learning algorithms were combined using two stacking techniques. Yu et al. [18] introduced a novel physics-informed machine learning approach. They combined a physics-based model with a data-driven model of MRR in CMP. The machine learning algorithm predicts the asperity radius and asperity density of the polishing pad is estimated by the physics-based model.
3. Physics-Based Model
The basic kinematic parameters that the machine operator can control during single-sided lapping are the rotational speeds of the lapping plate nt and the radial position R of the condition rings (together with separators and workpieces). In more complex lapping machines with forced drive, it is also possible to independently set the rotational speed of the condition rings ns. The analysis in this section aims to determine the effect of these parameters on the uniformity of the lapping plate wear.
3.1. Analysis of the Angular Velocities of the Conditioning Ring and the Lapping Plate
Based on the developed kinematic equations [19], trajectories cut on the lapping surface by abrasive grains, which are fixed in the conditioning ring and workpieces, can be generated. To analyze the effect of velocities of the lapping plate ωt and the conditioning ring ωs, the dimensionless parameter k1 is determined:
Changing the parameter k1 allows obtaining a wide range of trajectories. If the k1 parameter is positive, it means that the lapping plate and the conditioning ring rotate in the same direction, while, when the k1 parameter is negative, the directions of their rotations are opposite. In addition, a detailed analysis of generated trajectories allowed drawing the following conclusions:
- -
- For k1 < 0, generated trajectories are epicycloids, initially stretched and then interlaced.
- -
- For k1 > 1, generated trajectories are hypocycloids, initially stretched and then interlaced.
- -
- For 0 < k1 < 1, generated trajectories are pericycloids.
Moreover, it was noticed that, if the parameter k1 is a rational number, the trajectories become closed curves and the time of one complete cycle depends on the velocities ωs and ωt.
Figure 1, Figure 2, Figure 3 and Figure 4 show the influence of the parameter k1 on the shape of the trajectory, the density of trajectories on the lapping plate showed in the form of a color map and the distribution of relative velocities in time v(t). The simulations were performed for the conditioning ring distant from the center of the lapping plate by R = 117 mm and for one abrasive grain distant from the center of the guide ring by r = 50 mm. Since in each of the analyzed examples the parameter k1 is a rational number, it was assumed that the simulation time t is equal to the time of one complete cycle, when generated trajectories are closed curves, i.e., T = 60 s. It can be observed that, with changing the speed ratio of the conditioning ring ωs and the lapping plate ωt, and thus with the change of the shape of generated cycloid, the trajectory density on the plate changes as a function of the radius of the lapping plate Rd. For epicycloid trajectories (Figure 1 and Figure 2), the highest density occurs near the outer diameter of the lapping plate. The hypocycloid trajectories (Figure 3) cause a higher density of trajectories closer to the inner diameter of the plate. The most uniform trajectories distribution occurs in the case of pericycloids (Figure 4), i.e., when the parameter k1 is positive and lower than 1. On the basis of the relative velocities in time distribution v(t), the ratio of the minimum and maximum velocities vmin/vmax can be determined. It can be also noticed that the change of the relative velocity v of any point P is a periodic function. The periodicity of the function is determined from the condition of equal length of the radius Rp(t) and it is the time after which the length of the vector Rp(t) is equal to the initial length (t = 0). The duration of one cycle Tc is calculated with Equation (2) and the results for different parameter k1 are shown in Table 1.
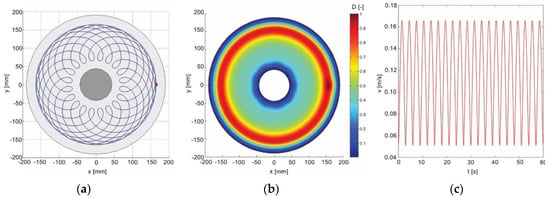
Figure 1.
The influence of the parameter k1 = −20/9 on: (a) the shape of the abrasive grains trajectory; (b) the trajectories density on the lapping plate; and (c) the distribution of relative velocities v(t).
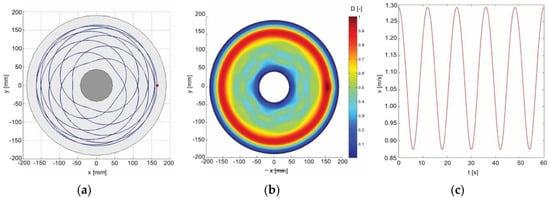
Figure 2.
The influence of the parameter k1 = −5/9 on: (a) the shape of the abrasive grains trajectory; (b) the trajectories density on the lapping plate; and (c) the distribution of relative velocities v(t).
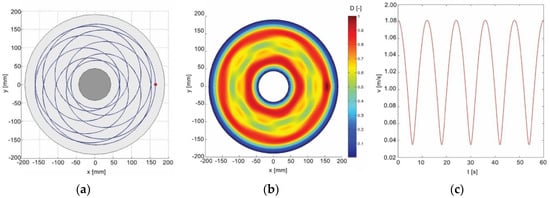
Figure 3.
The influence of the parameter k1 = 5/9 on: (a) the shape of the abrasive grains trajectory; (b) the trajectories density on the lapping plate; and (c) the distribution of relative velocities v(t).
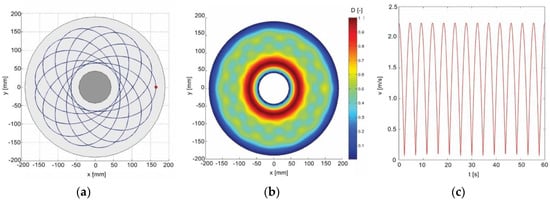
Figure 4.
The influence of the parameter k1 = 13/9 on: (a) the shape of the abrasive grains trajectory; (b) the trajectories density on the lapping plate; and (c) the distribution of relative velocities v(t).

Table 1.
Cycle duration for different parameters k1.
3.2. Analysis of the Radial Position of Conditioning Rings
The main aim of using conditioning rings in lapping process is to even the active surface of the lapping plate. In standard single-sided lapping system, the rings are driven by the friction torque between the lapping plate and the rings. In more complex machine tools, the rings can be driven separately. The radial position of the conditioning rings is usually changed manually. Shifting the rings, filled with the separators and workpieces, towards the inner or outer diameter of the lapping plate changes the contact intensity in these areas. Moving the conditioning ring towards the outer radius increases velocity in the radial section of the lapping plate. Radial displacement of the ring causes changing the parameter k1, which is related to the change of the velocity ωs. Decreasing the parameter ωs due shifting the conditioning ring to the center of the lapping plate increases the contact intensity in the outer surface of the lapping plate.
Figure 5 shows the distribution of the average relative velocity vsr as a function of the radius Rd for different values of the parameter k1 and for different radial positions of the conditioning ring R. The simulations were performed during time t = 60 s for one point distant from the center of the conditioning ring by r = 50 mm. It can be observed that, when the directions of conditioning rings and the lapping plate rotations are opposite, and when the value of the ring speed is correspondingly higher than the value of the lapping plate speed (Figure 5a), the average relative speed vsr decreases towards the outer radius of the lapping plate Rd. Moreover, for parameters k1 lower than zero (Figure 5a,b), increasing the radial position of the ring R causes an increase in the mean velocity vsr. Conversely, for k1 greater than zero (Figure 5c,d), increasing the radial position of the ring R causes a decrease in the mean velocity vsr.
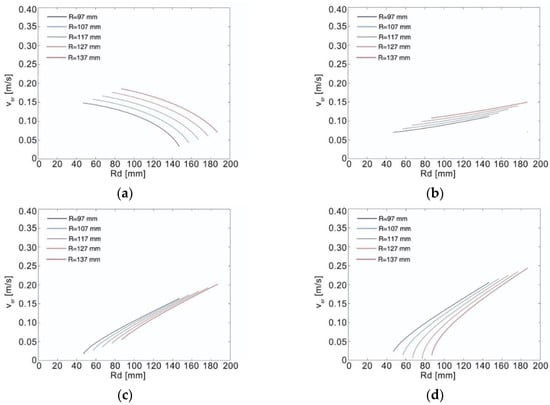
Figure 5.
Average velocity distribution vsr as a function of radius Rd for different parameters k1: (a) k1 = −20/9; (b) k1 = −5/9; (c) k1 = 5/9; and (d) k1 = 13/9.
3.3. Tool Wear Uniformity Prediction
The physics-based methods can be classified into two sub-categories: kinematics-based models and kinematics-mechanistic models. In kinematic based models, it is assumed that MRR is the product of cutting by single abrasive grains and the wear intensity depends on a contact intensity of the tool with the workpieces through the lapping abrasive grains. To determine the contact intensity, the trajectories of the randomly grains are calculated using the kinematic equations. The interpolation function is used to change these trajectories into a set of points, which are equally spaced from each other. Then, the lapping plate surface is divided into small squares with the same area. To calculate a trajectories density, a statistics function is used to count the total number of points within each square of the lapping plate surface [19].
The limitation of kinematic-based models is that the material removal mechanisms is not taken into account [18]. This can be complemented by kinematics-mechanistic modeling approaches, which take into account both kinematics and contact mechanics (Figure 6). One of the commonly used methods to predict MRR of the abrasive processes is the tribological model developed by Preston. The model relating relative velocity to pressure is known as Preston’s equation [20]:
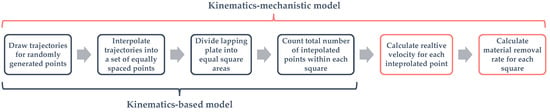
Figure 6.
Kinematics and kinematics-mechanistic models comparation.
It can be assumed that for constant conditions Preston’s coefficient K and force per unit area p are constant in time. The relative velocity of lapping v can be calculated from the developed kinematic equations [19]. By combining Preston’s model (Equation (3)) with the contact intensity, which depends on the lapping kinematics, the material removal rate by abrasive grains within the contact area Ai of the lapping plate can be determined as:
To describe the uniformity of the lapping wear, the parameter U was defined:
where SD is the standard deviation of the trajectory density and is the average value of the material removal rate.
During the lapping process, there are more than one million active abrasive grains. However, because of the very long time of the calculation, an appropriate grains number, which can reflect the same regularity as the real number, had to be determined. It was observed that, for 1000 randomly distributed particles, uniformity was stable and further increase did not affect the value of parameter U [19]. A MATLAB program was developed to simulate the trajectories, their distribution and to calculate the uniformity parameter. Uniformity was calculated on the entire lapping plate with an internal diameter of 88 mm and an outer diameter of 350 mm. The simulation time was 60 s. The simulation results are shown in Figure 7. It can be observed that, to obtain higher uniformity values in a standard lapping system, rotational speed ratio k1 should be in range 0.5–0.9. Moreover, the higher uniformity can be obtained for the central position of the conditioning ring on the lapping plate. Figure 7b shows a wear distribution on the lapping plate for the parameters R = 117 mm and k1 = 7/9 that could be considered as optimal, i.e., when the parameter U is the highest. A significant decrease in the uniformity (U < 30%) was observed when the conditioning ring was shifted towards the internal radius and the parameter k1 > 1.5 or when the ring was shifted towards the external radius and parameter k1 < −1.
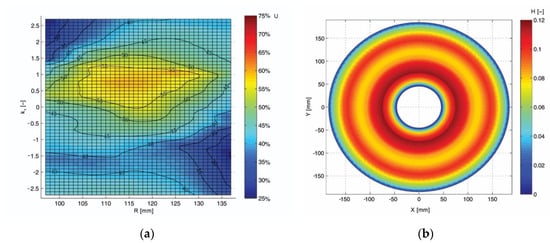
Figure 7.
Simulation results: (a) distribution of the wear uniformity U with relative to the parameter k1 and the radial position of the conditioning ring R; and (b) distribution of the lapping plate wear for parameters R = 117 mm and k1 = 7/9.
4. Data-Driven Model
Physics-based models are very effective in predictive MRR, but they involve strong assumptions, which may not hold true for certain conditions. To address these assumptions and limitations, data-driven predictive modeling methods can be used to predict MRR or tool wear. Data-driven predictive modeling methods are built upon statistical methods or machine learning algorithms, which can adaptively improve their performance with each new data sample. While machine learning methods may require large volumes of training data, they can make predictions without predetermined mechanistic relationship and system behaviors.
Experimental datasets in lapping plate wear are commonly limited in size because the tests require many and very precise measurements that are difficult to do directly on the machine tool. In addition, the tool wear over time is low due to the lapping plate hardness. However, this fact does not make machine learning impractical for predictive modeling of tool wear. There are a few common approaches that can help with building predictive models from small datasets. First, the more complex is the model, the more it is prone to overfitting. This can be avoided by cross-validation, regularization, feature selection and bucketing, which aim to reduce complexity and increase bias. With small datasets, it is important to rely on a simple classifier models, e.g., k-Nearest Neighbors (kNN), short decisions trees or Naïve Bayes. In general, these simple models are able to learn less from data than more complicated algorithms, e.g., neural networks, making them less susceptible to overfitting. Another solution for small amounts of data could be using ensemble methods. Ensembles are machine learning methods for combining multiple machine learning algorithms, which are known as base learners, into one learning algorithm. The main aim is to improve the performance of predictive models by reducing: a predictive variance by randomization, a predictive bias by boosting or both by stacking [21,22].
In this study, a data-driven method was demonstrated to predict lapping plate wear uniformity in single-sided lapping process. The data were collected from a typical single-sided lapping process conducted on the machine tool equipped with a standard lapping plate, three conditioning rings and a system that allows controlling the direction and rotational speed of the rings. The dataset contains results of lapping plate profile wear for different conditions, i.e., lapping workpieces made of different materials, different geometries, using different abrasive grains with different concentrations and for various initial state of the tool. Moreover, to determine the profile wear of the lapping plate in experimental tests, the contact method was used. This method is based on determining in the first stage the actual shape of the tool surface. The amount of wear at the measured point is determined by the difference in measurements before and after the lapping process. The measurement method was carried out with the use of a special measuring tool, which is a part of the laboratory stand. The tool consists of five dial gauges, on which the radial distance on the lapping plate can be adjusted. In these experimental tests, an equal distance between the sensors was assumed, which was 35 mm. Measurements were made on each of the 12 segments of the plate and the average value was saved in the computer program. Some of these results have already been published [19].
Due to the small number of results, only two predictors were established in the model. These are the main operation parameters of the single-sided lapping process, i.e., speed ratio k1 and radial position of the condition rings R. Based on the measurements of the lapping plate profile wear, uniformity U was calculated. Moreover, to simplify the model, the uniformity U was bucketed into five classes, which are presented in Table 2.
Table 2.
Different classes of tool wear uniformity U.
Based on the dataset presented in Figure 8, it can be observed that the uniformity U differs from the results of the kinematic-mechanistic approach. Although the distribution looks similar, the real uniformity of the lapping plate wear is relatively higher. The highest result was close to 80%, while for the simulation the highest uniformity U was around 60%. On the one hand, differences may result from the limitations of the physics-based model. On the other hand, another factor affecting the experimental results is inaccurate measuring method. Measurements in experiments were not taken over the entire length of the diameter, but only at a few points of the lapping plate.
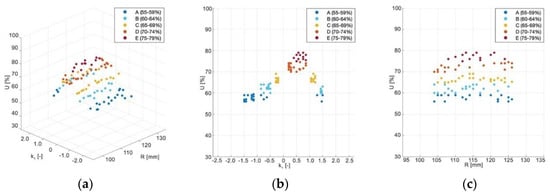
Figure 8.
Dataset used in data-driven model: (a) overall view; (b) influence of the parameter k1 on the uniformity of U; and (c) influence of the parameter R on the uniformity of U.
Moreover, the dataset was randomly divided into two groups including training dataset (80%) and test dataset (20%). Three algorithms with a use of MATLAB Machine Learning Toolbox were tested to predict tool wear uniformity: the k-Nearest Neighbors (when k = 3), decision trees and the Naïve Bayes classifiers (optimized with Kernel smoothing). Models were trained and tested 10 times and then the average accuracy was calculated. Decision tree shows the best overall accuracy (94.8%), then Naïve Bayes (89.5%) while kNN induction exhibits the worst one (68.5%). In addition, to investigate the performance of the proposed models, the multi-class confusion matrixes are shown in Figure 9. The confusion matrix counts the total number of observation values of the classification model, which were classified into the right and wrong categories. Coordinate axis of the confusion matrix represents the actual label of classification, and the horizontal axis represents the predicted class.
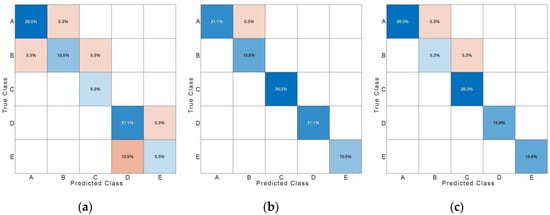
Figure 9.
Confusion matrices summarizing the accuracy results for: (a) kNN algorithm; (b) decision tree model; and (c) Naïve Bayes classifier.
5. Conclusions
The analysis of the single-sided lapping kinematics showed that the basic operation parameters influence the relative speed and significantly affect the distribution of abrasive grains trajectories. In practice, the selection of kinematic parameters is made largely intuitively, based on some experience or from the literature and then tested experimentally. The kinematic model developed in MATLAB enables simulations of a single-sided lapping process, generate trajectories of randomly chosen abrasive grains and determines the basic kinematic parameters of the process, such as relative speed v. Moreover, it calculates the uniformity of lapping plate wear U for any shape and size of the workpieces, their arrangement in separators and the assumed number of abrasive grains. Simulations of physics-based model showed that the highest uniformity of lapping plate wear (U = 58%) was obtained for the central position of the conditioning ring and when the ratio of rotational speeds of the ring and the lapping plate equals to k1 = 0.75. Moreover, a data-driven method to predict lapping plater wear uniformity was developed. Simplifying the model by bucketing the uniformity U into five classes allows using supervised machine-learning algorithms for tool wear prediction. The best accuracy was obtained for the decision tree classifier with result of accuracy 94.8%. This model had difficulty with prediction of class A, which results from too narrow range of predictors and experimental studies.
The accuracy of the data-driven method is calculated based on the number of correctly predicted classes out of all predictions. In addition, the accuracy of this method depends largely on the accuracy of the measuring method used in experimental research. Direct comparison of the lapping plate wear results in experimental tests and physics-based model is ineffectual. It should be noted that simulated in physics-based model tool wear was a dimensionless parameter and many input parameters were not taken into account. Moreover, the difference between the simulation and experimental results presented in the article is due to the limitations of the physics-based model and the fact that the wear of the lapping plate in the laboratory tests was measured only at five points.
Due to the complexity of the lapping process and interactions involved, not all the issues related to the topic were resolved. Both developed models have still limitations which, due to the importance of the problem of uneven wear of the lapping plate, should be improved. Owing to wide machine learning possibilities, the data-driven model will be expanded with new predictors: initial state of the lapping plate, lapping time and contact pressure. This will require increasing the training datasets, which requires more experimental research.
Funding
This research received no external funding.
Conflicts of Interest
The author declares no conflict of interest.
List of Abbreviations and Symbols
| A | contact area of the lapping plate (m2) |
| CMP | chemical-mechanical polishing |
| H | lapping plate wear removal rate (μm/min) |
| k | number of nearest neighbors |
| kNN | k-Nearest Neighbors algorithm |
| K | Preston’s coefficient |
| k1 | speed ratio of the conditioning ring and the lapping plate |
| MRR | material removal rate |
| nt | rotational speeds of the lapping plate (rpm) |
| ns | rotational speeds of the conditioning ring (rpm) |
| p | contact pressure (MPa) |
| R | radial position of the condition rings (mm) |
| RD | radius of the lapping plate (mm) |
| SD | standard deviation of the trajectory density |
| t | simulation time (s) |
| T | time of cycle, when generated trajectories are closed curves (s) |
| Tc | time of one cycle in v(t) function (s) |
| U | lapping plate wear uniformity (%) |
| v | relative velocity of the analyzed point P (m/s) |
| vsr | average relative velocity (m/s) |
| ωt | angular velocity of the lapping plate (rad/s) |
| ωs | angular velocity of the conditioning ring (rad/s) |
References
- Deaconescu, A.; Deaconescu, T. Experimental and statistical parametric optimisation of surface roughness and machining productivity by lapping. Trans. FAMENA 2015, 39, 65–78. [Google Scholar]
- Uhlmann, E.; Ardelt, T.G. Influence of kinematics on the face grinding process on lapping machines. CIRP Ann. 1999, 48, 281–284. [Google Scholar] [CrossRef]
- Kasai, T.; Horio, K.; Karaki-Doy, T.; Kobayashi, A. Improvement of Conventional Polishing Conditions for Obtaining Super Smooth Surfaces of Glass and Metal Works. CIRP Ann. 1990, 39, 321–324. [Google Scholar] [CrossRef]
- Marinescu, I.D.; Uhlmann, E.; Doi, T. Handbook of Lapping and Polishing; Taylor & Francis Publishing House: New York, NY, USA, 2007. [Google Scholar]
- Marinescu, I.D.; Rowe, W.B.; Dimitrov, B.; Inasaki, I. Tribology of Abrasive Machining Processes; William Andrew Publishing Ltd.: Norwich, UK, 2004. [Google Scholar]
- Feld, M.; Barylski, A. Lappen ebener Flachen mit Zweimetall-Scheiben. Werks. u. Betr. 1990, 123, 933–936. [Google Scholar]
- Deja, M. Correlation between shape errors in flat grinding. J. Vibroeng. 2012, 14, 520–527. [Google Scholar]
- Liu, H.K.; Chen, C.A.; Chen, W.C. Diamond lapping of sapphire wafer with addition of graphene in slurry. Procedia Eng. 2017, 184, 156–162. [Google Scholar] [CrossRef]
- Lu, L.Y.; Fang, C.F.; Shen, J.Y.; Lu, J.; Xu, X.P. Analysis of path distribution in lapping and polishing with single fixed abrasive. Key Eng. Mater. 2014, 589, 475–479. [Google Scholar] [CrossRef]
- Deja, M.; List, M.; Lichtschlag, L.; Uhlmann, E. Thermal and technological aspects of double face grinding of Al2O3 ceramic materials. Ceram. Int. 2019, 45, 19489–19495. [Google Scholar] [CrossRef]
- Chang, Y.P.; Hashimura, M.M.; Dornfeld, D.A. An investigation of material removal mechanisms in lapping with grain size transition. J. Manuf. Sci. Eng. 2000, 122, 413–419. [Google Scholar] [CrossRef]
- Kling, J.; Matthias, E. Workpiece material removal and lapping wheel wear in plane and plane-parallel lapping. CIRP Ann. 1986, 35, 219–222. [Google Scholar] [CrossRef]
- Nguyen, N.Y.; Zhong, Z.W.; Tian, Y. An analytical investigation of pad wear caused by the conditioner in fixed abrasive chemical–mechanical polishing. Int. J. Adv. Manuf. Technol. 2015, 77, 897–905. [Google Scholar] [CrossRef]
- Barylski, A.; Deja, M. Wear of a tool in double-disk lapping of silicon wafers. In Proceedings of the 5th International Manufacturing Science and Engineering Conference (MSEC 2010), Erie, PA, USA, 12–15 October 2010; pp. 301–307. [Google Scholar]
- Lee, H.; Jeong, H. A Wafer-Scale Material Removal Rate Profile Model for Copper Chemical Mechanical Planarization. Int. J. Mach. Tools Manuf. 2011, 51, 395–403. [Google Scholar] [CrossRef]
- Wang, P.; Gao, R.X.; Yan, R. A deep learning-based approach to material removal rate prediction in polishing. CIRP Ann. 2017, 66, 429–432. [Google Scholar] [CrossRef]
- Jia, X.; Di, Y.; Feng, J.; Yang, Q.; Dai, H.; Lee, J. Adaptive Virtual Metrology for Semiconductor Chemical Mechanical Planarization Process Using GMDH-Type Polynomial Neural Networks. J. Process Control 2018, 62, 44–54. [Google Scholar] [CrossRef]
- Yu, T.; Li, Z.; Wu, D. Predictive modeling of material removal rate in chemical mechanical planarization with physics-informed machine learning. Wear 2019, 426, 1430–1438. [Google Scholar] [CrossRef]
- Barylski, A.; Piotrowski, N. Non-conventional approach in single-sided lapping process: Kinematic analysis and parameters optimization. Int. J. Adv. Manuf. Technol. 2019, 100, 589–598. [Google Scholar] [CrossRef]
- Evans, J.; Paul, E.; Dornfeld, D.; Lucca, D.; Byrne, G.; Tricard, M.; Klocke, F.; Dambon, O.; Mullany, B. Material Removal Mechanisms in Lapping and Polishing; University of California: Berkeley, CA, USA, 2003; pp. 611–633. [Google Scholar]
- Zhou, Z.H. Ensemble Methods: Foundations and Algorithms; CRC Press: Boca Raton, FL, USA, 2012. [Google Scholar]
- Li, Z.; Wu, D.; Yu, T. Prediction of Material Removal Rate for Chemical Mechanical Planarization Using Decision Tree-Based Ensemble Learning. J. Manuf. Sci. Eng. 2019, 141, 031003. [Google Scholar] [CrossRef]
© 2020 by the author. Licensee MDPI, Basel, Switzerland. This article is an open access article distributed under the terms and conditions of the Creative Commons Attribution (CC BY) license (http://creativecommons.org/licenses/by/4.0/).