Abstract
The paper focused on a topic related to the possibilities of using wavelet analysis to evaluate the changes in the geometrical structures of the surfaces arising during the honing process with whetstones with variable granularity. The cylinder liners of the combustion engine are machined elements. The basics of the wavelet analysis and the differences between filtering with standardized filters (e.g., Gauss filter), Fourier analysis, and the analysis of the results obtained when measuring the surface roughness with other wavelets were described. Trials of honing four cylinder liners were carried out. Roughness measurements of 3D spatial structures of the prepared liners were made. The principle of selecting wavelets for roughness assessment of structures with cross-hatch pattern was described. Roughness structures generated on the honed surfaces of cylinder liners were assessed using Gaussian filtration and Morlet, Daubechies Db6, and Mexican hat wavelets. In order to demonstrate the differences generated when the Gaussian filtration and selected wavelets were used on surface structures, the surfaces obtained with the use of these filtering tools were subtracted from each other, which allowed obtaining information about the changes occurring on the assessed surfaces, which were generated after the use of various filtering tools. For the assessed surfaces, during the subtraction operation, the mean square error was calculated, informing about the degree of similarity of both compared surfaces. The result of the work carried out is the creation of basic recommendations for the selection of wavelets when assessing honed surfaces with different degrees of regularity of the traces generated on them.
1. Introduction
Nowadays, machining remains the basic manufacturing technique in the industry. The possibilities it offers, in terms of versatility and availability, place machining in the first place, among other techniques. The rapid development of automation and digitalization in machining will ensure its leading position in the near and, probably, in the distant future. Current trends in the industry require maximum flexibility of the production from the manufacturers. Development of Industry 4.0 and many other factors proves that machining is and will be the main choice among other manufacturing techniques.
Wherever production appears, there is also a need to control its effects. Roughness, next to the waviness, is one of the most basic features of the surfaces obtained in the machining process. Roughness measurement allows us to assess the quality of the surface of a given object and classify it as a product needing further machining or as a finished product.
For most applications, linear measurement is perfectly sufficient. This refers especially to one-directional structures, whose surface topography is rather repetitive. However, in some cases, it becomes necessary to use 3D roughness measurement. This enables not only a better understanding of the nature of a surface itself, but it is generally needed when phenomena of contact between two elements are involved, and we cannot limit ourselves only to the analysis of a single profile [].
Measurement of the surface geometric structure in 3D provides us much important information about it. Modern measurement systems provide the user with enormous possibilities of analysis and facilitate it, for instance, through the implementation of tools for graphical presentation of the results. The obtained results are usually affected by errors resulting from the method itself or the measurement conditions []. Many kinds of filters are used to screen out irregularities, of which Gaussian filter is most common. A standardized Gaussian filter is widely described in the literature, in terms of interpretation and calculations relatively easy in use, and most likely used by all devices for the analysis of the geometrical structure. It is calculated based on the Fourier transform, which is the basic tool for analysis and signal processing. The Fourier transform itself is a great tool in the case of stationary signals, and a Gaussian filter is a great tool for general filtering. However, in the case of non-stationary signals or when we want to filter specific parameters or analyze the results for specific properties, they lose their relevance. This is where the wavelet transform comes in handy. It is a transformation similar to Fourier’s transformation, but with the main difference being the so-called “kernel transformation”. When the Fourier transform is based on the kernel of the sinusoidal function, the wavelet transform uses wavelets, which are is an infinite number. This gives an enormous number of possibilities for signal analysis.
2. Wavelet Analysis
In order to analyze the results in a broad sense, various tools and methods are used to help the user obtain the desired information. The obtained measurement results are often burdened with measurement errors or disturbances, making it difficult to obtain a real picture of the situation. For this purpose, various types of filtration are used to separate the above-mentioned disturbance. In the case of signal analysis of devices used for roughness measurement, methods, such as Gaussian filtration or wavelet analysis, are used and have been briefly described in this chapter.
Both the Gaussian filter and the wavelet analysis are based on Fourier transform, although the Gaussian filter is being calculated on its basis; meanwhile, wavelet transform is, in a way, its extension. It is a transformation similar to the Fourier transform, relying just like it on the scalar product operation.
The Fourier transform is a linear operator defined on certain functional spaces. The elements of these spaces are functions of n real number. In Fourier transform analysis, the harmonic sine wave and cosine harmonic wave are multiplied by a signal. The final integration provides guidance on the signal for a given frequency. A classic example of this is the signal spectrum, a signal’s energy in a given point in its frequency domain [].
By changing the time-value system for the frequency-value system, valuable information about the time is lost during the transformation when the event occurs (Figure 1).
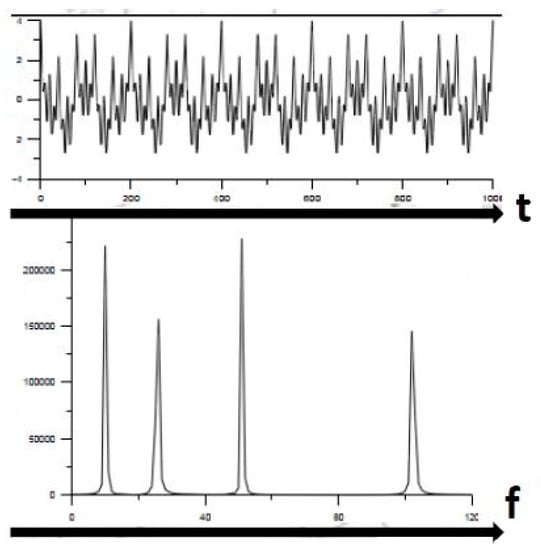
Figure 1.
Exemplary signal and its transformation using the Fourier transform [].
The analysis of the transformed signal shows that the tested signal consists of four harmonic frequencies; however, it cannot be deducted from it how each of the components changes in time.
The Fourier transform is reversible, so by having the same F(u) transform, it is possible to determine the original signal before transformation [].
Intensive development of the methodology related to wavelet transform occurred at the beginning of the 20th century. Wavelet transform found broad applications across many branches of science, mainly due to the possibilities it offers. The wavelet transform, as previously mentioned, is similar to the Fourier transform, as it is based on the use of the scalar product of a given signal and a part called the transformation kernel. The main difference between these two is precisely the kernel. In the Fourier transform, the sinusoidal function is used as a kernel, which means that every function will be represented continuously by one selected frequency. Whereas, in the wavelet transform, the kernel is a function called wavelet, which fulfills the requirements of the time-frequency analysis [].
Unlike the wave, wavelet has continuous oscillatory waveforms, which have different durations and spectrum. It is finite energy that is concentrated around one point and has a mean value of zero. There is an infinite number of wavelets, so it is possible to perform an infinite number of wavelet transforms depending on the kernel used. The kernel of the wavelet transform is usually denoted by the symbol Ψ, and it is simultaneously the time function t, the scale parameter a, and the translation parameter b. The parameter a shifts the wavelet spectrum in the frequency domain, while b parameter shifts it in time. Therefore, when the standard Fourier transform gives us ideal localization possibilities in the frequency domain but does not allow localization in the time domain, the use of the wavelet transform complements these deficiencies and enables us to perform full time-frequency analysis. Additionally, the time resolution of the wavelet transform is variable and depends on the wavelet frequency.
where a—scale parameter, b—time translation parameter, S(t)—analyzed signal, Ψ((t-b)/a)—the kernel of the wavelet transform, SΨ (a, b)—wavelet transform.
The scale parameter decides what pseudo-frequency will be represented by the wavelet. It always has values greater than zero, and they are inversely proportional to the pseudo-frequency of the wavelet (Figure 2). The factor is responsible for wavelet normalization. This process is designed to keep the energy of the wavelet function constant in case of using different scale factors. The translation parameter (Figure 3) is responsible for the shift of the function, along with the tested signal. Changing the translation parameter moves function along the time axis [].
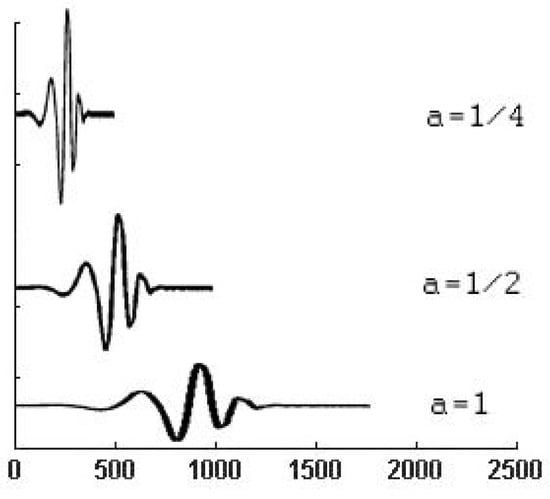
Figure 2.
Example of the impact of changes in the scale factor on the wavelet [].

Figure 3.
Effect of changing the translation parameter on wavelet [].
Similarly to the method with Gaussian filtration, here also two complementary filters are used: high-pass (so-called wavelet) and low-pass (scaling function). The wavelet analysis should be initiated by selecting a proper type of wavelet, and its shape must be as similar as possible to the analyzed signal to obtain the best results possible.
A number of studies have shown the use of different types of wavelets for signal analysis, of which the oldest and the simplest one is the Haar wavelet (HW)—originally called the Haar expansion. A significant disadvantage of the Haar wavelet is its non–differentiability. It is discontinuous, and therefore it is impossible to approximate continuous, smoothed functions. Additionally, the possibility of frequency localization is low in its case. Despite the fact that over the years, many other and more advanced wavelets have been invented, the HW is still willingly used due to its simplicity. In the papers [,], the analysis of signals with these functions was proposed in case of monitoring of the tool failure in machines and for analysis and optimization of drive systems. The best known, however, is a tool for actions on images, such as decomposition or compression, which is a typical use of discrete wavelets [].
An extension of the Haar wavelet family is the Daubechies wavelet, whose characteristics are the compactness of the carrier with length 2N − 1 (N is a wavelet row), a relatively simple form and an exact approximation of the function. What is more, the Daubechies Db1 wavelet corresponds to the Haar wavelet. Besides, as the row of the wavelet increases, the number of coefficients describing it increases too, and the waveform becomes smoother; as a result, it is often used as a tool for signal analysis. In [], it was used to evaluate the chip formed during turning of S45C carbon steel, while in [], to evaluate the vibrations generated during turning.
Wavelet analysis has been used in many studies of very diverse physical phenomena and in technical applications. The wavelet that appears most frequently in research related to signal analysis is the Morlet wavelet. This wavelet is a continuous wavelet characterized by good frequency resolution. It cannot be used for multiresolution analysis as it does not have a scaling function. However, it is an overt wavelet, so it can be represented by means of mathematical dependencies in the time domain. An example of the use of this wavelet can be found in the research [] for the evaluation of the surface on the contact area between reinforcement and concrete. In [], for the assessment of the phenomena occurring in the construction of motor vehicles during a collision.
Another wavelet, well described in research papers about signal analysis, used to assess the damage of the bearings operating in an electric motor is the Mexican hat wavelet []. Like the Morlet wavelet, it has no scaling function but has good frequency resolution. It comes from the Gaussian wavelet family—it is proportional to the function, which is the second derivative of the Gaussian probability density. Its name derives from a characteristic shape resembling a Mexican sombrero. Another example of the use of wavelet analysis as a tool to support the diagnosis of bearing damage and the assessment of its possibility of further use is the paper [].
Analyzing, evaluating, and forecasting surface roughness is a very difficult issue. It is described by a large number of parameters, and their values are influenced by a number of different factors and input sizes to the machining process. Mathematical modeling can be used to predict surface roughness. This method is particularly important in case of difficulty in obtaining the actual surface. An example of modeling, where the predominating phenomena, leading to the obtaining of the machined surface, are physical and mechanical phenomena, is publication [].
With a large number of factors affecting surface roughness, the optimal selection of machining parameters is very important. Such selection results in the appropriate, desired, and expected values of the roughness parameters. This is mainly the case in finishing machining, in particular, abrasive. In order to achieve the assumed surface roughness in the manufacturing process, optimization can be carried out using a number of different methods and models. An example may be the ANOVA analysis [] or the Monte Carlo method []. The ANOVA method is also used for multi-criteria optimization of the manufacturing process, in which the machinability indicator is not only surface roughness but also, for example, the vibration of the machining system []. Another example of optimization is the use of a hybrid WOA (Whale Optimization Algorithm) algorithm. Using this algorithm, a combination of machining parameters is obtained, which ensures maximum material removal speed and minimum surface roughness []. Neural networks and genetic algorithms are also used to predict machining effects and optimize the input parameters of the process [].
Optimization methods give you the opportunity to select the input parameters for the process, which guarantees the surface roughness at a certain level. In many situations, especially in the case of surfaces with a special geometric structure, special application, or the surface of elements responsible, e.g., in aviation, a detailed analysis of these surfaces should be carried out. It can be assumed that a standard assessment using the roughness parameters obtained by Gaussian filtration is sufficient. On the other hand, since wavelength analysis is used to diagnose bearing damage, it can also be used to detect any deviations in the geometric structure of the machined surface.
That is why wavelet analysis, as an auxiliary tool for assessing surface roughness, has been studied by many scientists around the world. Such results can be found in, e.g., [,,]. In [], the Morlet wavelets and the Mexican hat were used to assess the condition of the turned surface of the C45 steel with a hardness of 55HRC. It was stated in this work that a Mexican hat wavelet gives information about the distribution of the roughness profile extremes and their values but does not allow for a precise evaluation of the wavelength. On the other hand, the Morlet wavelet allows the evaluation of the wavelengths of the profile components, but the information about their amplitudes is not accurate. In addition, it allows finding and assessing the intensity of disturbances occurring during machining, in particular disturbances in machining traces, and also to isolate major changes in line spacing along the entire length of the profile. In [], 40 wavelets were tested in order to select the appropriate roughness for monitoring roughness during CNC (Computer numerical control) turning. The signals of the sensor measuring the vibrations were correlated with the measured surface roughness. Only a small number of mother wavelets showed good and relevant results. This shows that the mother wavelets should be selected according to the typology of the signal and the monitored factor. Moreover, it was found that the level of decomposition is very important. Too little or too much decomposition makes the results incorrect.
Attempts are made to use wavelet analysis to describe surface roughness also after erosion treatments. An example can be the work []. In the case of honed surfaces, the use of wavelet analysis to describe the surface condition was proposed in [].
Attempts are being made to combine wavelet and fractal analysis as tools to describe the condition of machined surfaces []. In addition, advanced surface roughness analyses and geometric surface structures can be applied not only to the surfaces of machined components but also to cutting tools, more specifically, as analysis to support the assessment of tool wear. These can be very helpful tools, e.g., to assess the wear traces of tool coatings. The topic of a selection of suitable coatings for the machining of hard-to-machine materials and the assessment of their degree of wear is very important, and many scientific studies are raising this subject, e.g., in [,].
Despite a number of literature sources on the use of the wavelet transform to assess the surface condition of machined elements, this topic is still not fully understood and requires continuous research. Hence, the authors’ interest in this subject.
3. Measurement Methodology
The aim of the work was to determine the possibility of using wavelet analysis to describe surface features obtained by abrasive treatment on the example of honing. The traces on such surfaces are random but also directional. Hence, their analysis may cause a number of difficulties. In order to achieve the goal of the work, it was necessary to perform tests according to a strictly defined plan:
- -
- perform samples in a wide range of processing parameters so that it is possible to obtain characteristic traces on the surface but with different features,
- -
- measure surfaces using the contact or non-contact method,
- -
- perform initial filtration in the surface analysis program by leveling the measurement and removing shape errors,
- -
- perform an analysis aimed at selecting a wavelet or a wavelet family,
- -
- filter the surface with a Gaussian filter and selected wavelets, the effect of which will be the separation of surface roughness from waviness,
- -
- compare the obtained 3D roughness and the calculated roughness parameters by Gaussian filtration and wavelets.
It was decided that the analyses would be performed on surfaces and not on roughness profiles. On the one hand, the easiest and most reliable way to select a wavelet for the roughness profile is when analyzing the surface roughness. On the other hand, one or even several profiles may not give enough information about the geometric structure of the surfaces. Hence, the authors decided to select the surfaces that were assembled by the software from 256 profiles.
In this research, four samples were tested, and their machining parameters are listed in Table 1. Each of the tests was performed with the same feeds and speeds but with a different granularity of the grinding stones. The abrasive grit size impacts the differences in the character and functional characteristics of the obtained surfaces.

Table 1.
Machining parameters of the tested liners.
Then, the state of the geometrical structure of the surface layer for each sample was measured using a Mitutoyo profilografometer, model SURFTEST SV-3200 (Figure 4), equipped with the MCubeMap Ultimate software. It is a contact measurement device, the performed measurements are fully automated, and it creates both surface roughness profiles and so-called contour maps (3D), allowing detailed analysis and processing of the obtained results.
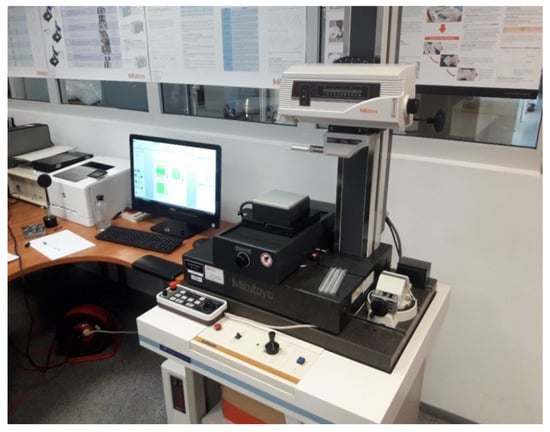
Figure 4.
Mitutoyo profilografometer SURFTEST SV-3200.
4. The Proposition of Selection of the Wavelet Type for the Assessment of the Flat-Top Structures with a Cross-Hatch Pattern
The compliance of the wavelet shape with the shape of the analyzed signal is an important factor of the wavelet analysis—the higher it is, the better results will be obtained as a result of the wavelet transform. In order to determine which wavelets will meet the above standards during the first phase of the analysis, a series of conversions of the measurements results of the liner number 1 (Table 1) was performed with the Daubechies wavelet using three different scaling sequences, and, for each applied row, at different filtering levels, respectively. The obtained results were compared with the result of the roughness profile filtrated using a standardized Gaussian filter. Therefore, the correctness of the results can be assumed. The Gaussian filtration with λc = 0.25 mm was used, and the results for filtration with Gauss filter for sample 1 are presented in Figure 5.
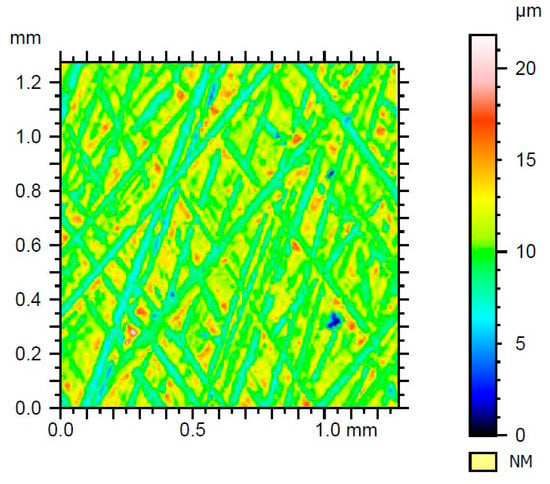
Figure 5.
Measured roughness of sample no. 1 after filtration with Gaussian filter.
First, the Daubechies wavelet Db1 with the filtration levels of 1 and 6 was used to analyze the surface with a flat-top character. However, the nature of this wavelet (largely resembling the Haar wavelet) and analysis of the surface images obtained after its application led to the conclusion that the Db1 wavelet was not suitable for the analysis of this type of signal. This was confirmed by the results presented in Figure 6 and Figure 7.
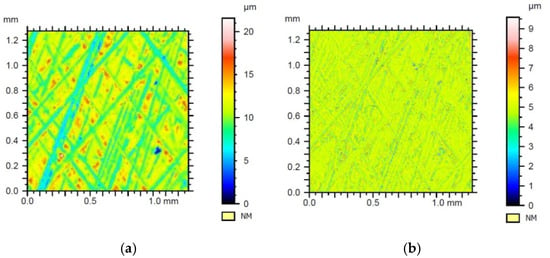
Figure 6.
Results of filtration of the surface geometrical structure of sample 1 with Daubechies wavelet on the 1st row with the 1st level of filtration—(a) waviness, (b) roughness.
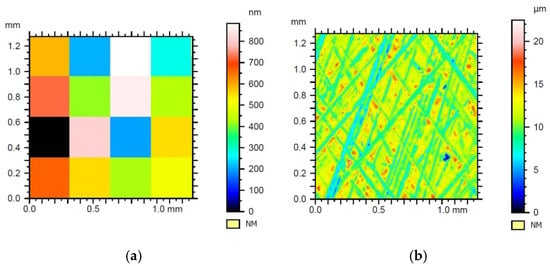
Figure 7.
Results of filtration of the surface geometrical structure of sample 1 with Daubechies wavelet on the 1st row with the 6th level of filtration—(a) waviness, (b) roughness.
In the next step of wavelet selection, the Daubechies wavelets on the 3rd and 6th row were used to describe the surface geometrical feature after honing with filtration level, respectively, from 1 to 6 and from 1 to 5. The results obtained for both Db3 and Db6 at low levels of filtration were rejected due to the large discrepancy with the result obtained with Gaussian filtration. For both tested wavelets, the obtained results were compared with the results obtained for Db3 and Db6, with the filtration level 5th being identical. Therefore, for further analyses, it was decided to use only Daubechies 6th row wavelet on at least the 5th level of the filtration. According to the authors of the study, only this level of filtration ensured complete filtering of the characteristic cross-intersecting traces from the waviness structure and their location on the roughness side. Figure 8, Figure 9, Figure 10, Figure 11, Figure 12 and Figure 13 show the exemplary results of wavelet transformations with Db3 and Db6 wavelets on different levels of the filtration.
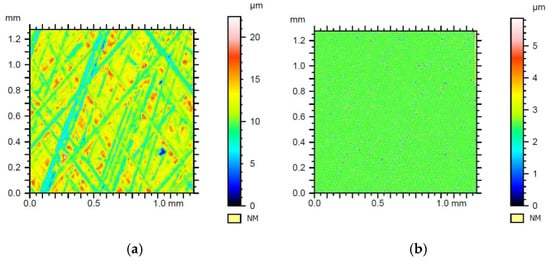
Figure 8.
Results of filtration of the surface geometrical structure of sample 1 with Daubechies wavelet of the 3rd row with the 1st level of filtration—(a) waviness, (b) roughness.
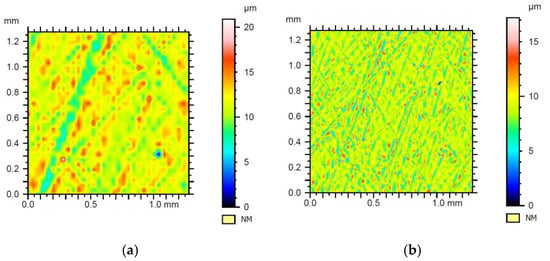
Figure 9.
Results of filtration of the surface geometrical structure of sample no. 1 with Daubechies wavelet of the 3rd row with the 3rd level of filtration—(a) waviness, (b) roughness.
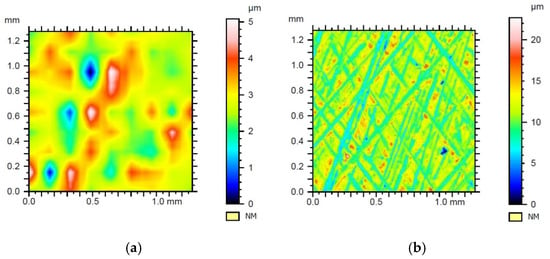
Figure 10.
Results of filtration of the surface geometrical structure of sample no. 1 with Daubechies wavelet of the 3rd row on the 5th level of filtration—(a) waviness, (b) roughness.
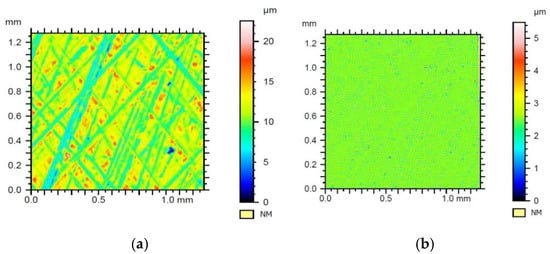
Figure 11.
Results of filtration of the surface geometrical structure of sample no. 1 with Daubechies wavelet of the 6th row with the 1st level of filtration—(a) waviness, (b) roughness.
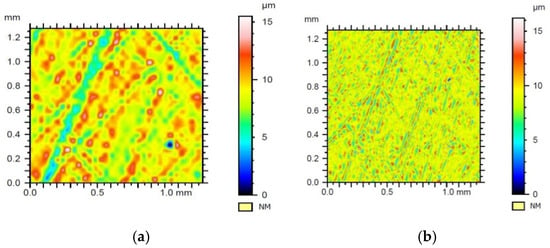
Figure 12.
Results of filtration of the surface geometrical structure of sample no. 1 with Daubechies wavelet of the 6th row with the 3rd level of filtration—(a) waviness, (b) roughness.
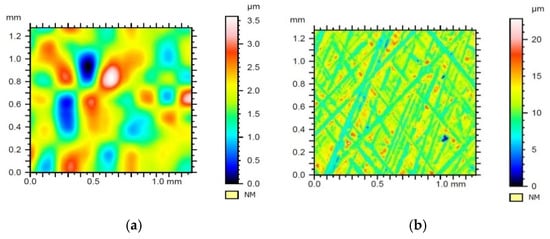
Figure 13.
Results of filtration of the surface geometrical structure of sample no. 1 with Daubechies wavelet of the 6th row with the 5th level of filtration—(a) waviness, (b) roughness.
Based on subsequent analyses, two more wavelets were proposed for the assessment of the flat-top surfaces—the Morlet wavelet and the “Mexican hat” wavelet. Those wavelets had a similar shape, as previously selected Db6 wavelet. For these two wavelets, using at least the 5th level of the filtering was also proposed. However, during further research, it was found that for the Morlet wavelet, the highest possible setting of filtering was level 4th. Therefore, in this case, it was impossible to use the 5th level of filtration, which would correspond to the level of filtration used for the other wavelets.
5. Tests Results and Their Analysis
The measurements for all four samples, described in Table 1, were made using a square-shaped surface with a side length of 1.28 mm, with a resolution of 5 μm. The measurements were presented as a contour map of 256 linear measurements and 256 × 256 measurement points. Subsequently, they were presented as a contour map. The results for raw measurements for each sample were subjected to the following processes: leveling, shape removal, and filtration with Gauss filter with λc = 0.25 mm or with wavelets selected in Section 4. Wavelets selected for research are shown in Figure 14. The initial surfaces for testing (samples 1–4) after their leveling and shape removing are shown in Figure 15.

Figure 14.
Wavelets used in the research: (a) Daubechies of 6th row, (b) Morlet, (c) Mexican hat [].
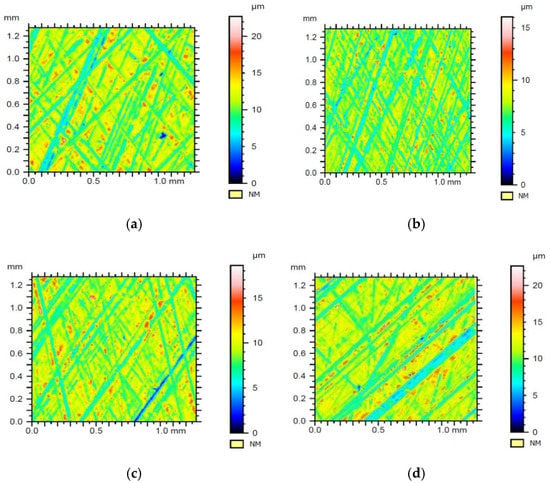
Figure 15.
Surfaces of the samples tested with flat-top structures after their leveling and shape removal: (a) sample 1, (b) sample 2, (c) sample 3, (d) sample 4.
To assess the suitability of the individual wavelets used to describe geometrical features of the tested surfaces, the obtained results were compared with those achieved if the standardized Gaussian filter was used.
Additionally, the difference between contour maps of the surfaces obtained by Gaussian filtration and wavelet transformation would be calculated. This process would generate the root mean square error necessary to investigate the similarities between both surfaces and differences between the filtration tools; the lower the coefficient value, the higher the surface similarity. For each of the map differences, spatial parameters would be calculated and presented.
5.1. Sample 1
Sample 1 was honed with the 55 grit whetstone. The results for the Gaussian filtration compared to other preselected types of wavelets are shown in Figure 16. Table 2 shows the set of values for the selected 3D spatial parameters for surfaces shown in Figure 17.
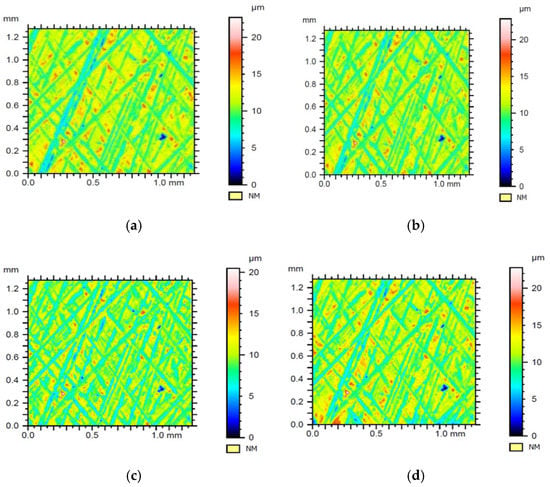
Figure 16.
The surface of sample 1 with a flat-top structure after leveling and shape removal and application of (a) Gaussian filtration, (b) Daubechies wavelet, (c) Morlet wavelet, (d) Mexican hat wavelet.

Table 2.
Selected special parameters calculated for surfaces shown in Figure 17.
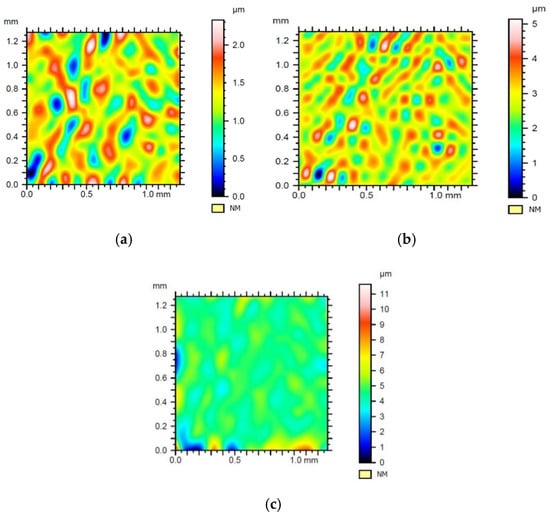
Figure 17.
Surfaces created as a result of subtracting structure obtained with a wavelet from the structure after applying Gauss filtering: (a) Daubechies wavelet, (b) Morlet wavelet, (c) Mexican hat wavelet. The root mean square error: (a) 0.36 µm, (b) 0.62 µm, (c) 0.68 µm.
Figure 17 shows the differences in contour maps between the surfaces obtained after the application of the Gaussian filter and surfaces generated after other wavelets were used.
As can be seen in Figure 16a, based on low values of Sp and Sv parameters in comparison to the Sa parameter value (Table 2), it could be determined that the surface topography was quite regular. The Sku parameter value also confirmed this regularity. Therefore, in this case, the analysis of the parameters did not provide a clear difference between the wavelet transform with Db6 wavelet and Gauss filtering. The root mean square error value of 0.36 μm determined a fairly high degree of similarity for both surfaces. However, when analyzing Figure 17a, it can be seen that the area where the difference between Gaussian filtration and Db6 wavelet appeared (marked in red) overlapped with the edge of the furrows on the surface of the tested sample. Since the furrows were places where the profile height changed rapidly with respect to the material core, it could be concluded that wavelet transform with Db6 wavelet enhanced the zones of the greatest signal gradient.
In the case of Figure 16b, the root mean square error value was twice as high, which means the similarity between reference surfaces was significantly smaller. The Sku value was similar to the one in the first case, but the value of the Sa parameter had almost doubled (Table 2). Therefore, the examined surface was regular. However, the average height of the material core was higher, and the surface topography had greater peaks and valleys, as evidenced by Sp and Sv parameters. In this case, high values of Spd and Spc parameters deserved special attention. They, respectively, informed us about a large number of peaks (and their density) and about their average curvative. When looking at the contour map in Figure 17b, it can be seen that red zones were showing large differences between reference surfaces located on the borders of furrows, in places where the height change occurred. This led to the conclusion that the Morlet wavelet transformation allowed finding zones where local changes of signal occurred.
The 3rd contour map (Figure 17c) was the result of the surface difference obtained using Gaussian filtration and the Mexican hat wavelet transform and had a very similar value of the root mean square and Sa parameter to Figure 17b. However, in contrast to the previous contour maps, the values of Sku, Sp, Sv parameters were much higher. This means that with the general regularity of the core topography on the contour map, there were single large valleys and peaks, rarely scattered over the entire surface of the sample, indicated by the low value of the Spd parameter. This means that the “Mexican hat” wavelet primarily filtered zones in which the signal extremes were located.
5.2. Sample 2
Sample 2 was honed with 75 m grit whetstone. The use of a whetstone, with a smaller granularity and abrasive grains, stacked closer together, gave more furrows less roughness and a surface with more regular topography. As a result, this affected the outcome of the wavelet transform. The low root mean square error values obtained during the surface subtraction operation of 0.18 μm, 0.27 μm, and 0.31 μm indicated a high degree of similarity of the surfaces obtained when using selected wavelets to the surfaces filtered with standardized Gaussian filter which are shown in Figure 18. Therefore, in the case of surfaces with more regular topography and lower roughness values, the effect of selected wavelet transform was similar to the use of Gaussian filtering, and the importance of the method itself decreased.
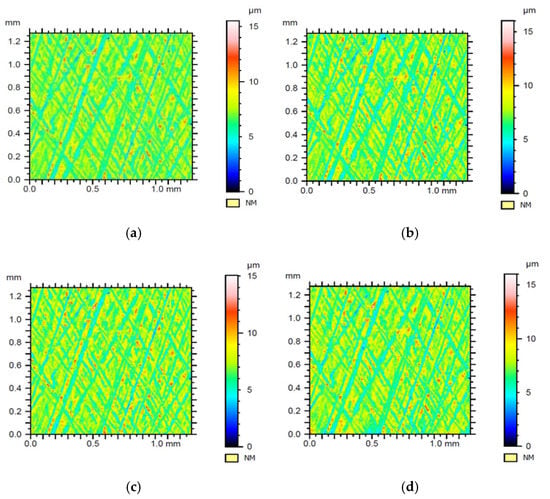
Figure 18.
The surfaces of sample no. 2 with a flat-top structure after its leveling, shape removing, and applying: (a) Gauss filtering, (b) Daubechies wavelet, (c) Morlet wavelet, (d) Mexican hat wavelet.
Despite the greater similarity of contour maps of surface differences, for sample no. 2, the same trends were maintained, as in the case of sample 1. Similarly to sample 1, in sample 2, the Db6 wavelet generated the lowest values of roughness height (amplitude) parameters Sp, Sv, and Sa (Table 3). However, for sample 2, it was more difficult to see the visual relationships described for sample 1. This further confirmed that the use of selected wavelets was less important for the detection of features in case of similar surfaces. The high value of Spd parameter (Figure 19b) and high values of parameters Sp, Sv, and Sa with a low value of Spd parameter (Figure 19c) confirmed the hypothesis for using Morlet wavelet to find individual peaks and valleys and Mexican hat wavelet to filter entire zones, where extreme signals were present.

Table 3.
Selected spatial parameters, calculated for surfaces shown in Figure 19.
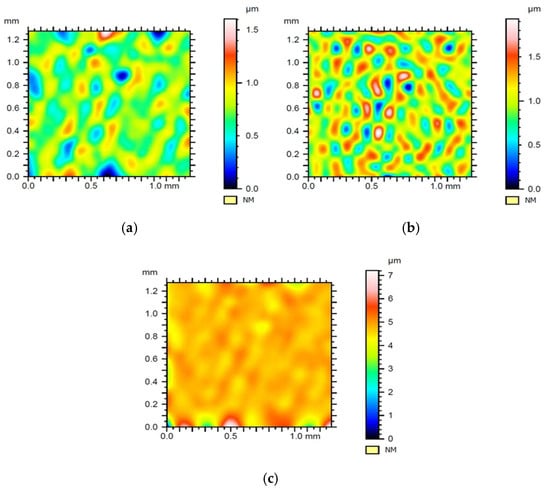
Figure 19.
Surfaces created as a result of subtracting the structure obtained with wavelet from the structure after using Gaussian filtering: (a) Daubechies wavelet, (b) Morlet wavelet, (c) Mexican hat wavelet. The root mean square error: (a) 0.18 µm, (b) 0.27 µm, (c) 0.31 µm.
5.3. Sample 3
Sample 3 was machined with the 85 grit whetstone. The surface topography for sample 3 was less regular than the one for sample 2, despite using smaller abrasive grains of the whetstone. A significant number of single peaks scattered over the entire sample surface with one furrow with a significant depth located in the right, and the lower corner is visible in Figure 20. This might indicate the additional point flashes of material formed along with deeper scratches.
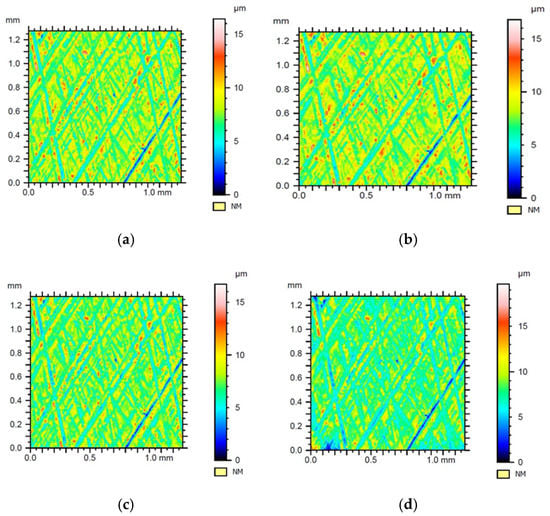
Figure 20.
The surface of sample no. 3 with a flat-top structure after leveling, shape removing, and applying: (a) Gaussian filter, (b) Daubechies wavelet, (c) Morlet wavelet, (d) Mexican hat wavelet.
The results for the root mean square errors for sample 3 were higher than for sample 2. Hence, it could be concluded that the selected types of wavelets might be well used for assessing the uniformity of scratches depth made during honing with 85 grit whetstone and uniformity of the material machined or when the whetstones generating such errors were used.
Further analysis of the results for sample 3 revealed that only transformation with a Mexican hat wavelet showed differences in surfaces when compared to samples 1 and 2 (Figure 21). A similar tendency of the Sku, Sp, and Sv parameters was observed when compared to previous samples. However, the value of the Spd parameter was 0; therefore, the value of the Spc parameter could not be calculated (Table 4). This was due to the location of extremes (both single point peaks and several deeper scratches visible on all measured surface). Mexican hat wavelet emphasized the extreme points (especially towards the valleys) and made it possible to detect the additional point zone of the material valley, which is visible in the left low corner of Figure 20d.
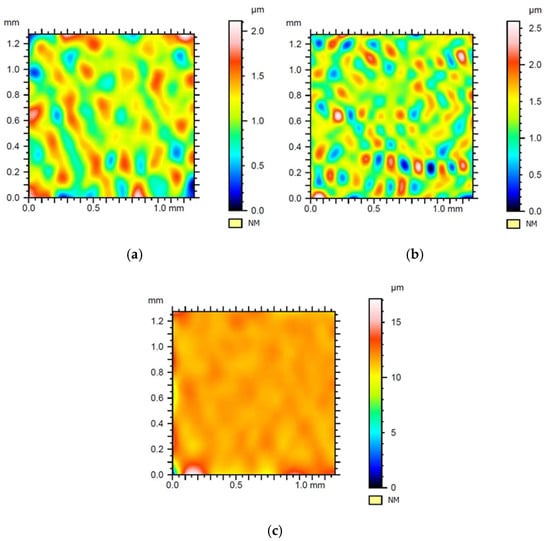
Figure 21.
The surface was created as a result of subtracting the structure obtained with the wavelet from the structure after applying Gaussian filtration: (a) Daubechies wavelet 6, (b) Morlet wavelet, (c) Mexican hat wavelet. The root mean square error: (a) 0.28 µm, (b) 0.32 µm, (c) 0.53 µm.

Table 4.
Selected spatial parameters, calculated for surfaces shown in Figure 21.
5.4. Sample 4
This chapter reviews sample no. 4, which was machined with two 55 grit whetstones and four 75t grit whetstones. Figure 22a–d show results of filtration with the Gaussian method compared to the wavelet transform with three types of wavelets. Table 5 shows a set of values of selected 3D spatial parameters for surfaces presented in Figure 23a–c. This figure presents contour maps of differences between the surfaces obtained after applying Gaussian filtering and surfaces, for generating which, the wavelets of tested types were used.
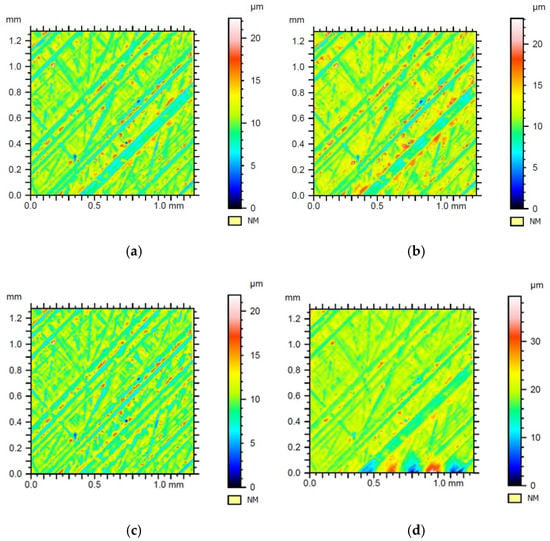
Figure 22.
Surfaces of sample no. 4 with flat-top structure, after leveling, shape removing, and applying: (a) Gaussian filter, (b) Daubechies wavelet, (c) Morlet wavelet, (d) Mexican hat wavelet.

Table 5.
Selected spatial parameters calculated for surfaces shown in Figure 23.
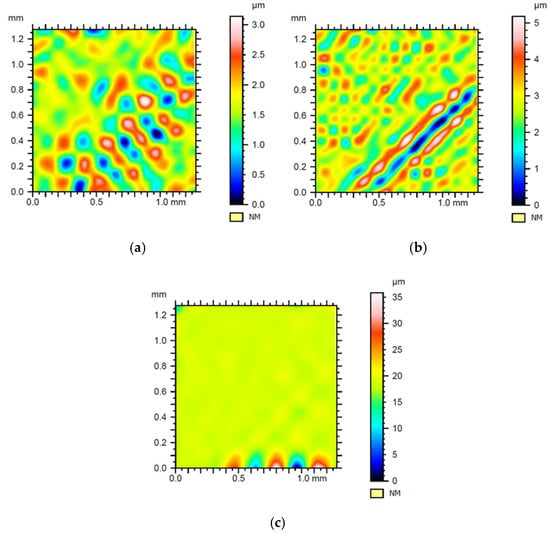
Figure 23.
The surface was created as a result of subtracting the structure obtained with the wavelet with the wavelet from the structure after applying Gaussian filtration (a) Daubechies wavelet, (b) Morlet wavelet, (c) Mexican hat wavelet. The root mean square error: (a) 0.48 µm, (b) 0.72 µm, (c) 1.63 µm.
Figure 22 displays the differences in widths and the arrangement of furrows obtained when using different types of whetstones in one tool. The contour maps presented in Figure 23 show the same trends as previous samples and confirm initial conclusions. Both contour maps, shown in Figure 21c and Figure 23c, share a number of key features. The use of the Mexican hat wavelet led to the detection of places where extreme points were placed (visible in the lower part of Figure 23c). Their detection made it impossible for the program to calculate the values of Spd and Spc parameters. The occurrence of extreme places near the border of the measurement field might indicate that the Mexican hat wavelet could be particularly useful for the detection of errors in these very places of the assessed images. The Gaussian filter (due to its characteristics) introduced, particularly, many inaccuracies for this kind of sample.
6. Summary and Conclusions
The paper presents the results of research and analyses of the application of the wavelet transform to assess the surface condition of honed cylindrical sleeves. The advantage of the presented method is the possibility of quick analysis, which can be performed in one software, which is often available with a measuring device. In the course of the research, it is found that the application of various types of wavelets for the profile analysis allows us to identify and observe different properties, such as profile roughness or the fragments of the surfaces measured. The appropriate wavelet will emphasize the feature we want to highlight. The Daubechies wavelet allows for the observation of places with a high signal gradient and highlights the areas where the signal value changes significantly. While the Morlet wavelet shows the zones of local changes of a signal, and the Mexican hat wavelet exposes points of local extremes.
As seen above, it has many advantages. However, the findings in this report also show a number of disadvantages, which are shown when samples with a high degree of regularity and low roughness parameters are used. Therefore, the above recommendations for the use of individual types of wavelets best works for sample 1, which is characterized by a high degree of profile irregularity. Subsequent samples, especially sample 2, which is the most regular of all and whose roughness profile does not have many defects, shows that the use of wavelet analysis (in the scope of evaluated wavelets) is not applicable, or its application is limited due to the significant similarity of the surfaces obtained after filtration with standardized Gaussian filter and analyzed wavelets.
In conclusion, a wavelet transform is a useful tool, supporting the analyses of the roughness profile in terms of searching for signal properties other than the classical methods of its filtering. The major limitation of this method is the selection of the appropriate wavelet for the assessment and observation of individual groups of features occurring on the real surfaces. The second limitation is the fact that wavelet transforms, using each of the wavelets applied in this paper, do not meet the expectations when profiles or surfaces with a high degree of regularity and low values of peaks or valleys to the average surface are analyzed. Therefore, there is a selection of another wavelet of which properties and shape will be a better fit for the nature of the analyzed signal.
The next stage of the research will be the analysis of the possibility of using the wavelet transform to evaluate the geometrical structures of surfaces with different properties. The result of extensive research should be a set of recommendations on what types of wavelets should be used to describe a specific type of surface geometric structure. The development of such a set of recommendations will significantly speed up the entire analysis.
Author Contributions
Conceptualization, M.K. and P.K.; methodology, M.K.; software, P.K.; validation, M.K., P.K. and M.W.; formal analysis, P.K.; investigation, M.K..; resources, M.K., P.K., M.W.; data curation, M.W.; writing—original draft preparation, M.K.; writing—review and editing, M.W.; visualization, M.W.; supervision, P.K.; All authors have read and agreed to the published version of the manuscript.
Funding
This research received no external funding.
Conflicts of Interest
The authors declare no conflict of interest.
References
- Wieczorowski, M. Theoretical Foundations of the Spatial Analysis of Surface Irregularities; Publishing house of Wrocław Board FSNT NOT: Wrocław, Poland, 2013; pp. 7–34. (In Polish) [Google Scholar]
- Chmielik, I.; Czarnecki, H. Surface Topography Analysis in 3d System Using Filtration in Rectangle Format; Mechanik: Warszawa, Poland, 2016; Volume 7, pp. 664–665. [Google Scholar]
- Sundararajan, D. Discrete Wavelet Transform: A Signal Processing Approach; John Wiley & Sons: Singapore, 2015. [Google Scholar]
- Białasiewicz, J. Wavelets and Approximations; Wydawnictwa Naukowo-Techniczne: Warszawa, Poland, 2004. (In Polish) [Google Scholar]
- Daubechies, I. Ten Lectures on Wavelets; Society for Industrial and Applied Mathematics: Philadelphia, PA, USA, 1997. [Google Scholar]
- Glabisz, W. Package Wavelet Analysis in Problems of Mechanics; Oficyna Wydawnicza Politechniki Wrocławskiej: Wroclaw, Poland, 2004. (In Polish) [Google Scholar]
- Lee, B.Y.; Tarng, Y.S. Application of the Discrete Wavalet Transform to the Monitoring of Tool Failure in End Milling Using the Spindle Motor Current. Int. J. Adv. Manuf. Technol. 1999, 15, 238–243. [Google Scholar] [CrossRef]
- Kosicka, M. Possibilities of Using Haar Wavelets for Analysis and Optimization of Drive Systems (In Polish); Prace Instytutu Elektrotechniki: Warszawa, Poland, 2002; Volume 214, pp. 99–116. [Google Scholar]
- Zawada-Tomkiewicz, A. Analysis of the Image of the Machined Surface for the Purpose of Estimating the Parameters of this Surface. Acta Mech. Autom. Białystok 2007, 1, 79–84. (In Polish) [Google Scholar]
- Tangjitsitcharoen, S.; Haruetai, L. Hybrid monitoring of chip formation and straightness in CNC turning by utilizing Daubechies Wavelet Transform. Procedia Manuf. 2018, 25, 279–286. [Google Scholar] [CrossRef]
- Garcia Plaza, E.; Nunez Lopez, P.J. Application of the wavelet packet transform to vibration signals for Surface roughness monitoring in CNC turning operations. Mech. Syst. Signal Process. 2018, 98, 902–919. [Google Scholar] [CrossRef]
- Chang, C.-C.; Yu, C.-P.; Lin, Y. Distinction Between Crack Echoes and Rebar Echoes Based on Morlet Wavelet Transform of Impact Echo Signals. NDT E Int. 2019, 108. [Google Scholar] [CrossRef]
- Karimi, H.R.; Pawlus, W.; Robbersmyr, K.G. Signal reconstruction, modeling and simulation of vehicle full-scale crash test based on Morlet wavelets. Neurocomputing 2012, 93, 88–99. [Google Scholar] [CrossRef]
- Liu, W.Y.; Han, J.G. The optimal Mexican hat wavelet filter denoisig method based on cross-validation method. Neurocomputing 2013, 108, 31–35. [Google Scholar] [CrossRef]
- Nikravesh, S.Y. Intelligent Fault Diagnosis of Bearings Based on Energy Levels in Frequency Bands Using Wavelet and Support Vector Machines (SVM). J. Manuf. Mater. Process. 2019, 3, 11. [Google Scholar]
- Brown, I.; Schoop, J. An Iterative Size Effect Model of Surface Generation in Finish Machining. J. Manuf. Mater. Process. 2020, 4, 0063. [Google Scholar]
- Ezeddini, S.; Boujelbene, M.; Bayraktar, E.; Ben Salem, S. Optimization of the Surface Roughness Parameters of Ti–Al Intermetallic Based Composite Machined by Wire Electrical Discharge Machining. Coatings 2020, 10, 900. [Google Scholar] [CrossRef]
- Kowalczyk, M.; Tomczyk, K. Procedure for Determining the Uncertainties in the Modeling of Surface Roughness in the Turning of NiTi Alloys Using the Monte Carlo Method. Materials 2020, 13, 4338. [Google Scholar] [CrossRef] [PubMed]
- Kuntoglu, M. Modeling of Cutting Parameters and Tool Geometry for Multi-Criteria Optimization of Surface Roughness and Vibration via Response Surface Methodology in Turning of AISI 5140 Steel. Materials 2020, 13, 4242. [Google Scholar] [CrossRef]
- Tanvir, M.H. Multi-Objective Optimization of Turning Operation of Stainless Steel Using a Hybrid Whale Optimization Algorithm. J. Manuf. Mater. Process. 2020, 4, 64. [Google Scholar] [CrossRef]
- Lalwani, V. Response Surface Methodology and Artificial Neural Network-Based Models for Predicting Performance of Wire Electrical Discharge Machining of Inconel 718 Alloy. J. Manuf. Mater. Process. 2020, 4, 44. [Google Scholar]
- Josso, B.; Burton, D.; Lalor, M.J. Frequency normalised wavelet transform for Surface roughness analysis and characterisation. Wear 2002, 252, 491–500. [Google Scholar] [CrossRef]
- Gogolewski, D. Influence of the edge effect on the wavelet analysis process. Measurement 2020, 152, 107314. [Google Scholar] [CrossRef]
- Rishi Pahuja, M. Ramulu Study of surface topography in Abrasive Water Jet machining of carbonfoam and morphological characterization using Discrete Wavelet Transform. J. Mater. Process. Tech. 2019, 273, 116249. [Google Scholar] [CrossRef]
- Grzesik, W.; Brol, S. Wavelet and fractal approach to surface roughness characterization after finish turning of different workpiece materials. J. Mater. Process. Technol. 2009, 209, 2522–2531. [Google Scholar] [CrossRef]
- Mahashar Ali, J.; Siddhi Jailani, H.; Murugan, M. Surface roughness evaluation of electrical discharge machined surfaces using wavelet transform of speckle line images. Measurement 2020, 149, 107029. [Google Scholar] [CrossRef]
- Sabri, L.; Mezghani, S.; Mansori, M.; Zahouani, H. Multiscale study of finish-honing process in pass production of cylinder liner. Wear 2011, 271, 509–513. [Google Scholar] [CrossRef]
- Li, G.; Zhang, K.; Gong, J.; Jin, X. Calculation method for fractal characteristics of machining topography surface based of wavelet transform. Procedia CIRP 2019, 79, 500–504. [Google Scholar] [CrossRef]
- Silva, F.J. Machining GX2CrNiMoN26-7-4 DSS Alloy: Wear Analysis of TiAlN and TiCN/Al2O3/TiN Coated Carbide Tools Behavior in Rough End Milling Operations. Coatings 2019, 9, 392. [Google Scholar] [CrossRef]
- Vitor, F.C.; Francisco, J.G. Recent Advances on Coated Milling Tool Technology—A Comprehensive Review. Coatings 2020, 10, 235. [Google Scholar]
Publisher’s Note: MDPI stays neutral with regard to jurisdictional claims in published maps and institutional affiliations. |
© 2020 by the authors. Licensee MDPI, Basel, Switzerland. This article is an open access article distributed under the terms and conditions of the Creative Commons Attribution (CC BY) license (http://creativecommons.org/licenses/by/4.0/).