Abstract
The article is dedicated to research of the technical state of a furnace transformer. The study was conducted on the basis of statistical processing of continuously measured parameters of partial discharges (PD). The authors characterize the causes of PD occurrence and their impact on the insulation condition. The article provides information on the on-line monitoring system applied at high-voltage transformers of superpowered arc steel-melting furnaces and ladle furnaces at metallurgical plants. The system implements (among other methods) the method of diagnosing the insulation state by means of mathematical processing of PD parameters. Continuously measured values are apparent charge and the parameter called partial discharge intensity (PDI) characterizing the power and intensity of PD. The authors studied the parameter trends and conducted the statistical processing of the measurements results. In addition, the authors give the rationale for the application of the parameter “reciprocal stochastic connection force” between the PD amplitude and PDI as a generalized criterion of the insulation state and failure localization. The article compares trends of power and PD amplitude at various transformer technical states (before and after unscheduled repair). The authors confirm the possibility to diagnose emerging defects by comparing the correlation factors of these dependences. An example of defect occurrence and its location is provided. As a result, the authors manage to prove the efficiency of the proposed method of analysis of the high-voltage transformer state. This research has produced an integrated approach that enables on-the-go technical diagnosis, fault localization, and accident prevention. The key product of this research is a transformer diagnosis method based on processing the data of online PD monitoring. To that end, the proposed method uses statistical toolkits available for a PC. The areas for further prospective research are outlined. The authors also give recommendations on a more extensive application of the developed method.
1. Introduction
The condition of the insulation always determines the reliability of the devices in which it is used. Damage can occur in old insulation due to defects that appear in it. Unpredictable deterioration of insulation parameters that takes place for external reasons, is superposed on the naturally ageing of insulation. The most efficient operative method for diagnosing the state of high-voltage insulation without disabling the equipment is detection and analysis of partial discharges. Analyzing partial discharges allows detecting the deterioration of insulation state at early stage.
Implementing monitoring and technical state diagnosing systems in high-voltage transformers is the necessary condition for their accident-free operation [1]. This problem becomes even more acute for transformers in superpower arc steel furnaces and ladle-furnaces at iron and steel plants. This is due to the fact that furnace transformers operate in heavy conditions caused by abruptly variable loads related to arc-jet melt and secondary steel-refining technologies [2]. The problem can be solved through online partial discharge monitoring and developing the interpretation of measurements results. According to this, a lot of companies are involved in developing hardware diagnosing devices. At the same time, it must be noted that forming the scientific and methodical basics of online monitoring is somewhat ignored. It concerns developing methods for isolating and identifying faults during operation.
The developed diagnostic systems of the following companies are popular: GE Energy [3], ABB (software & hardware complex AHC (Asset Health Center), the systems ABB T-monitor, ABB TEC) [4,5,6], Siemens (Legacy Transformer Monitoring and Diagnostic System TMDS 2000L) [7,8], AREVA (system MS 3000) [9,10], and others. They are intended for monitoring the state of insulation of mains and unit transformers. However, the presented products cannot be “directly” applied at electric furnace transformers because of the specific features of their load modes explained by the applied metal-melting technology. In this sense, the authors manage to develop a special system for monitoring the state of this transformer class which is presented below.
Virtually all modern on-line monitoring systems use partial discharge investigations as a main diagnostic method. The theory and practice of applying the methods based upon electromagnetic and acoustic PD location is considered in the publications of many authors, including [11,12,13,14]. Most developed systems implement methods relying upon the combination of PD pulses with the voltage sine waves of transformer phases. Such a method is implemented in the developed system algorithms. This allows assessment of risk of the defect propagation and also localize of its occurrence with approximation to the phase.
At the same time, insufficient attention is paid to the development of scientific and methodological basics of on-line monitoring. First and foremost, this relates to the development of the methods for comprehensive assessment of insulation condition by using a set of diagnostic parameters, while also addressing defect identification and localizing on the go. The developed methods are implemented on the basis of processing the results of measurements conducted with the help of the on-line system with a set periodicity. For this purpose, the publications [15,16,17] suggest statistical methods of analyzing the results of PD measurements obtained with the use of acoustic emission method. Paper [18] presents the main methods of diagnosing the technical state of electric equipment. They are described in the Russian regulatory documents and implemented in the algorithms of the furnace transformer state-monitoring system.
2. Problem Statement
Furnace transformers operate in heavy conditions. They are exposed to short circuits on the secondary coil and to switching surges during on-load switching of voltage stages. These take place up to 1000 times a day. They are usually equipped with complex oil-water cooling systems. Transformers of this type are distinguished by the absence of redundancy and impossibility of switching off during the melting process.
Operational experience shows that regular checks and tests are not sufficient to detect inceptive faults. Due to this, acute problem solving which can allow for reliable operation of electric steel furnaces is equipping their transformers with continuous technical state-monitoring systems. Despite the significance of this problem, we must state that there is no sufficient expertise in developing and implementing diagnosing systems in such specific electric equipment.
In order to remedy the situation, the universal technical state-monitoring system to be used in furnace transformers, was developed. It is designed for practical use in transformers of superpower arc steel furnaces and ladle-furnaces that usually belong to the single technology line of the electric furnace steelmaking. As a technical basis, the Transformer Diagnostics Monitor (TDM) was taken [19]. Software Inva was developed, designed to output data acquired from a set of diagnosed objects. The device Minitrans, manufactured by Kelman Ltd. (Boston, MA, USA), was used for continuous humidity and oil-dissolved gas content control [20].
Concentrations and combinations of gases are important diagnostic criteria that describe the progression of destructive processes that insulation might be sustaining. This is an important issue that has been covered by many researchers; however, it is not the subject matter of this paper. The presented data relate to partial discharge in the transformer tank. These parameters are measured by a special subsystem to monitor partial discharges, as shown in Figure 1.
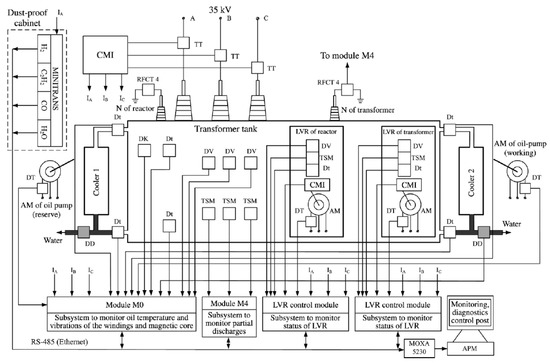
Figure 1.
Functional diagram of the furnace transformer state-monitoring system: TT—current transformer; DV—vibration sensor; Dt—temperature sensor; DD—pressure sensor; TSM—partial discharge sensor; DK—climate sensor.
Characteristics of the Developed Monitoring System
The system developed was called TDMS—Transformer Diagnostics Monitor Special (see Figure 1 for the functional diagram) [17]. It consists of five primary-sensor modules and the main device, all installed in the cabinet. The system ensures execution of all technical functions recommended for transformers of this type [21].
All technical means of the system are implemented in the form of a modular, algorithmically integrate structure. The system was divided into separate modules based on the following criteria [22]:
- highest possible integration of all functions related to monitoring, control, and diagnosing the separate transformer subsystem into the single module;
- adding a module to or removing it from the system bears changes to functional capabilities of the system, but it does not have any impact on the capabilities of other modules;
- reconfiguring the operational algorithms of the entire monitoring system after changing the number of modules can be easily conducted through changing the configuration parameters;
- adding the new module to the system automatically connects it to the central monitoring module. Integration of data acquired from all the modules is conducted through the single digital and analog buses. Such a configuration allows for implementing the structure required for each object.
The developed on-line monitoring system was introduced into industrial operations at the transformers of two superpower arc steel-melting furnaces with the volume of 180 tons—DSP-180 (transformers FTOHBR-150200/35 of the company TAMINI, Milano, Italy) and two transformers ЭTЦHKB-40000/110-UHL-4 produced by JSC “Electrozavod” (Moscow, Russia) installed at the transformers of the ladle furnaces of a metallurgic plant with a full technology cycle. The rated parameters of LF transformers are provided in Table 1 [23].

Table 1.
Parameters of the transformer ETCNKV-40000/110.
The system can use acoustic sensors rated for 30 to 300 kHz. The transformer in question is equipped with RFCT-2 (radio frequency current transformer) HF(High Frequency) sensors [24].
In order to provide efficient operation of online monitoring systems, the multiparameter diagnosis of the technical state is being developed [17,25]. These systems implement one of the efficient methods for diagnosing the state of high-voltage equipment through mathematic treatment of integral properties of partial discharges. Partial discharges reach the controllable level at the early stage of a deficiency. This is why their emergence and intensity are significant for diagnostics, while the control method based on detecting partial discharges is of the high diagnostic value [14,26].
As a methodology for operative controlling and forecasting the transformer state, statistic data treatment methods were suggested to process information presented in the form of smoothed time series [25]. The necessity in evaluating the speed of change of parameters monitored for the purpose of forecasting the time period during which these parameters reach the threshold values corresponding to qualitative criteria of “worsened” and “pre-fault” states, was substantiated.
Experience of diagnosing complex electrotechnical systems shows that persistent values of attributes and their correlation degree are most indicative of the technical condition. However, the practice indicates poor informational compatibility between monitoring systems manufactured by different companies. The body of mathematics developed acts as the basis of the information system allowing for making credible conclusions regarding the technical state of a transformer (or any other electrotechnical complex) during operation.
The presented publication analyzes the technical state of the electric furnace transformer by means of comparing the data obtained during operation before and after repair. This repair was not scheduled, and the decision about its conduct was taken on the basis of the technical state analysis on the parameters obtained from the introduced system of on-line monitoring. Referring the transformer to repair was mainly necessitated by the significant PD power and amplitude deviation in Phase C, see Figure 2a. Increased concentrations of oil-dissolved main gases (hydrogen, acetylene, carbon monoxide, etc.) were observed, as they reached pre-fault thresholds [25].
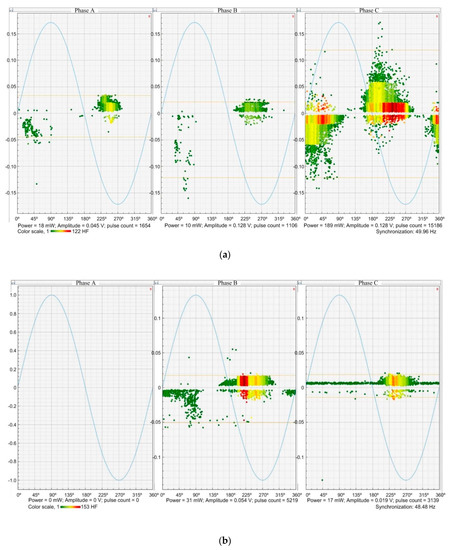
Figure 2.
Partial discharges (PD) distribution in the phases before transformer taking out for repair (a) and after repair (b).
Along with the overview of the proposed diagnostic method, such an approach demonstrates the possibilities for the developed method application.
3. Materials and Methods
3.1. Partial Discharges (PD) Occurrence in the Transformer Insulation
A partial discharge is a low-power electric spark which occurs inside the insulation or on its surface in medium- and high-voltage equipment [27]. PD occurrence is caused by the fact that complete insulation breakdown does not happen at some single point. As a rule, it is preceded by the discharges that close a part of the insulation clearance, that is why they are called “partial”. Increase in PD intensity is a signal of emerging failure, in addition, PD, in their turn, destroy insulation.
Figure 2a,b present PD curves in the phases of high-voltage input of the considered transformer [28] registered before and after unscheduled repair correspondingly. They are matched with phase voltage sine waves. The range of PD intensity change in Figure 2a corresponds to the boundaries 0–122 cps, in Figure 2b—0–153 cps. The largest amplitude and capacity PD charge before repair are registered at the phase C.
Y-axis is scaled in volts; its scale matches the PD voltage amplitude. The figures also show the voltage sinusoids for the phases subject to PD monitoring. These voltage curves were plotted to confirm that partial discharge was indeed observed on the descending segments of sinusoids. The scale of phase voltage is not specified for Y-axes as this data is not informative; rather, it would clutter the figure and make it less readable.
The PD on the phases before and after repair are given in Table 2. PD capacity in phase C exceeds the similar values in the phases A and B by 10 and 19 times, the number of pulses is higher that similar values by 9 and 14 times, correspondingly. A more detailed analysis of PD diagnostic parameters is provided below in the consideration of practical diagnostics results.

Table 2.
PD parameters in the phases before and after transformer repair.
3.2. Integral Properties of Partial Discharges
During long operation of the implemented system, trends of integral properties of partial discharges were studied and registered by the online monitoring system in three phases of the electric furnace transformer. These properties are the following [29]:
- Apparent Charge, Q02 (nC), proportional to max pulse amplitude. The operating system was set so that the duration of a pulse would be no longer than 640 ns, while during the consequent 2560 ns, there should be no pulses with the amplitude higher than 30% of the initial pulse. In case these conditions are not met, the pulse is considered a distorting action and not registered. Pulses of partial discharges are considered to be regularly repeating if their frequency equals to 0.2 of the pulse value per power network period. When registering partial discharges using almost all known devices, the amplitude (pulse voltage, U02 (mV)) is measured. The apparent charge is found by the following formula: Q02 = 10∙U02 (in relative units), which simplifies system configuration.
- Partial Discharge Power, in most cases presented in the form of PDI. This parameter characterizes the power and intensity of partial discharges, found by the following formula:where m stands for the number of pulses registered during observation time T; Ud—stands for the effective voltage.
Measurements were taken at operating voltage while the transformer was running; see Table 1 for rated parameters. Primary winding voltage = 110 kV.
The change of the time trend toward the abrupt increase of Q02 and PDI definitely indicates insulation issues (destructive). 3–4-fold changes per observation year or 2-fold jump mean that the deficiency grows in the insulation [30].
The PDI parameter is the most informative one as partial discharges are not only the “precursors” of hazardous phenomena occurring in insulation but, to some extent, they also destroy it. That is why PD energy characteristics allow gobjective indirect assessment of their hazard rate to be given in the context of the development of destruction processes.
Regulatory documents give the limit values characterizing the technical state of transformer insulation according to partial discharge control. According to recommendations [30], the following limit values are taken for high-power transformers:
- Worsened State: Q02 > Qg1 = 2.5 nC, U02 > Ug1 = 80 mV; PDI > PDIg1 = 60 mW;
- Pre-Fault State: Q02 > Qg2 = 5 nC, U02 > Ug2 = 160 mV; PDI > PDIg2 = 80 mW.
More detailed gradation of the technical state according to the results of discharge control is provided in Table 3.

Table 3.
Detecting transformer insulation technical state on the results of PD control.
In the process of operating the system introduced for the transformer ETCNKV -40000/110, the authors analyzed the trends of the parameters Q02 and PDI for transformer phases. Such trends allow the rate of defect propagation to be obtained and, correspondingly, the extent of fault hazard. Continuous monitoring of the PD amplitude and capacity showed that their trends have a similar nature. The signal of amplitude of recurring pulses U02 is read from a terminating resistor of PD sensors and due to this reduplicates the signal of the maximum measured charge Q02 [29]. The presence of such discharges influences the PDI capacity.
Below, the authors provide the results of the analysis of diagnostic parameters for a long period of operation (approximat. 2 years). It is established that the reference data have a significant spread of data, in addition, there is a large number of zero values (up to 10%–13% of a total samples). This is connected to the fact that the operation of the PD measurement system cannot be synchronized with the operation of a furnace transformer as its load continuously changes until it is switched off. To conduct the analysis, the authors carried out primary processing of time-series data: eliminated zero values and serious errors, and checked that the distribution law and the reference data were adjusted by the moving average method [31].
4. Time-Series Data Processing Methods
A preliminary processing of measurement results is necessary to use statistical methods for building up empirical dependences in the most correct way and to their maximum effect. Preliminary experimental data processing is conducted for the purpose of eliminating gross errors and validating for compliance of their distribution with the law of normal distribution. Practical application showed that even at the automated data collection one can observe abnormal or outstanding values. Gross error occurrence can be caused by: devices and sensors switching off, their subsequent operation in the mode close to a steady-state one, and the errors of data transition and storage under the action of strong electromagnetic disturbances.
4.1. Elimination of Observation Errors
The references point to a large number of methods for eliminating gross observation errors. For large samples (N > 25) it is recommended to use the “elimination algorithm by the Student t-test”. By this test one can calculate the maximum absolute deviation of the dmax value of the variation xi in the “problem” point from the average value of the total sample and the parameter τmax included in the Grubbs’ test [32]:
where σ—mean square deviation.
The authors define the value:
for two levels of significance α = 5% and α = 0.1% where tα,N-2—table value of Student distribution.
Furthermore, the decision is made depending on the compliance with the conditions:
- at —xi not eliminated;
- at —xi eliminated;
- at —elimination xi by the user’s preference.
The algorithm for eliminating gross errors is presented in Figure 3, the process of data elimination recurs until the value of xi is eliminated otherwise the calculation is stopped.
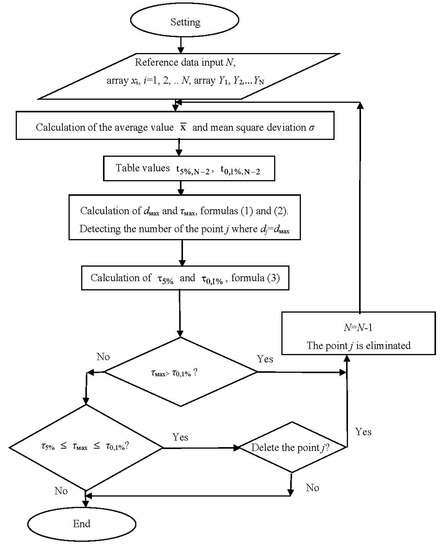
Figure 3.
Functional diagram of gross error elimination by the Student’s t-test.
4.2. Distribution Law Checking
For quite a wide class of samples 3 < N < 1000 the test of the normal distribution hypothesis can be conducted using the range of variation as a criterion R = xmax − xmin [33]. To do this, one should obtain the ratio R/σ, and further it is compared with the critical upper RN and lower RL limits of this ratio at the set significance level. If R/σ < RL or R/σ > RN, the hypothesis on the normal distribution is rejected. Correspondingly, in case:
the hypothesis on the normal distribution is accepted. The lower RL(N,α) and upper RN(N,α) limits are set as tabulated for all significance levels, 5% or 10%.
According to the considered algorithm and dependences (1)–(5) the authors developed the software “Preliminary data processing” in VBA (Visual Basic for Applications) MS Excel. The software allows automatic elimination for gross errors in experimental data to be conducted and checked the hypothesis on their normal distribution with the use of mean absolute deviation and variation range methods.
4.3. Adjusting Time Series
In those cases when the trend has insignificant fluctuations within rather short time periods and it is impossible to present it as a simple function of time, one applied adjusting statistical procedures also known as filtration. One of the most wide-spread methods of time-series adjustment is the moving average method. When this method is applied, one can eliminate random fluctuations and obtain the values corresponding to the influence of main factors. The moving average method is based upon the analysis of a time segment containing the N parameter values and their substitution with the average values of groups consisting of m < n values (m—uneven, m = 3, 5, 7 …). The average value of the group is obtained by the formula [34]:
where p = (m − 1)/2—number of points included in the calculation on the left and on the right of the point Yt.
In real cases of data collection, a more complex situation is observed when time intervals between the diagnostic parameter values have various duration. Hence, is obtained as an average integral value:
where τt−p, τt−p+1, … τt+p—time instants for the corresponding values in a row.
The disadvantage of the moving average method is the “loss” of m − 1 points from the sample N, i.e., the resulting curve becomes shorter by p points at both ends.
5. Practical Diagnosis of Furnace Transformer Technical State
5.1. Detecting Transformer Insulation Issues with the Time Series of Partial Discharge Parameters
Based on results of the continuous monitoring of the furnace transformer ETCNKV -40000/110 during two months in 2015 (dates specified in the figure below), the smoothed time functions of the repetitive charge amplitude (Figure 4a) and partial discharge intensity (Figure 4b) were acquired. Controversial conclusions can be made from analyzing them. Thus, pursuant to Figure 5a, the worst state has the high-voltage phase A input. The average pulse amplitude = 120 mV ( = 3.7 nC) corresponds to the worsened state. The state of phase inputs B and C for this parameter corresponds to discharge activity varying from 0.5 to 2.5 nC. Thus, average amplitude for phase B comes to = 43 mV ( = 1.3 nC), for phase C— = 68 mV ( = 2.1 nC). This shows that the state of phases B and C is considered “normal with significant deviations” [18].
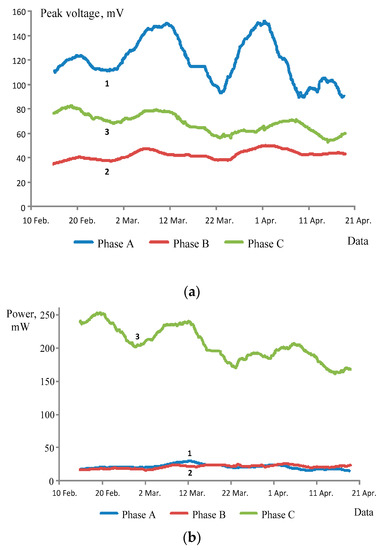
Figure 4.
Smoothed trends of repetitive pulse voltages (a) and partial discharge intensity (PDI) (b) in phases of high-voltage inputs before repair: 1—Phase A; 2—Phase C; 3—Phase C.
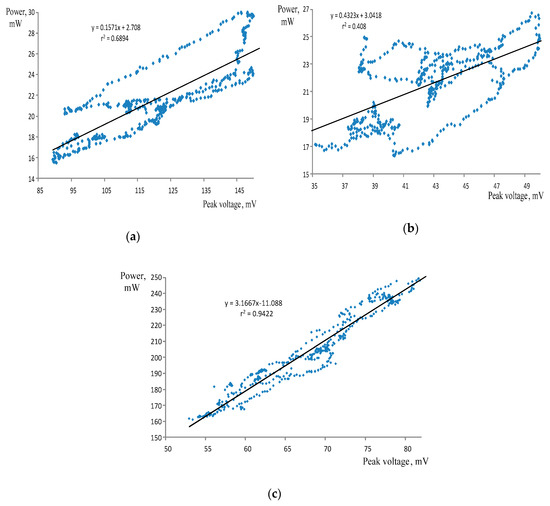
Figure 5.
Dependency of PDI on partial discharge amplitude and parameters of trend lines in phases A (a), B (b) and C (c).
During the similar analysis of functions given in Figure 4b, it was found that the state of phase C input should gain attention. The average total power of partial discharges comes to = 206 mW, which is higher than the specified limit of the pre-fault state (80 mW). With that, the state of inputs in other phases is stable—for instance, = 21.5 mW, which corresponds to the normal level (the dash above a value means this is the mean value over the timeframe specified in the graph).
Therefore, different conclusions regarding the location of deficiency emergence in high-voltage input can be made based on the registered parameters. This does not allow the growing deficiency to be isolated. In order to enhance the credibility of diagnostics, considering both parameters as a complex was suggested. As the term states, the parameter Q02 characterizes the partial discharge amplitude. However, as long as there exist the deficiencies that, while growing, lead to increase of the number of pulses with the same amplitude, PDI will be the parameter most sensitive to the deficiency growth.
When looking for the complex parameter characterizing the object state, it must be considered that both measured values—Q02 and PDI—contain information about partial discharges, being mutually dependent. This is why, in point of issue, it is reasonable to evaluate the power of their relation, which can be measured through determination coefficients r2 or the absolute value of the correlation coefficient r.
Based on experimental data, the dependence of PDI on partial discharge amplitude for phases A, B and C of the studied transformer is given in Figure 5. The way these charts change is indicative of the stochastic relationship between these partial discharge parameters. The empirical dependencies and correlation coefficients PDI (U), specified for charts give further proof for these conclusions. With that, the phase C has the strongest relation with correlation coefficient r = 0.942, while for phases A and B, correlation coefficients are r = 0.689 and r = 0.408, respectively.
The charts above show that in order to isolate the deficiency, the parameter “stochastic relation strength” between Q02 and PDI for the present phase can be used. With that, the technical state of the phase where this relation becomes stronger, must be focused on. The experience shows that the progression of destructive processes in this phase is more intense.
5.2. Comparing Data before and after Repair
Increased PD values and change of other diagnostic parameters pointing to the development of destructive factors led to the shutdown of the ladle-furnace on 22 April 2015, and on 13 May 2015 the transformer was removed from service for repair. After oil discharge the transformer was disassembled with the removal of its power section. The authors conducted the check of nodes and certain parts. What the research team found were loosened pin fixtures, local thermal damage to the paper insulation, damaged terminals, other kinds of local damage. As a result, the object state was identified as “Pre-fault”.
After eliminating the detected defects and the repair, on 8 June 2015 the object was commissioned back into operation in the controlled mode. The results of monitoring PD after the repair in the period from 1 September 2015 to 12 September 2015 are provided in Figure 6. They confirm the transformer state has become better. As compared with the trends in Figure 4, an average value of the PD amplitude in the phase A decreased from = 120 mV to = 80 mV ( = 2.48 nC). Similar indices for the phase B were equal to = 20 mV, for the phase C— = 16 mV.
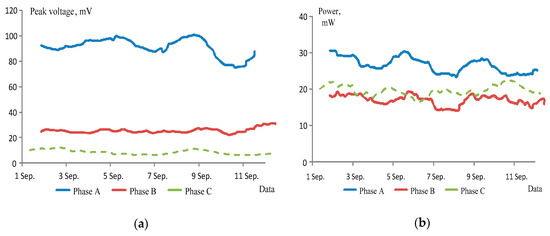
Figure 6.
Trends similar to the dependences shown in Figure 5, after repair.
PD intensity after repair in all phases corresponding to the criterion “Norm”. PD capacity in the phase C decreased more than 10 times from PDI = 206 mW to PDI = 20 mW. For the phase B an average capacity was PDI = 16 mW, while for the phase A—PDI = 26 mW.
To confirm the conclusions drawn, Figure 7 shows the results of PD parameters monitoring for the period 9–22 December 2016. 650 points were selected for each phase. In the primary stage of monitoring, the transformer state was normal due to timely maintenance. In comparison with charts in Figure 4, intensity of partial discharges in phase C fell from 206 mW down to 17 mW, while the amplitude Q02 decreased by 2.5 times. Intensity and amplitude of partial discharges stay in tolerable values in all phases.
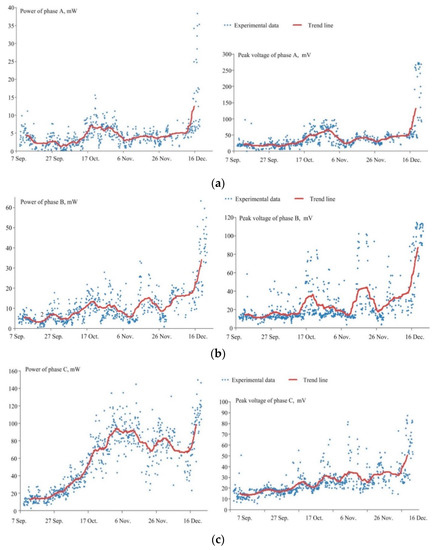
Figure 7.
Input and smoothed trends of power and amplitude of partial discharges from 9 September to 22 December 2016: (a)—Phase A; (b)—Phase B; (c)—Phase C.
It must be noted that in late September–early October, the intensive increase of the partial discharge level in all phases was detected. With that, PDI showed the most abrupt growth in phase C. Thus, this value reached the worsened state of 60 mW on 18 October, and on 28 October it exceeded the limit of the pre-fault state of 80 mW. This meant the progression of destructive processes in the transformer insulation, but the place of emergence could not be isolated.
The case speaks for the technical efficiency of registering partial discharges to control faults. The key issue when isolating the deficiency location is related to the complexity of the transformer structure and the non-homogeneous environment where partial discharge signals are distributed. In order to solve this issue, the activity of partial discharges was measured using the device AR700 on 6 October 2016 [35]. This device detects the location of partial discharges in high-voltage equipment insulation by means of acoustic sensors. As a result of the tests conducted, the zone of the discharge overactivity in the phase B input was found, which allowed us to suspect deficiency progression in that zone.
This conclusion was confirmed during further monitoring of parameters given in Figure 7. After the somewhat slanting change of partial discharge power, the abrupt jump of the intensity was registered starting on 15 December: the power and amplitude of partial discharges increased by 1.5–2 times. In phases A and B, the amplitude U02 was higher than 80 mV, while power almost reached the pre-fault level in phase C—PDI >80 mW.
Due to the situation, the transformer was disabled on 23 December. During the conduct of repairs, the defect was found (see Figure 8): the output end of the high-voltage input phase B coil was close to the sharp corner of the sheet welded to the booster transformer beam (Figure 8a). The potential difference emerged caused destruction of insulation, which was accompanied by the growing intensity of partial discharges. The previously found zone of increased activity of partial discharges belonged to the aforementioned area. The arrows in Figure 8b show the spot of increased discharge activity (position 1) and the burnt wire of high-voltage input (position 2). After repairing the fault, the transformer was put into operation, and after that the partial discharge activity never increased.
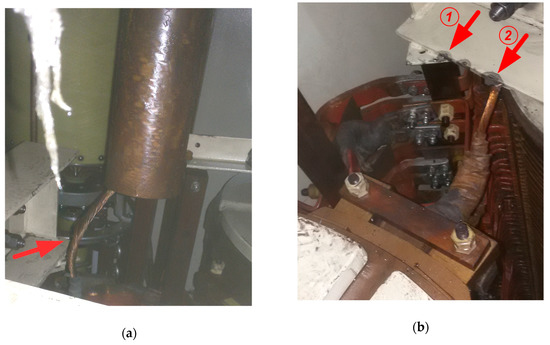
Figure 8.
Defect propagation area (a) and the burnt wire of high-voltage input (b).
6. Result Discussion
6.1. Analysis of Research Results
The conducted research and development (R&D) works were undertaken in relation to electric furnace transformers which are critical elements of oil-filled electrical equipment operated under complex load modes. It suffices to note that short circuit at the electrodes connected to the secondary winding phase is an operational condition. At mains and unit transformers, the short circuit mode belongs to the emergency circuits. The key difference is also the need of continuous voltage control by means of switching outputs (taps) of the primary windings and impact current loads at the initial stages of electric arc metal melt. This is the reason for increased partial discharge intensity in the winding phases, high-voltage inputs and the on-line tap changer (OLTC). In this connection the development of methods for diagnosing the electric furnace transformer state on the basis of PD measurement with the help of the online monitoring system is a relevant problem.
The conducted research is a successful effort of practical diagnostics of the transformer state with the use of the developed method for processing PD parameters obtained in the online mode. To achieve the purpose, the authors use the statistical methods implemented in modern PC software. This makes the research methods accessible for academics and engineering staff in production conditions. Relative simplicity and the possibility of their wide application are the advantages of developed methods.
It is clear that the presented data-processing method can be applied not only for the studied electric furnace transformers. The developed algorithms and programmes are recommended for wide application in the system of diagnosing the state of high-voltage electrotechnical complexes. For this purpose, it is recommended to introduce simplified options of the developed online monitoring system developed for mains and unit transformers [36,37].
6.2. Research Prospects
The practical example of fault localization provided demonstrates a possibility to localize propagating defects in winding phases and inside the transformer tank. The drawback is that the confirmation of the result validity was obtained after the transformer’s withdrawal from service and a partial transformer disassembly. To improve the method efficiency, it is recommended to develop special methods and programmes providing for the matching of discharge activity centers with a design location of transformer nodes (windings, high-voltage inputs, OLTC, etc.). This approach is considered in a number of publications, for example [38,39,40,41,42]. It is based upon the methods of PD acoustic localization in the transformer tank. The papers [43,44,45] denote it as an auscultating method of fault localization by acoustic emission signals (Latin—auscultare—listen).
The next prospective area of research is the development of a comprehensive method of transformer state diagnostics on the basis of the results of online monitoring of partial discharges and their periodic acoustic localization with the help of portable devices. PD periodic localization can be conducted with the installation of acoustic sensors in strictly specified spots on the transformer surface. The advantage of such approach is the possibility of the objective assessment of insulation state due to the research of occurring discharges with a relatively short period of time. The simultaneous processing of PD measured by the online system allows the rate of defect propagation to be defined and the prevention of emergency situations in future. This will facilitate the estimation of fault propagation dynamics and, correspondingly, the defect hazard level. To sum up the results, one should apply the methods of mathematical processing of dynamically changing data. The most acceptable method is cluster analysis [25,26].
As a result of the aforementioned measures the authors plan to implement a comprehensive approach providing for the possibility of timely defect localization and fault development prevention. This problem should be solved on the basis of predictive analysis of the facility technical state.
7. Conclusions
The developed algorithms and diagnostic programmes are introduced in the system of online monitoring of the technical state of electric furnace transformers at a large metallurgical plant. Long-time operation provided examples of practical diagnostics and localization of the propagating defect area confirmed the relevance of the research direction taken and the efficiency of its application. The analysis of the results obtained allows for outlining the prospective areas for further research as well as their applications.
It is clear that the introduction of R&D products is not limited to a pool of electric furnace transformers. The method considered could be recommended for a broader application at industrial and power engineering sites. In general, the solution of a set of listed problems will facilitate the solution of the relevant applied research problem making up a methodological basis for developing principally new systems of diagnostic high-voltage equipment monitoring.
Author Contributions
Methodology, O.I.K.; software, I.A.Y.; validation A.A.F.; formal analysis, E.A.G.; visualization, I.M.Y.
Conflicts of Interest
The authors declare no conflict of interest.
References
- Khramshin, V.R.; Nikolayev, A.A.; Evdokimov, S.A.; Kondrashova, Y.N.; Larina, T.P. Validation of Diagnostic Monitoring Technical State of Iron and Steel Works Transformers. In Proceedings of the 2016 IEEE NW Russia Young Researchers in Electrical and Electronic Engineering Conference, St. Petersburg, Russia, 2–3 February 2016; pp. 596–600. [Google Scholar] [CrossRef]
- Karandaev, A.S.; Evdokimov, S.A.; Khramshin, V.R.; Lednov, R.A. Diagnostic Functions of a System for Continuous Monitoring of the Technical Condition of the Transformers of Arc Steelmaking Furnaces. Metallurgist 2014, 58, 655–663. [Google Scholar] [CrossRef]
- Transformer Monitoring and Diagnostic Systems—GE Energy. Available online: http://www.geindustrial.com/publibrary/checkout/GEA-18000?TNR=Service%20and%20Maintenance|GEA-18000|generic (accessed on 9 September 2019).
- Kuzmin, O.A. ABB Expertize in Development and Application of Smart Transformers. Key Principles and Examples of New Solutions Application. Science to Practice Conference IV “Control of Technical State of Equipment of Power Engineering Objects” 2017. Available online: http://www.ti-ees.ru/fileadmin/f/Conference/2017/report/15._Kuzmin_O.A.pdf (accessed on 9 September 2019).
- Jonsson, L. Advanced Transformer Control and Monitoring with TEC. Available online: https://library.e.abb.com/public/5b56967bbeb58b84c1257b130057df40/TEC%20ABB%20Review.pdf (accessed on 9 September 2019).
- Zhivodernikov, S.V. Foreign Expertise in Monitoring Oil-Filled Equipment State. Available online: https://megaom.ucoz.ru/nornativ/vv_oborudovanie/statja_zarubezhnyj_opyt_monitoringa_oborudovanija.pdf (accessed on 9 September 2019).
- Legacy Transformer Monitoring and Diagnostic System (TMDS 2000 L). Available online: https://new.siemens.com/us/en/products/energy/product-support/t-d-guardian-articles/legacy-transformer-monitoring-diagnostic-system.html (accessed on 9 September 2019).
- Gill, P. Electrical Power Equipment Maintenance and Testing; CRC Press: Boca Raton, FL, USA, 2014. [Google Scholar]
- MS 3000 The Expert Solution. Available online: http://www.gegridsolutions.com/products/brochures/AlstomEnergy/PTR/Grid-PTR-L3-MS3000-0203-2015_10-EN.pdf (accessed on 9 September 2019).
- Dolata, B.; Wagner, L. On-line condition monitoring and expert system for power transformers—Integration into protection and control system by using of IEC 61850. In Proceedings of the 21st International Conference on Electricity Distribution, Frankfurt, Germany, 6–9 June 2011; pp. 1–4. [Google Scholar]
- Akbari, A.; Setayeshmehr, A.; Borsi, H. Software Modules for Monitoring and Diagnosis of Power Transformers. In Proceedings of the 19th International Power System Conference (PSC 2004), Tehran, Iran, 22–24 November 2004; Available online: https://docplayer.net/24603244-49-e-trn-752-software-modules-for-monitoring-and-diagnosis-of-power-transformers-callinstr-25-a-d-hannover-germany.html (accessed on 9 September 2019).
- Rodrigo, A.; Castro, L.C.; Muñoz, F.A. Effect of acquisition parameters on equivalent time and equivalent bandwidth algorithms for partial discharge clustering. Electr. Power Energy Syst. 2017, 8, 141–149. [Google Scholar] [CrossRef]
- Sikorski, W.; Walczak, K.; Przybylek, P. Moisture Migration in an Oil-Paper Insulation System in Relation to Online Partial Discharge Monitoring of Power Transformers. Energies 2016, 9, 1082. [Google Scholar] [CrossRef]
- Karandaev, A.S.; Khramshin, V.R.; Evdokimov, S.A.; Larina, T.P.; Yachikov, I.M. Practical Diagnostics of Power Transformers with Acoustic Radar Method of Partial Discharge Determination. In Proceedings of the 2016 IEEE NW Russia Young Researchers in Electrical and Electronic Engineering Conference, St. Petersburg, Russia, 2–3 February 2016; pp. 576–580. [Google Scholar] [CrossRef]
- Kunicki, M.; Cichon, A. Statistics based method for partial discharge identification in oil paperinsulation systems. Electr. Power Energy Syst. 2018, 163, 559–571. [Google Scholar] [CrossRef]
- Warren, V.; Stone, G.; Sedding, H. Partial Discharge Testing: A Progress Report. Available online: https://irispower.com/wp-content/uploads/2017/06/14-Sedding-Comparison-Test-IRMC-2017.pdf (accessed on 9 September 2019).
- Radionov, A.A.; Karandaev, A.S.; Yachikov, I.M.; Karandaeva, O.I.; Gasyarov, V.R. Power Transformer Condition Forecast with Time-series Extrapolation. In Proceedings of the 9th International Conference on Computer and Automation Engineering, Sydney, Australia, 18–21 February 2017; pp. 326–330. [Google Scholar] [CrossRef]
- Fofana, I. Power Transformer Diagnostics, Monitoring and Design Features; MDPI: Basel, Switzerland, 2018; Available online: https://www.mdpi.com/journal/energies (accessed on 9 September 2019).
- Evdokimov, S.A.; Kondrashova, Y.N.; Karandaeva, O.I.; Gallyamova, M.S. Stationary System for Monitoring Technical State of Power Transformer. Procedia Eng. 2016, 150, 18–25. [Google Scholar] [CrossRef][Green Version]
- System of Transformer Oil Monitoring KELMAN Minitrans. Available online: http://granat-e.ru/kelman_minitrans.html (accessed on 9 September 2019).
- Karandaev, A.S.; Evdokimov, S.A.; Khramshin, V.R.; Sarlybaev, A.A. System for Real-Time Monitoring of the Technical State of a Transformer on an Ultrahigh-Power Electric-Arc Steelmaking Furnace. Metallurgist 2014, 58, 872–879. [Google Scholar] [CrossRef]
- Karandaev, A.S.; Evdokimov, S.A.; Khramshin, V.R.; Karandaeva, O.I. Information and Measuring System for Electric Arc Furnace Transformer Monitoring. In Proceedings of the 2014 12th International Conference on Actual Problems of Electronic Instrument Engineering, Novosibirsk, Russia, 2–4 October 2014; Volume 1, pp. 273–279. [Google Scholar] [CrossRef]
- Sarlybaev, A.A. Description of systems for continuous condition control of furnace transformers. Russ. Internet J. Electr. Eng. 2016, 3, 24–35. [Google Scholar]
- Sensors for Portable and Stationary High Voltage Equipment Monitoring Systems. Available online: https://dimrus.ru/manuals/sensors.pdf (accessed on 9 September 2019).
- Karandaev, A.S.; Yachikov, I.M.; Khramshin, V.R. Methods of Multi-Parameter Diagnostics of Electric Equipment Condition within On-line Monitoring Systems. Procedia Eng. 2016, 150, 32–38. [Google Scholar] [CrossRef][Green Version]
- Radionov, A.A.; Evdokimov, S.A.; Sarlybaev, A.A.; Karandaeva, O.I. Application of subtractive clustering for power transformer fault diagnostics. Procedia Eng. 2015, 129, 22–28. [Google Scholar] [CrossRef]
- Dhaval, S.; Jay, A. Simulation and Mathematical Analysis of Partial Discharge Measurement in Transformer. Int. J. Eng. Res. Technol. 2018, 7, 125–132. [Google Scholar]
- Radionov, A.A.; Karandaeva, O.I.; Evdokimov, S.A.; Gallyamova, M.S.; Kondrashova, Y.N. Monitoring Partial Discharges in Stationary Condition Monitoring System of Furnace Transformer. In Proceedings of the IEEE NW Russia Young Researchers in Electrical and Electronic Engineering Conference, St. Petersburg, Russia, 1–3 February 2017; pp. 1571–1575. [Google Scholar] [CrossRef]
- Rusov, V.A. Measurement of Partial Discharges in Insulation of High-Voltage Equipment; Dimrus: Yekaterinburg, Russia, 2011. [Google Scholar]
- Methodical Directions for to Diagnostic of Mains Transformers, the Autotransformers, Bypassing Chokes and Their Feedings into МУ 0634-2006. Concern «ROSENERGOATOM». Available online: http://leg.co.ua/knigi/oborudovanie/diagnostika>-transformatorov-i-shuntiruyuschih-reaktorov.htm (accessed on 9 September 2019).
- Guidelines RD EO 0069–97. NPP Maintenance and Repair Guidelines. Concern «ROSENERGOATOM». Available online: https://files.stroyinf.ru/Data2/1/4293777/4293777767.pdf (accessed on 9 September 2019).
- Brockwell, P.J. Introduction to Time Series and Forecasting, 2nd ed.; Springer: Berlin/Heidelberg, Germany, 2002. [Google Scholar]
- Grubbs, E. Sample Criteria for Testing Outlying Observations. Ann. Math. Statist. 1950, 21, 27–58. Available online: https://projecteuclid.org/download/pdf_1/euclid.aoms/1177729885 (accessed on 9 September 2019). [CrossRef]
- Lothar, S. Applied Statistics: A Handbook of Techniques (Springer Series in Statistics), 2nd ed.; Springer: Berlin/Heidelberg, Germany, 1984. [Google Scholar]
- Malkin, V.S. Technical Diagnostics: Study Guide; Lan: St. Petersburg, Russia, 2013. [Google Scholar]
- AR700—Tool for Localization of Defects High-Voltage Equipment Insulation by Means of Acoustic Sensors. Available online: https://dimrus.ru/manuals/ar700.pdf (accessed on 9 September 2019).
- Khramshin, V.R.; Evdokimov, S.A.; Nikolaev, A.A.; Karandaev, A.S. Monitoring Technical State of the Power Transformers Is a Necessary Condition of the Smart-Grid Technology Introduction within the Industrial Electric Networks. In Proceedings of the IEEE NW Russia Young Researchers in Electrical and Electronic Engineering Conference, St. Petersburg, Russia, 2–4 February 2015; pp. 214–220. [Google Scholar] [CrossRef]
- Nikolayev, A.A. Introducing System of Monitoring Technical State of Transformer 80 MVA of Power Block of Thermal Plant of “MMK”, JSC. Electrotech. Syst. Complexes 2016, 52–57. [Google Scholar] [CrossRef]
- Hoek, S.; Ranninger, U. Acoustic localization of partial discharge in power transformers. Practical experiences with and without the help of UHF measurement technology. Transform. Mag. 2015, 4, 88–95. Available online: https://www.transformers-magazine.com/tm-issues-pdf-download/10-transformers-magazine-digital-edition-vol-2-issue-4/file.html (accessed on 9 September 2019).
- Giscard, F.; Cintra, V. A Strategy to Locate Partial Discharges in Power Transformers using Acoustic Emission. RE&PQJ 2007, 1, 596–600. [Google Scholar] [CrossRef]
- Markalous, S.M.; Feser, K. All-acoustic pd measurements of oil/paper-insulated Transformers for pd-localization. Sci. Works Inst. Electr. Eng. Electrotechnol. Wrocław Univ. Technol. 2004, 40, 106–112. [Google Scholar]
- Dhole, P.; Sinha, T.; Nayak, S. Analysis of Propagation Paths of Partial Discharge Acoustic Emission Signals. In Proceedings of the Fifteenth National Power Systems Conference, Bombay, India, 16–18 December 2008; pp. 345–350. [Google Scholar]
- Sikorski, W.; Ziomek, W.; Siodla, K.; Moranda, H. Location of Partial Discharge Sources in Power Transformers Based on Advanced Auscultatory Technique. IEEE Trans. Dielectr. Electr. Insul. 2012, 19, 1948–1956. [Google Scholar] [CrossRef]
- Sikorski, W.; Ziomek, W.; Kuffel, E. Location and Recognition of Partial Discharge Sources in a Power Transformer Using Advanced Acoustic Emission Method. Electr. Rev. 2008, 10, 20–23. [Google Scholar]
- Agamalov, O.N. Cluster analysis of partial discharges for estimation of condition of electric machine insulations. Electricity 2006, 6, 56–62. [Google Scholar]
© 2019 by the authors. Licensee MDPI, Basel, Switzerland. This article is an open access article distributed under the terms and conditions of the Creative Commons Attribution (CC BY) license (http://creativecommons.org/licenses/by/4.0/).