Article

Integrated Fault Detection Framework for Classifying Rotating Machine Faults Using Frequency Domain Data Fusion and Artificial Neural Networks

by
Kenisuomo C. Luwei
1,
Akilu Yunusa-Kaltungo
1,* and
Yusuf A. Sha’aban
2
1
Dynamics Laboratory, School of Mechanical, Aerospace and Civil Engineering, The University of Manchester, Manchester M13 9PL, UK
2
School of Engineering, Manchester Metropolitan University, Manchester M15 6BH, UK
*
Author to whom correspondence should be addressed.
Machines 2018, 6(4), 59; https://doi.org/10.3390/machines6040059
Submission received: 23 October 2018 / Revised: 14 November 2018 / Accepted: 15 November 2018 / Published: 20 November 2018

Abstract

:
The availability of complex rotating machines is vital for the prevention of catastrophic failures in a significant number of industrial operations. Reliability engineering theories stipulate that optimising the mean-time-to-repair (MTTR) for failed machines can immensely boost availability. In practice, however, a significant amount of time is taken to accurately detect and classify rotor-related anomalies which often negate the drive to achieve a truly robust maintenance decision-making system. Earlier studies have attempted to address these limitations by classifying the poly coherent composite spectra (pCCS) features generated at different machine speeds using principal components analysis (PCA). As valuable as the observations obtained were, the PCA-based classifications applied are linear which may or may not limit their applicability to some real-life machine vibration data that are often associated with certain degrees of non-linearities due to faults. Additionally, the PCA-based faults classification approach used in earlier studies sometimes lack the capability to self-learn which implies that routine machine health classifications would be done manually. The initial parts of the current paper were presented in the form of a thorough search of the literature related to the general concept of data fusion approaches in condition monitoring (CM) of rotation machines. Based on the potentials of pCCS features, the later parts of the article are concerned with the application of the same features for the exploration of a simplified two-staged artificial neural network (ANN) classification approach that could pave the way for the automatic classification of rotating machines faults. This preliminary examination of the classification accuracies of the networks at both stages of the algorithm offered encouraging results, as well as indicates a promising potential for this enhanced approach during field-based condition monitoring of critical rotating machines.

1. Introduction

Reliability and maintenance professionals in modern day industries are often faced with an incredible task of ensuring almost failure-free operations of highly critical plant assets that are often characterised with several failure modes as a result of their complexities. For so many decades, different maintenance strategies have been applied for managing such critical industrial assets, ranging from breakdown maintenance (BM), whereby interventions are made after a failure has occurred, to planned preventive maintenance (PPM) that assumes a fixed maintenance program based on predefined time intervals [1,2,3,4,5]. However, as the level of competitiveness increases, the compromises of BM and PPM maintenance philosophies have become intolerable which triggered the migration towards condition based maintenance (CBM) [6,7,8] strategies that can adequately cope with random failure patterns. Unlike BM and PPM that are based on failure occurrence and predefined operating time respectively, CBM maintenance strategy only initiates maintenance interventions (i.e., repair or replace) based on indications that the operating conditions of the monitored assets have deviated from their normal levels.
According to the reviews conducted by several researchers [9,10,11,12] on the CBM techniques commonly applied for classifying faults associated with rotor-bearing systems in a wide range of industries, vibration-based condition monitoring (VCM) methods are quite mature owing to their ability to allocate distinct fault diagnostic signatures to individual rotating machine fault. Amplitude spectrum analysis is one of the most commonly applied rotating machine VCM methods in practise due to its relative computational simplicity. However, the loss of phase information associated with the computation of the power spectrum density (PSD) often leads to its combination with other conventional VCM approaches including rotor orbits analysis [13], full spectrum analysis [14,15,16,17], etc. This integration of multiple VCM approaches sometimes complicates the entire fault finding process. Efforts aimed at overcoming these deficiencies have led to the application of higher order spectra (HOS) [18,19,20,21,22], where both amplitude and phase information are retained. Other researchers have also attempted to standardise rotating machines fault diagnosis by incorporating artificial intelligence (AI) techniques such as artificial neural networks (ANN) [23,24,25] and support vector machines (SVM) [26,27,28].
While the research and practical contributions of the currently applied VCM approaches for rotating machine faults classification are quite commendable, most industry dominant approaches still entail the conduction of separate analysis at individual machine operating conditions (e.g., speeds and foundation flexibilities). This, therefore, makes the entire fault identification process laborious due to the quantity of data to be analysed at each instance. Another obvious but often ignored consequence of this is increased repair times and costs which may undermine the overall cost-effectiveness of the entire maintenance process. Hence, through the application of a multiple level vibration-based data fusion approach, there exist ample opportunities for simplifying the detection and classification of different machine faults irrespective of their operating conditions. The current study is an extension of an earlier study [29] on multi-sensors and multi-operating conditions data fusion based rotating machine faults classification, using poly coherent composite higher order spectra components, mainly poly coherent bispectrum (pCCB) and trispectrum (pCCT). While both studies are based on multi-stage data fusion, the current study explores the self-learning abilities of ANNs so as to enhance the prospects of developing a truly automatic VCM faults classification approach that was impossible with the linear principal components analysis (PCA)-based approach adopted in the earlier study. An ANN was chosen for the classification stage of this study owing to its suitability for complex systems that are often characterised by instability and non-linearity [30,31].

2. Overview of Data Fusion for Faults Detection and Classification

In practice, routine condition monitoring (CM) activities often entail the periodic measurement of various operational parameters including vibration, temperature, airflow, speed, pressure, energy consumption, sound, wear debris, etc., at predefined intervals, commonly referred to as the CM task interval. The measured CM parameters are then separately analysed and trended overtime, so as to detect the emergence of incipient machine faults. While previous advanced signal processing approaches have successfully propagated the knowledge and ability of reliability experts to different the conditions of industrial machines, they often rely on human experience which can be subjective in some cases [32,33]. With the concept of data fusion however, similar activities that incorporate far more operational parameters can be performed automatically and consistently irrespective of the experience levels of industrial machines’ owners. For instance, Yang et al. [34] established the relationship between temperature profiles and fatigue damage of a reactor pressure vessel by proposing a model for quantifying the stress-strain and fatigue failure from the observed temperatures, which can prove very useful for the CM of rotating machines operating under extreme temperatures, such as the cement plant rotary kilns or steam turbines. Similarly, Avdelidis and Almond [35] conducted a study on the application of temperature profiles (thermal imaging) for determining and monitoring the integrity of aircraft structure anchor points using conventional aluminium alloys and carbon fibre reinforced plastic skins.
Another useful parameter for rotating machine CM is the wear particle distribution obtained from lubricating oils. Lubricating oils perform various vital functions in rotating machines including the prevention of metal-to-metal contact between critical machine components, cooling agents for hot surfaces, transport systems for additives that enhance resistance of metal surfaces to wear, as well as the movement of wear particles and contaminants away from the contact surfaces of vital machine components. Through a careful analysis of the types, sizes, shapes, and composition of wear particles, insights about the health of rotating machines can be obtained [36]. Based on this premise, the study conducted by Peng and Kirk [37] showed that boundary features such as particle size distribution and shape were adequate for identifying cutting, spherical, and rubbing wear particles, but contained insufficient information for detecting laminar, fatigue chunk and extreme sliding wear particles.
Other researchers [38,39,40,41] have explored the use of power characteristics for monitoring changes in the operating conditions of critical rotating machines. For instance, Hameed et al. [38] provided a comprehensive review of CM techniques for wind turbines, where it was shown that accurate information on the overall condition of the rotor (a very important component of the wind energy converter) can be obtained by trending the relation between wind speed and active power output of the wind energy converter (WEC). The study [38] also showed that the use of higher order signal processing tools (bispectrum and bicoherence) [18,19,20,21,22] for detecting the presence or absence of phase coupling between the frequency components of the electrical power signal when classifying the WEC as faulty or healthy is very possible.
Despite the significant advances achieved through the separate applications of the CM parameters, accurate analysis of all parameters would require the services of a well-experienced and highly versatile CM analyst. Also, the complexity of separately processing and analysing individual CM parameters is enormous. However, with the current emphasis on sensor reduction and management of big data [42], providing a holistic view of an entire rotating machine through combinations of several sets of a particular CM parameter (e.g., vibration measurements from several bearings) or combinations of different CM parameters (e.g., vibration and temperature measurements from several bearings) will significantly simplify CBM. Such approaches are often referred to as data fusion, data integration or data combination.
Though rapidly gaining attention in CBM, the general concept of data/parameter fusion cannot be described as completely new since it dates back to the existence of human senses (i.e., taste, touch, sight, hearing, and smell) [43]. Humans have always combined several senses in order to enhance their survival rates [44]. For example, it would require a combination of vision, touch, taste, and possibly smell to adequately judge the quality of an edible fruit. Additionally, the combination of sights and sounds helps an animal detect the exact location of its prey or predator. Similarly, data fusion in applied sciences is built around the premise that enhanced and simplified descriptions of the monitored system can be achieved through a combination of different sensors and/or parameters [45]. Historically, data fusion techniques were mainly developed for military activities such as automated target recognition, battlefield surveillance and remote sensing [43]. However, ongoing cross-functional knowledge transfer through research has significantly promoted the application of the concept in other fields including CBM of rotating machines. Data fusion in CBM of rotating machines can be performed at sensor level (also referred to as multi-sensor data fusion) or at parameter level (also referred to as feature or parameter fusion).
At sensor level, data fusion is concerned with the combination of measured data from several CM sensors mounted on a plant asset, so as to obtain precise and comprehensive fault detection features that could eventually simplify and/or enhance the overall CBM process [46,47,48,49,50]. In the context of rotating machine (e.g., wind or steam turbine) CBM, multi-sensor data fusion can be approached by either fusing data acquired by similar sensors measuring same CM parameters (e.g., the fusion of vibration signals measured by four similar accelerometers installed on the bearings of a rotating machine) or data acquired by different sensors measuring different CM parameters. Irrespective of whether data acquired by similar or different CM sensors are fused, the process will usually lead to the generation of a unique health monitoring indicator (HMI) that can be trended over time and eventually used to define the appropriate planned maintenance interval for the monitored rotating machine. It is very common to perform sensor level data fusion prior to the extraction of the parameters or features that will be used for actual fault diagnosis. On the contrary, feature or parameter level data fusion requires that the fault diagnosis features or parameters (e.g., crest factor, RMS, 1x amplitude, pCCB, pCCT, kurtosis, etc.) embedded in the signals measured by individual CM sensors are separately extracted prior to fusion. Such a process becomes very useful during the faults classification of rotating machines that operate at different speeds (e.g., power generation turbines). Presently, most of the applications of data fusion for rotating machine faults diagnosis in the literature focus on the independent application at sensor or parameter levels which could again increase the complexity of the process when dealing with multiple speeds machines. Hence the development of an integrated approach that combines both multiple sensor and multiple parameters could be very valuable.

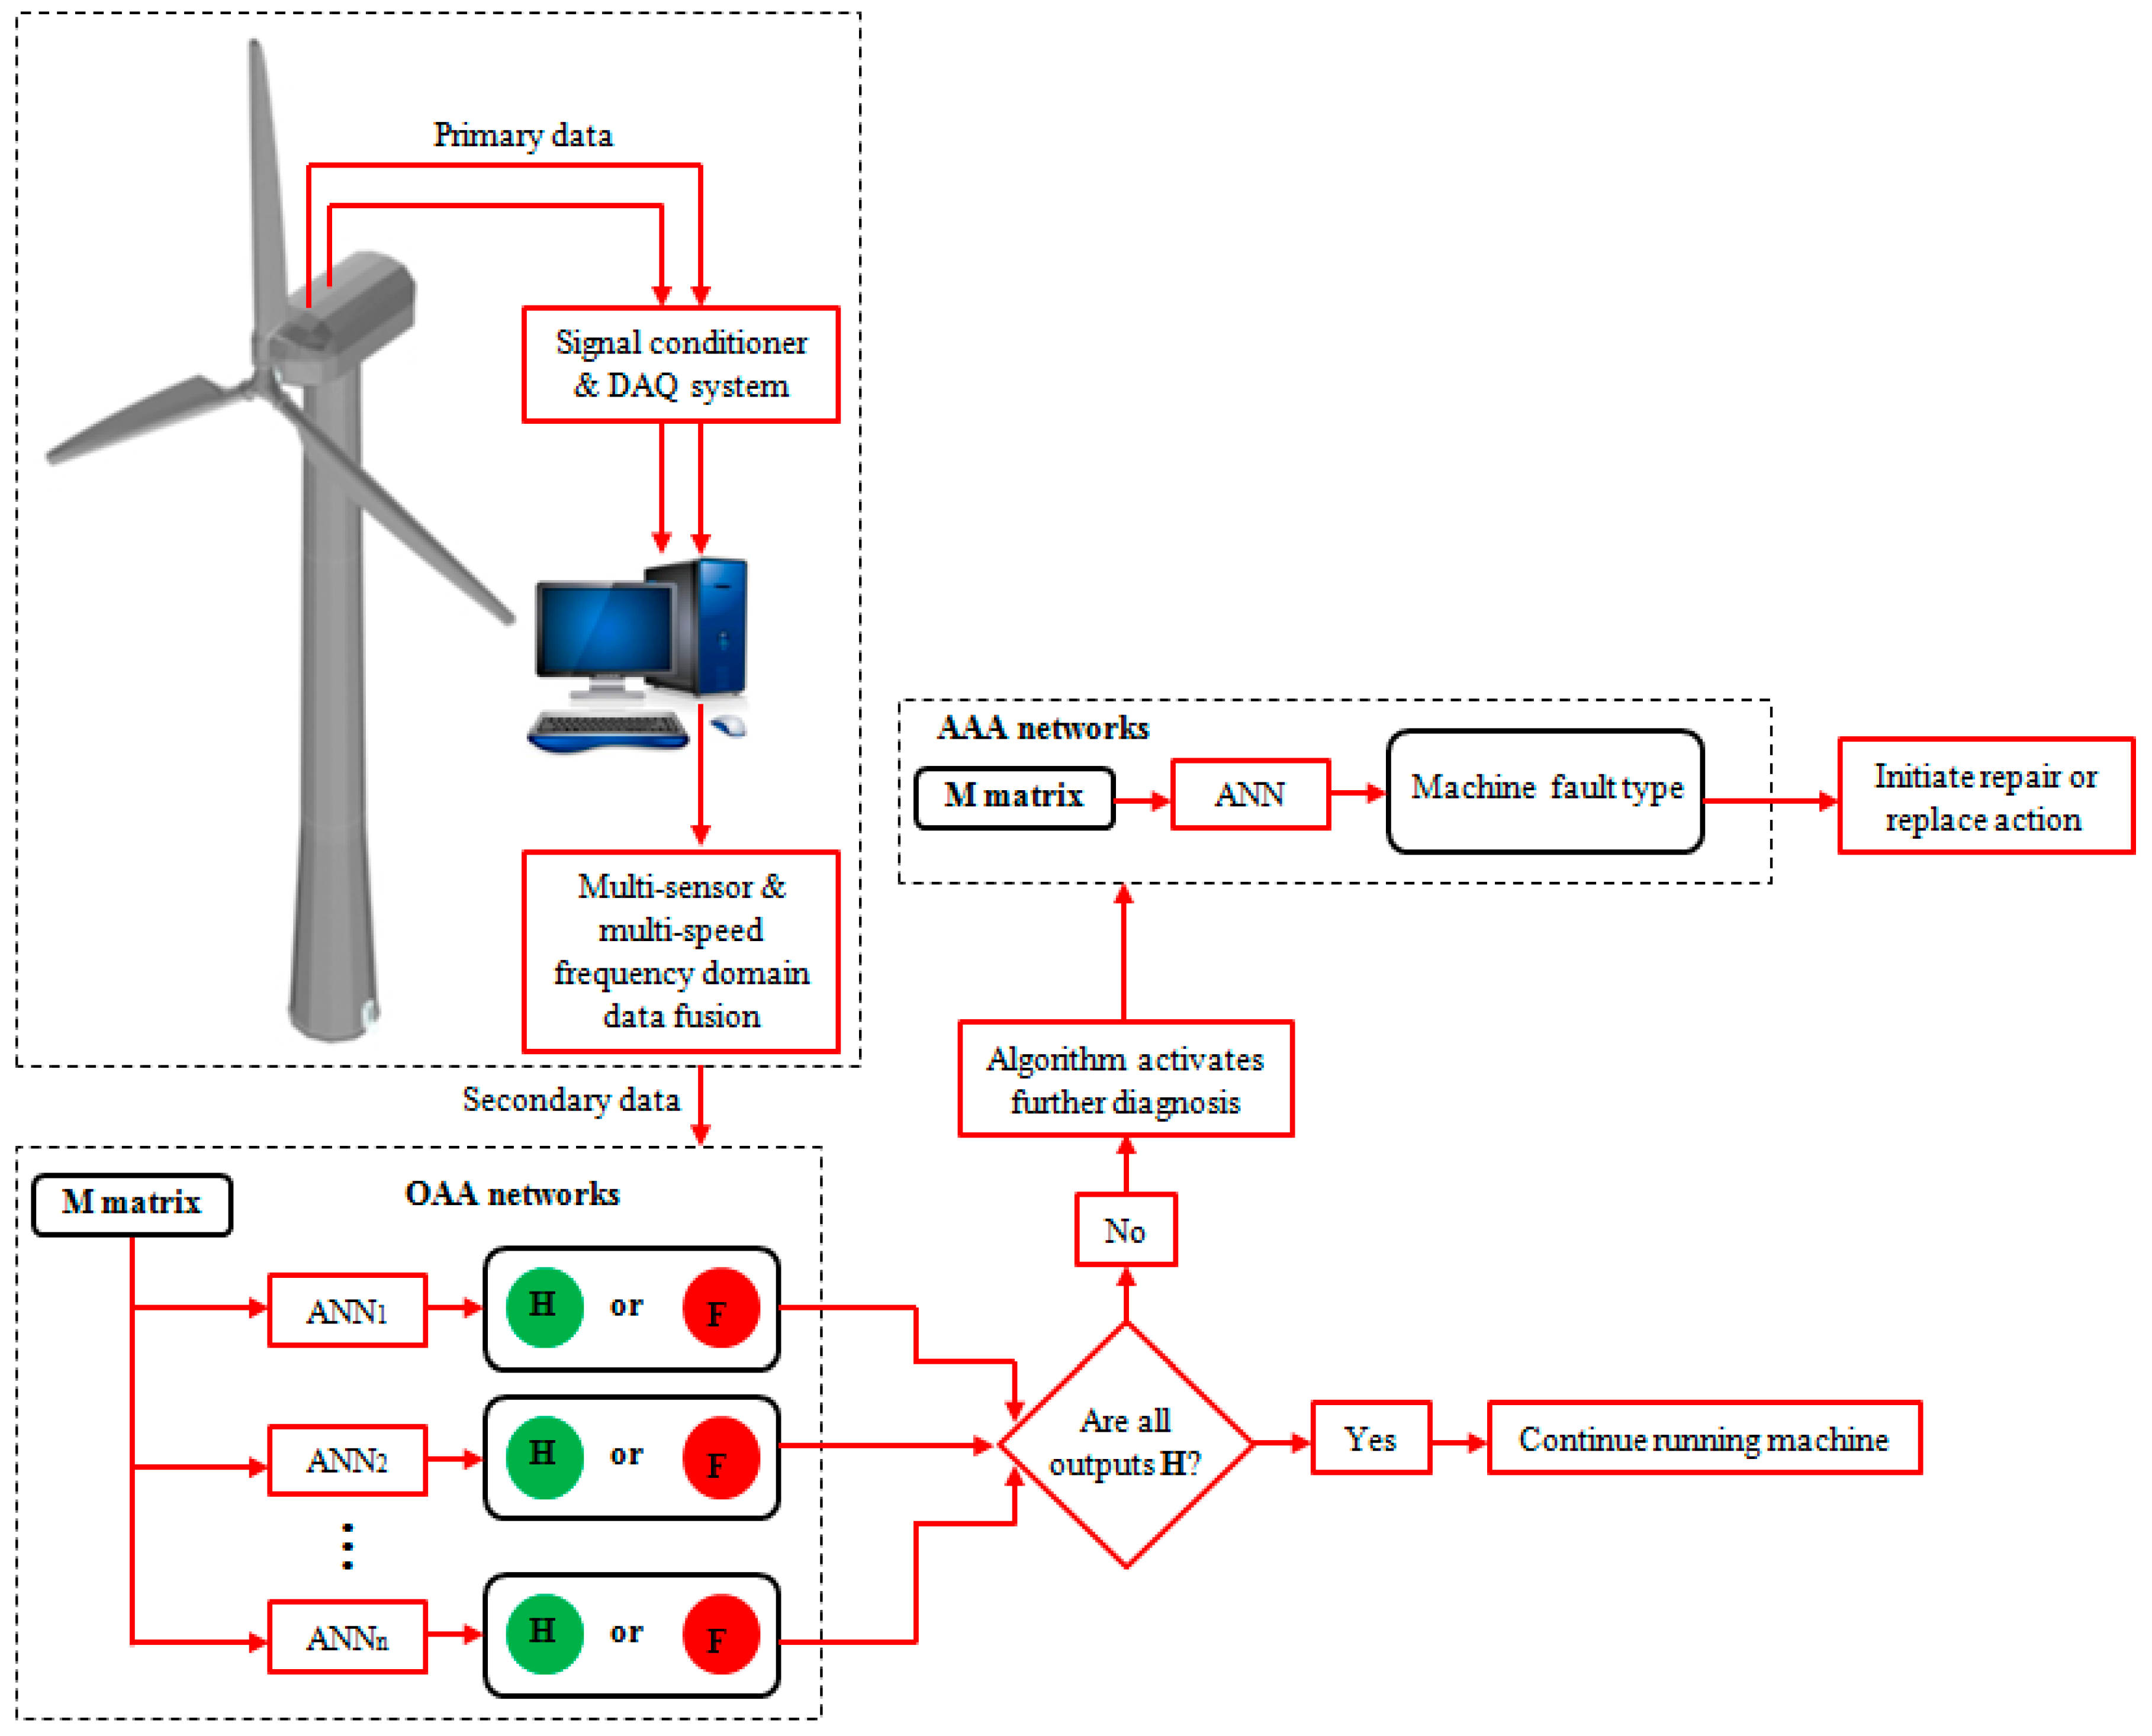
3. Integrated Data Combination Approach

The integrated data combination method for automatic fault classification of rotating machines involves the combination of both sensor and parameter levels of data fusion. Figure 1 provides a schematic illustration of the proposed integrated approach while details of the mathematical computations performed at both stages are respectively provided in Section 3.1 and Section 3.2.

3.1. Stage 1: Sensor Level Data Fusion Using PCCB and pCCT

Stage 1 of the process is concerned with the fusion of measured vibration data (i.e., primary data) from multiple VCM sensors (say “q” number of sensors) installed on the monitored rotating machine, so as to develop single pCCB and pCCT fault diagnostic features (i.e., secondary data) that adequately represent the dynamic behaviour of the entire machine. Equations (1)–(4) provide further elaborations on the mathematical computations which have been extensively discussed in an earlier study by Yunusa-Kaltungo et al. [29,51,52]:
S pCCS ( f k ) = ( r = 1 n s X 1 r ( f k ) γ 12 2 X 2 r ( f k ) γ 23 2 X 3 r ( f k ) γ 34 2 X 4 r ( f k ) .   X ( b 1 ) r ( f k ) γ ( b 1 ) b 2   X b r ( f k ) n s ) ( 1 q )
B ( f l , f m ) = r = 1 n s ( X pCCS r ( f l ) X pCCS r ( f m ) X pCCS r * ( f l + f m ) ) n s
T ( f l , f m , f n ) = r = 1 n s ( X pCCS r ( f l ) X pCCS r ( f m ) X pCCS r ( f n ) X pCCS r * ( f l + f m + f n ) ) n s
X 1 r ( f k ) , X 2 r ( f k ) , X 3 r ( f k ) , X 4 r ( f k ) , …., X ( q 1 ) r ( f k ) , and X q r ( f k ) in Equation (1) respectively represent the Fourier transformation (FT) of the rth segment at frequency f k of the vibration responses at bearings 1, 2, 3, 4, …., (q − 1) and q. Additionally, γ 12 2 , γ 23 2 , γ 34 2 , …., γ ( q 1 ) q 2 respectively represent the coherence [53] between bearings 1–2, 2–3, 3–4, …, (q − 1)–q. S pCCS ( f k ) represents the poly-Coherent Composite Spectrum (pCCS) at frequency, f k . Equations (2) and (3) respectively show the computations of pCCB and pCCT fault diagnosis features, while X pCCS r is the poly coherent composite FT for a certain segment ‘r’ of the measured vibration data from ‘q’ bearing locations at a certain frequency, f k , which was computed as [29,52]:
X pCCS r ( f k ) = ( X 1 r ( f k ) γ 12 2 X 2 r ( f k ) γ 23 2 X 3 r ( f k ) γ 34 2 X 4 r ( f k )   X ( q 1 ) r ( f k ) γ ( q 1 ) q 2 X q r ( f k ) ) ( 1 q )

3.2. Stage 2: Feature Level Data Fusion Using ANN

As earlier mentioned, most rotating machines operate at various speeds. In stage 2, efforts are made to significantly reduce the fault diagnosis element of VCM by eliminating the common practice of performing separate analysis at individual machine speeds. Hence, the secondary pCCB and pCCT data generated in stage 1 (using Equations (1)–(4)) at different machine speeds are then fused together (i.e., feature/parameter level fusion) using ANN, so as to develop an automatic but simplified multiple speeds and multiple sensors faults diagnosis approach. Initial research attempts by Yunusa-Kaltungo et al. [29] have been directed towards the generation of pCCB and pCCT features that were then classified using the well-known principal components analysis (PCA) technique. While the observations recorded from the earlier work were quite encouraging, it was envisaged that the linear nature of PCA [9] could limit its robustness especially when dealing with complex rotating machine faults that sometimes possess nonlinearities.
Inspired from the biological nervous system, ANN has been widely used in pattern recognition, classification and other machine learning problems [9]. Unlike linear classification techniques such as PCA which have been immensely used to simplify the detection and classification of rotating machines conditions in previous studies [29], ANN is capable of handling nonlinear and complex systems efficiently which is mainly due to the adoption of the human brain structure for its pattern [9,54]. Additionally, ANN approaches have high tolerance for noisy data and have the capabilities to successfully classify patterns from data not necessarily used in their training. Other advantages of ANN include its ability for adaptive learning, self-organisation and real time operation [9]. These features have motivated the use of ANN in diverse fields including; medicine [55,56,57], information technology [58,59] and meteorology [60,61,62,63]. Though limited, some researchers have also explored the application of ANN-based approaches for the detection and classification of rotating machine faults especially bearings [64,65] and gearboxes [66,67,68]. However, current body of literature indicates that very few studies [69,70] have been done to address the detection and classification of other perennial causes of industrial rotating machine faults such as shaft misalignment, shaft cracks, shaft rubs, bent shaft, unbalance, machine looseness, etc.
A typical ANN structure comprises of three main layers namely; the input layer, one or more hidden layers and the output layer. Each of the layers is characterised by one or more nodes referred to as neurons. The numbers of input and output variables determine the number of neurons in the input and output layer respectively. The number of hidden layers in a typical ANN structure and the number of neurons associated with each hidden layer depends on the complexity of the problem. The matrix of outputs o is given by Equation (5):
o = f 2 ( W 2 f 1 ( W 1 x + b 1 ) + b 2 )
W i n i × k i is the i th layer weight matrix, k i and n i are the number of inputs to layer i and neurons in layer i respectively, b i n i is the bias vector associated with layer i , and g i is the transfer function associated with layer i which corresponds to the activation function for the output layer. The ANN used in the current study is based on multi-layer perceptron (MLP) using back propagation algorithm which adjusts the parameters to minimise a cost function.
Pattern classification with ANN can be performed using various approaches, including one-against-one (OAO), one-against-all (OAA) and all-against-all (AAA). In the OAA approach, each pattern associated with a class i is trained against all other classes j where i j . For instance, a three-class pattern classification would involve training patterns associated with class 1 against those from class 2 and 3. Similarly, patterns associated with class 2 are trained against those from class 1 and 3. Finally, patterns associated with class 3 are trained against those from class 1 and 2. The number of neural networks required for OAA equals ( n 1 ) where n represents the total number of classes. In OAO approach, patterns associated with class i are trained against patterns belonging to class j for all i j . Using the same 3-class example, a total of three networks will be trained. In the first network, patterns in class 1 will be trained against patterns in class 2. The second network will involve the training of patterns in class 1 against patterns in class 3 while the third network involves patterns in class 2 against 3. The number of neural networks required for OAO is ( n ( n 1 ) 2 ) where n also represents the total number of classes. AAA involves training a single neural network to classify all pattern classes.

4. Experimental Arrangement

In order to practically demonstrate the applicability of the proposed integrated data combination approach, measured vibration data were acquired from a laboratory-scale rig. The rig consists of two shafts with similar diameters of 20 mm but vary in length (i.e., 1000 mm and 500 mm in length respectively). The longer shaft is connected to the shorter by a rigid coupling at one end and to a 0.75 kW electric motor at the other end through the aid of a flexible coupling. Three similarly dimensioned balance discs were mounted across the length of the two rigidly-coupled shafts (see Figure 2). The first and second balance discs were fitted on the 1000 mm shaft at distances of 300 mm from the flexible coupling and 190 mm from bearing 2 respectively. The third disc on the other hand was mounted on the 500 mm, mid-way between bearings 3 and 4. The entire rotor-disc assembly was then supported by four flexible flange mounted anti-friction bearings.

5. Organisation of Measured Vibration Data

The current integrated multi-sensor and multi-feature data combination approach is concerned with a simplified detection and classification of common rotor-related faults in multiple-speed rotating machines, thereby eliminating the need for separate analysis at individual speeds. On the experimental rig shown in Figure 2, vibration sensors (1 per bearing pedestal) were used to acquire 20 sets of vibration data under 6 distinct machine conditions (see Table 1) at three different speeds 20 Hz (s1), 30 Hz (s2) and 40 Hz (s3) thereby yielding a total of 360 datasets. The first machine condition is the relatively healthy condition and has been referred to as the reference condition (RC). In addition to RC, five faulty conditions (FC1–FC5) were also considered, namely; bent shaft (FC1), shaft misalignment (FC2), loose bearing (FC3), shaft crack (FC4), and rubbing shaft (FC5). Under each of the machine conditions described in Table 1 and for each dataset, the acquired vibrations signals were post-processed using 10,000 Hz sampling frequency; 16,384 number of Fourier transform (FT) data points; 95% overlap; 148 number of averages and 0.6104 Hz frequency resolution. Further details of the experimental rig used for this study can be obtained from an earlier study conducted by Yunusa-Kaltungo et al. [29].
Based on Equations (1)–(4), two pCCB ( B 11 and B 12 ) and two pCCT ( T 111 and T 112 ) features were computed for each of the measured vibration datasets (i.e., primary datasets) at the different machine speeds. The computed features for all datasets at different machine speeds for all machine conditions (e.g., B 11 ( R C , 1 ) , s 1 , B 12 ( R C , 1 ) , s 1 , T 111 ( R C , 1 ) , s 1 , etc.) were then used to create a feature matrix ( M ) of secondary datasets for classification using ANN.
M = [ B 11 ( R C , 1 ) , s 1 B 12 ( R C , 1 ) , s 1 T 111 ( R C , 1 ) , s 1 T 112 ( R C , 1 ) , s 1       B 11 ( R C , 20 ) , s 1 B 12 ( R C , 20 ) , s 1 T 111 ( R C , 20 ) , s 1 T 112 ( R C , 20 ) , s 1 B 11 ( R C , 1 ) , s 2 B 12 ( R C , 1 ) , s 2 T 111 ( R C , 1 ) , s 2 T 112 ( R C , 1 ) , s 2       B 11 ( R C , 20 ) , s 2 B 12 ( R C , 20 ) , s 2 T 111 ( R C , 20 ) , s 2 T 112 ( R C , 20 ) , s 2 B 11 ( R C , 1 ) , s 3 B 12 ( R C , 1 ) , s 3 T 111 ( R C , 1 ) , s 3 T 112 ( R C , 1 ) , s 3       B 11 ( R C , 20 ) , s 3 B 12 ( R C , 20 ) , s 3 T 111 ( R C , 20 ) , s 3 T 112 ( R C , 20 ) , s 3 B 11 ( F C 1 , 1 ) , s 1 B 12 ( F C 1 , 1 ) , s 1 T 111 ( F C 1 , 1 ) , s 1 T 112 ( F C 1 , 1 ) , s 1       B 11 ( F C 1 , 20 ) , s 1 B 12 ( F C 1 , 20 ) , s 1 T 111 ( F C 1 , 20 ) , s 1 T 112 ( F C 1 , 20 ) , s 1 B 11 ( F C 1 , 1 ) , s 2 B 12 ( F C 1 , 1 ) , s 2 T 111 ( F C 1 , 1 ) , s 2 T 112 ( F C 1 , 1 ) , s 2       B 11 ( F C 1 , 20 ) , s 2 B 12 ( F C 1 , 20 ) , s 2 T 111 ( F C 1 , 20 ) , s 2 T 112 ( F C 1 , 20 ) , s 2 B 11 ( F C 1 , 1 ) , s 3 B 12 ( F C 1 , 1 ) , s 3 T 111 ( F C 1 , 1 ) , s 3 T 112 ( F C 1 , 1 ) , s 3       B 11 ( F C 1 , 20 ) , s 3 B 12 ( F C 1 , 20 ) , s 3 T 111 ( F C 1 , 20 ) , s 3 T 112 ( F C 1 , 20 ) , s 3 B 11 ( F C 5 , 1 ) , s 1 B 12 ( F C 5 , 1 ) , s 1 T 111 ( F C 5 , 1 ) , s 1 T 112 ( F C 5 , 1 ) , s 1       B 11 ( F C 5 , 20 ) , s 1 B 12 ( F C 5 , 20 ) , s 1 T 111 ( F C 5 , 20 ) , s 1 T 112 ( F C 5 , 20 ) , s 1 B 11 ( F C 5 , 1 ) , s 2 B 12 ( F C 5 , 1 ) , s 2 T 111 ( F C 5 , 1 ) , s 2 T 112 ( F C 5 , 1 ) , s 2       B 11 ( F C 5 , 20 ) , s 2 B 12 ( F C 5 , 20 ) , s 2 T 111 ( F C 5 , 20 ) , s 2 T 115 ( F C 5 , 20 ) , s 2 B 11 ( F C 5 , 1 ) , s 3 B 12 ( F C 5 , 1 ) , s 3 T 111 ( F C 5 , 1 ) , s 3 T 112 ( F C 5 , 1 ) , s 3       B 11 ( F C 5 , 20 ) , s 3 B 12 ( F C 5 , 20 ) , s 3 T 111 ( F C 5 , 20 ) , s 3 T 112 ( F C 5 , 20 ) , s 3 ]

6. Observations and Discussions

Day-to-day VCM of rotating machines in the industry could be an arduous activity, especially when dealing with critical plant assets. A significant amount of the time and efforts exerted on this crucial activity is sometimes spent on analysing data related to unchanging machine conditions. In order to optimise the existing and commonly used approach to VCM of rotating machines in practice, the current technique performs its ANN-based faults classification in two distinct but related stages. In the first stage, five OAA networks (ANN1–ANN5) were trained between RC and each of the FCs (i.e., ANN1 represents the network between RC and FC1; ANN2 represents the network between RC and FC2, etc.). All five networks operate in parallel to classify the machine as healthy or faulty based on the secondary data. A typical rotating machine is classified as healthy and remains so only if all ANNs return a healthy status else it is classified as faulty. The five ANNs were trained using resilient back-propagation learning algorithm with tan-sigmoid and linear transfer functions for the hidden and output layers respectively. The secondary datasets for each machine condition (i.e., RC and FCs) were divided into three parts; 70% for training, 15% for validation and the remaining 15% for testing.
Table 2 provides details of the parameters considered while implementing the OAA aspect of the diagnosis. Each of the 5 networks (ANN1–ANN5) has four input and two output neurons. In addition to the input and output layers, each network is also associated with one or more hidden layers. For instance, the 4–20–2 shown in Table 2 for ANN1 indicates that the network is associated with one input layer of four neurons, one hidden layer of 20 neurons and one output layer of two neurons. Similarly, the 4–15–10–2 for ANN5 indicates that the network is associated with one input layer of four neurons, two hidden layers of 15 and 10 neurons and a single output layer of two neurons. The sensitivity and specify parameters indicate the ability of the ANN to accurately distinguish between pattern classes. In this case, the minimum sensitivity and specify values are 0.95 and 0.97 respectively. ANN1 and ANN3 achieved 100% classification using one hidden layer due to clear distinctions between the signatures of FC1, FC3 and RC. On the other hand, ANN2, ANN4, and ANN5 required two hidden layers each to achieve very good classification which is expected for more complex patterns.
As earlier stated in Table 1, RC is associated with some residual misalignment due to the impracticability of achieving perfect machine alignment in reality. This inherent residual misalignment therefore generates a certain degree of similarity between the vibration signatures of RC and FC1. Similarly, machine vibration due to misalignment (FC1) and crack (FC4) faults are generally known to excite similar higher order harmonics of the rotating speed(s). Finally, significant amount of wear was observed on the Perspex discs used for simulating FC5. Hence, there was no guarantee that the rub was continuous throughout the duration of FC5 data collection. This therefore implies that primary data collected under no rub condition could be similar to those of RC. In general, this first stage of faults diagnosis is strictly concerned with the overall status (i.e., healthy or faulty) of the monitored rotating machine, regardless of the fault type.
Once the first stage of the algorithm specifies the presence of a fault, further diagnosis to determine the particular fault type is then performed with an AAA network at the second stage. The same learning algorithm and transfer function used for the networks in stage 1 were also used for the AAA network. The secondary datasets were also divided into three parts for training (70%), validation (15%) and testing (15%). However, the level of complexity at this stage is relatively higher since it involves a comparison between all faults classes. Hence the network was characterised by three hidden layers with each of them containing 50 neurons. The percentage fit for training, validation and testing were obtained as 97%, 98% and 94%, respectively. The accuracy of the AAA network classification can be estimated using the receiver operating characteristics (ROC) curve. An ROC curve is a plot of operating locations that indicate likely compromise between true positive rate (sensitivity) and false positive rate (specificity) [71]. The area under the curve (AUC) is a measure of the performance of the classifier. The larger the AUC value of a classifier, the better its performance. Hence, a perfect classifier would be associated with an AUC value of 1. According to Figure 3, the approximate AUC values for FC1–FC5 are 1, 0.999, 0.992, 0.986, and 0.992 respectively. This indicates very good classification performance.

7. On-Site Operation of the Proposed Integrated Fault Detection Algorithm

Let us assume that the routine health monitoring plan for a typical rotating machine such as a wind or steam turbine includes the measurement of rotor vibrations from its bearings at several speeds, based on different loading requirements. The raw vibration data measured form all measurement locations will then undergo appropriate signal conditioning and conversion into a digital form for it to be stored onto the computer, which then forms the primary data. Contrary to the currently dominant industry-based VCM practice of separately analysing the vibration datasets acquired from each bearing at each machine speed which also necessitates the construction of numerous amplitude spectra, the initial stage of the proposed faults diagnosis process automatically combines all such individual spectra to generate a single composite spectrum that adequately provides a representation of the entire dynamic behaviour of the monitored turbine at that speed. The same exercise will then automatically recur at subsequent speeds which lead to the generation of 4 faults diagnosis features at each speed (i.e., B11, B12, T111, and T112). Since the data combination is based on higher order frequency domain data fusion, each of the faults diagnosis parameters (secondary data) generated is associated with amplitude and phase information, thereby increasing the ability of the algorithm to adequately differentiate faults.
The multi-sensor/multi-speed secondary data then passes through several OAA networks for the sole aim of classifying the monitored machine as healthy or faulty. With specific reference to the experimentally simulated example of 6 machine conditions (i.e., five faults and a relatively healthy reference condition) at three separate speeds considered in this paper, this would require five parallel OAA networks. In order to obtain a feedback guaranteeing the operation of such a machine under healthy status, all five OAA networks must simultaneously provide a no-fault feedback; otherwise further diagnosis is then triggered to ascertain the exact kind of machine fault. If a fault status is indicated, an AAA network is then used to determine the exact type of machine fault. It is vital to note that the ability of the algorithm to effectively classify rotating machine conditions significantly hinges on both the quality and quantity of previously available data for training and validation. Despite this, the proposed integrated method is a streamlined and computationally efficient data-driven learning system as it eliminates the multiple sensors and speeds elements associated with most current industry-based rotating machines VCM methods. Another benefit of the proposed algorithm lies in its flexibility especially with regards to permitting the inclusion of new faults diagnosis features or faults. In order to foster better visualisation and understanding, Figure 4 provides a summarised process flowchart for the proposed faults diagnosis algorithm.

8. Conclusions

The availability of rotating machines such as steam and wind turbines is crucial for the sustainability of the energy industry. A significant fraction of the mean-time-to-repair (MTTR) these machines is associated with faults diagnosis. The detection and classification of rotating machine faults using vibration-based condition monitoring (VCM) techniques is well established in practice. However, currently dominant VCM approaches often involve independently analysing numerous measured vibration data at different speeds, which in turn complicates faults diagnosis and delays maintenance decision-making. Pioneering efforts aimed at simplifying fault detection using poly coherent composite spectra features have been solely based on the application of linear classification techniques such as principal components analysis (PCA). While useful observations were recorded from the PCA-based studies, it may not be suitable for accurately classifying all “real-life” machine conditions due to the nonlinearities associated with their measured vibration signals.
The current study focuses on the development of an integrated approach to fault detection using a combination of frequency domain data fusion and artificial neural networks (ANN). Just as performed in earlier studies, the frequency domain data fusion aspect of the algorithm combines measured vibration data from several measurement locations (e.g., bearing pedestals) for different machine speeds. The multi-staged ANN algorithm initially applies a one-against-all (OAA) network to examine the presence of a fault and if none exists, the machine is passed okay to continue running. On the other hand, if the feedback from the first stage of the ANN indicates the presence of a fault, then an all-against-all (AAA) network is used to detect the exact kind of fault so as to recommend the appropriate maintenance action. In an era where academia and industry are constantly searching for cost-effective ways of developing autonomous maintenance strategies, this proposed integrated approach can potentially contribute towards the achievement of such strategies especially owing to its ability to easily accommodate new features and faults.

Author Contributions

K.C.L. was heavily involved with the experimental set-up, data collection and signal processing throughout this study. A.Y.-K. reviewed and edited the article as well as supervised the work conducted while Y.A.S. was involved with the formal analysis, particularly the application of artificial neural networks.

Funding

This research received no external funding.

Acknowledgments

The authors are immensely appreciative of the supervisory contributions offered by Professor Jyoti K. Sinha during this study, especially the experimental and signal processing aspects.

Conflicts of Interest

The authors declare no conflict of interest.

References

  1. Wang, Y.; Deng, C.; Wu, J.; Wang, Y.; Xiong, Y. A corrective maintenance scheme for engineering equipment. Eng. Fail. Anal. 2014, 36, 269–283. [Google Scholar] [CrossRef]
  2. Karabay, S.; Uzman, I. Importance of early detection of maintenance problems in rotating machines in management of plants: Case studies from wire and tyre plants. Eng. Fail. Anal. 2009, 16, 212–224. [Google Scholar] [CrossRef]
  3. Ogaji, S.; Sampath, S.; Singh, R.; Probert, D. Novel approach for improving power-plant availability using advanced engine diagnostics. Appl. Energy 2002, 72, 389–407. [Google Scholar] [CrossRef]
  4. Eti, M.C.; Ogaji, S.O.; Probert, S.D. Development and implementation of preventive-maintenance practices in Nigerian industries. Appl. Energy 2006, 83, 1163–1179. [Google Scholar] [CrossRef] [Green Version]
  5. Haddad, G.; Sandborn, P.A.; Pecht, M.G. Using maintenance options to maximize the benefits of prognostics for wind farms. Wind Energy 2014, 17, 775–791. [Google Scholar] [CrossRef]
  6. Sampath, S.; Ogaji, S.; Singh, R.; Probert, D. Engine-fault diagnostics: An optimisation procedure. Appl. Energy 2002, 73, 47–70. [Google Scholar] [CrossRef]
  7. Yang, W.; Tavner, P.J.; Crabtree, C.J.; Feng, Y.; Qiu, Y. Wind turbine condition monitoring: Technical and commercial challenges. Wind Energy 2014, 17, 673–693. [Google Scholar] [CrossRef] [Green Version]
  8. Siegel, D.; Zhao, W.; Lapira, E.; AbuAli, M.; Lee, J. A comparative study on vibration-based condition monitoring algorithms for wind turbine drive trains. Wind Energy 2014, 17, 695–714. [Google Scholar] [CrossRef]
  9. Jardine, A.K.S.; Lin, D.; Banjevic, D. A review on machinery diagnostics and prognostics implementing condition-based maintenance. Mech. Syst. Signal Process. 2006, 20, 1483–1510. [Google Scholar] [CrossRef]
  10. Lee, J.; Wu, F.; Zhao, W.; Ghaffari, M.; Liao, L.; Siegel, D. Prognostics and health management design for machinery systems-Reviews, methodology and applications. Mech. Syst. Signal Process. 2014, 42, 314–334. [Google Scholar] [CrossRef]
  11. Heng, A.; Zhang, S.; Tan, A.C.C.; Mathew, J. Rotating machinery prognostics: State of the art, challenges and opportunities. Mech. Syst. Signal Process. 2009, 23, 724–739. [Google Scholar] [CrossRef]
  12. Lee, J.; Ni, J.; Djurdjanovic, D.; Qiu, H.; Liao, H. Intelligent prognostics tools and e-maintenance. Comput. Ind. 2006, 57, 476–489. [Google Scholar] [CrossRef]
  13. Yunusa-Kaltungo, A.; Nembhard, A.D.; Sinha, J.K. Experimental observations of rotor orbits analysis in rotating machines. In Proceedings of the 9th IFToMM International Conference on Rotor Dynamics (IFToMM ICORD 2014), Milan, Italy, 22–25 September 2014. [Google Scholar]
  14. Goldman, P.; Muszynska, A. Application of full spectrum to rotating machinery diagnosis. Orbit 1999, 20, 17–21. [Google Scholar]
  15. Patel, T.H.; Darpe, A.K. Experimental investigations on vibration response of misaligned rotors. Mech. Syst. Signal Process. 2009, 23, 2236–2252. [Google Scholar] [CrossRef]
  16. Patel, T.H.; Darpe, A.K. Vibration response of misaligned rotors. J. Sound Vib. 2009, 325, 609–628. [Google Scholar] [CrossRef]
  17. Fengqi, W.; Meng, G. Compound rub malfunctions feature extraction based on full-spectrum cascade analysis and SVM. Mech. Syst. Signal Process. 2006, 20, 2007–2021. [Google Scholar] [CrossRef]
  18. Collis, W.B.; White, P.R.; Hammond, J.K. Higher-order spectra: The bispectrum and trispectrum. Mech. Syst. Signal Process. 1998, 12, 375–394. [Google Scholar] [CrossRef]
  19. Fackrell, J.W.A.; White, P.R.; Hammond, J.K.; Pinnington, R.J.; Parsons, A.T. The interpretation of the bispectra of vibration signals-II: Experimental results and applications. Mech. Syst. Signal Process. 1995, 9, 267–274. [Google Scholar] [CrossRef]
  20. Yunusa-Kaltungo, A.; Sinha, J.K. Combined bispectrum and trispectrum for faults diagnosis in rotating machines. Proc. Inst. Mech. Eng. Part O J. Risk Reliab. 2014, 228, 419–428. [Google Scholar] [CrossRef]
  21. Sinha, J.K. Higher order spectra for crack and misalignment identification in the shaft of a rotating machine. Struct. Health Monit. 2007, 6, 325–334. [Google Scholar] [CrossRef]
  22. Yunusa-Kaltungo, A.; Sinha, J.K. A comparison of signal processing tools: Higher order spectra versus higher order coherences. J. Vib. Eng. Technol. 2015, 3, 461–472. [Google Scholar]
  23. McCormick, A.C.; Nandi, A.K. Classification of rotating machine condition using artificial neural networks. Proc. Inst. Mech. Eng. Part C 1997, 211, 439–450. [Google Scholar] [CrossRef] [Green Version]
  24. McCormick, A.C.; Nandi, A.K. Real-time classification of rotating shaft loading conditions using artificial neural networks. IEEE Trans. Neural Netw. 1997, 8, 748–756. [Google Scholar] [CrossRef] [PubMed] [Green Version]
  25. Samanta, B. Gear fault detection using artificial neural networks and support vector machines with generic algorithms. Mech. Syst. Signal Process. 2004, 18, 625–644. [Google Scholar] [CrossRef]
  26. Burges, C.J.C. A tutorial on support vector machines for pattern recognition. Data Min. Knowl. Discov. 1998, 2, 121–167. [Google Scholar] [CrossRef]
  27. Yuan, S.F.; Chu, F.L. Support vector machines-based faults diagnosis for turbo-pump rotor. Mech. Syst. Signal Process. 2006, 20, 939–952. [Google Scholar] [CrossRef]
  28. Yang, J.; Zhang, Y.; Zhu, Y. Intelligent faults diagnosis of rolling element bearing based on SVMs and fractal dimension. Mech. Syst. Signal Process. 2007, 21, 2012–2024. [Google Scholar] [CrossRef]
  29. Yunusa-Kaltungo, A.; Sinha, J.K.; Nembhard, A.D. A novel faults diagnosis technique for enhancing maintenance and reliability of rotating machines. Struct. Health Monit. 2015, 14, 604–621. [Google Scholar] [CrossRef] [Green Version]
  30. Wasserman, P.D. Neural Computing: Theory and Practice; Van Nostrand Reinhold Co.: New York, NY, USA, 1989. [Google Scholar]
  31. Mandic, D.P.; Chambers, J. Recurrent Neural Networks for Prediction: Learning Algorithms, Architectures and Stability; John Wiley & Sons, Inc.: Hoboken, NJ, USA, 2001. [Google Scholar]
  32. Peng, Y.; Qiao, W.; Qu, L.; Wang, J. Gearbox fault diagnosis using vibration and current information fusion. In Proceedings of the 2016 IEEE Energy Conversion Congress and Exposition (ECCE), Milwaukee, WI, USA, 18–22 September 2016; pp. 1–6. [Google Scholar]
  33. Cheng, F.; Peng, Y.; Qu, L.; Qiao, W. Current-based fault detection and identification for wind turbine drivetrain gearboxes. IEEE Trans. Ind. Appl. 2017, 53, 878–887. [Google Scholar] [CrossRef]
  34. Yang, B. Thermographic detection of fatigue damage of reactor pressure vessel (RPV) steels. J. Mater. Eng. Perform. 2003, 12, 345–353. [Google Scholar] [CrossRef]
  35. Avdelidis, N.P.; Almond, D.P. Transient thermography as a through skin imaging technique for aircraft assembly: Modelling and experimental results. Infrared Phys. Technol. 2004, 45, 103–114. [Google Scholar] [CrossRef]
  36. Moreton, G.; Yardley, E.D. The use of wear debris analysis to monitor gear transmissions underground. Condit. Monit. 1984, 84, 491–502. [Google Scholar]
  37. Peng, Z.; Kirk, T.B. Computer image analysis of wear particles in three-dimensions for machine condition monitoring. Wear 1998, 223, 157–166. [Google Scholar] [CrossRef]
  38. Hameed, Z.; Hong, Y.S.; Cho, Y.M.; Ahn, S.H.; Song, C.K. Condition monitoring and fault detection of wind turbines and related algorithms: A review. Renew. Sustain. Energy Rev. 2009, 13, 1–39. [Google Scholar] [CrossRef]
  39. Amirat, Y.; Benbouzid, M.E.H.; Al-Ahmar, E.; Bensaker, B.; Turri, S. A brief status on condition monitoring and fault diagnosis in wind energy conversion systems. Renew. Sustain. Energy Rev. 2009, 13, 2629–2636. [Google Scholar] [CrossRef] [Green Version]
  40. García Márquez, F.P.; Tobias, A.M.; Pinar Pérez, J.M.; Papaelias, M. Condition monitoring of wind turbines: Techniques and methods. Renew. Sustain. Energy Rev. 2012, 46, 169–178. [Google Scholar] [CrossRef]
  41. Hameed, Z.; Ahn, S.H.; Cho, Y.M. Practical aspects of a condition monitoring system for a wind turbine with emphasis on its design, system architecture, testing and installation. Renew. Sustain. Energy Rev. 2010, 35, 879–894. [Google Scholar] [CrossRef]
  42. Witty, A. New strategies for innovation in global health: A pharmaceutical industry perspective. Health Aff. 2011, 30, 118–126. [Google Scholar] [CrossRef] [PubMed] [Green Version]
  43. Hall, D.L.; Llinas, J. An introduction to multisensor data fusion. Proc. IEEE 1997, 85, 6–23. [Google Scholar] [CrossRef]
  44. Dempsey, P.J.; Sheng, S. Investigation of data fusion applied to health monitoring of wind turbine drivetrain components. Wind Energy 2013, 16, 479–489. [Google Scholar] [CrossRef] [Green Version]
  45. Liu, Q.C.; Wang, H.P. A case study on multisensor data fusion for imbalance diagnosis of rotating machinery. AI EDAM 2001, 15, 203–210. [Google Scholar] [CrossRef]
  46. Basir, O.; Yuan, X. Engine fault diagnosis based on multi-sensor information fusion using Dempster-Shafer evidence theory. Inf. Fusion 2007, 8, 379–386. [Google Scholar] [CrossRef]
  47. Niu, G.; Han, T.; Yang, B.S.; Tan, A.C.C. Multi-agent decision fusion for motor fault diagnosis. Mech. Syst. Signal Process. 2007, 21, 1285–1299. [Google Scholar] [CrossRef] [Green Version]
  48. Zhang, J. Improved on-line process fault diagnosis through information fusion in multiple neural networks. Comput. Chem. Eng. 2006, 30, 558–571. [Google Scholar] [CrossRef]
  49. Boutros, T.; Liang, M. Mechanical fault detection using fuzzy index fusion. Int. J. Mach. Tools Manuf. 2007, 47, 1702–1714. [Google Scholar] [CrossRef]
  50. Niu, G.; Yang, B.S.; Pecht, M. Development of an optimized condition-based maintenance system by data fusion and reliability-centered maintenance. Reliab. Eng. Syst. Saf. 2010, 95, 786–796. [Google Scholar] [CrossRef]
  51. Yunusa-Kaltungo, A.; Sinha, J.K. Generic vibration-based faults identification approach for identical rotating machines installed on different foundations, VIRM 11-Vibrations in Rotating. Machinery 2016, 11, 499–510. [Google Scholar]
  52. Yunusa-Kaltungo, A.; Sinha, J.K. Sensitivity analysis of higher order coherent spectra in machine faults diagnosis. Struct. Health Monit. 2016, 15, 555–567. [Google Scholar] [CrossRef]
  53. Suryam, B.C.B.N.; Meher, K.K.; Sinha, J.K.; Rao, A.R. Coherence measurement for early contact detection between two components. J. Sound Vib. 2006, 290, 519–523. [Google Scholar] [CrossRef]
  54. Khan, Z.H.; Mohapatra, S.K.; Khodiar, P.K.; Ragu, K.S. Artificial neural network and medicine. Indian J. Physiol. Pharmacol. 1998, 42, 321–342. [Google Scholar] [PubMed]
  55. Amato, F.; López, A.; Peña-Méndez, E.M.; Vaňhara, P.; Hampl, A.; Havel, J. Artificial neural networks in medical diagnosis. J. Appl. Biomed. 2013, 11, 47–58. [Google Scholar] [CrossRef]
  56. Hashemi, A.; Pilevar, A.H.; Rafeh, R. Mass Detection in Lung CT Images Using Region Growing Segmentation and Decision Making Based on Fuzzy Inference System and Artificial Neural Network. Int. J. Image Gr. Signal Process. 2013, 5, 16. [Google Scholar] [CrossRef]
  57. Matulewicz, L.; Jansen, J.F.; Bokacheva, L.; Vargas, H.A.; Akin, O.; Fine, S.W.; Shukla-Dave, A.; Eastham, J.A.; Hricak, H.; Koutcher, J.A.; et al. Anatomic segmentation improves prostate cancer detection with artificial neural networks analysis of 1H magnetic resonance spectroscopic imaging. J. Magn. Reson. Imaging 2014, 40, 1414–1421. [Google Scholar] [CrossRef] [PubMed]
  58. Karaboga, D.; Gorkemli, B.; Ozturk, C.; Karaboga, N. A comprehensive survey: Artificial bee colony (ABC) algorithm and applications. Artif. Intell. Rev. 2014, 42, 21–57. [Google Scholar] [CrossRef]
  59. Ghiassi, M.; Skinner, J.; Zimbra, D. Twitter brand sentiment analysis: A hybrid system using n-gram analysis and dynamic artificial neural network. Expert Syst. Appl. 2013, 40, 6266–6282. [Google Scholar] [CrossRef]
  60. Yadav, A.K.; Malik, H.; Chandel, S.S. Selection of most relevant input parameters using WEKA for artificial neural network based solar radiation prediction models. Renew. Sustain. Energy Rev. 2014, 31, 509–519. [Google Scholar] [CrossRef]
  61. Yadav, A.K.; Chandel, S.S. Solar radiation prediction using Artificial Neural Network techniques: A review. Renew. Sustain. Energy Rev. 2014, 33, 772–781. [Google Scholar] [CrossRef]
  62. Conforti, M.; Pascale, S.; Robustelli, G.; Sdao, F. Evaluation of prediction capability of the artificial neural networks for mapping landslide susceptibility in the Turbolo River catchment (northern Calabria, Italy). Catena 2014, 113, 236–250. [Google Scholar] [CrossRef]
  63. Park, S.; Choi, C.; Kim, B.; Kim, J. Landslide susceptibility mapping using frequency ratio, analytic hierarchy process, logistic regression, and artificial neural network methods at the Inje area, Korea. Environ. Earth Sci. 2013, 68, 1443–1464. [Google Scholar] [CrossRef]
  64. Samanta, B.; Al-Balushi, K.R. Artificial neural network based fault diagnostics of rolling element bearings using time-domain features. Mech. Syst. Signal Process. 2003, 17, 317–328. [Google Scholar] [CrossRef]
  65. Saridakis, K.M.; Nikolakopoulos, P.G.; Papadopoulos, C.A.; Dentsoras, A.J. Identification of wear and misalignment on journal bearings using artificial neural networks. Proc. Inst. Mech. Eng. Part J J. Eng. Tribol. 2012, 226, 46–56. [Google Scholar] [CrossRef]
  66. Saravanan, N.; Siddabattuni, V.K.; Ramachandran, K.I. Fault diagnosis of spur bevel gear box using artificial neural network (ANN), and proximal support vector machine (PSVM). Appl. Soft Comput. 2010, 10, 344–360. [Google Scholar] [CrossRef]
  67. Sanz, J.; Perera, R.; Huerta, C. Fault diagnosis of rotating machinery based on auto-associative neural networks and wavelet transforms. J. Sound Vib. 2007, 302, 981–999. [Google Scholar] [CrossRef]
  68. Rafiee, J.; Arvani, F.; Harifi, A.; Sadeghi, M.H. Intelligent condition monitoring of a gearbox using artificial neural network. Mech. Syst. Signal Process. 2007, 21, 1746–1754. [Google Scholar] [CrossRef]
  69. Srinivas, H.K.; Srinivasan, K.S.; Umesh, K.N. Role of an artificial neural network and a wavelet transform for condition monitoring of the combined faults of unbalance and cracked rotors. Int. J. Acoust. Vib. 2010, 15, 121. [Google Scholar] [CrossRef]
  70. Walker, R.B.; Vayanat, R.; Perinpanayagam, S.; Jennions, I.K. Unbalance localization through machine nonlinearities using an artificial neural network approach. Mech. Mach. Theory 2014, 75, 54–66. [Google Scholar] [CrossRef]
  71. Woods, K.; Bowyer, K.W. Generating ROC curves for artificial neural networks. IEEE Trans. Med. Imaging 1997, 16, 329–337. [Google Scholar] [CrossRef] [PubMed]
Figure 1. A schematic representation of the integrated data combination approach.
Machines 06 00059 g001
Figure 2. Experimental assembly (a) machine conditions (b) multiple speed rig (c) signal conditioning, PC, data acquisition system and motor speed controller.
Machines 06 00059 g002
Figure 3. ROC plot for the AAA network.
Machines 06 00059 g003
Figure 4. Proposed fault diagnosis algorithm flowchart.
Machines 06 00059 g004
Table 1. Experimentally simulated machine conditions.
Machine ConditionAbbreviationSeverity and Location
Healthy with residual misalignmentRCPossible residual misalignment at couplings
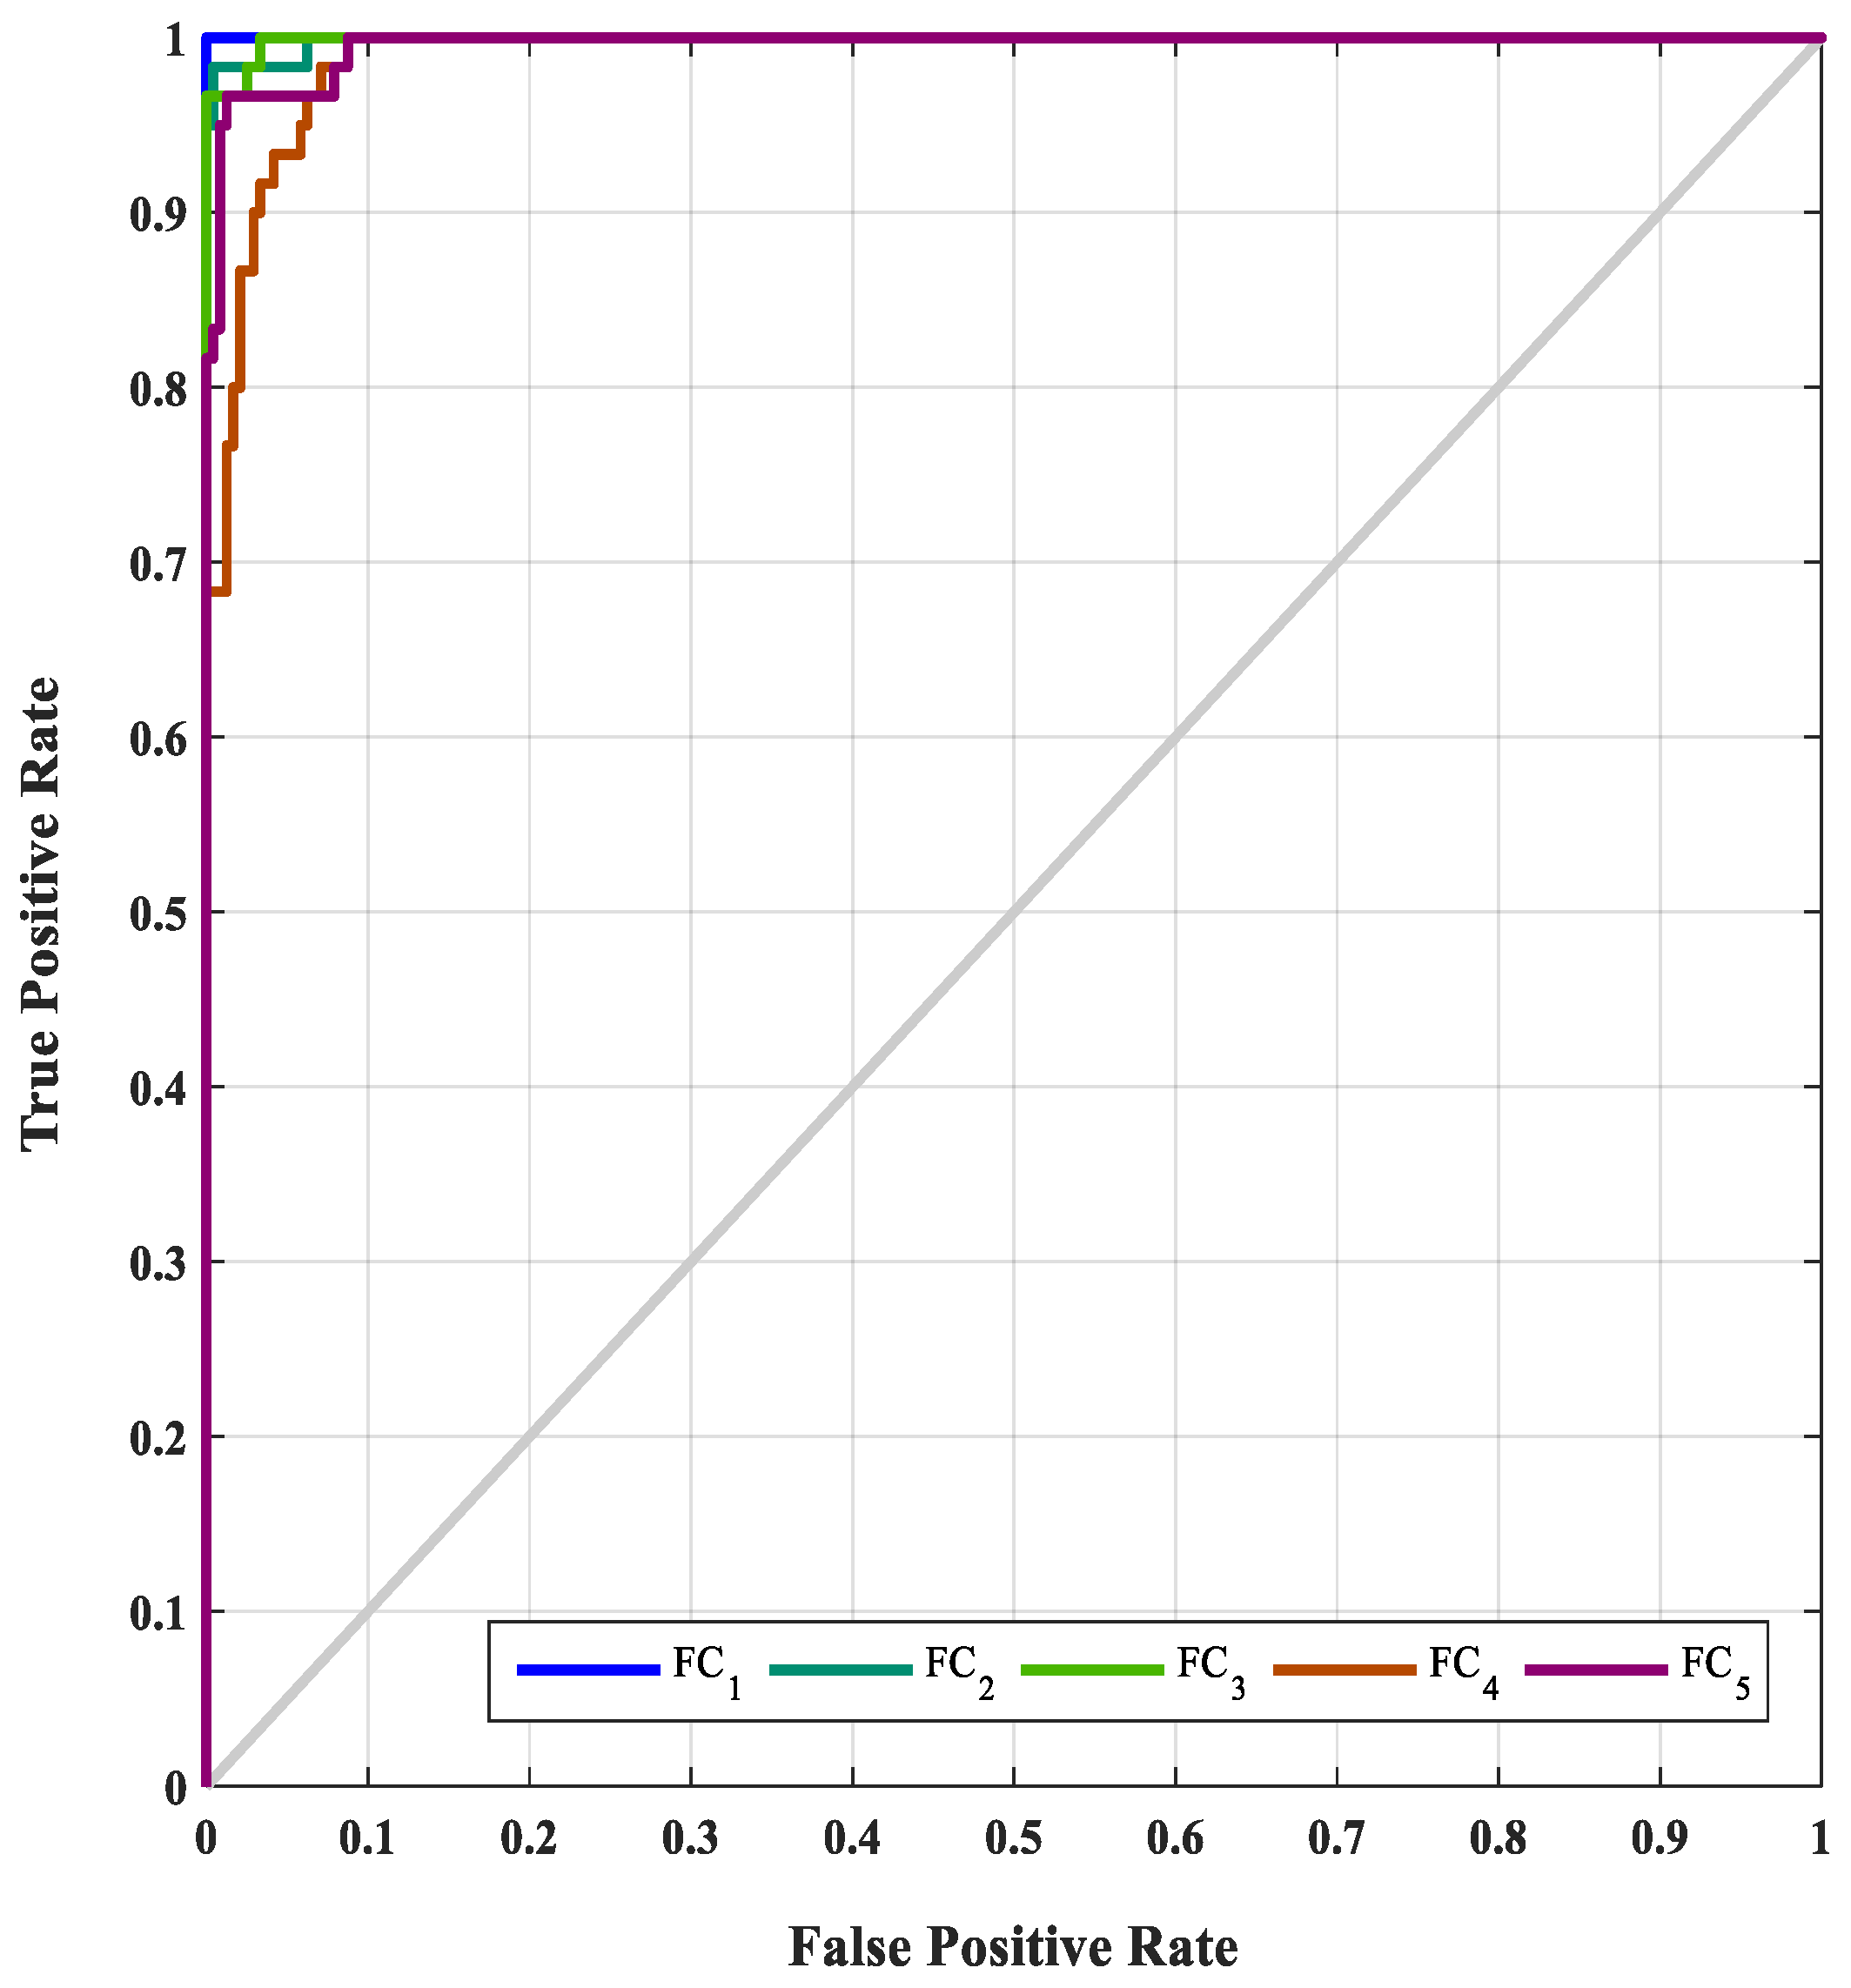
Bent shaftFC13.4 mm run-out was created at the centre of the 1000 mm long shaft
Shaft misalignmentFC20.4 mm mild steel shim beneath both sides of bearing 1 pedestal
Loose bearingFC3Loose bearing 3 threaded bar nuts
Cracked shaftFC44 mm (depth) × 0.25 mm (width) breathing crack on the 1000 mm long shaft, at 160 mm from bearing 1 (i.e., near electric motor)
Rubbing shaftFC5Partial rub using 2 Perspex blades (top and bottom dead centres of the 1000 mm shaft), at 275 mm from bearing 1 (i.e., near electric motor)
Table 2. ANN properties for OAA ANNs trained.
ParametersProperties
ANN1ANN2ANN3ANN4ANN5
Network Structure4–20–24–15–15–24–20–24–60–60–24–15–10–2
Fit (%)Training10099.610099.7100
Validation10099.410099.7100
Testing10099.41009994.4
Sensitivity10.9510.970.98
Specify1110.971

